
Abstract
The in vitro evaluation of hepatotoxicity is an essential stage in the research and development of new pharmaceuticals as the liver is one of the most commonly impacted organs during preclinical toxicity studies. Fresh primary hepatocytes in monolayer culture are the most commonly used in vitro model of the liver but often exhibit limited viability and/or reduction or loss of important liver-specific functions. These limitations could potentially be overcome using three-dimensional (3D) culture systems, but their experimental nature and limited use in liver toxicity screening and drug metabolism has impaired their uptake into commercial screening programs. In this study we use a commercially available polystyrene scaffold developed for routine 3D cell culture to maintain primary rat hepatocytes for use in metabolism and toxicity studies over 72 h. We show that primary hepatocytes retain their natural cuboidal morphology with significantly higher viability (>74%) than cells grown in monolayer culture (maximum of 57%). Hepatocytes in the 3D scaffolds exhibit differential expression of genes associated with phase I, II, and III drug metabolism under basal conditions compared with monolayer culture and can be induced to stably express significantly higher levels of the cytochrome-P450 enzymes 1A2, 2B1, and 3A2 over 48 h. In toxicity studies the hepatocytes in the 3D scaffolds also show increased sensitivity to the model toxicant acetaminophen. These improvements over monolayer culture and the availability of this new easy to use 3D scaffold system could facilitate the uptake of 3D technologies into routine drug screening programs.
Introduction
Of the current liver models, fresh primary hepatocytes are considered the gold standard for studying drug metabolism in vitro. These cells are conventionally maintained for analysis in culture as a monolayer within an assay plate. This culture process allows the cells to maintain a suitable viability over 2–3 days with measurable expression of the phase I metabolizing enzymes cytochrome-P450 (CYP). 2 However, during the culture process the primary hepatocytes undergo a series of changes, losing their cuboidal morphology as they flatten and spread out on the cell culture surface. These morphological changes are also accompanied by a reduction in the expression of several CYP enzymes and a loss of response to well-known inducers of these enzymes. 2 Some of these changes can be overcome by maintaining primary hepatocytes in sandwich culture between two layers of the extracellular matrix (ECM) protein collagen. 3 This culture system goes part way to allowing the cells to retain a morphology and polarity similar to that found in vivo, 4 while also enabling the cells to maintain relatively stable, though lower, expression of CYP enzymes 5 –7 and a liver-specific gene expression profile. 8 –10 However, sandwich culture is not without its limitations. To access the hepatocytes to perform metabolic assays, the collagen usually has to be enzymatically digested, which can affect cell behavior. The mass transfer barrier induced by the top gelled collagen layer means that test drug compound must be able to permeate the ECM to elicit an effect on the cells; therefore, the physiochemical properties of the test drugs can influence the in vitro assay. 11 In addition, the topology of the overlaying ECM can affect the physiological responsiveness and function of the cells. 4 These and other factors introduce further variability and technical complexity when using the sandwich culture method.
Some of the intrinsic limitations of primary hepatocytes maintained in standard monolayer culture could potentially be overcome through the use of three-dimensional (3D) cell culture systems. These systems, which are designed to provide the cells with a more in vivo-like environment, have been successfully used to improve models associated with some aspects of drug discovery and transport studies. 12 –14 However, their use in liver toxicity screening and drug metabolism has been limited. As shown in Table 1 the majority of 3D models developed for use with primary hepatocytes and that have examined the expression of liver markers are mostly based on collagen encapsulation (Table 1, Nos. 1, 5, 7, and 10), 15 –18 the formation of 3D cell aggregates (Table 1, Nos. 2, 8, and 9), 19 –21 or a combination of both (Table 1, No. 12). 22 These systems are prone to the same mass transfer problems associated with sandwich culture due to either the surrounding ECM or the ability of compounds to reach the cells in the centre of spheroids. The 3D systems that combine collagen encapsulation within hollow fibers (Table 1, Nos. 1 and 7) 15,17 are also potentially limited by the fibers adsorbing hydrophobic drugs. In addition, cells that die within the encapsulated or spheroid cultures remain trapped within the system and can impact the behavior of surrounding cells. The 3D systems based on novel membranes or nanofibrous scaffolds (Table 1, Nos. 3, 4, 6, and 11) 23 –26 could offer benefits over the collagen encapsulation or spheroid cultures due to improved mass transfer of nutrients, but their application for liver toxicity screening and drug metabolism has yet to be demonstrated. It is interesting to note that each of the 3D systems in Table 1 demonstrate a more liver-like phenotype in the cells through increased expression of markers such as albumin and urea, but only two of the studies actually report an increase in CYP enzyme activity. Stable expression of CYP enzymes is essential in models for drug metabolism studies, so a lack of CYP data in these reports could highlight potential shortcoming in these systems. Further, only four of the reports actually show toxicity data using model compounds.
Previous Studies Using Primary Hepatocytes in Three-Dimensional Cell Culture Systems
3D, three-dimensional.
Despite the fact that 3D cell-based models have the potential to provide more physiologically relevant in vitro data, we are still far from a real strategic commercial application of these new 3D technologies in the drug discovery and safety assessment fields. This is in part due to the experimental nature of most 3D cell models and that very few if any of the technologies featured in Table 1 are readily available as manufactured quality controlled products. To address these issues this study investigates the use of a new commercially available polystyrene scaffold, Alvetex®, to maintain primary rat hepatocytes for use in metabolism and toxicity studies over 72 h. These 3D scaffolds have the same chemistry as standard cell culture plates allowing a direct comparison between the 3D system and monolayer culture as well as the transfer of established cell culture and assay methods. We show that maintaining cells in Alvetex scaffolds allows them to retain a 3D morphology similar to hepatocytes in vivo and that this has a significant affect on sustaining cell viability. Using quantitative real time (qRT)-polymerase chain reaction (PCR) we show that cells maintained in the 3D scaffold have distinct gene expression patterns under basal condition for markers associated with phase I, II, and III compound metabolism and that there is a significant upregulation of key CYP genes in response to treatment with the model hepatotoxicant acetaminophen (APAP). Importantly, we show that cells maintained in the 3D culture system have significantly higher stable expression of CYP enzymes and that this increased expression changes the way the cells respond to toxic compounds. Taken together the results of this study show how a new commercially available 3D system can combine the phenotypic advantages of sandwich culture with the convenience and ease of use of monolayer culture, advantages that could facilitate the uptake of 3D technologies for routine use in existing drug-screening programs.
Materials and Methods
Cells and Materials
Primary rat hepatocytes were supplied by Abcellute Ltd. L-15 medium, HEPES, viability/cytotoxicity kit for mammalian cells, and PBS were supplied by Invitrogen. Gentamicin, dicumarol, d-glucose, dexamethasone, insulin, dimethyl sulfoxide (DMSO), and methylthiazolyldiphenyl-tetrazolium bromide (MTT) were supplied by Sigma. Fetal calf serum and Hank's balanced salt solution (HBSS) were supplied by PAA Laboratories and Lonza, respectively. Resorufin and 7-ethoxyresorufin were supplied by Ultrafine Chemicals, collagen type I solution by BD Bioscience, and 3-methylcholanthrene by Supelco.
Preparation of Alvetex Polystyrene Scaffolds
The preparation and fabrication of 200-μm-thick polystyrene scaffolds (Alvetex) was performed as described previously. 27 The scaffolds were placed into 12-well cell culture plates and sterilized using 70% ethanol (v/v), followed by two washes with sterile phosphate buffered saline. Before use, the scaffolds were coated overnight with 0.5 mL of collagen (0.8 mg/mL) in PBS. The collagen-coated scaffolds were washed with sterile PBS before the addition of cells.
Cell Culture
Fresh primary rat hepatocytes were reactivated according to supplier's protocol. After reactivation, primary rat hepatocytes were seeded at a density of 3.2×10⁵ cells per well (unless otherwise stated), on the polystyrene scaffolds or in collagen-coated 12-well plates (BD Bioscience). The cells were cultured in L-15 medium containing 25 mM HEPES, 8.4 mM d-glucose, 0.2 USP units insulin/mL, 1 μM dexamethasone, and 50 μg gentamicin/mL (L-15 growth medium) supplemented with 10% fetal calf serum in a humidified atmosphere at 37°C.
Viability and Morphological Analysis
Collagen-coated scaffolds were seeded with primary hepatocytes to a final density of 8, 32, or 64×104 cells per scaffold. The cells were maintained in culture for 24 h at 37°C after which time the medium was removed and 1 mL HBSS containing 0.4 mM calcein-AM and 0.2 mM ethidium homodimer-1 was added. After 45 min of incubation at 37°C in a humidified atmosphere, the cells were rinsed twice with HBSS and covered with 1 mL HBSS in preparation for imaging. Control samples used primary hepatocytes seeded onto collagen-coated 12-well cell culture plates without scaffolds. Samples were imaged using a Nikon EC-1 laser scanning confocal microscope at 488 nm excitation (Calcein) and 568 nm excitation (Ethidium homodimer-1) and image processing performed using Matlab (The MathWorks). For pixel-by-pixel fluorescence quantification a 2D intensity histogram with axes representing live versus dead cells was created with manual thresholding used to gate live, dead, and dying cells. For 3D image reconstruction a set of transparent iso-surfaces were applied to the 3D Z-stacks to delimitate cell boundaries.
Measurement of the CYP Enzyme Activity
Collagen-coated scaffolds were seeded with primary hepatocytes to a final density of 3.2×10⁵ cells per scaffold. The cells were allowed to settle and adhere to the scaffold for 24 h at 37°C after which the cells were exposed for 24 h to L-15 induction medium containing either 1 μM 3-methylcholanthrene (for EROD assay) or a cocktail of 10 μM rifampicin, 10 μM dexamethasone, and 5 μM β-naphtaflavone (for testosterone assay) or to control medium containing 0.2% DMSO. After CYP induction (48 h postseeding) samples for analysis had their medium removed, were rinsed once in HBSS, and exposed to 1 mL of HBSS containing either 20 μM 7-ethoxyresorufin and 40 μM dicumarol (EROD Assay) or 150 μM testosterone and 25 mM HEPES (testosterone assay). Samples for analysis after 72 h had their induction medium replaced. Control samples used primary hepatocytes seeded onto collagen-coated 12-well cell culture plates without scaffolds at a final density of 3.2×10⁵ cells per well.
For the EROD assay the cell-seeded scaffold and control samples were placed in an M200 Infinite Plate Reader (Tecan Ltd.) plate reader at 37°C. The dealkylation of 7-ethoxyresorufin to fluorescent resorufin was measured every 5 min for 30 min at 530 nm excitation and 585 nm emission. After 30 min the scaffold samples were placed into 1.5 mL tubes containing 1 mL of CelLytic-M (Sigma) and total cell protein measured using the BCA assay (Thermo Scientific) according to manufacturer's protocol. Resorufin production (nmol) was quantified against a standard curve of commercially available resorufin and enzyme activity (CYP1A2) linked to total cell protein.
For the testosterone assays the cell-seeded scaffold and control samples were incubated for 1 h at 37°C. After the incubation the medium was removed and placed into 1.5 mL tubes. Metabolites of testosterone relating to CYP2B1 (16α-OH-testosterone) and CYP3A2 (6β-OH-testosterone) were measured by LC-MS. Briefly, liquid chromatography separation of the testosterone metabolites was performed using a Luna Phenyl Hexyl column. Samples were eluted at a flow rate of 0.2 mL/min using a mobile phase containing 0.1% formic acid and a gradient of acetonitrile as follows: 20% for 3 min, 80% for 6 min, 100% for 6 min, and finally 20% for 6 min. Samples were introduced to a Vantage triple-quad mass spectrometer (Thermo Scientific) using electrospray ionization in positive mode at a voltage of 3.5 kV for 16 min followed by negative electrospray at a voltage of 3.0 kV 18 min. Metbolite production was quantified using standard curves of 6β-OH-testosterone or 16α-OH-testosterone and enzyme activity linked to total cell protein (Table 2).
CYP Enzyme Activity Measurements
Step Notes
1. 22-mm polystyrene scaffold in untreated sterile 12-well microtiter plate
2. Fresh primary rat hepatocytes reactivated and added to the scaffold in L-15 media containing 10% FCS
3. Induction media added to triplicate samples, noninduced controls had control L-15 media containing 10% FCS replaced
4. Half of samples incubated for 24 h then prepared for CYP activity measurements, remaining samples had induction media (or control media) replaced and incubated for further 24 h
5. Samples washed 2 mL of 37°C HBSS before addition of induction media. CYP substrate added directly to the cells on the scaffolds in HBSS
6. CYP1A2 measured using fluorescent at 530 nm excitation and 585 nm emission, samples placed directly into plate reader at 37°C and fluorescent intensity measured every 5 min. CYP2B1 and CYP3A2 activity measured though LC/MS analysis of testosterone metabolites
Cytotoxicity Measurements
Collagen-coated scaffolds and control collagen-coated 12-well culture plates were seeded with primary hepatocytes as described above and incubated for 24 h at 37°C. After this incubation the culture medium was removed and the cells were exposed for 24 h to APAP 1% DMSO at concentrations ranging from 0 to 40 mM in L-15 growth medium without serum. Cell viability was measured using the MTT assay (Sigma) according to manufacturer's instructions with absorbance measured at 570 nm and background absorbance at 690 nm deducted.
APAP Exposure for Gene Expression Analysis
Collagen-coated scaffolds and control collagen-coated 12-well culture plates were seeded with primary hepatocytes as described above. Sixteen hours after seeding the culture medium was removed and the cells were exposed to 0.4 mM APAP, 4.0 mM APAP, or 0.5% DMSO vehicle control in L-15 growth medium without serum for 24 h. Six biological repeats were used for each condition.
RNA Isolation and cDNA Synthesis
Total RNA was isolated and purified using the RiboPure™ Kit (Ambion), according to the manufacturer's instructions. RNA quantity was determined spectrophotometrically by NanoDrop 1000 (Thermo Scientific) and RNA integrity number (RIN) determined using the Agilent 2100 Bioanalyzer (Agilent Technologies). cDNA was prepared with the High Capacity cDNA Reverse Transcription Kit (Applied Biosystems) according to the manufacturer's instructions, using 450 ng total RNA per 20 μL reaction and incubation conditions of 25°C for 10 min followed by 37°C for 120 min and 85°C for 5 s. cDNA was diluted to 10 ng/μl and stored at −20°C.
Quantitative Real-Time PCR
Unless otherwise stated, all quantitative real-time PCRs were performed using reagents from Applied Biosystems. PCRs were prepared using TaqMan® Universal PCR Master Mix with the cDNA equivalent of 5 ng RNA/10 μL reaction. TaqMan Gene Expression Assays that spanned intron–exon boundaries were used to avoid amplification of any contaminating genomic DNA, the exceptions being α-tubulin, 18S, CYP2B3, and CYP3A2. See Table 1 for further details. Quantitative PCR was performed on the ABI PRISM® 7900HT Sequence Detection System under the following conditions: 50°C for 2 min and 95°C for 10 min, followed by 40 cycles of 95°C for 15 s and 60°C for 60 s. To verify that the assays were specific for mRNA, real-time PCRs were also performed using the products of RT reactions with no reverse transcriptase present (RT-minus control), using a proportion of RT product equivalent to 5 ng RNA template in the real-time PCR (Table 3).
Gene Expression Measurements
Step Notes
1. 22-mm polystyrene scaffold in untreated sterile 12-well microtiter plate
2. Fresh primary rat hepatocytes reactivated and added to the scaffold in L-15 media containing 10% FCS
3. Cells allowed to recover from the isolation process and adhere to the scaffold for 24 h at 37°C, 5% CO2
4. Cells exposed to APAP or vehicle control for 24 h at 37°C, 5% CO2 in L-15 without serum
5. APAP solution removed and RNA extracted from the cells in the scaffold by direct lysis, RNA quantity determined spectrophotometrically, and RNA integrity (RIN) determined
6. cDNA synthesised using High capacity RT Kit with incubation at 25°C for 10 min followed by 37°C for 120 min and 85°C for 5 s.
7. 10 ng RNA equivalent based on input to cDNA synthesis reaction using ABI7900HT Real-time PCR system. RT and NTC controls were used for each assay. Reference genes were included on each 384-well plate for normalization of genes of interest.
Gene Expression Calculations and Statistical Analysis
Reference gene stability was determined using a combination of analysis of variance and geNorm analysis, and the two most stable genes were chosen. Relative gene expression levels were calculated according the PCR efficiency-corrected method and normalized to the geometric mean [ 2 √(CT gene1×CT gene2)] of the reference genes. For each TaqMan Gene Expression Assay PCR efficiency was calculated using a dilution series starting from 25 ng per reaction followed by a 4-log dilution series from 5 ng. PCR was efficiency calculated according to the equation E=10−1/S, where S represents the slope when CT is plotted against log10 ng template. Expression was calculated relative to the 2D DMSO sample and expressed as the mean of the biological repeats±SEM.
For statistical analysis data were expressed as arbitrary units according to the equation: units=10(CT−intercept)/slope, where CT is the sample CT, and the intercept and slope are those obtained for the assay efficiency plot. Target gene expression quantities were normalized to reference gene expression as above. Statistical analysis of target gene expression was performed using R software version 2.9.2 (
Results
Hepatocyte Morphology and Viability
Examination of the shape and form of rat primary hepatocytes grown on either conventional 2D polystyrene culture plates or Alvetex 3D polystyrene scaffolds was performed using confocal microscopy and 3D image reconstruction. Cells maintained in monolayer culture adopt the characteristic flattened morphology (Fig. 1A, B), which is typical of cells grown on a flat surface, with an average cell width of 46.7 μm (±9.2 μm) and cell height of 7.3 μm (±4.2 μm). In comparison, cells maintained in the polystyrene scaffolds (Fig. 1C, D) retained a more in vivo-like cuboidal morphology with an average width of 14.7 μm (±4.1 μm) and cell height of 23.3 μm (±8.1 μm).
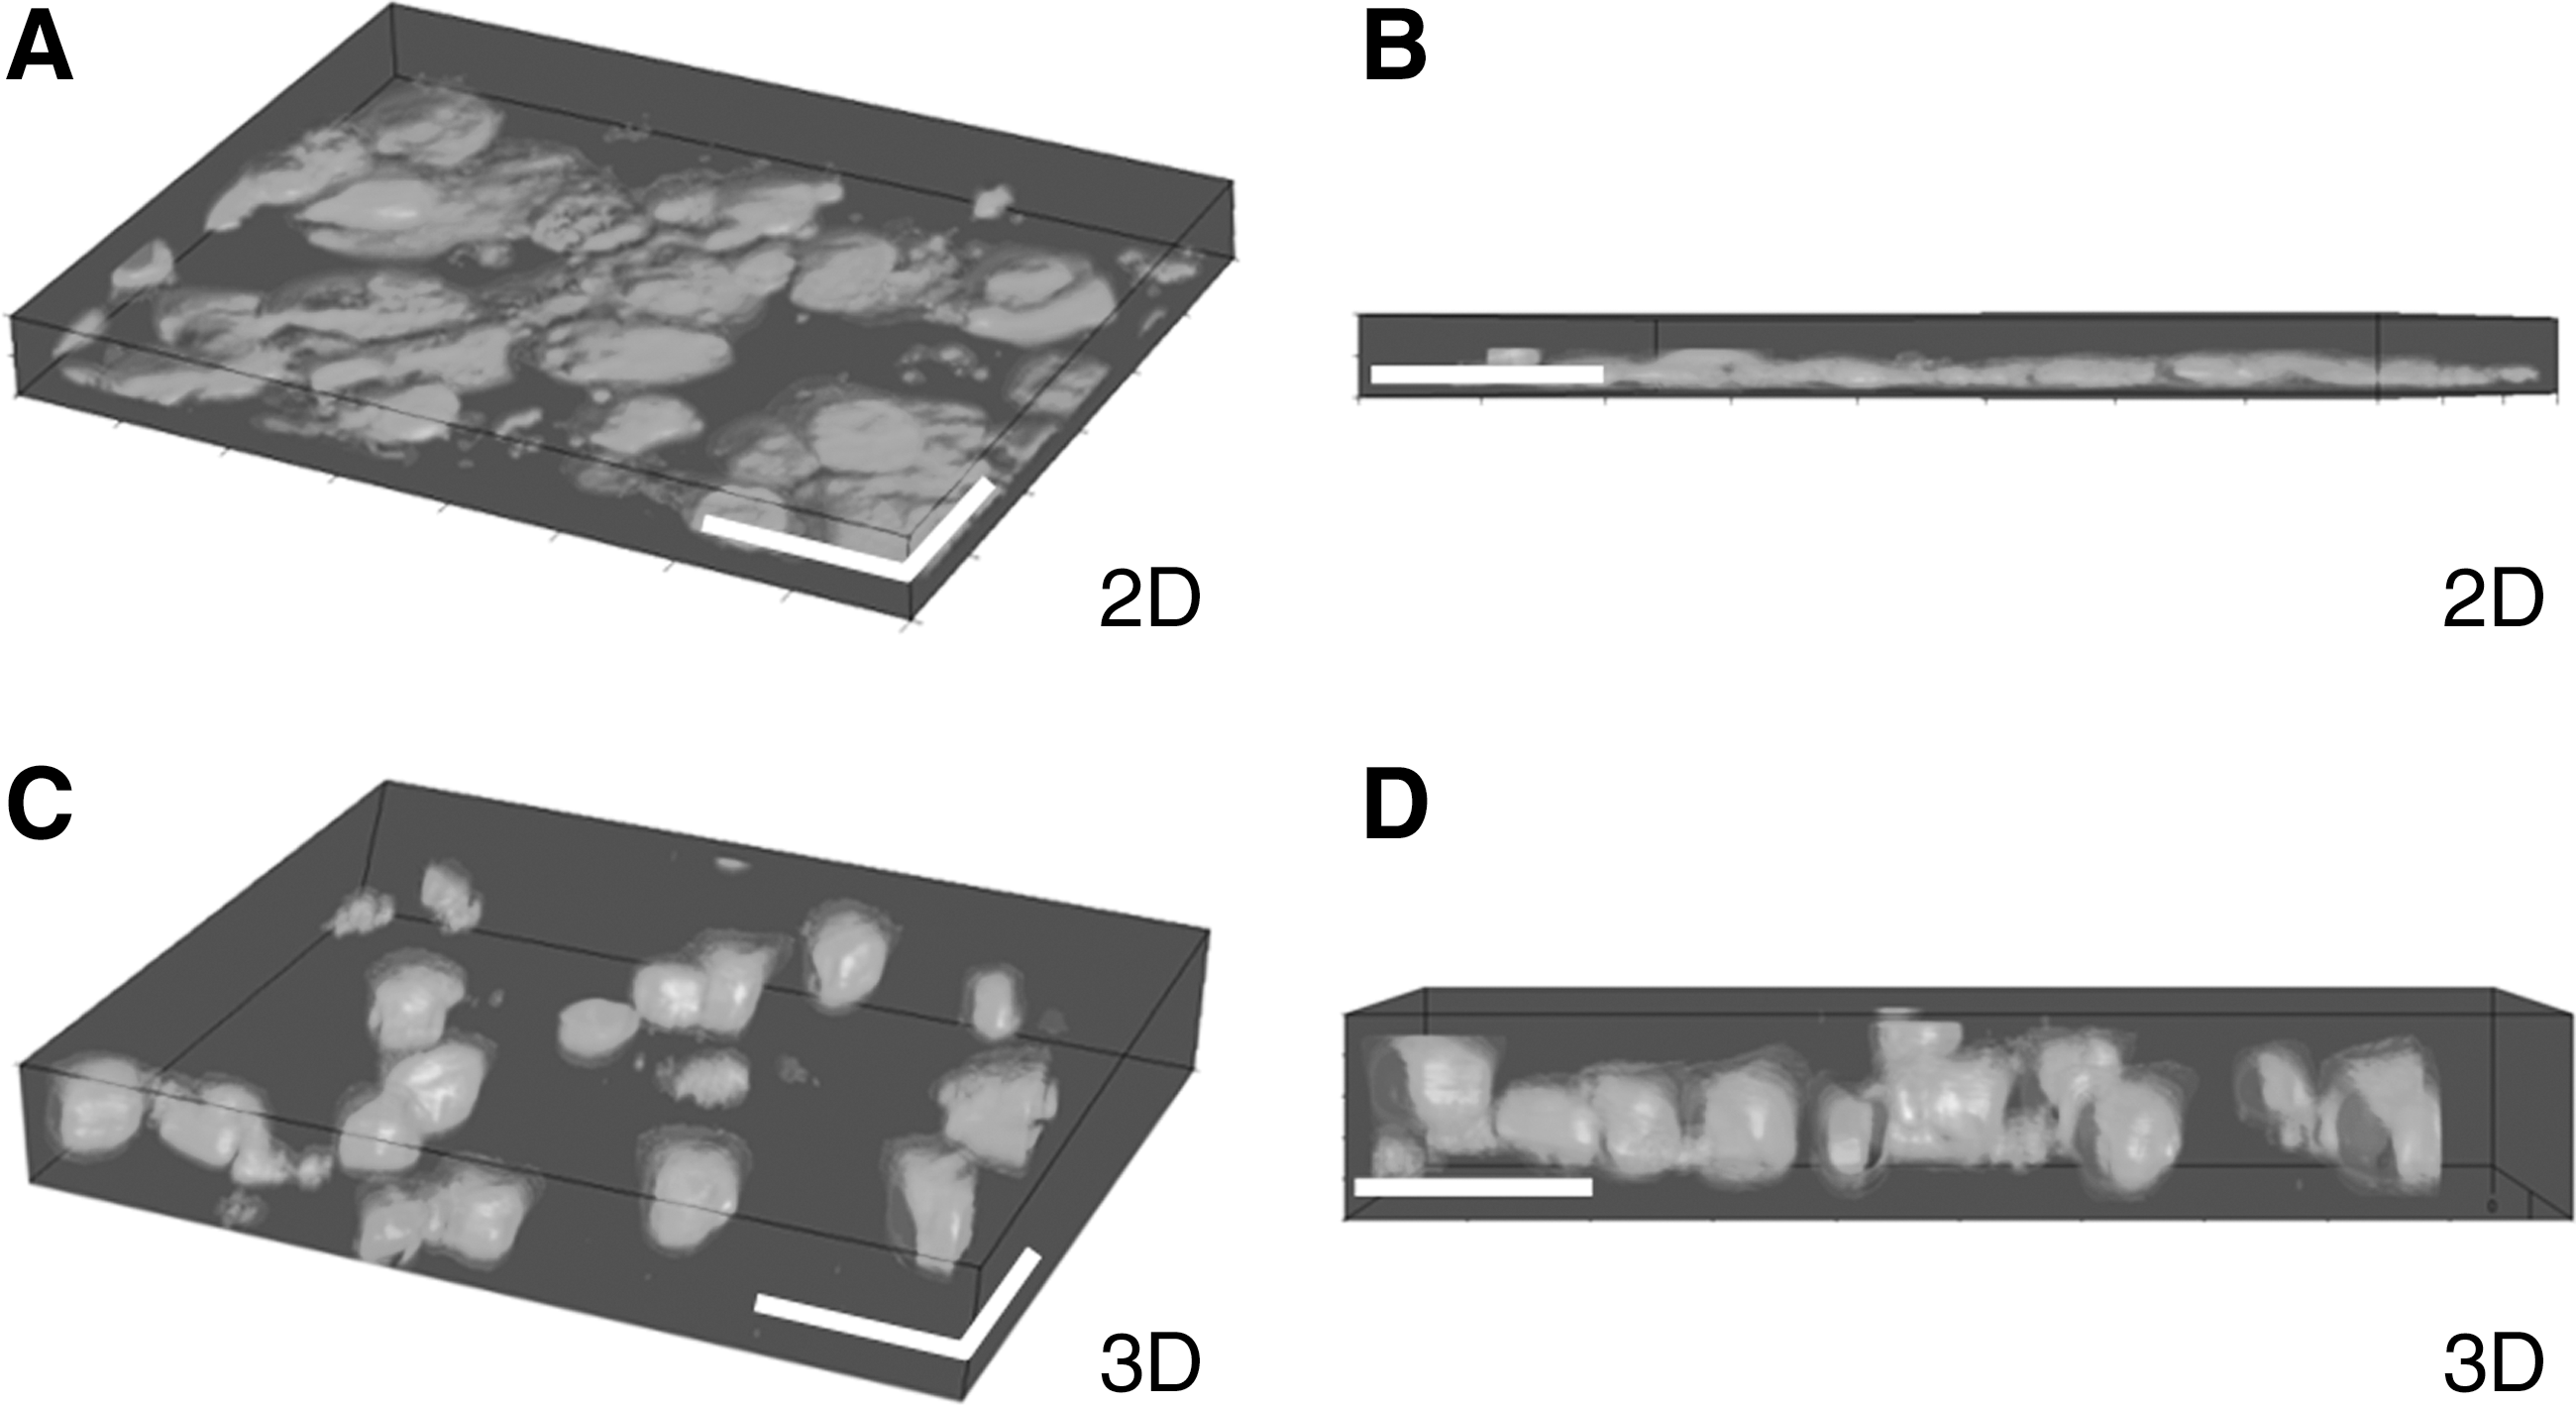
Morphology of primary hepatocytes is influenced by the structure of their polystyrene growth surface. Cells grown on conventional 2D surfaces
The viability of primary hepatocytes maintained for 24 h in monolayer culture and 3D polystyrene scaffolds was measured by labeling the cells with calcein and ethidium homodimer-1 and imaging with laser scanning confocal microscopy. To investigate if cell viability in monolayer culture is influenced by seeding density, hepatocytes were maintained in culture for 24 h at densities ranging from 8×10⁴ cells/well to 6.4×10⁵ cells/well. Quantitative analysis of cell viability was performed by analyzing individual pixels from a minimum of three fields of view taken from each of three independent monolayer cultures to produce scatter plots from which percentages of live cells, dying cells, and dead cells were determined (Fig. 2). It can be seen that cells seeded at a density of 8×10⁴ cells per well had a low number of live cells (∼10% of the population) with the majority of cells either dying (∼44%) or dead (∼46%). At a higher seeding density of 3.2×10⁵ cells per well the number of live cells significantly increases (∼57%) compared with the dying cells (∼37%) and there is a significant decrease in the number of dead cells (∼6%). At the highest seeding density of 6.4×10⁵ cells per well the populations of live (∼38%) and dying cells (∼40%) are approximately equal and there is an increase in the number of dead cells (∼22%). By contrast, cells seeded onto the 3D scaffold and maintained for 24 h were significantly more viable than cells in monolayer culture and were much less effected by seeding densities with >74% of live cells at each of the three cell concentrations tested (Fig. 2).
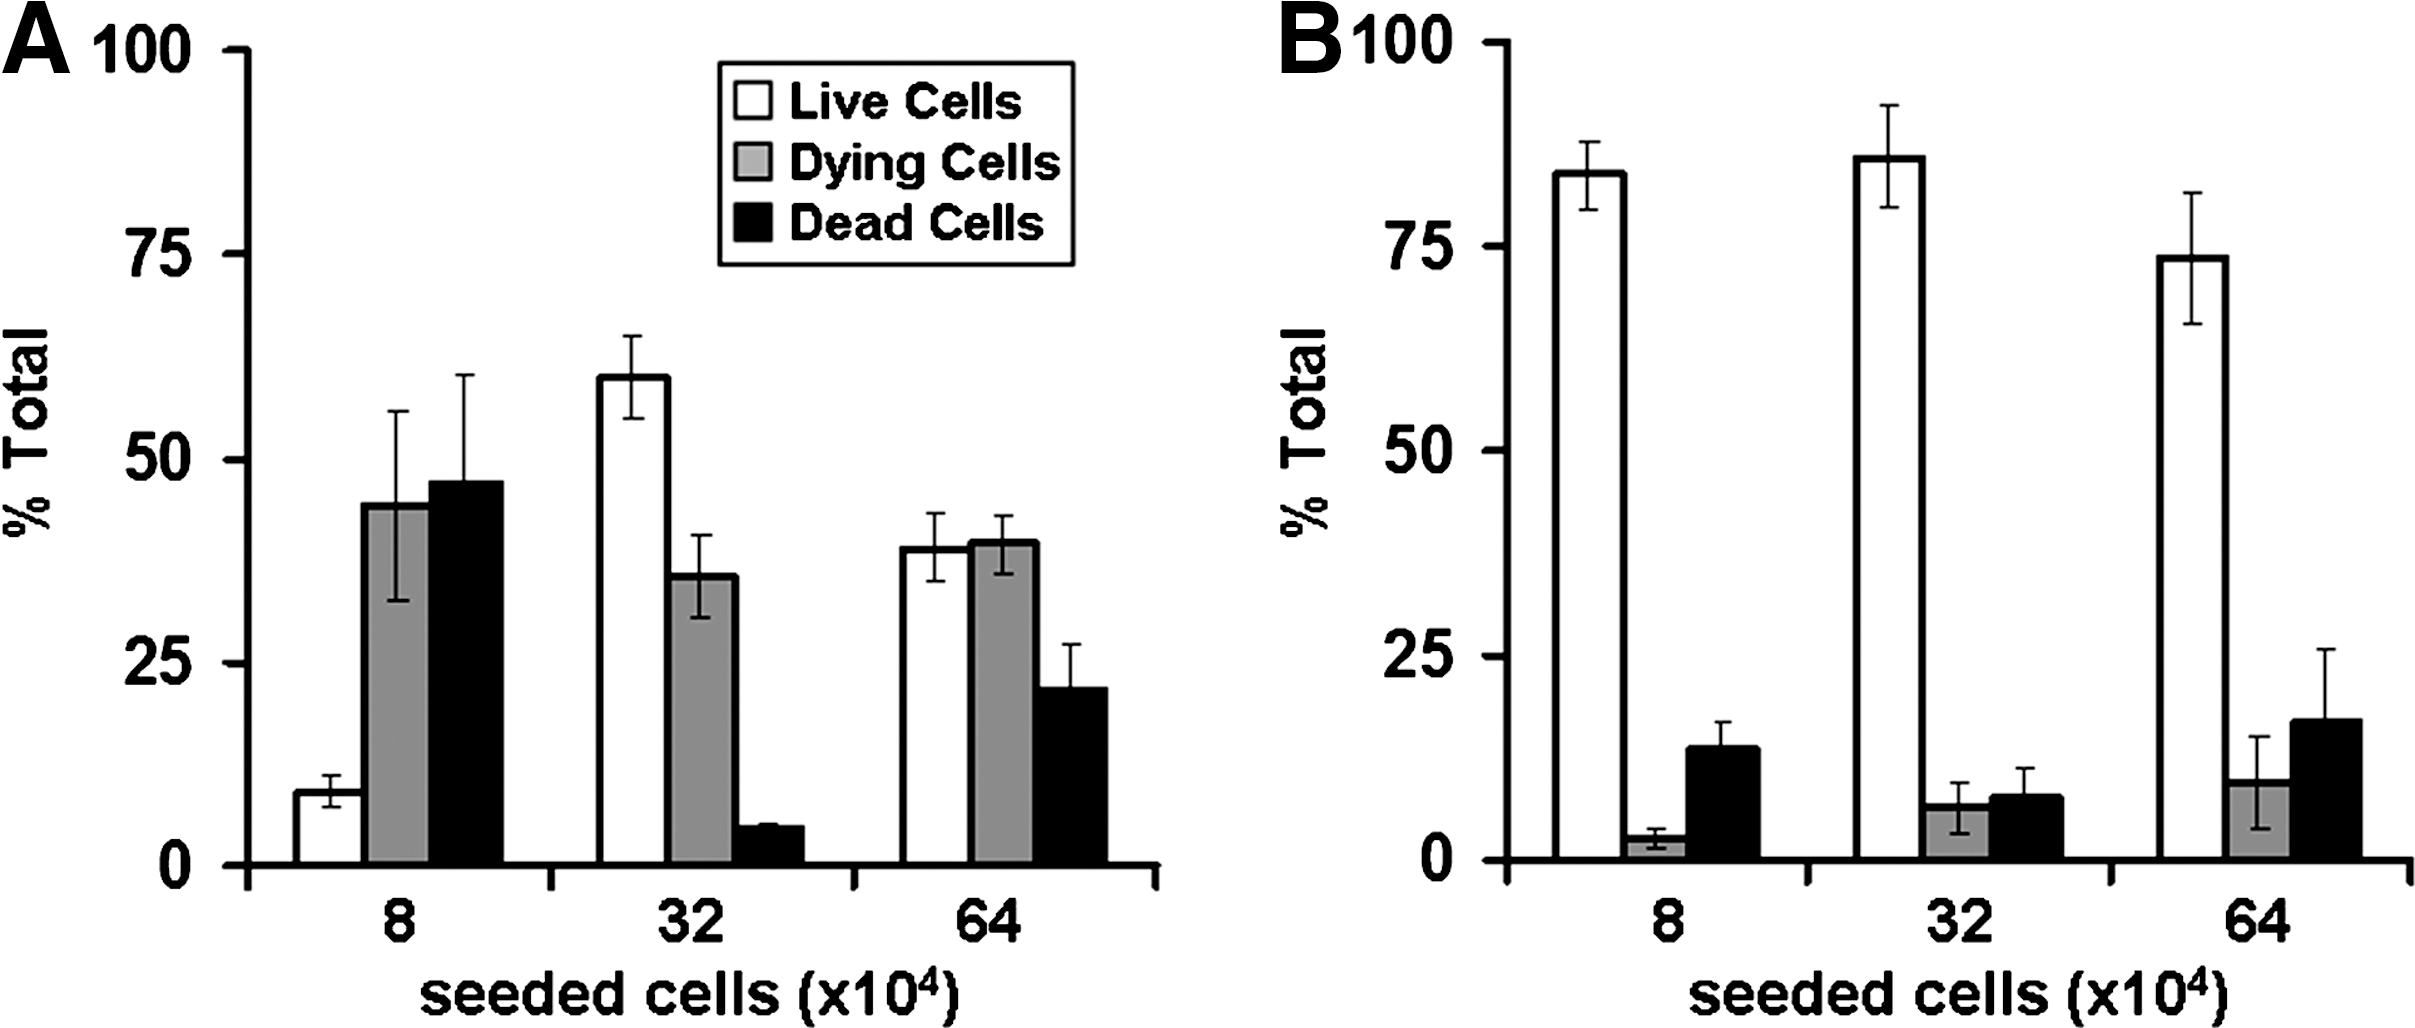
Viability of primary hepatocytes is significantly affected by the growth substrate. Plots showing cell viability data as determined by quantification of live/dead (calcein AM/ethidium homodimer-1) cell staining of hepatocytes maintained for 24 h on either conventional 2D polystyrene plasticware
CYP Enzyme Activity
Changes in the inducible activity of CYP enzymes in primary hepatocytes maintained in monolayer culture and 3D scaffolds were examined after 48 and 72 h using the EROD assay (CYP1A2) and LC/MS analysis of testosterone metabolites (CYP2B1 and CYP3A2) (Fig. 3). Activity of all three CYP enzymes was significantly higher in hepatocytes grown on the 3D scaffolds compared with the monolayer cultures at both time points. Activity of CYP1A2 (Fig. 3A) was 4.62 times higher in the 3D scaffold at the 48 h time point and, despite decreasing from 7.89 to 5.78 nmol/min/mg protein at the 72 h point, there was an increased induction over the monolayer culture to 6.26-fold. Comparison of fold changes over basal CYP levels showed that cells in the 3D scaffolds had a 28.14-fold increase in CYP1A2 activity after 48 h decreasing to 20.64-fold after 72 h. In comparison, the cells in monolayer culture had a 5.03-fold increase over basal levels at 48 h reducing to a 2.71-fold increase after 72 h. Activity of CYP2B1 (Fig. 3B) was very low in the monolayer culture at the 48 h time point (0.1 nmol/min/mg protein), leading to a relative fold increase in activity in the 3D scaffolds of 63.96. At the 72 h time point there was a significant decrease in CYP2B1 activity in the 3D scaffolds (asterisk in Fig. 3B) and a modest increase in activity in the monolayer culture. However, the activity of CYP2B1 in the monolayer culture was still 7.83 times lower than in the 3D scaffolds. The CYP2B1 activity in monolayer culture was also not majorly increased over basal levels with only a 2.51-fold increase after 48 h and an 8.03-fold increase after 72 h. In comparison the fold increases over basal levels for the 3D cultures were 41.63 and 16.74 after 48 and 72 h, respectively. Activity of CYP3A2 (Fig. 3C) was relatively stable in both culture systems at the 48 and 72 h time points but was again significantly higher in the 3D scaffolds with a 5.75-fold increase at the 48 h time point and a 7.18-fold increase after 72 h. Relative fold increases in CYP3A2 activity over basal levels showed that in 3D culture there was a 29.71-fold increase at 48 h and 26.46-fold increase at 72 h, compared with 6.48 and 4.72-fold increases in the monolayer culture.

Differential regulation of induced cytochrome-P450 (CYP) enzyme expression levels in hepatocytes cultured on alternative polystyrene substrates. Plots show CYP enzyme activity in primary hepatocytes maintained on either conventional 2D polystyrene plasticware (gray bars) or 3D polystyrene scaffolds (black bars) for 48 and 72 h after induction with 1 μM 3-methylcholanthrene
Cytotoxicity of APAP
Differences in the sensitivity of primary hepatocytes maintained in monolayer culture and 3D polystyrene scaffolds to the hepatotoxic compound APAP were measured at a range of concentrations from 100 μM to 40 mM after 24 h exposure. Figure 4 shows the percentage cell viability normalized against the percentage viability of vehicle (DMSO) controls. APAP showed no toxic effect on the primary hepatocytes maintained in either system up to a concentration of 4 mM. Above 4 mM APAP became toxic to the cells maintained in the 3D scaffolds with a dose-dependent decrease in viability to 76.6% at 10 mM, 59.3% viability at 20 mM, and 53.9% viability at 40 mM APAP. In the monolayer culture APAP showed no toxic effect at 10 mM concentration (102.7% viability) with viability only beginning to decrease at the higher 20 mM (87.0% viability) and 40 mM (80.6% viability) concentrations.
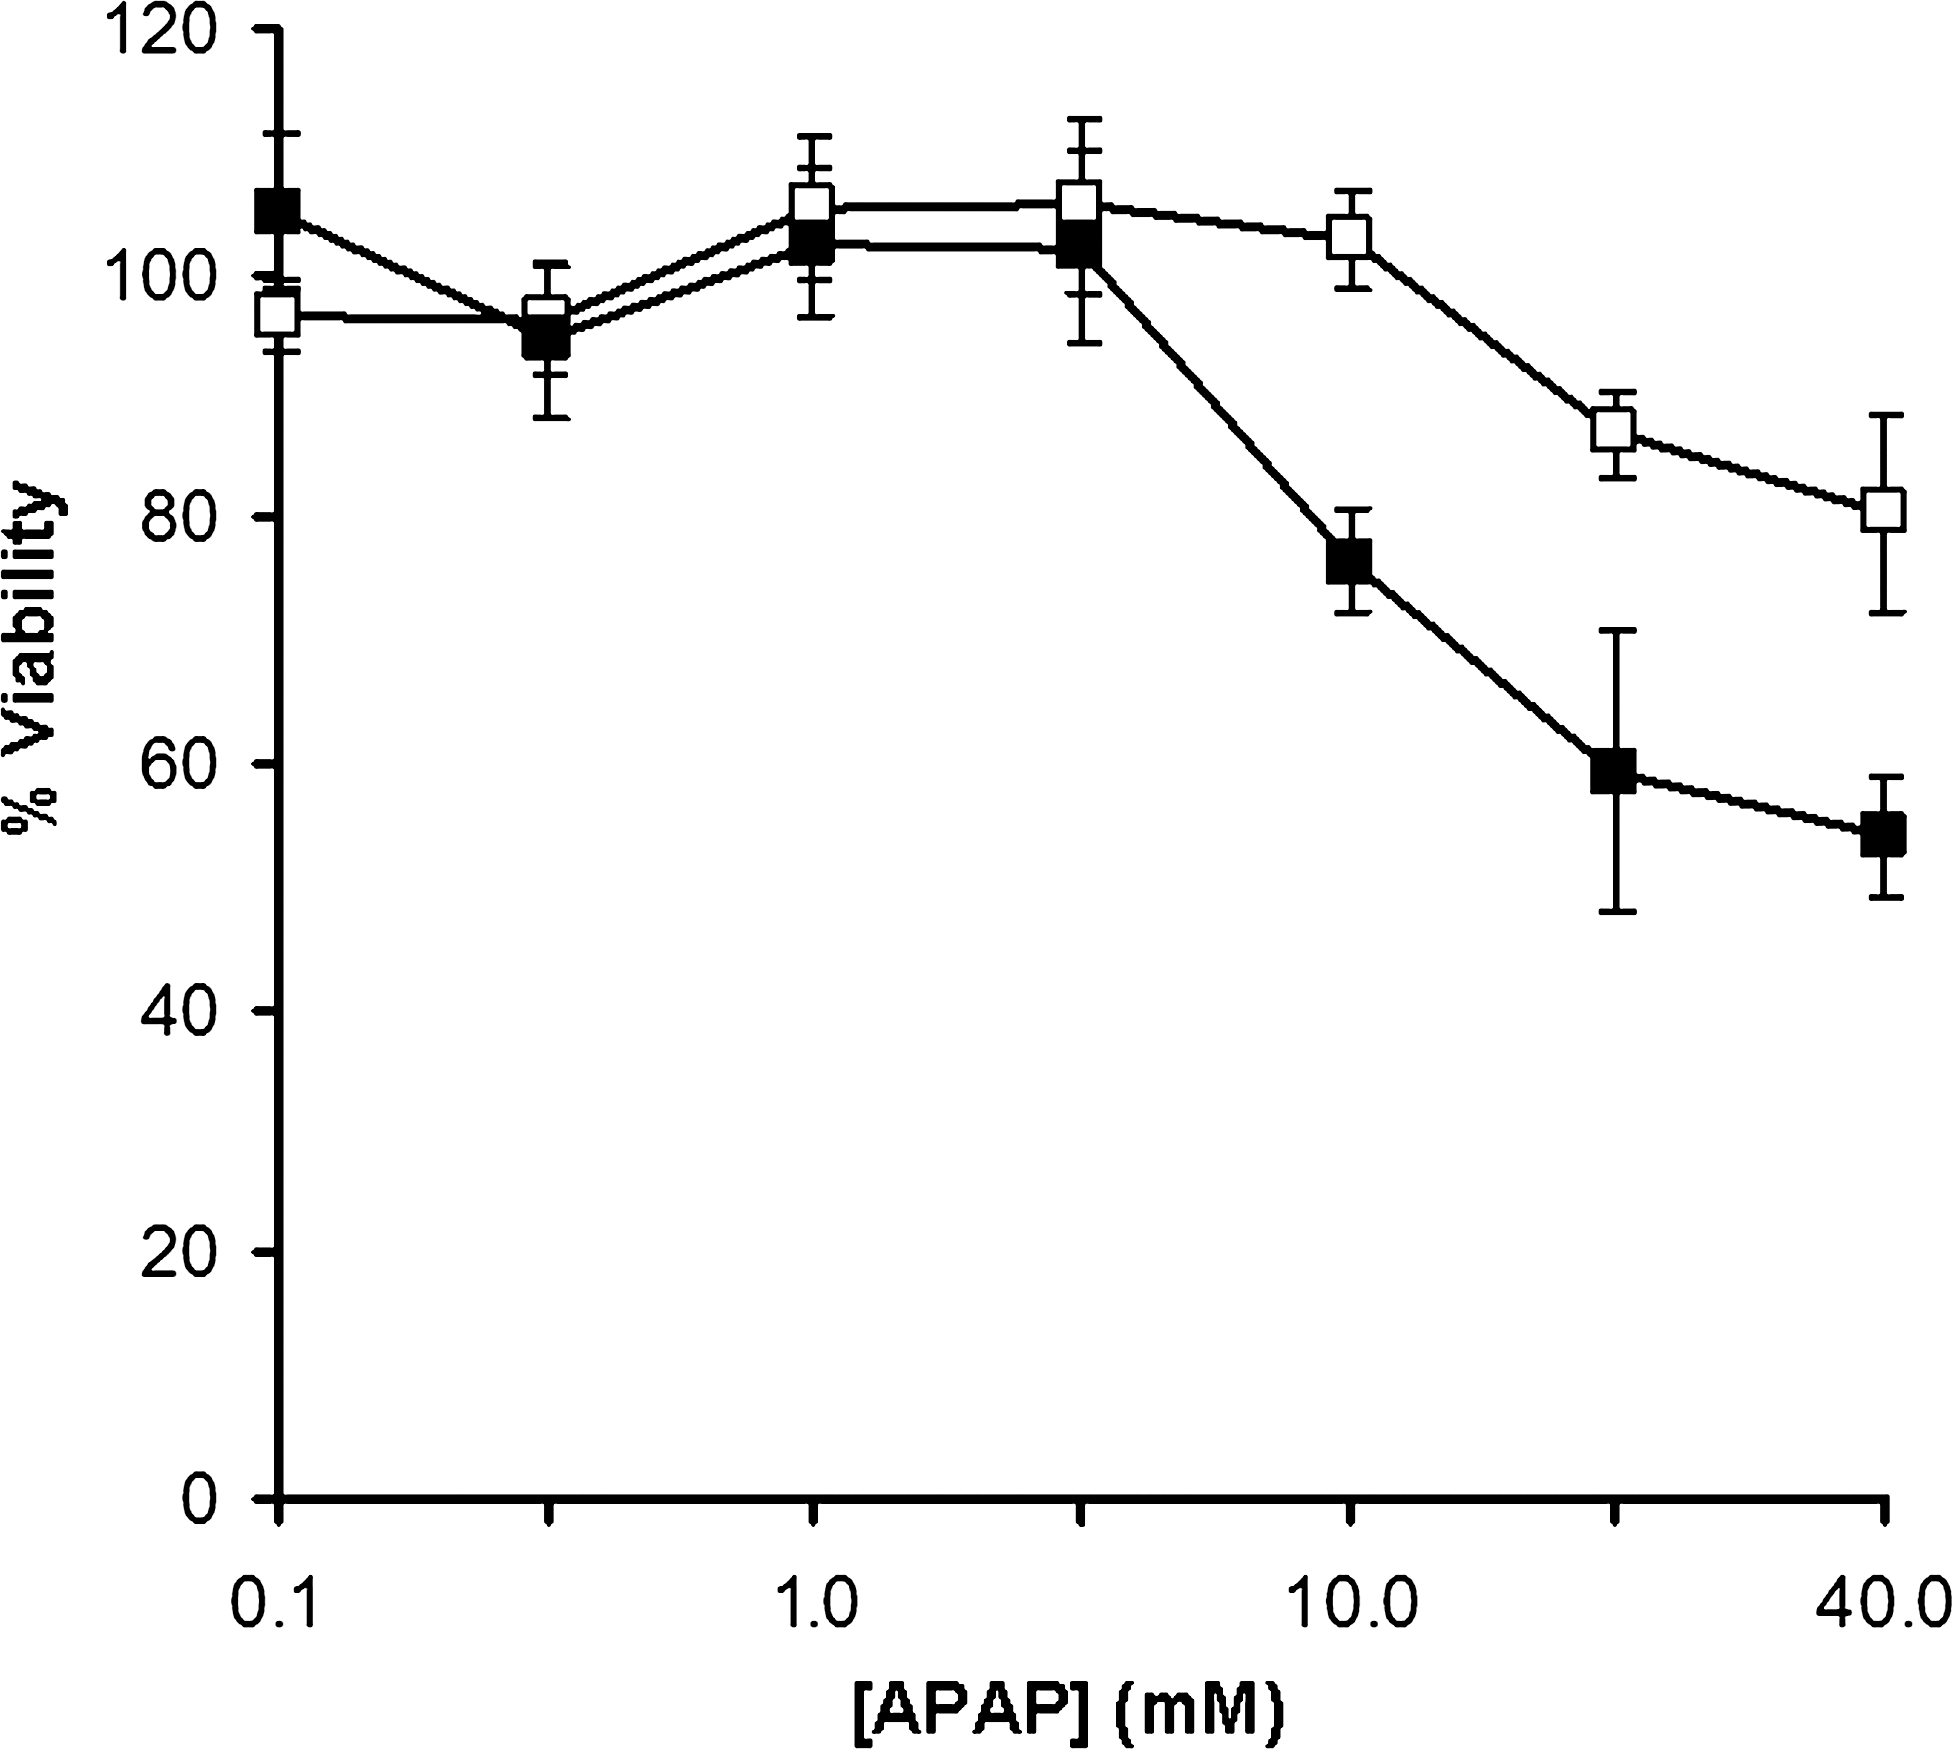
Hepatocytes show different cytotoxic responses when cultured on alternative polystyrene substrates. Plot shows the viability of primary hepatocytes cultured on either conventional 2D polystyrene plasticware (open squares) or 3D polystyrene scaffolds (black squares) after incubation with APAP. Cells were exposed to a final concentration of 0, 0.1, 0.4, 2, 4, 10, 20, or 40 mM APAP for 20 h. Cell viability was determined by a methylthiazolyldiphenyl-tetrazolium bromide assay. Data represent mean±SD, n=3. APAP, acetaminophen.
Gene Expression Profiles
The effect of growing primary rat hepatocytes in 3D on the expression of genes associated with phase I, II, and III drug metabolism (Table 4) was examined under basal conditions and after exposure to a nontoxic dose of APAP (low dose, 0.4 mM) and a dose of APAP after which toxicity is measured (high dose, 4 mM APAP). The quality of RNA extracted from the primary hepatocytes was comparable between monolayer culture (which had an RIN ranging from 8.4 to 9.6) and 3D scaffold culture (which had an RIN ranging from 9.1 to 9.7) and was comparable to previously published RIN values using the Alvatex 3D scaffolds. 28
TaqMan Gene Expression Assays Used for the Analysis of Gene Expression in Primary Rat Hepatocytes
Principal component analysis of the gene expression data obtained is shown in Figure 5. The first principal component discriminated basal conditions and low-dose APAP from high-dose APAP, with this being most apparent for the cells grown in 3D scaffold. This indicated a significant effect of high-dose APAP on gene expression levels in both culture systems, and showed that the gene expression profile for cells cultured in 3D scaffolds was more divergent from high-dose APAP than for those cultured in monolayer. The second principal component discriminated cells grown in monolayer from cells grown in the 3D system, either under basal conditions or after exposure to low-dose APAP. However, there was no discrimination between the cells treated with high-dose APAP by the second component. This indicated a significant effect of the 3D culture system on gene expression levels under basal conditions and after exposure to low-dose APAP, but not after exposure to high-dose APAP.
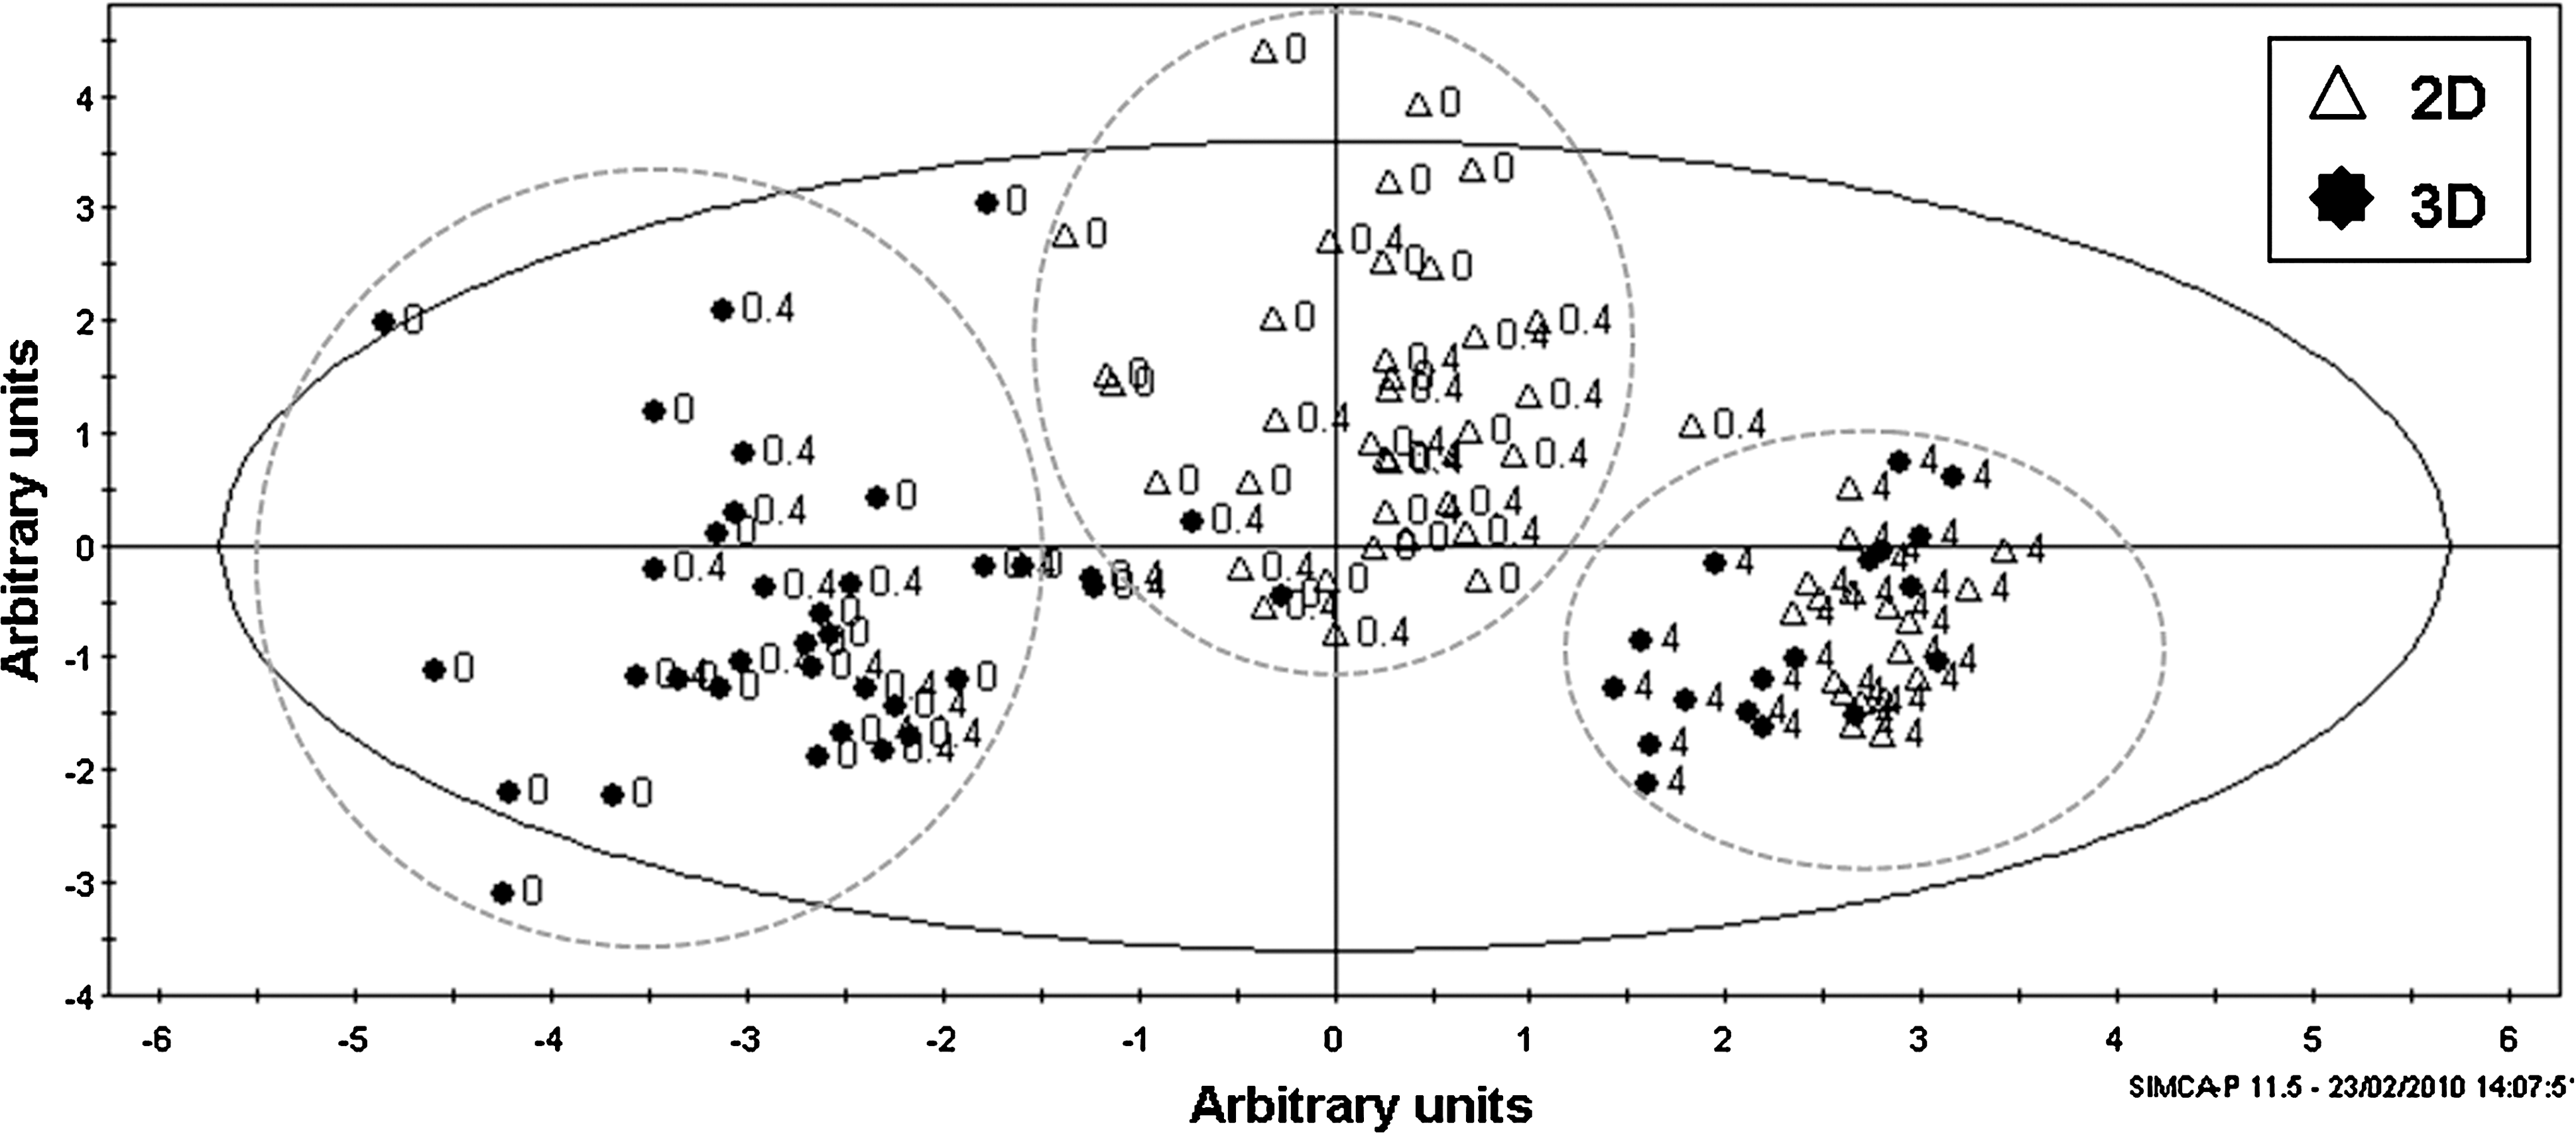
Culture of hepatocytes on alternative polystyrene substrates regulates gene expression after exposure to APAP. Principle component analysis showing grouping (dashed lines) of genes expressed by primary rat hepatocytes cultured on either conventional 2D polystyrene plasticware (open triangles) or 3D polystyrene scaffolds (black circles) after incubation with different concentration of APAP. Cells were exposed to a final concentration of 0.5% (v/v) dimethyl sulfoxide (basal, genes labeled 0), 0.4 mM APAP (low dose, genes labeled 0.4), or 4.0 mM APAP (high dose, genes labeled 4) for 24 h. Principal component analysis was performed on the expression levels of Cyp2B3, Cyp3A2, Cyp1A1, Cyp2E1, Cyp1A2, GSS, HO-1, GCLC, mrp2, mrp3, and MDR1 using arbitrary units.
The differential gene expression profile in the 3D culture system under basal conditions was examined further by comparison of phase I, II, and III drug metabolism markers to hepatocytes maintained in monolayer culture. Figure 6A shows the relative expression of phase I Cyp genes in 3D culture normalized against control monolayer basal expression levels. The expression of the majority of Cyp genes was significantly lower in the hepatocytes in the 3D scaffolds with relative expression levels of 0.66 (Cyp1A1), 0.81 (Cyp1A2), 0.78 (Cyp2B3), and 0.76 (Cyp2E1), by comparison the expression of the Cyp3A2 gene was significantly higher than the monolayer culture with a relative expression level of 1.55. The expression of phase II and III metabolism genes are shown in Figure 6B. The expression of the phase II markers HO-1 and GCLC was significantly lower in the 3D culture compared with monolayer culture with relative expression levels of 0.48 (HO-1) and 0.62 (GCLC), whereas the expression of the phase III transporters was significantly higher in the 3D scaffolds with expression levels of 1.35 (Mdr1), 1.76 (Mrp2), and 2.6 (Mrp3).
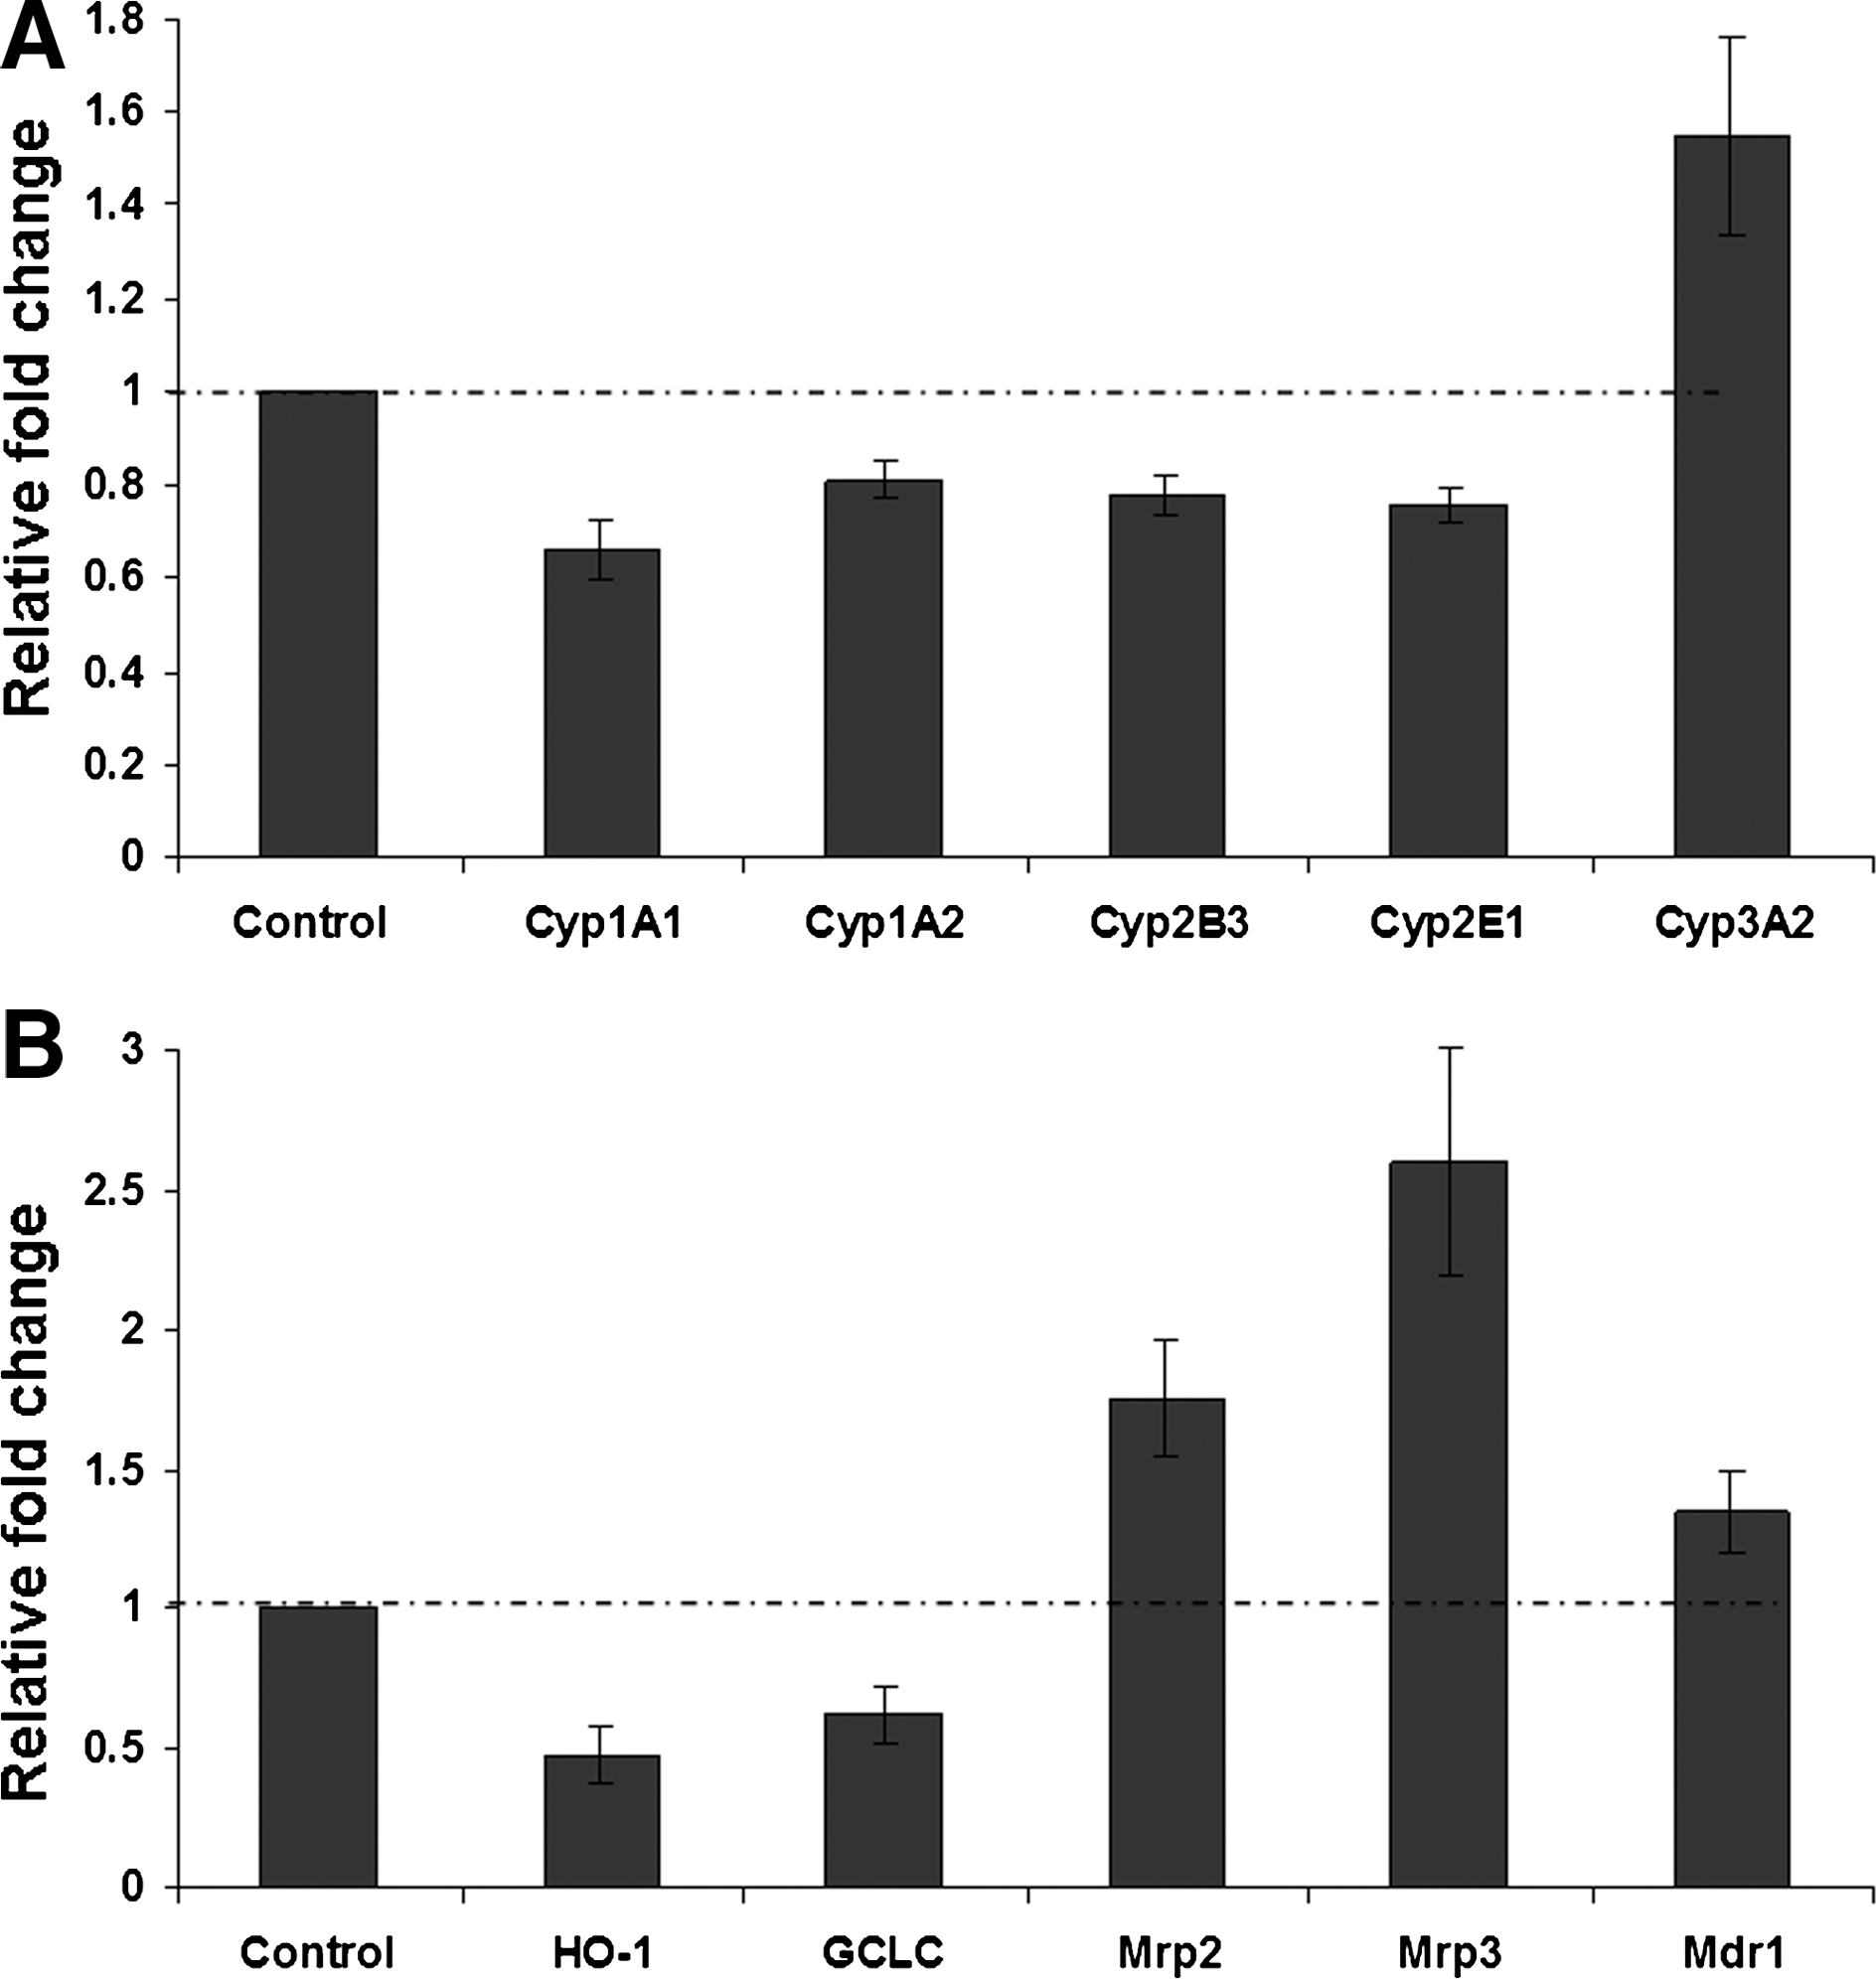
Differential regulation of gene expression by hepatocytes grown on 3D scaffolds. Relative gene expression levels are shown for phase I metabolism Cyp genes
The effect of APAP treatment on the expression of phase I, II, and III metabolism genes in hepatocytes maintained in the 3D scaffolds and monolayer culture was also examined. Figure 7 shows the relative fold changes in gene expression in response to treatment with low- and high-dose APAP normalized against basal expression levels. Expression of phase I Cyp genes was largely unaffected after treatment with low-dose APAP (Fig. 7A) with the exception of Cyp2E1, which was significantly upregulated in the 3D scaffolds. Treatment of the cells with the high-dose APAP resulted in more significant changes in both culture systems (Fig. 7B). There was a significant decrease in the expression of Cyp1A1 and Cyp3A2 in cells maintained in both culture systems, and there was a significant increase in the expression of Cyp1A2 in the 3D scaffolds. The increased expression of Cyp2E1 in the 3D scaffolds was maintained after treatment with high-dose APAP, and there was also an increase in the expression of this gene in cells from the monolayer culture. The expression of the phase II and III genes was largely unaffected after treatment of the cells with low-dose APAP in both culture systems (Fig. 7C). However, after treatment with high-dose APAP (Fig. 7D) there was a significant increase in the expression of HO-1 in cells maintained in the 3D scaffolds, a significant increase in the expression GCLC in the cells in both culture systems, and a significant decrease in all three phase III transporters (Mrp1, Mrp2, and Mdr1) in cells in both culture systems.
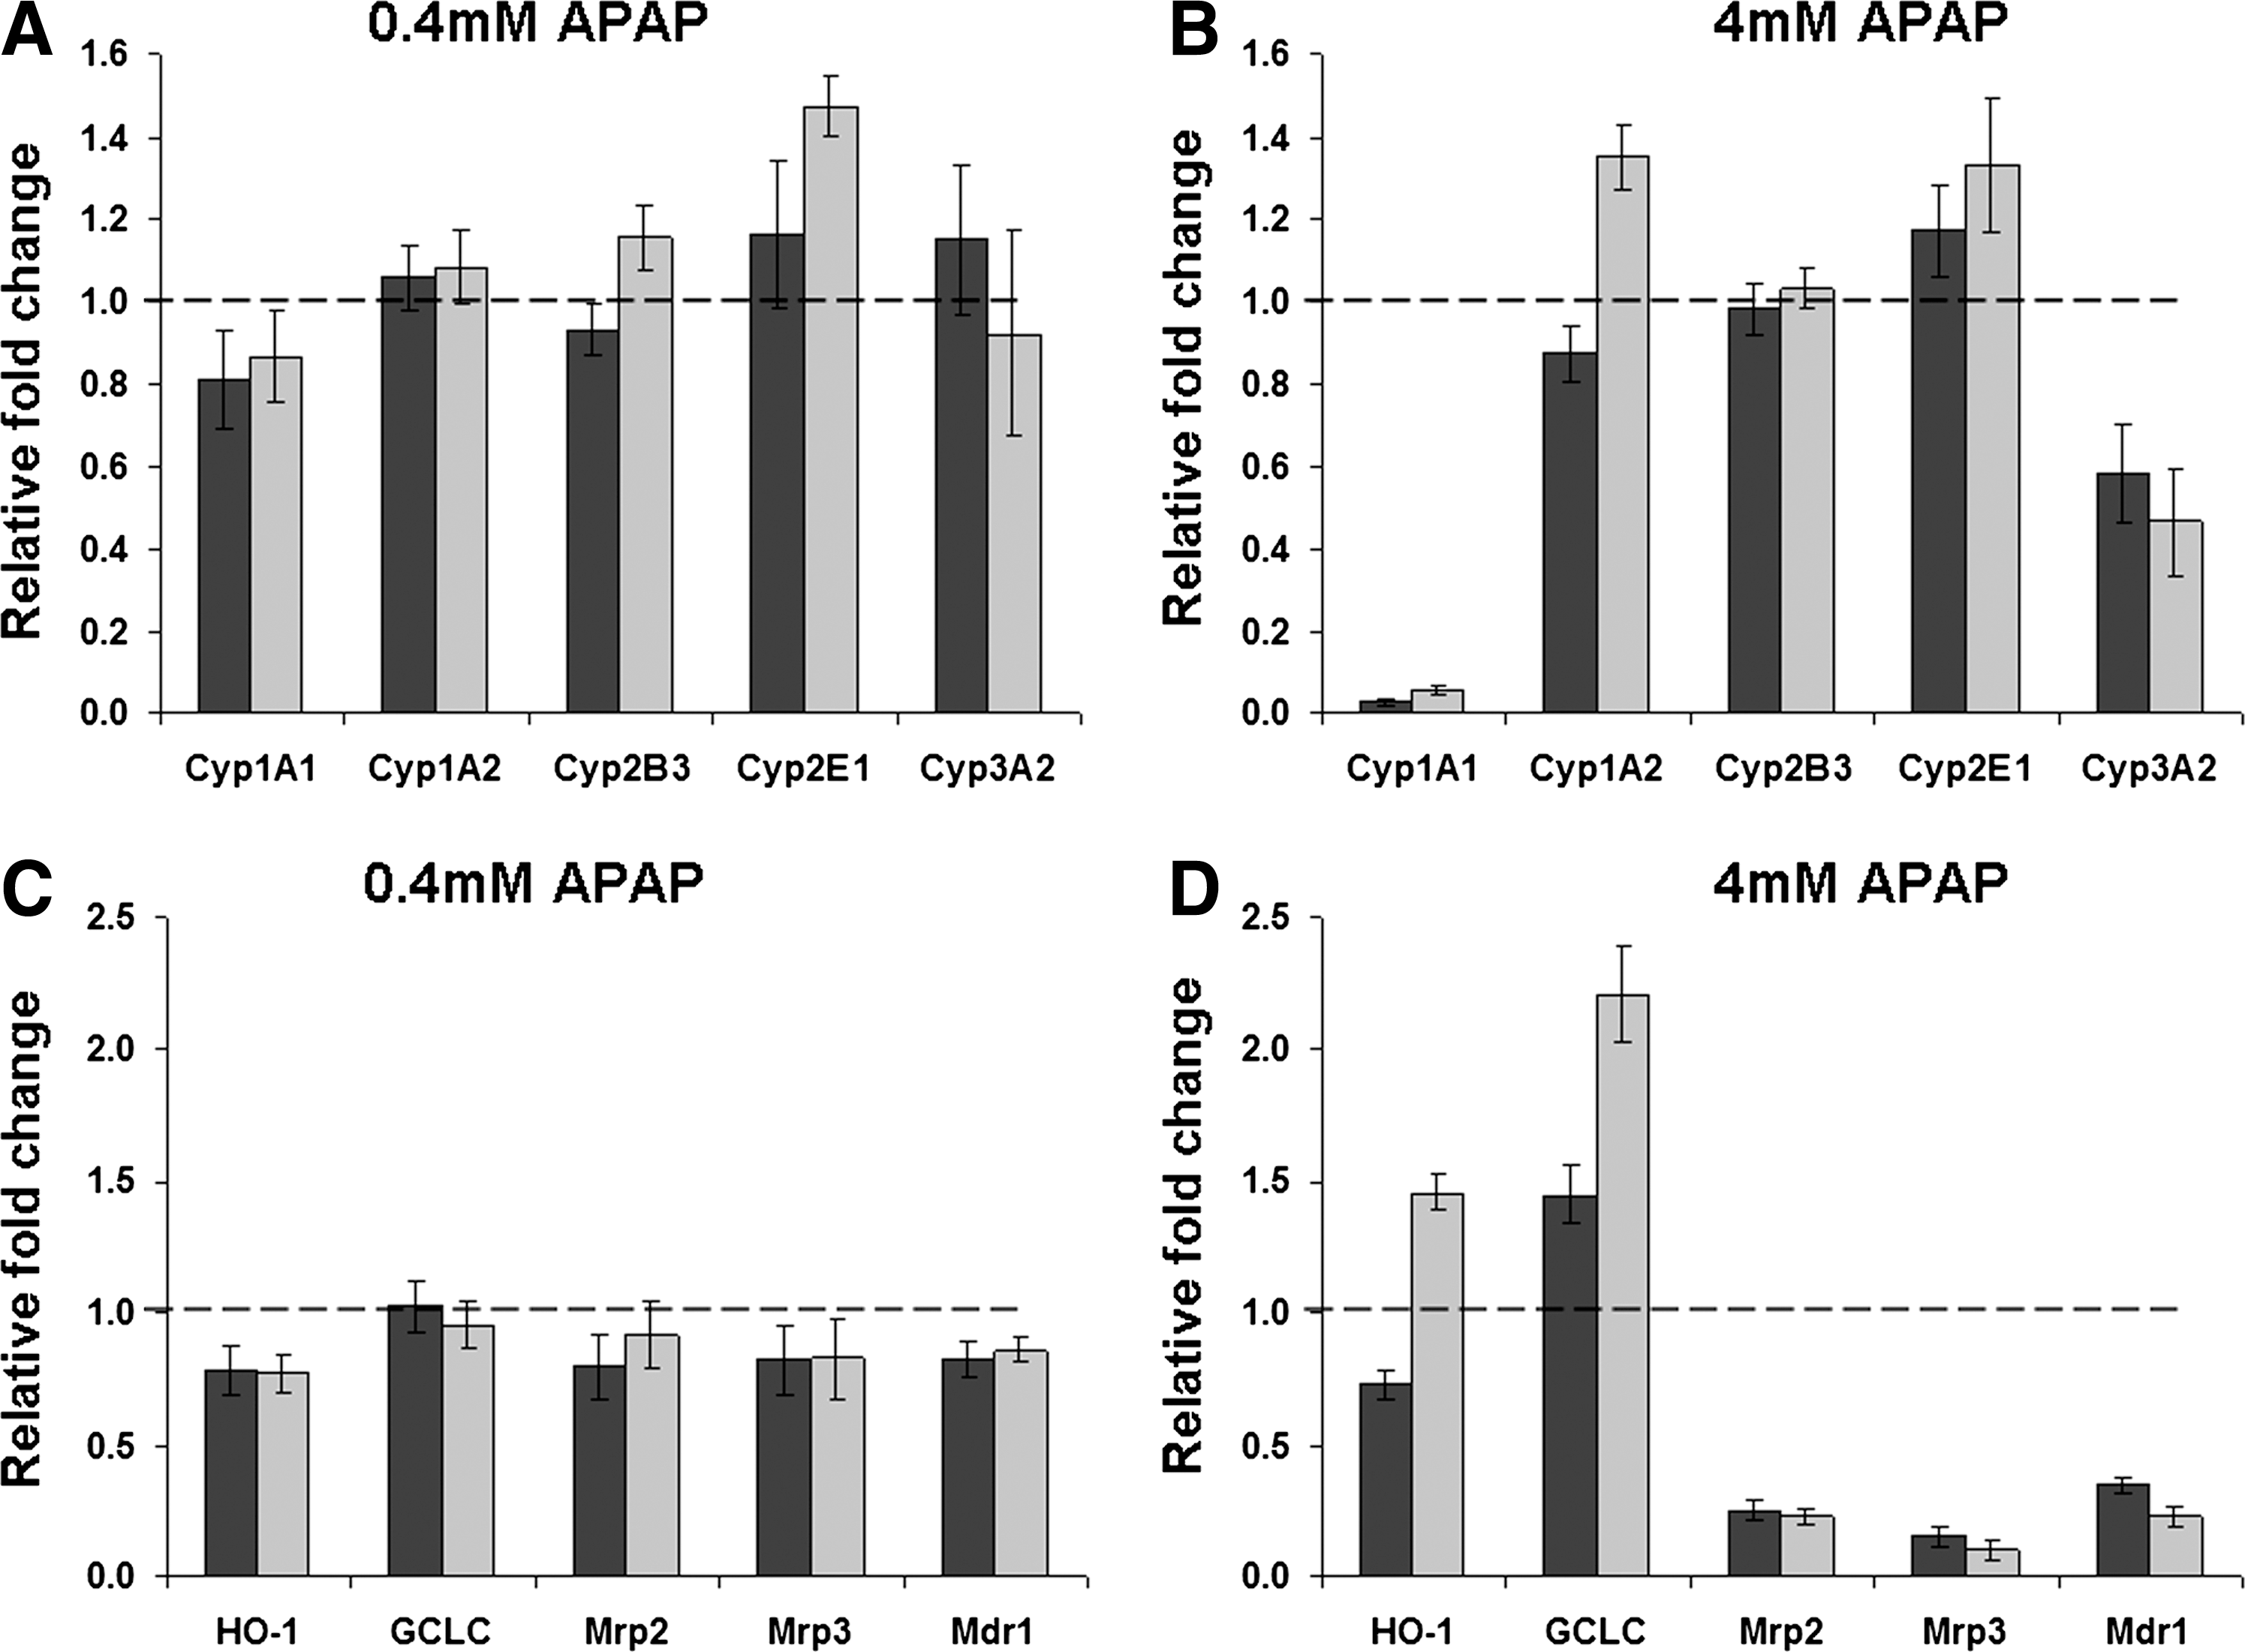
Differential regulation of gene expression by hepatocytes after 24 h exposure to APAP. Plots show relative mRNA expression levels for phase I Cyp genes
Discussion
Primary hepatocytes are extensively used in monolayer culture for in vitro drug metabolism studies. This is despite their practical limitations associated with decreasing viability, loss of liver-specific functions, and morphological changes during the first 3–4 days of cell culture. 29,30 Some of these issues can be partially overcome through the use of organotypic cell culture models such as sandwich culture, but in turn this model presents its own limitations. A potential solution is the use of 3D cell culture that can change the behavior of cells by providing a 3D microenvironment that more closely resembles the spatial characteristics that cells experience in corporeal tissues. 31 However, development of 3D models that can be used in liver drug metabolism and toxicity studies is challenging. This is due to the requirements for a system that can maintain the viability and morphology of primary cells while still promoting stable expression of liver markers and remaining compatible with established in vitro assays. Such models must also be amenable for routine ease of use, cost effective, readily available and transferable between alternative laboratories, and adaptable to existing biological assays, automated procedures, and standard laboratory equipment.
Loss of hepatocyte viability under basal culture conditions can affect the reproducibility of compound toxicity measurements. One of the problems associated with primary hepatocytes is the requirement to use them rapidly after enzymatic extraction from the liver, a process that places the cells in a fragile metabolic state. In this study we show that viability in monolayer culture is affected by the initial seeding density with significantly reduced viability in hepatocytes seeded at low cell number (8×10⁴ cells/well) compared with medium (32×104 cells/well) and high (64×104 cells/well) seeding densities. This is comparable with other reports which have shown that lower seeding densities can significantly impact cell viability in a range of models, including monolayer culture, 32 immobilization culture, 33 and collagen sandwich culture. 34 In contrast, hepatocytes grown on the 3D system used in this study, Alvetex, showed no cell number-dependent loss in viability even at the lowest seeding density. Indeed, at all three seeding densities cell viability was maintained above 74% (the highest viability in the monolayer culture was 57%).
Several factors can positively influence the viability of hepatocytes in vitro. In sandwich culture viability can be influenced by cell–cell 34 and cell–matrix 35 interactions, whereas in 3D encapsulation culture, dead hepatocytes trapped within the gel can damage neighboring cells leading to a reduction in overall viability. 36 In the system used in this study it is likely that the higher cell viability is related to the 3D structure of cells, the 3D interaction between cells, and the 3D interaction between cells and the collagen-coated scaffold. This is partly shown through morphological analyses which indicate that cells in the 3D system retain a more in vivo-like cuboidal morphology with a size distribution (∼23.3±8.1 μm) similar to that observed within the liver (∼20–33 μm). 37 Gene expression analysis also suggests that the 3D culture system could be influencing viability by reducing the stress placed upon the cells, evident by the significantly reduced mRNA levels of the phase II enzymes HO-1 and GCLC. In monolayer culture it has been shown that the plating of primary hepatocytes results in the increased expression of genes associated with oxidative stress, and the production of reactive oxygen species, which play a part in mediating apoptosis. 38 HO-1 and GCLC have both been shown to be induced by conditions of oxidative stress in primary hepatocytes. 39,40 Therefore, their reduced expression in the 3D system could be an indication of reduced environmental and, more specifically, oxidative stress leading to an increase in overall cell viability.
Primary hepatocytes are a valuable tool for screening the biotransformation of nontoxic compounds to toxic intermediates in vitro. The loss of liver-specific functions in hepatocytes during the culture process can cause reduced biotransformation of potentially toxic compounds, leading to a false evaluation of potential toxicity. Numerous studies have compared the levels of mRNAs associated with phase I, II, and III drug metabolism in cells cultured in vitro in both monolayer and sandwich culture. 8,38,41,42 These studies consistently showed significantly decreased levels of phase I Cyp mRNA levels over time, with smaller and more variable alterations in the expression of phase II enzymes and hepatocyte transporter genes. Importantly, the decreases in Cyp mRNA expression observed often correlated with decreased CYP protein levels and/or enzyme activity. 41,42 In this study we show using gene expression analysis that under basal conditions, with the exception of Cyp3A2, the expression levels of Cyp mRNA levels were consistently lower in the 3D system compared with monolayer culture. This is perhaps surprising as other studies have shown that expression of Cyp genes in 3D systems such as sandwich culture are generally higher than hepatocytes maintained in monolayer culture. 8 However, the most relevant endpoint for drug biotransformation studies is enzyme activity, and it has been shown that expression of some Cyp genes correlates poorly with corresponding enzyme activity 43 and that hepatocytes that exhibit low levels of Cyp mRNA still possess the ability to respond to CYP inducers. 42 In this study, we show via measurements of enzyme activity after induction that there is significantly higher CYP activity in the 3D scaffolds compared with monolayer culture for all the CYP enzymes examined. This higher level of enzyme activity suggests that cells maintained in the 3D system, while expressing lower basal mRNA levels of CYP enzymes, should be more suitable for drug biotransformation studies.
To investigate whether this increased enzyme activity translates into differences in toxicity measurements between the two systems, the effect of APAP on cell viability was examined. APAP is a well-characterized hepatotoxic drug that is toxic to cells after metabolism in the liver, primarily through CYP2E1 and to a lesser extent by CYP1A2 and CYP3A4, 44,45 or in the rat CYP3A2, which is the ortholog of CYP3A4. The main mechanism responsible for APAP toxicity is the formation of the hepatotoxic intermediate N-acetyl-p-quinoneimine (NAPQI), which is formed through oxidation by CYP2E1 and CYP3A2. NAPQI is normally detoxified by glutathione, but after the cellular glutathione stores are depleted, NAPQI binds to SH moieties of proteins within the cells, leading to the apoptosis through mechanisms such as impairment of mitochondrial respiration, induction of oxidative stress, and lipoperoxidation. 46 It was therefore hypothesized that increased CYP activity in cells maintained in the 3D system, in particular CYP1A2 and CYP3A2, would lead to an increase in APAP metabolism, an increase in the formation of toxic NAPQI, and a reduction in cell viability. This appeared to be the case with hepatocytes in the 3D scaffolds showing a higher sensitivity to APAP-induced cytotoxicity, with loss of viability being apparent at APAP concentrations above 4.0 mM, compared with APAP concentrations above 10 mM for cells grown in monolayer culture. Gene expression analysis also shows that while the Cyp mRNA levels were generally lower in the 3D system under basal conditions, the levels of Cyp2E1 were significantly increased (P<0.01) upon exposure to low-dose APAP and the expression of Cyp1A2 mRNA were significantly increased (P<0.01) upon exposure to high-dose APAP in the 3D scaffolds compared with basal levels. Exposure of the cells to APAP in the 3D scaffolds also led to a significant increase in the expression of phase II marker HO-1 and GCLC, which as discussed previously, are regulated in response to oxidative stress. These results suggest that the increased sensitivity of cells to APAP in the 3D scaffolds is due to increased CYP-mediated production of NAPQI, which places the cells under increased oxidative stress. Concurrently, the presence of APAP also increases mRNA expression of Cyp enzymes associated with APAP metabolism, which in turn would lead to more NAPQI formation, a decrease in cellular glutathione levels and an increase in apoptosis.
While the use of organotypic and 3D cell culture systems have been shown to increase the levels of liver markers compared with monolayer culture they are often not as compatible with standard in vitro assays. For example, gene expression analysis works well in monolayer culture because the system is compatible with the rapid extraction of high-quality RNA after treatment of the cells. In comparison, sandwich culture and 3D collagen encapsulation models require lengthy extraction procedures or collagenase treatment to access the cells, 47 both of which can result in altered gene expression. In this study, RNA was isolated by direct lysis within the culture system, thereby minimizing any alterations in gene expression arising from the extraction process. This resulted in the extraction of high-quality RNA from both monolayer culture and from the 3D culture scaffolds (RIN values 8.4–9.6 and 9.1–9.7, respectively). In addition to gene expression analysis, the 3D scaffolds used in this study were also shown to be compatible with fluorescent assays (EROD assay), confocal laser scanning microscopy, as well as assays for viability (MTT) and measurement of metabolites (LC/MS). Application of such techniques underlines the versatility of these 3D scaffolds as a technology broadly compatible with the majority of methods and assays commonly used in liver toxicity and drug metabolism studies.
Overall, this work demonstrates the advantages of using this 3D culture system over conventional monolayer cultures to maintain primary hepatocytes for short-term toxicity studies. The 3D scaffolds, which can be readily coated with a range of different ECM proteins, place the cells in an environment that allows them to maintain an in vivo-like morphology and retain a high viability. The cells also express significantly lower levels of gene markers associated with oxidative stress. Collectively, these provide a hepatocyte culture model that can be induced to express significantly higher levels of CYP enzymes compared with monolayer culture and which can respond more sensitively to drug compounds that require biotransformation. Further, the fact that the 3D scaffolds used in this study are readily available in high-throughput assay plate formats also means that this type of technology could finally be used to overcome the barriers that have limited the uptake of 3D cell culture models and their routine use in liver toxicity and drug metabolism screening programs.
Footnotes
Acknowledgment
The work described in this article was funded by the UK National Measurement System.
Author Disclosure Statement
The authors declare that there are no conflicts of interest.