
Abstract
The standard assay for the determination of σ1 receptor affinities of novel compounds is a competitive binding assay using [3H]-(+)-pentazocine as radioligand and membrane preparations from guinea pig brain. Herein, a novel competitive binding assay was developed employing the hematopoietic cell line of human multiple myeloma (RPMI 8226), which expresses a large amount of the human σ1 receptor. Membrane fragments of RPMI 8226 cells were prepared and characterized. A Western blot analysis confirmed the high density of σ1 receptors in this cell line. Assay conditions were carefully optimized leading to an incubation period of 120 min, an incubation temperature of 37°C, and receptor material for each well was prepared from 300,000 cells. It was shown that a large excess (10 μM) of (+)-pentazocine, haloperidol, and di-o-tolylguanidine provided the same results during determination of the nonspecific binding. Saturation experiments with the radioligand [3H]-(+)-pentazocine led to a K d -value of 36±0.3 nM and a B max -value of 477±7 fmol/mg protein. These data resulted in approximately 122,000 σ1 binding sites per cell. The assay was validated by using six known σ1 ligands and eight σ1 ligands prepared in our lab. The K i -values determined with RPMI 8226–derived receptor material are in good accordance with the K i -values obtained with guinea pig brain membrane preparations. Compared with guinea pig brain preparations, the RPMI 8226–derived receptor material represents a better standardized receptor material with a high density of human σ1 receptors.
Introduction
The σ1 receptor is a transmembranous protein with 223 amino acids. It has two transmembrane regions, one extracellular loop, and both, the N-terminus as well as the C-terminus, are located intracellularly. 4 The postulated ligand binding site was found intracellularly and it was supposed to be formed by the C-terminal end of the protein. 5
The σ1 receptor was first cloned in 1996 from guinea pig liver 6 and subsequently from human placental choriocarcinoma cell line (JAR), 7 mouse, 8 and rat brain. 9 The gene encoding the σ1 receptor has a size of ∼7 kbp and is located on human chromosome 9, band p13, which is associated with psychiatric disorders like schizophrenia. 10 The σ1 subtype is better characterized than the σ2 receptor that has not been cloned yet. Nevertheless, further investigations are necessary to gain a better understanding of the σ1 receptor pharmacology like ligand binding properties and signal transduction pathways. The influence of σ1 receptors on several signal transduction pathways has been investigated. The σ1 receptor modulates some ion channels like Kv 1.4 K+-channels in nerve terminals, 4,11 Ca2+-channels in cultured cardiac myocytes, 12 voltage-gated Na+-channels in cardiac myocytes, 13 some neurotransmitter systems like NMDA receptors, 14 IP3 receptors in endoplasmatic reticulum, 15 and, furthermore, ankyrin, a cytoskeletal adaptor protein, which regulates Ca2+-influx at IP3 receptors. 16 A chaperone activity of σ1 receptors was also suggested. 17
The σ1 receptor was found in high density in the central nervous system (CNS), especially in some brain areas involved in memory, emotion, sensoric, and motor functions. Furthermore, peripheral organs like liver, kidney, heart, lung, intestine, and pancreas show high σ1 receptor expression. 18,19 Additionally, several tumor cell lines express a large amount of σ1 and σ2 receptors. 20,21 On the cellular level, σ1 receptors are localized in the cell membrane as well as in various intracellular membranes, including membranes of the endoplasmatic reticulum, mitochondria, and nucleus. Furthermore, intracellular translocation was suggested. 22
Several exogenous σ1 ligands from various compound classes are known. The dextrorotatory benzomorphans (+)-pentazocine and (+)-SKF10,047 are potent and selective σ1 agonists. Haloperidol and NE-100 are defined as σ1 receptor antagonists. Di-o-tolylguanidine (DTG) is a nonselective σ ligand that binds to σ1 and σ2 receptors with similar affinity (Fig. 1). 2,23 Endogenous ligands are not unequivocally identified, but it was shown that neurosteroids like progesterone, pregnenolone, and testosterone interact with σ1 receptors in high nanomolar to micromolar range. 24,25 Very recently N,N-dimethyltryptamine with a K i-value of 15 μM has been postulated as endogenous σ1 receptor ligand. 26
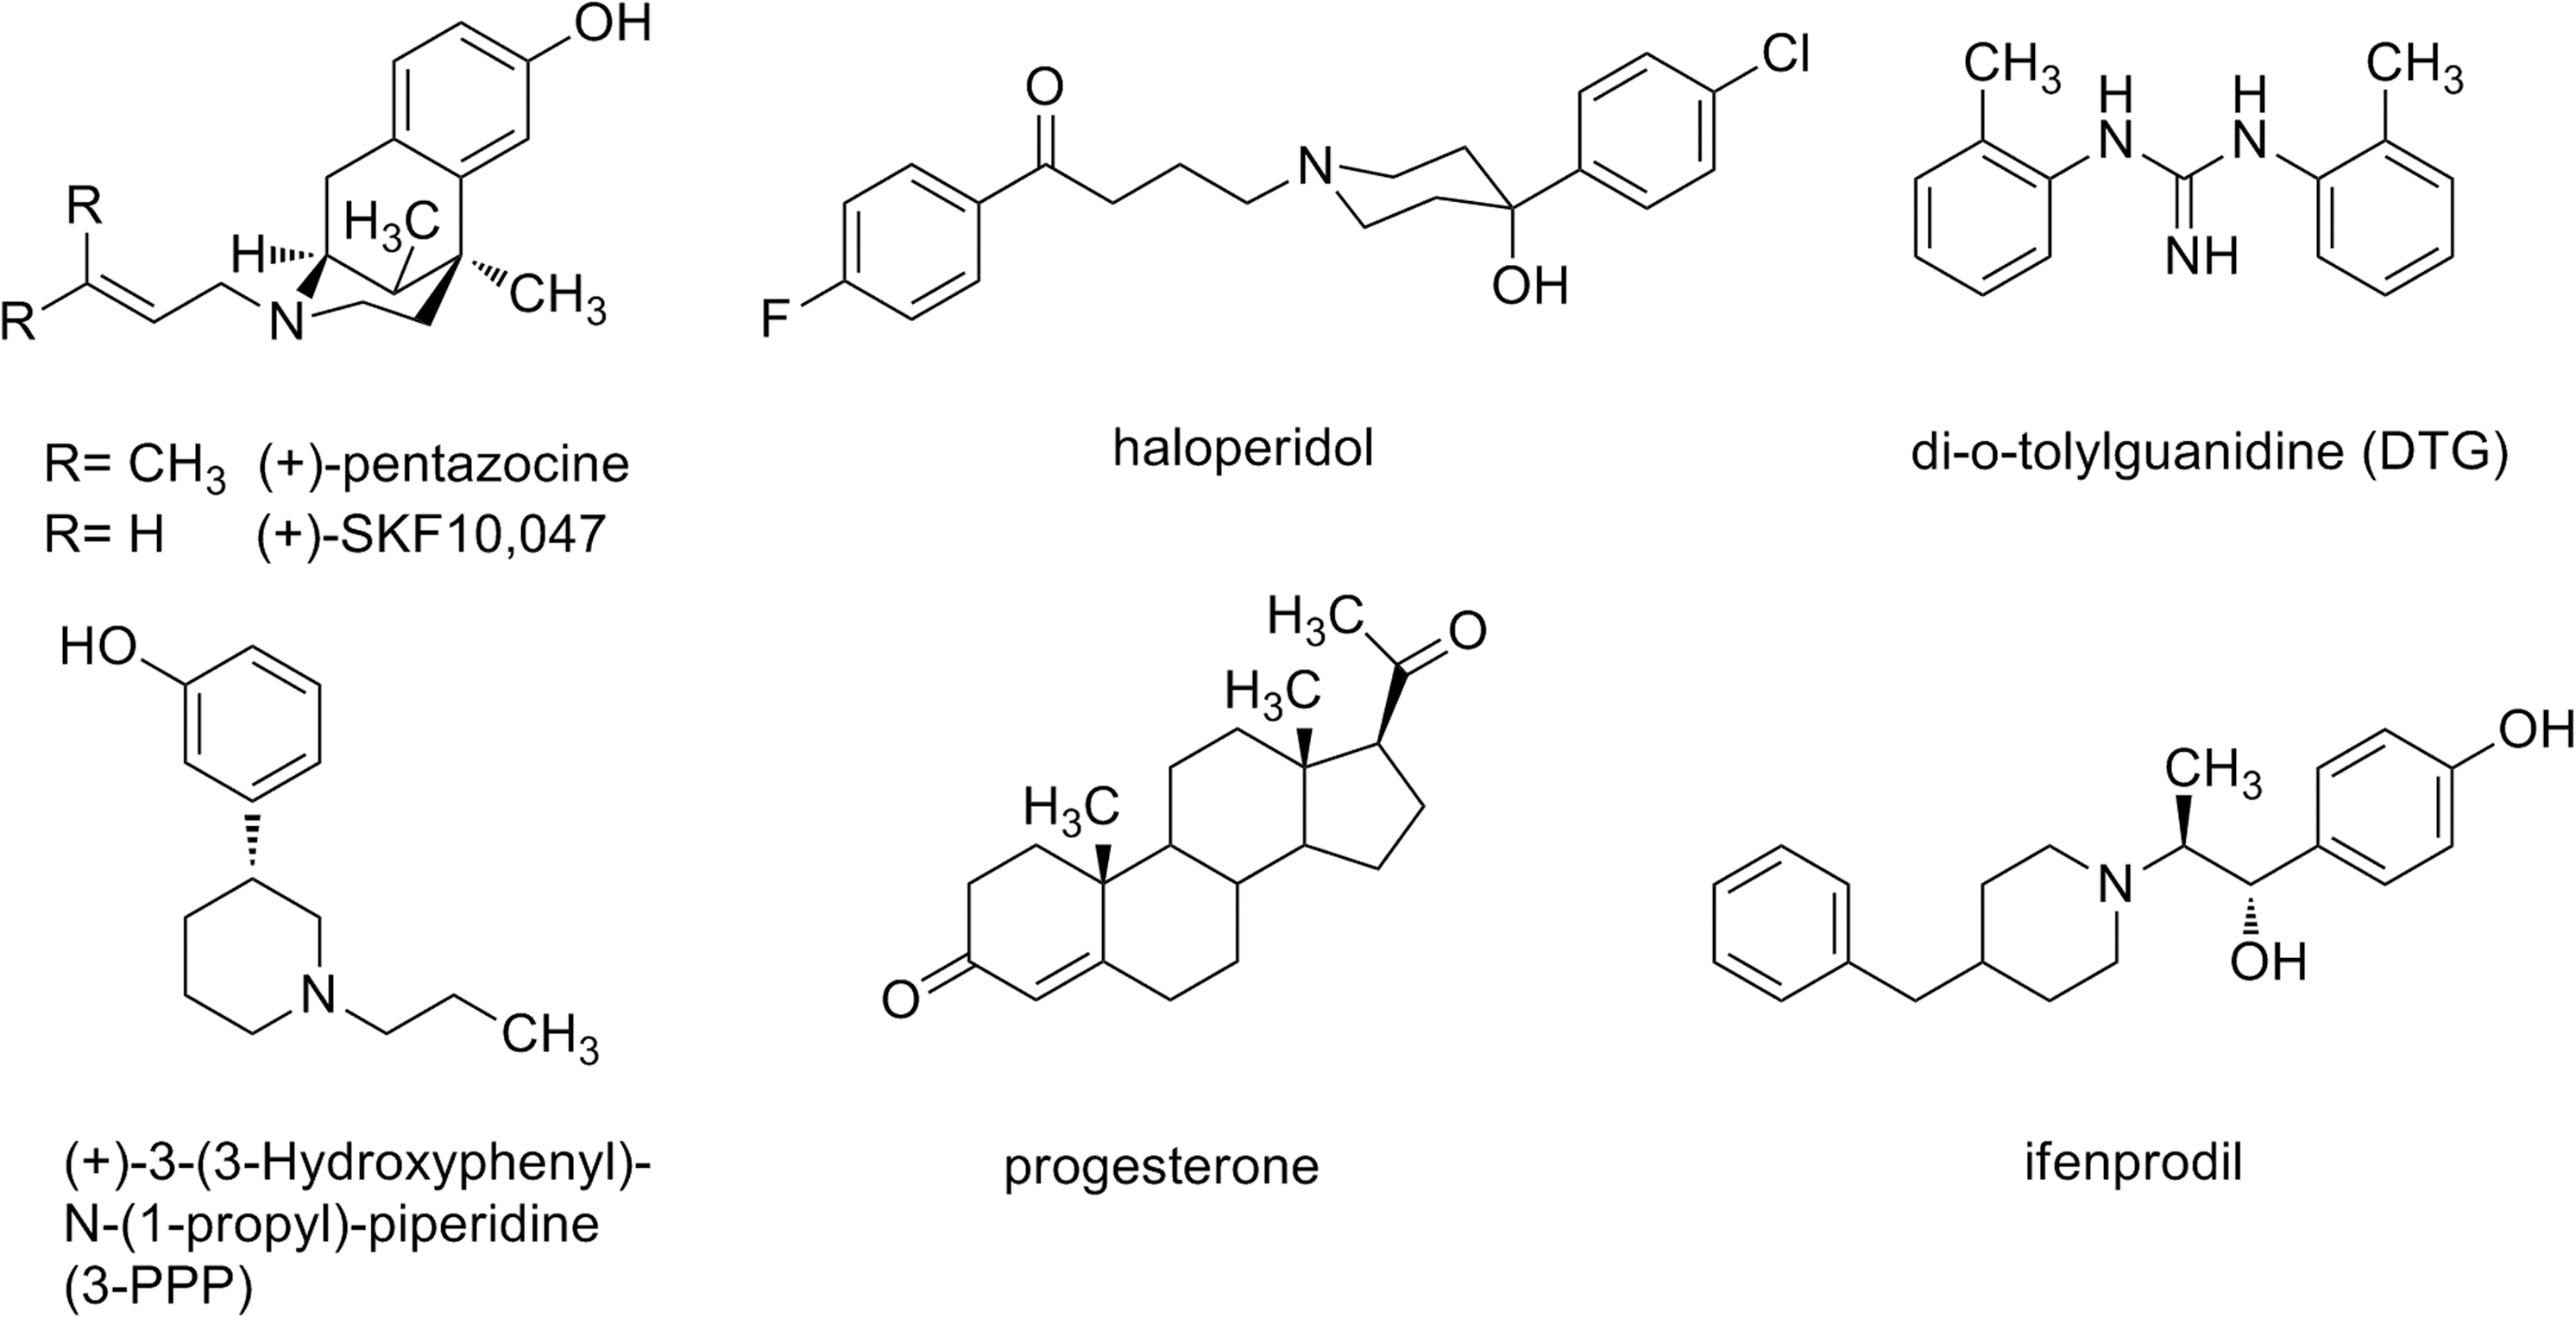
Structures of σ receptor ligands used as reference compounds.
Possible indications of σ1 ligands are psychiatric disorders like depression, anxiety, schizophrenia, Alzheimer's disease, drug abuse, and pain 27,28 as the σ1 receptor density in the CNS is very high. Additionally, antipsychotic drugs like haloperidol bind to σ receptors and recent studies demonstrated a depressive-like phenotype of σ1 knockout mice. 29 Furthermore, the gene encoding for σ1 receptors is located on chromosome 9, which is associated with some psychiatric disorders mentioned previously. 10 In further potential applications, the σ1 receptor overexpression in several tumor tissues could be exploited. Therefore, σ1 ligands could be employed in tumor diagnosis by using different imaging techniques or for tumor therapy using σ1 ligands with additional antiproliferative and cytotoxic activity. 30,31
Several tumor cell lines like MDA-MB-231, -361, -435, 22 SKN-N-SH, 20 and others express the σ1 receptor in high density. Some cell lines (e.g., T47D, NCI-H727, and A375) show two binding sites for [3H]-(+)-pentazocine, a low affinity and a high affinity binding sites, 20 which make these cell lines unsuitable for a routine assay. The σ1 receptor expression of many tumor cell lines has been characterized but the routine assays for determination of the σ1 affinity of new compounds are performed with homogenates from guinea pig brain. In 2008, a σ1 assay with the breast cancer cell line MCF-7 was described. 32 Its σ1 receptor expression was controversially discussed. 21,32 The native cell line was supposed not to have any endogenous σ1 receptors. Therefore it was stably transfected with the human σ1 receptor DNA and then employed as human σ1 receptor material in a σ1 assay.
During the last years, we have developed potent σ1 receptor ligands that were pharmacologically investigated in receptor binding assays using [3H]-(+)-pentazocine as radioligand and receptor membrane preparation from guinea pig brain. 33 –37
Herein, we report on the development of a new σ1 assay, based on the commercially available hematopoietic tumor cell line RPMI 8226 derived from human multiple myeloma. 38 This cell line was found to express the σ1 receptor in high density. The advantage of the cell line RPMI 8226 is that the cell material is more homogenous than that of tissue homogenates resulting in better standardized receptor material. Furthermore, animal tissue is no longer required and new compounds can be directly optimized for the human σ1 receptor instead of guinea pig receptors. In contrast to the σ1 assay with the stable transfected MCF-7 cell line mentioned previously, RPMI 8226 cells are human tumor cells that naturally express σ1 receptors and do not pose the risk of silencing or removal of the inserted σ1 receptor gene. Additionally, this cell line offers the possibility for exploring the signal transduction pathway, which still remains to be fully understood.
Materials and Methods
Cell Culture and Preparation of Membrane Homogenates from RPMI 8226 Cells
RPMI 8226 cells were purchased from DSMZ (German Collection of Microorganisms and Cell Cultures, Braunschweig, Germany). The cells were grown in RPMI 1640 (Biochrom AG, Berlin, Germany) medium containing 10% of standardized fetal calf serum. The partially adherent cells were detached by scraping for splitting (1:2/1:4) and harvesting that was done every 3–4 days when the number of cells reached approximately 1,000,000 cells/mL. The cells were pelleted by centrifugation (5 min, 4°C, 200 g, Hettich Rotina 35R centrifuge; Tuttlingen, Germany); the pellet was washed with 10 mL phosphate-buffered saline (PBS; Biochrom AG, Berlin, Germany) and resuspended in a defined volume of tris(hydroxymethyl)aminomethane (TRIS) buffer (pH 7.4; 50 mM) to achieve a standardized suspension containing 6,000,000 cells/mL. Standardization was performed by cell counting using an improved Neubauer's counting chamber (VWR, Darmstadt, Germany). The cells were lysed and homogenized by sonication at volumes between 25 mL and 30 mL (3×10 s cycles with breaks of 10 s, Soniprep 150; MSE, London, United Kingdom) and the membrane fragment suspension was stored at −80°C (6,000,000 cells/mL in a volume of 25–30 mL). The sonicated membranes are stable to freezing and thawing. Stability could be assured for 6 months.
Western Blot Analysis of σ1 Receptor Expression
Samples from receptor preparation with 2,000,000 cells, 1,000,000 cells, 600,000 cells, and 300,000 cells were taken. Membrane fragments were pelleted by centrifugation (5 min, 4°C, 14,000 rpm; Eppendorf Centrifuge, Hamburg, Germany) and the pellet was resuspended in 10 μL of double-distilled water. Five microliters of lysis buffer (containing Tris 130 mM, sodium dodecyl sulfate [SDS] 10%, 2-mercaptoethanol 10%, glycerol 20%, and bromophenol blue 0.06%) was added and the samples were digested for 10 min at 95°C (Thermomixer compact; Eppendorf). The proteins were separated by SDS-polyacrylamide gel electrophoresis (PAGE) 39 (15% polyacrylamide gel) and blotted on a nitrocellulose membrane (Hydrobond™-ECL™; GE Healthcare Europe GmbH, Freiburg, Germany) by using semidry Western blot method 40 (Trans-Blot® SD; Bio-Rad, Hercules, CA). The blot was incubated with blocking solution (5% skim milk solution in PBS-Tween: 137 mM NaCl, 2.7 mM KCl, 4.3 mM Na2HPO4, and 1.4 mM KH2PO4, pH 7.4, containing 0.05% Tween® 20) for 1 h. This step was followed by incubation with the first antibody (rabbit polyclonal to opioid receptor sigma1; Abcam, Cambridge, United Kingdom) in dilution 1:100 in 5% skim milk solution overnight at 4°C. After washing the blot (4×10 min) with PBS-Tween (0.05% Tween 20), it was incubated with the second antibody (antirabbit antibody; Promega, Madison, WI) for 1 h and washed again 4×10 min with PBS-Tween (0.05% Tween 20). Thereafter the blot was incubated with a mixture of detection reagents 1 (Peroxide Solution; Thermo Scientific, Rockford, IL) and 2 (Luminol Enhancer Solution; Thermo Scientific) to start luminescence reaction. Detection was performed with Cawomat 2000 IR (Ernst Christiansen GmbH, Planegg, Germany).
Protein Determination
The protein concentration of the preparation was required to calculate the σ1 receptor density from B max-value and to check the reproducibility of the cell number. The method of Lowry 41 was used to determine protein concentration. Bovine serum albumin was used in concentrations from 0.1 to 10 mg/mL for the calibration of the method. Samples from different receptor preparations were employed after standardization of the cell number (10,000,000 cells/mL) and 1:10 dilution with 4-(2-hydroxyethyl)piperazin-1-ethanesulfonic acid (HEPES) buffer (pH 7.4; 10 mM HEPES; 2 mM Na2EDTA). First the samples were incubated with a mixture of 100 parts reagent A (2% Na2CO3 in 0.1 M NaOH), 1 part of reagent B (1% CuSO4), and 1 part of reagent C (2.7% K-Na-tartrate) for 10 min, afterward 100 μL of Folin reagent (sodium 1,2-naphthoquinone-4-sulfonate) was added. After incubation of the samples at room temperature for 35 min, the ultraviolet absorption was measured at λ=595 nm.
Protocol of the σ1 Assay Using Homogenates from Guinea Pig Brains 33 –37
Five guinea pig brains were homogenized with the potter (500–800 rpm, 10 up-and-down strokes) in 6 volumes of cold 0.32 M sucrose. The suspension was centrifuged at 1,200 g for 10 min at 4°C. The supernatant was separated and centrifuged at 23,500 g for 20 min at 4°C. The pellet was resuspended in 5–6 volumes of assay buffer (TRIS buffer, pH 7.4, 50 mM) and centrifuged again at 23,500 g (20 min, 4°C). This procedure was repeated twice. The final pellet was resuspended in 5–6 volumes of buffer, the protein concentration was determined according to the method of Bradford 42 using bovine serum albumin as standard, and subsequently the preparation was frozen (−80°C) in 1.5 mL portions containing about 1.5 mg protein/mL. The assay was performed with the radioligand [3H]-(+)-pentazocine (22 Ci/mmol; Perkin Elmer, Boston, MA). The thawed membrane preparation (about 75 μg of the protein) was incubated with various concentrations of test compounds, 2 nM [3H]-(+)-pentazocine, and assay buffer in a total volume of 200 μL for 120 min at 37°C. The incubation was terminated by rapid filtration through the presoaked filter mats by using the cell harvester. After washing each well five times with 300 μL of water, the filter mats were dried at 95°C. Subsequently, the solid scintillator was put on the filter mat and melted at 95°C. After 5 min, the solid scintillator was allowed to solidify at room temperature. The bound radioactivity trapped on the filters was counted in the scintillation analyzer. The nonspecific binding was determined with 10 μM unlabeled (+)-pentazocine. The K d-value of the radioligand [3H]-(+)-pentazocine is 2.9 nM. 43
Ligand Binding Assay Using Homogenates from RPMI 8226 Cells
Identical to the previously described guinea pig brain assay, a solution of the radioligand [3H]-(+)-pentazocine (specific activity 29–50 Ci/mmol; ARC, St. Louis, MO) in assay buffer (TRIS buffer, pH 7.4, 50 mM) was used for both association and competition experiments at a final concentration of 2 nM. Cell membrane preparations (50 μL, corresponding to approximately 300,000 cells per well or 200 μg protein) were incubated in 96-well multiplates in a total volume of 200 μL per well. A single well contained 50 μL of cell membrane preparation and 50 μL of the radioligand [3H]-(+)-pentazocine. For the determination of nonspecific binding, 50 μL of assay buffer and 50 μL of haloperidol (final concentration 10 μM per well) were added. Total binding was determined by addition of 100 μL assay buffer. Measurement of competitive binding curves is described in the corresponding section below. Unless otherwise stated, assay incubations were performed for 2 h at 37°C with continuous shaking as described for the guinea pig assay. The incubation process was terminated by filtration using filter mats (Filtermat B; Perkin Elmer), which were presoaked in 0.2% aqueous polyethylenimine for 2 h at room temperature. Each well was washed 8 times with 300 μL of water. The filter mats were dried and solid scintillator (MeltiLex® B; Perkin Elmer) was melted on the filter mat at 95°C. The bound radioactivity was counted in the scintillation analyzer (Microbeta Counter; Perkin Elmer). The overall counting efficiency was 20%.
Determination of Optimal Amount of Cells for the Assay
The nonspecific binding of the radioligand was defined in the presence of the competitors (+)-pentazocine, haloperidol, and DTG (10 μM). To determine the optimal amount of cells, nonspecific and total binding were measured with different cell amounts over a wide range (10,000–50,000 cells per well). The ratio of nonspecific binding and total binding was then determined at each concentration of cells added.
Determination of the Required Incubation Time and the Optimal Temperature
To determine the optimal assay temperature for binding experiments, competitive binding curves were recorded for the σ1 ligands (+)-pentazocine, haloperidol, and DTG as described in the “Competitive Experiments” section. Incubations were performed for 2 h (standard time in the guinea pig brain assay) at 20°C, 30°C, and 37°C. The time required for the concentration of [3H]-(+)-pentazocine (2 nM) employed in the competition assays to reach equilibrium was determined by incubation at 37°C with continuous shaking. Incubation times were varied from 15 to 135 min. Nonspecific binding as well as total binding were measured for each experiment.
Saturation Experiments for σ1 Receptors
In saturation experiments, nonspecific binding and total binding were measured at increasing concentrations of radioligand [3H]-(+)-pentazocine (0.5–60 nM). The measurements with radioligand concentrations of 300 nM and 600 nM were performed with 1:5 and 1:10 dilutions of the radioligand with nonlabeled (+)-pentazocine, respectively. 44 Incubations were performed for 2 h at 37°C in a total reaction volume of 200 μL, comprising 50 μL radioligand in different concentrations, 50 μL membrane preparation (approximately 300,000 cells per well or 200 μg of protein), and for the determination of nonspecific binding 50 μL TRIS buffer (pH 7.4; 50 mM) plus 50 μL of (+)-pentazocine (40 μM). For the determination of total binding, 100 μL TRIS buffer was added. K d and B max were calculated as described in the “Data Analysis” section.
Saturation Experiments for σ2 Receptors
The σ2 receptor density was determined as described previously for the determination of the σ1 receptor density (2 h incubation at 37°C) but with [3H]-DTG as radioligand (specific activity 50 Ci/mmol; ARC) in TRIS buffer (pH 8.0; 50 mM). In saturation experiments, nonspecific binding and total binding were measured at increasing concentrations of radioligand [3H]-DTG (0.5–40 nM). For the measurements at higher concentrations (100 nM, 200 nM), the radioligand was diluted 1:5 with nonlabeled DTG. 44 The total assay volume of 200 μL contained 50 μL radioligand in different concentrations, 50 μL membrane preparation (approximately 300,000 cells per well), 50 μL (+)-pentazocine (2 μM) to avoid DTG binding to σ1 receptors, and for the determination of nonspecific binding 50 μL DTG (40 μM). For the determination of total binding 50 μL TRIS buffer (pH 8.0; 50 mM) were added instead of DTG. K d- and B max-values were calculated as described in the “Data analysis” section.
Competition Experiments: Determination of K i -Values of Reference Compounds and Validation of the Assay
The optimized assay conditions (2 h incubation time at 37°C, 300,000 cells per well) were used to determine the K i-values of known σ1 ligands. The following σ1 ligands were tested: (+)-pentazocine, haloperidol, DTG, (+)-3-(3-hydroxyphenyl)-1-propylpiperidine (3-PPP), progesterone, and ifenprodil (Fig. 1). Competition curves were constructed with increasing concentrations of competitor compound at semilog unit intervals over a wide concentration range (0.1 nM–10 μM, 11 concentrations; Fig. 7). For the validation process and in the routine assays, six concentrations spaced at log unit intervals were employed over an identical concentration range (0.1 nM–10 μM), which gave comparable IC50- and K i-values. Table 1 provides a short overview of the optimum assay conditions in competitive binding experiments. All measurements were performed in triplicates with two different receptor preparations. Each receptor preparation was measured on three different days with each of the six reference compounds. The IC50-values and K i-values were calculated as described in the “Data analysis” section.
Assay Protocol Table for RPMI 8226
1–6. 96-well plates were used with a total volume per well was 200 μL; the stated volumes in the table apply to one well.
TRIS, tris(hydroxymethyl)aminomethane.
Competitive Experiments: Determination of K i -Values of σ1 Ligands with Different Chemical Structures
Competitive binding curves were generated as described previously. The structures of investigated σ1 ligands are summarized in Figure 2. The σ1 ligands were selected from different compound classes: aminoethyl-1,3-dioxanes (WMS-0814 and WMS-0824), 45 bridged piperazines (WMS-1119, WMS-1157, and WMS-1158), 46 as well as spirocyclic piperidines (WMS-1801, WMS-1813, and WMS-1828). 47,48 The level of specific binding at each concentration of competitor was determined in triplicates.
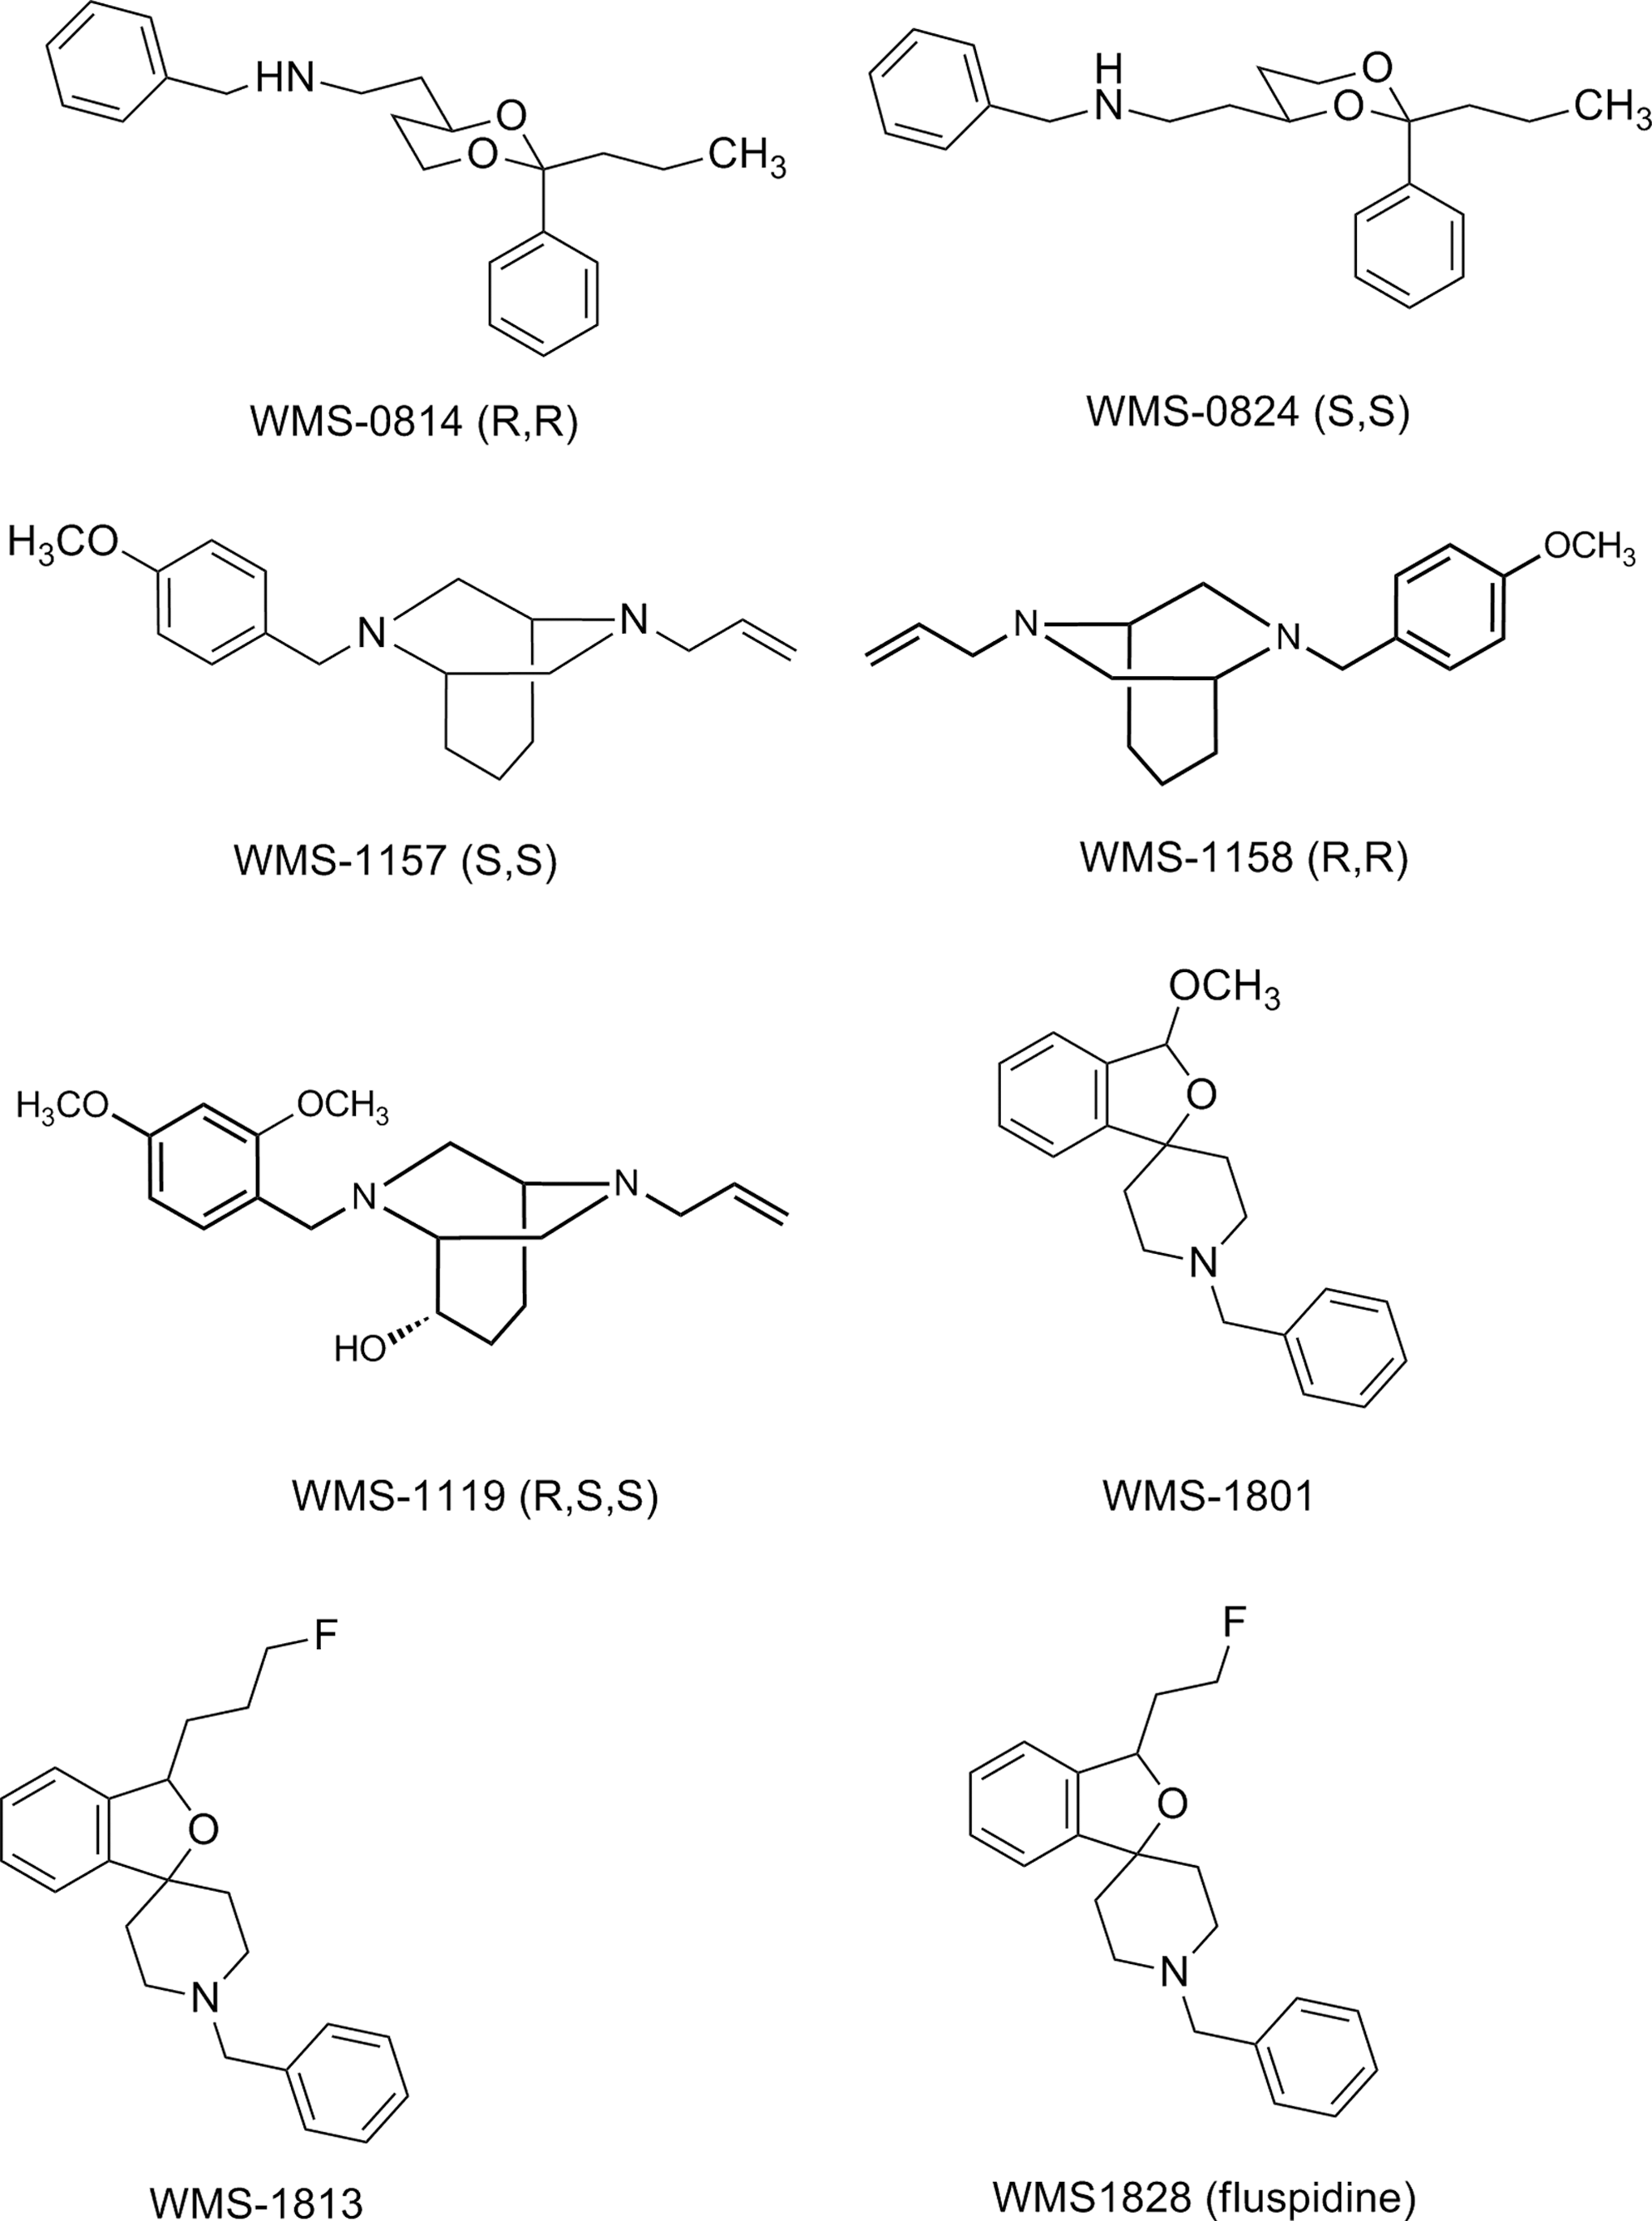
σ1 ligands with different structures employed in the σ1 assay. WMS-0814 and WMS-0824: 4-aminoethyl-1,3-dioxanes; WMS-1157, WMS-1158, WMS-1119: bridged piperazines; WMS-1801, WMS-1813, WMS-1828: spirocyclic σ1 ligands.
Data Analysis
Data analysis was performed with SigmaPlot® Software, Version 11 (SigmaPlot Software, San Jose, CA) except for the association experiment shown in Figure 4. Curve fitting of the association experiment was carried out by “one phase exponential association” with GraphPad Prism Software, Version 3 (GraphPad Prism Software, Avienda de la Playa La Jolla, CA). Analyses of the saturation experiments were made by nonlinear regression using the “one-site-saturation” calculation method. The IC50-values were determined by nonlinear regression using the “one-site-competition” calculation method. Subsequently, the K i-values of the compounds were calculated according to the equation of Cheng and Prusoff. 49 The K i-values are given as mean values from three independent experiments±standard error of the mean (SEM). Table 2 shows the equations that were used for the calculation of B max-, K d-, K obs-, IC50- and K i-values.
Equations for the Calculation of the Binding Parameters
Results and Discussion
Western Blot Analysis
To analyze the σ1 receptor expression of RPMI 8226 cells, a Western blot analysis was performed. For this purpose, cells were lysed, the proteins were separated by SDS-PAGE, transferred to a nitrocellulose membrane, and immunodetected with an antibody that selectively reacts with the σ1 receptor. The Western blot analysis shows that the tumor cell line RPMI 8226 expresses the σ1 receptor. Figure 3 shows two bands in each track. The first band at 26 kDa corresponds exactly to the molecular weight of the σ1 receptor. The second band was detected at approximately 53 kDa, which is supposed to be a dimer of the σ1 receptor or an adduct of the σ1 receptor with an unknown protein with a molecular weight of approximately 26–30 kDa. Nevertheless, analysis of the saturation experiments led to a single saturable binding site for [3H]-(+)-pentazocine.
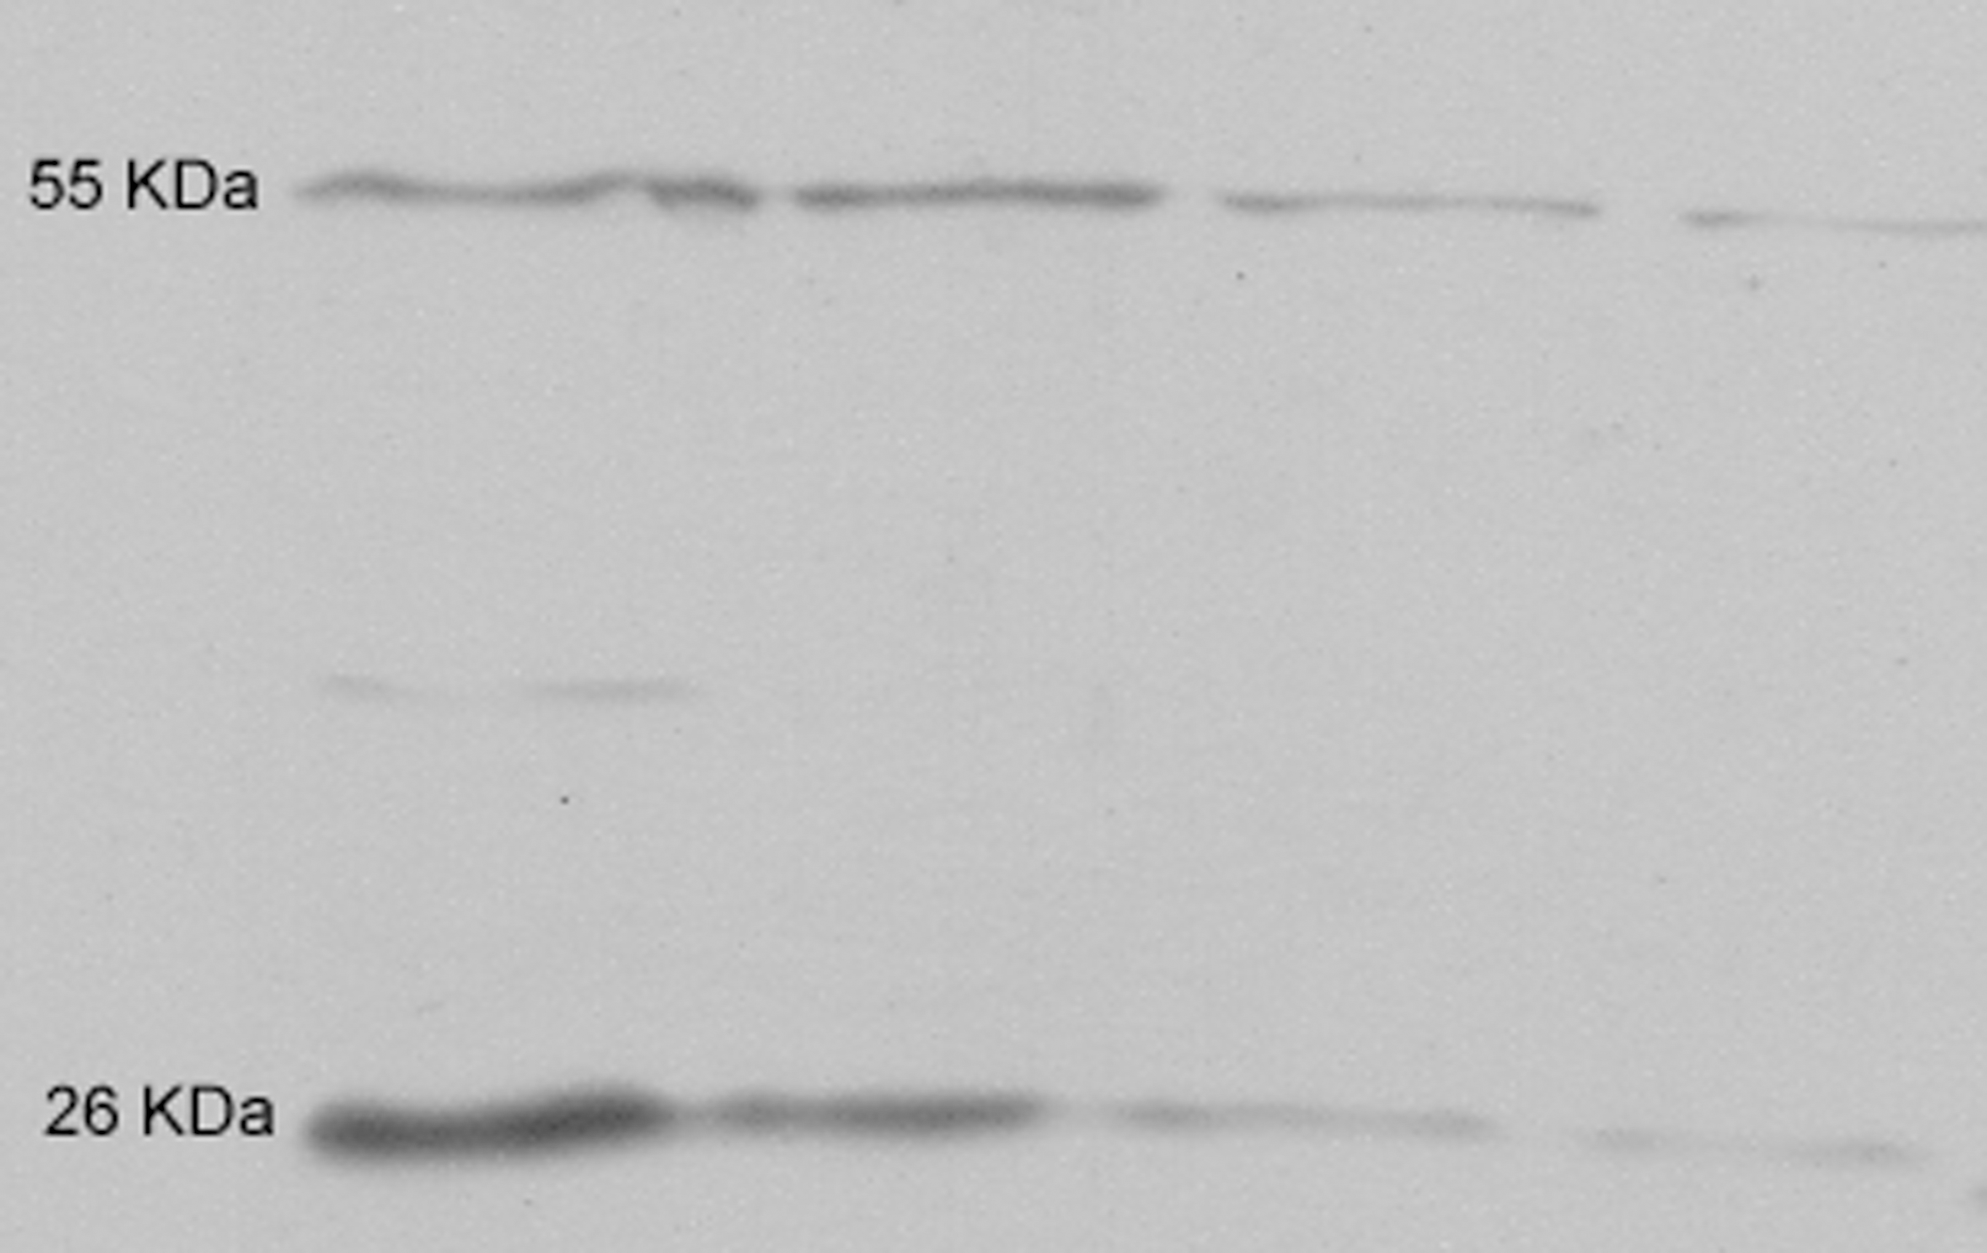
Western blot analysis of RPMI 8226 cells. Track 1: preparation from 2,000,000 cells; Track 2: preparation from 1,000,000 cells; Track 3: preparation from 600,000 cells; Track 4: preparation from 300,000 cells. Detection with OPRS1 antibody against N-terminus of the σ1 receptor.
Determination of Optimum Assay Conditions
Optimum assay conditions were determined by varying cell number (10,000–500,000 cells per well), temperature (20°C, 30°C, and 37°C), and assay incubation time (15–135 min). The aim was maximizing the total binding and minimizing the ratio of nonspecific binding to total binding in order to generate reproducible sigmoid binding curves with a low standard error.
To determine the optimum cell amount, the total binding and nonspecific binding were measured with preparations originating from different cell amounts (10,000–500,000 cells per well). An optimum ratio between total binding and nonspecific binding (e.g., 6.95%±0.4%, SEM of n=9) was achieved after an incubation time of 120 min at 37°C with a preparation resulting from 300,000 cells per well, which refers to a protein amount of 200 μg per well.
To find an appropriate competitor, (+)-pentazocine, haloperidol, and DTG (10 μM) were tested as competitors for determination of nonspecific binding. A significant difference between these competitors was not recognized. Finally haloperidol was chosen for routine experiments because it is generally preferable to use a competitor that structurally differs from the radioligand.
The time required for the concentration of [3H]-(+)-pentazocine (2 nM) employed in the competition binding experiments to reach equilibrium was determined in an association experiment. The total binding and nonspecific binding of the radioligand were determined after different incubation periods. A receptor preparation from 300,000 cells per well was added to the complete reaction mixture for recording nonspecific binding as well as total binding. In Figure 4 the development of the association of the radioligand [3H]-(+)-pentazocine is shown. The association constant K obs calculated using equation 2 (Table 2) was 0.0246 min−1. After 60 min a plateau of the total binding was achieved, indicating the minimum incubation time required. Prolongation of the incubation time resulted in almost the same total binding and nonspecific-to-total binding ratio. A decay of specific binding was not observed during the time frame ruling out a degradation or digestion of the receptor protein. Therefore, the addition of a protease inhibitor to the assay buffer was not necessary. To ensure that the experiments were performed under equilibrium conditions, an incubation time of 120 min was chosen.
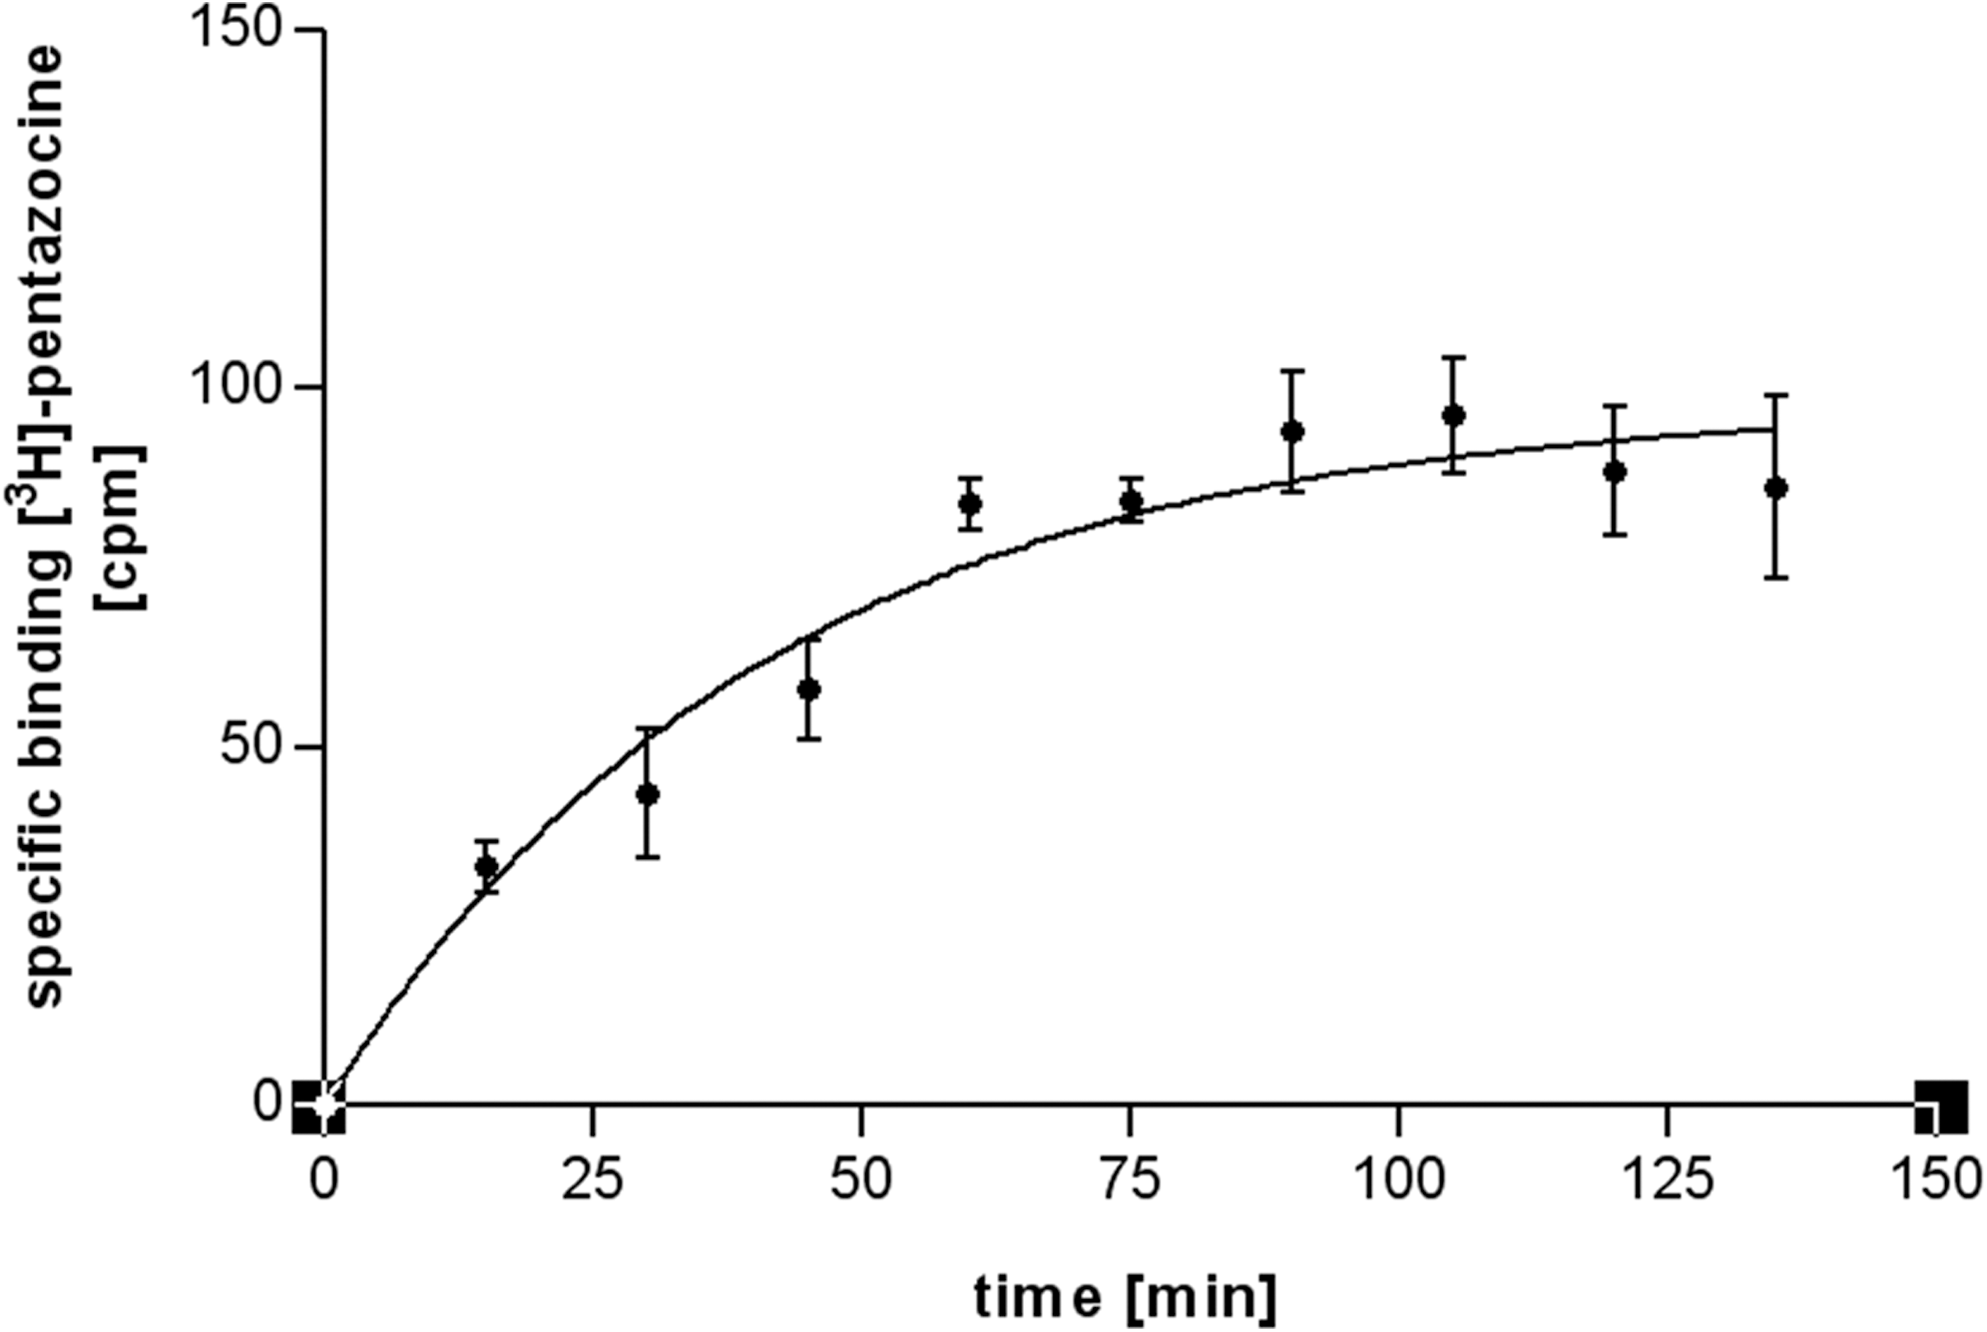
Association experiment with [3H]-(+)-pentazocine using membrane preparations of RPMI 8226 cells leading to K obs=0.0246 min−1 (300,000 cells per well or 200 μg of protein; concentration of [3H]-(+)-pentazocine 2 nM; incubation at 37°C; error bars result from triplicates; for equations see Table 2).
Furthermore, incubations at different temperatures were studied. Competitive binding curves were recorded at 20°C, 30°C, and 37°C. The lowest ratio of nonspecific binding to total binding of 4.8% and the highest total binding were detected at 37°C. Therefore all further experiments were performed at 37°C.
In conclusion, a membrane preparation originating from 300,000 cells per well that equates to 200 μg of protein was used in the following experiments. Haloperidol (10 μM) was employed as competitor for determination of nonspecific binding and the incubations were performed for 2 h at 37°C. As the current assay is identical in radioligand, radioligand concentration, incubation time, and incubation temperature to the guinea pig brain assay routinely used by us and other groups, the data are readily comparable.
Determination of the B max - and the K d -Values by Saturation Experiments
The B max- and K d-values in the σ1 system were determined with the highly selective σ1 agonist [3H]-(+)-pentazocine and in the σ2 system with the mixed σ1/σ2 ligand DTG in the presence of an excess of (+)-pentazocine (2 μM) to block σ1 receptors. The B max-value defines the density of σ receptors in the preparation, whereas the K d-value indicates the affinity of the radioligand to the σ receptor. The saturation experiments were performed under optimized assay conditions with 11 (σ1 receptor) and 8 (σ2 receptor) different concentrations of the radioligand, respectively.
Representative saturation experiments are shown in Figures 5 and 6 resulting in K d-value of 36 nM and B max-value of 484 fmol/mg for σ1 receptors and in K d-value of 11 nM and B max-value of 396 fmol/mg for σ2 receptors. A mean K d-value of 36±0.3 nM and B max-value of 477±7 fmol/mg for [3H]-(+)-pentazocine and a mean K d-value of 12±3 nM and B max-value of 371±25 fmol/mg for [3H]-DTG were obtained from three separate experiments. The amount of σ1 receptors was calculated from B max-value taking the specific activity of the radioligand and the amount of protein into account. These calculations led to approximately 122,000 copies of σ1 receptors in each cell. The K d-value is approximately 10-fold higher than the K d-value obtained with guinea pig brain preparations (K d=2.9 nM), but it is comparable with the K d-value of [3H]-(+)-pentazocine found in other cell lines expressing human σ1 receptors. For example, a K d-value of 28±5.8 nM was obtained in SK-N-SH neuroblastoma cells. 20
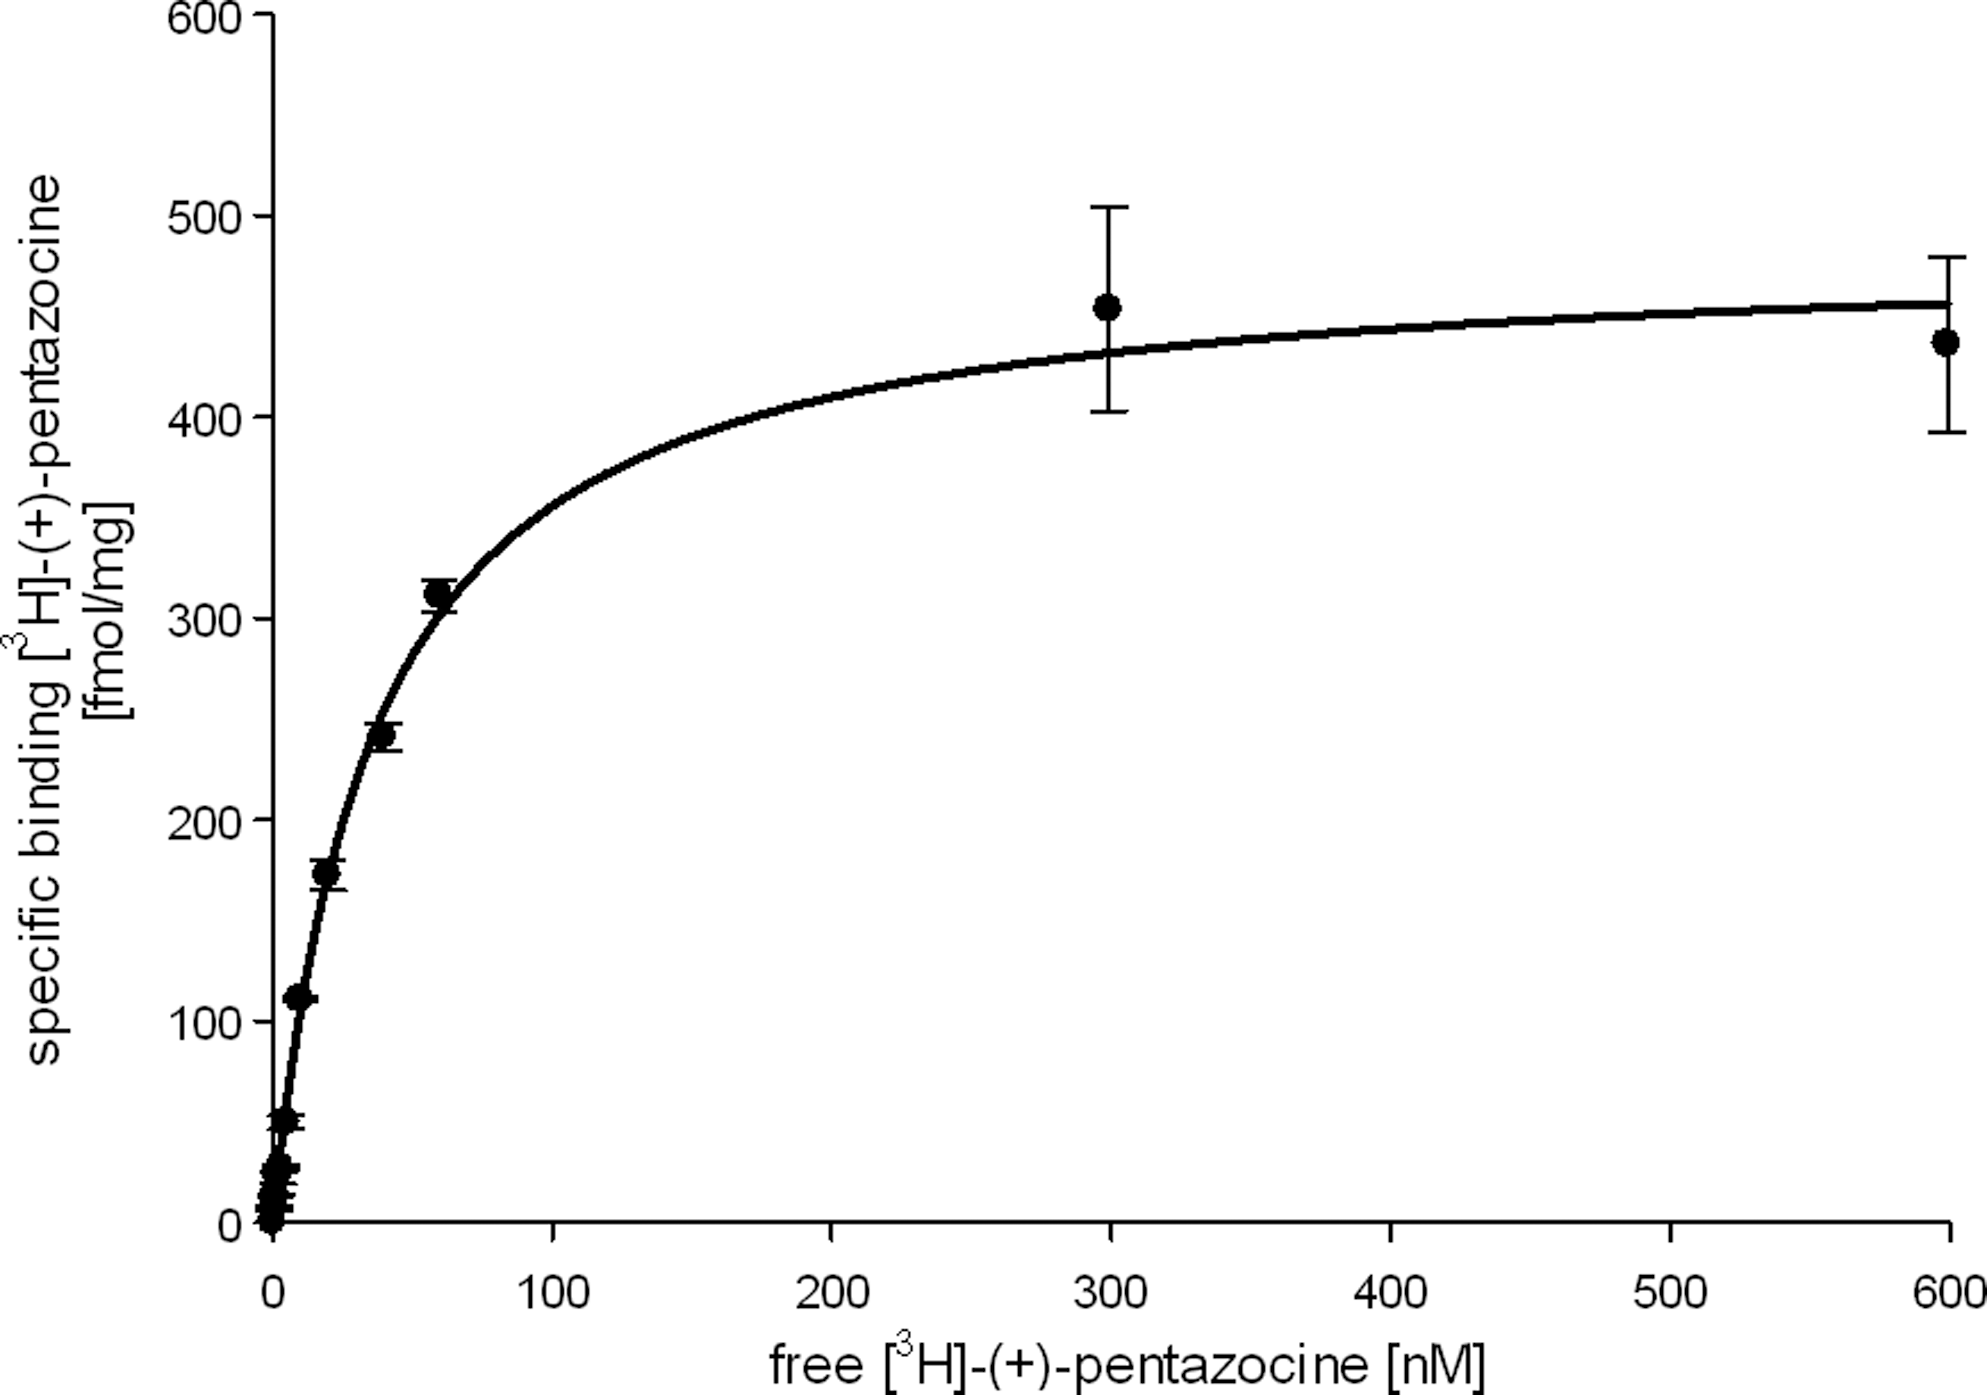
Saturation binding of [3H]-(+)-pentazocine to σ1 receptors. Increasing concentrations of [3H]-(+)-pentazocine were incubated at 37°C for 2 h with membranes from human RPMI 8226 cells expressing the human σ1 receptors. Nonspecific binding was defined by adding 10 μM haloperidol to the reaction mixtures. Data are representative of three separate experiments performed in triplicate. Each data point is the mean±SEM. This experiment led to a K d-value of 36 nM and a B max of 484 fmol/mg. SEM, standard error of the mean.

Saturation binding of [3H]-DTG in the presence of (+)-pentazocine. Increasing concentrations of [3H]-DTG in the presence of (+)-pentazocine were incubated at 37°C for 2 h with membranes from human RPMI 8226 cells expressing human σ2 receptors. Nonspecific binding was defined by adding 10 μM DTG to the reaction mixtures. Data were recorded in triplicate and each data point is the mean±SEM. This experiment led a K d-value of 11 nM and a B max-value of 395 fmol/mg. DTG, di-o-tolylguanidine.
The ratio between σ1 and σ2 receptors was found to be 56:44, but the density of σ2 receptors is not relevant for the σ1 assay, because the highly σ1 selective radioligand [3H]-(+)-pentazocine does not interact with σ2 receptors.
Determination of σ1 Affinities Using RPMI 8226 Cell Preparations
K i-values for reference and test compounds were determined through incubation of radioligand and receptor preparation with increasing concentrations of competitor (0.1 nM–10 μM, 11 concentrations) to generate initial K i-values (Fig. 7). For the validation process and in routine assays, only 6 concentrations of competitor were employed over this same concentration range, since comparable K i-values were obtained with either 11 or 6 competitor concentrations.

Exemplary competition curves.
For the validation of the RPMI 8226 cell–based σ1 assay, the K i-values of six standard σ1 receptor ligands (for structures, see Fig. 1) were recorded. The competition curves of these reference compounds (11 concentrations) are shown in Figure 7. In Table 3, the resulting K i-values are summarized and compared with those obtained in the standard guinea pig brain membrane assay. K i-values obtained for reference ligands in the human RPMI 8226 cell membrane–based assay were comparable with the values generated in the guinea pig assay. However, the K i-values in the RPMI 8226 assay are generally about two- to fourfold higher than the K i-values in the guinea pig brain assay. Only progesterone showed a K i-value that is approximately the same in the RPMI 8226–based assay. This could result from the different structure of progesterone compared with the other σ1 receptor ligands, since progesterone as steroid does not contain a basic group, whereas all other σ1 receptor ligands are basic compounds. Furthermore, progesterone shows rather low σ1 affinity compared with the other σ1 receptor ligands resulting in a higher SEM value.
K i-Values of Reference Compounds Measured with Receptor Preparations from RPMI 8226 Cells and Guinea Pig Brains
The data presented are means±standard error of the mean (n≥3).
SEM, standard error of the mean.
The established assay was used to record σ1 affinities of potent σ1 ligands prepared in our group. In Table 4, the K i-values of a series of compounds from different compound classes were compared with the K i-values measured with guinea pig brain preparations. The K i-values were measured as triplicates and all experiments were repeated at least three times.
K
i-Values of Potent
The data presented are means±SEM (n≥3).
Inhibition of radioligand binding at a competitor concentration of 1 μM.
WMS-1119 represents a compound with very low σ1 affinity. In the guinea pig brain assay, 0% inhibition of the radioligand binding was observed at a test compound concentration of 1 μM. Almost the same result was obtained with the RPMI 8226 cells: a concentration of 1 μM of WMS-1119 led to 17% inhibition of [3H]-(+)-pentazocine binding.
The K i-values of the aminoethyl-1,3-dioxanes (WMS-0814 and WMS-0824) are similar in both assay systems. A two- to fourfold lower affinity was observed for the spirocyclic piperidines WMS-1801, WMS-1813, and WMS-1828 in the RPMI 8226 assay compared with the guinea pig brain assay, which is in good accordance with the results obtained with the reference compounds (Table 3). The very high affinity of the spirocyclic piperidines in the guinea pig brain assay was confirmed in the RPMI 8226 assay.
In both assays the enantiomeric-bridged piperazines WMS-1157 and WMS-1158 show lower σ1 affinities than the spirocyclic piperidines WMS-1801, WMS-1813, and WMS-1828. Whereas both enantiomers WMS-1157 and WMS-1158 are almost equipotent in the RPMI 8226 assay, the (S,S)-configured enantiomer WMS-1157 is greater than 20-fold more active than the (R,R)-configured enantiomer WMS-1158 in the guinea pig brain assay. Obviously, the guinea pig σ1 receptor is able to differentiate between the enantiomers, whereas the human σ1 receptor cannot.
Generally, for most of the investigated compounds, the K i-values determined in the RPMI 8226 assay are two- to fourfold higher than those determined in the guinea pig brain assay. Only one compound (WMS-1158) shows a different binding profile in the RPMI 8226–based assay. The sequences of the human and guinea pig σ1 receptors are 93% identical and 97% similar. The differences in the amino acid sequence may result in different conformations and different three-dimensional structures of the σ1 receptor proteins leading to different ligand receptor interactions. This hypothesis fosters switching from guinea pig brain receptor material to human σ1 receptors in our standard σ1 receptor binding assay.
Conclusion
A selective σ1 receptor binding assay based on the commercially available human tumor cell line RPMI 8226 was developed. Saturation experiments led to a K d-value of 36±0.3 nM for [3H]-(+)-pentazocine and a B max-value of 477±7 fmol/mg protein. Competitive binding experiments with RPMI 8226 cell membrane preparations provided reproducible K i-values, which are comparable with K i-values determined with standard guinea pig brain preparations. The σ1 assay based on human cell lines has the following advantages over the guinea pig brain–based σ1 assay: (1) animal material is no longer required; (2) the binding properties of new compounds can be optimized directly for the human σ1 receptor; (3) the σ1 receptor is still in its native conformation and surrounding (in contrast to the assay using stably transfected MCF-7 cell lines); (4) receptor material can be produced on demand.
Footnotes
Acknowledgments
This work was supported by the German Research Foundation, which is gratefully acknowledged. The authors also thank Prof. Dr. K.-H. Klempnauer and his coworkers for scientific contribution and technical assistance to this project.
Disclosure Statement
No competing financial interests exist.