
Abstract
A method using multi-mode solid-phase extraction and ultra-high-performance liquid chromatography (UHPLC)–electrospray mass spectrometry was developed to quantify Dicer-substrate small interfering RNA (DsiRNA) directed against the hypoxanthine phosphoribosyltransferase 1 (HPRT1) gene transcript in mouse liver tissue. The oligonucleotides were separated into sense and antisense strands using a UHPLC C18 column with mobile phases containing 1,1,1,3,3,3-hexafluoro-2-propanol in both water (mobile phase A) and methanol (mobile phase B) with triethylamine as the ion pairing agent at a column temperature of 65°C. The lower limits of detection for the sense and antisense strands were ∼1 ng/mg. The dynamic ranges for the sense and antisense strands were 5 ng/mg–1,000 ng/mg and 1 ng/mg–1,000 ng/mg, respectively. The lower limits of quantification for the sense and antisense strands were 5 ng/mg and 1 ng/mg, respectively, each with a relative standard deviation <15% over the range of calibration curve with sufficient precision and accuracy. Oligonucleotides were quantified at different time intervals after intravenous administration of living mice with lipid nanoparticle formulated HPRT1 DsiRNA and were detected as early as 15 min after administration, but not detected beyond the 24 h time point.
Introduction
Preclinical and clinical development of therapeutic oligonucleotides requires the ability to measure oligonucleotides quantitatively in biological matrices in order to implement pharmacokinetic and toxicokinetic studies. A variety of analytical techniques are currently used for this detection and quantification. For example, high-performance liquid chromatography (HPLC) based on ion-pair reversed phase 14 and anion exchange 15 methods has been applied for the detection and quantification of oligonucleotides in biological matrices. HPLC-based methods are robust and easy to use, but the detection and quantification of oligonucleotides is limited due to the low sensitivity of the UV-based detection. 16,17 Higher HPLC sensitivity has been achieved through florescence detection. 18 Capillary electrophoresis (CE) along with ultraviolet (UV) detection has been successfully used to study oligonucleotides in both plasma and tissues, 19 but again, the low sensitivity of UV detection limits its usefulness in Pharmacokinetics (PK) studies. The use of a lazer-induced florescence detection system can increase the sensitivity of CE up to threefold, compared with the UV detection system, enhancing usefulness. 20 Alternatively, hybridization methods based on noncompetitive binding provide both high sensitivity and specificity and can be implemented at high throughput with minimum sample clean-up. 21,22 However, hybridization-based assays tend to have narrow dynamic range, typically <2 orders of magnitude, 22 when compared with HPLC or CE based methods just mentioned. Finally, a quantitative polymerase chain reaction provides the highest sensitivity of all current analytical methods, 23 and may not require sample purification. 24 Unfortunately, it lacks the selectivity required for metabolite quantification.
Liquid chromatography coupled to tandem mass spectrometry as a quantitation method has been widely used in small-molecule drug discovery and development. 25 Due to its high sensitivity and ability to precisely measure masses in the oligonucleotide range, we sought to develop a method that uses ultra HPLC coupled with electrospray ionization mass spectroscopy (UHPLC-ESI-MS) to identify and quantify oligonucleotides in biological matrices. The ability to precisely measure the mass of an oligonucleotide by ESI-MS should allow the confirmation of the presence of an oligonucleotide of a specific elemental composition in a biological sample, as well as an assessment of its purity and the nature of any contaminants, modifications, and metabolites. However, the use of MS for the detection and quantification of oligonucleotides in biological samples, especially tissues, has been limited due to interference from components of the biological matrix and the incompatibility of chromatographic techniques used in the separation of oligonucleotides. For example, attempts to quantify oligonucleotides using mass spectrometry after extraction by solid-phase extraction (SPE) or phenol/chloroform liquid-liquid extraction have shown low recovery and high interference from the biological matrix. 26 Various factors such as pH, cation concentration, and organic solvent content can affect the ionization and sensitivity of the detection of oligonucleotides. The use of ion-pair agents and a strong base in the mobile phase has been shown to suppress adduct formation and enhance the sensitivity of ESI-MS. 27
Using hypoxanthine phosphoribosyltransferase 1 (HPRT1) gene as an example, here, we report an analytical method for the quantification of the sense and antisense strands of oligonucleotides in mouse liver using multi-mode SPE purification and UHPLC-ESI-MS. This method was successfully applied to a DsiRNA PK study in mouse liver. Further application using this approach to preclinical animal studies will shed light on the efficiency of DsiRNA delivery and the mechanism of RNA silencing.
Materials and Methods
Materials and Chemicals
Female mice (mouse strain: CD 1[cluster of differentiation 1]) were supplied by Harlan Laboratories (Indianapolis, IN). HPRT1 sense and antisense oligonucleotides and internal standard (IS)-1 oligonucleotide (a chemically modified oligonucleotide used as an IS) were obtained from Integrated Deoxyribonucleic Acid Technologies (Coralville, IA) (See Table 1 for sequences). 1,1,1,3,3,3-Hexafluoro-2-propanol (HFIP ≥99%) was obtained from TCI America (Portland, OR). Triethylamine (TEA ≥99%) was obtained from Sigma-Aldrich (St. Louis, MO). Methanol, acetonitrile, and water (HPLC grade) were obtained from J.T. Baker (Phillipsburg, NJ). Clarity OTX 100 mg/sorbent 96 well cartridges and sample loading buffer were obtained from Phenomenex (Torrance, CA).
HPRT1 Duplex and Internal Standards Used in the Study
IS, internal standard; HPRT1, hypoxanthine phosphoribosyltransferase 1.
For PK study, the HPRT1 DsiRNA was formulated in stable nucleic acid lipid particles 28 and administered at a concentration of 1 mg of DsiRNA/mL of phosphate-buffered saline.
The UHPLC was a Waters Acquity ultra-high-performance liquid chromatography (LC) system equipped with BEH C18, 1.7 μm, and a 2.1 × 50 mm column, and the mass spectrometer was a Waters (Micromass) Quattro Premier XE mass spectrometer (Waters, Milford, MA).
PK Study
Six- to eight-week-old female CD1 mice (approximately 20–25 g) were used. The mice were held in a pathogen-free environment, and all procedures involving animals were performed in accordance with local, state, and federal regulations as applicable and approved by the Institutional Animal Care and Use Committee. The HPRT1 DsiRNA lipid nanoparticles (LNP) was intravenously administered via the lateral tail vein at a dose level of 10 mg/kg in a total volume of 0.01 mL/g body weight (n=3/group, n=1 for last two time points).
The animals were sacrificed by CO2 asphyxiation at time points of 15 min, 30 min, 1 h, 2 h, 8 h, 24 h, and 72 h. The tissue samples were incubated in Ribonucleic Acid later solution (Ambion, Austin, TX) for 5 min at room temperature and then 4°C overnight before storage at −80°C.
Sample Preparation
Approximately 20 mg to 40 mg liver tissue was homogenized in 100 μL of TEKnova denaturing buffer (TE buffer), pH 7.2 (TEKnova, Hollister, CA) using TissueLyser II (Qiagen, Valencia, CA) with a stainless steel ball at room temperature thrice, for 2 min each, at 26 Hz. The IS-1 (see Table 1) was spiked into each of the homogenized samples to a final concentration of 200 ng/mg to serve as an IS.
Standard calibration curve was prepared in normal untreated female mouse liver homogenate. For this sample, approximately 300 mg liver tissue was homogenized in 1 mL of TE buffer, pH 7.2, using a scaled-up version of the method just described. The sample was then aliquoted into ten 1.7 mL microcentrifuge tubes, and HPRT1 DsiRNA duplex was added to each tube to final concentrations of 1,000, 500, 100, 50, 10, 5, 1, and 0 ng/mg. The HPRT1 DsiRNA at the concentrations of 250 and 25 ng/mg in mouse liver homogenate were separately prepared as quality control (QC) samples. The IS-1 was added to a final concentration of 200 ng/mg in each aliquot.
Oligonucleotide Extraction
To extract oligonucleotides from mouse liver homogenate, the 96-well Clarity OTX cartridge plates (Phenomenex, Torrance, CA) were used with a 96-well plate vacuum manifold (Pall Corporation, Port Washington, NY) following the manufacturer's instructions. Briefly, the 96-well Clarity OTX cartridge plate was conditioned with methanol (1 mL/cartridge) with a vacuum setting of ∼2 mmHg. The 96-well cartridge plate was then equilibrated with equilibration buffer (50 mM NaH2PO4 pH 5.5, and 1 mM NaN3; 1 mL/cartridge) at a vacuum setting of ∼3 mmHg. The mouse liver homogenate samples treated with loading buffer were loaded into the 96-well cartridge plate at a vacuum setting of ∼10–15 mmHg. The sample solutions were completely evacuated through the wells. The 96-well cartridge plate was then washed with 1 mL/cartridge of wash buffer (50 mM NaH2PO4, 50% acetonitrile pH 5.5) thrice at a vacuum setting of ∼3 mmHg. The vacuum was then increased to 15 mmHg for ∼30 s before oligonucleotides were eluted initially with 0.5 mL elution buffer (0.1 M NH4HCO3/50% methanol pH 8.8) and then with 0.2 mL elution buffer at a vacuum of ∼3 mmHg. The elutes were then combined and dried under nitrogen gas. Finally, the eluted samples were reconstituted in 200 μL of 7 mM TEA (aq)/methanol (9:1, v/v) solution.
LC/MS analysis
Data acquisition and processing for the UHPLC system were performed using MassLynx software. A BEH C18 reversed phase column (1.7 μm, 2.1 × 50 mm) was used. Column temperature was maintained at 65°C. The mobile phases used were as follows: A, 8.6 mM TEA and 100 mM HFIP in HPLC water, pH 8.6; and B, 8.6 mM TEA and 100 mM HFIP in methanol, pH 8.6. The mobile phase B at a gradient from 5% to 22% in a time period of 8 min was used. The sample injection volume was 10 μL, and the flow rate was maintained at 0.2 mL/min.
The temperatures of the ion source and desolvation for the quadrupole mass spectrometer instrument were set at 125°C and 400°C, respectively, and the de-solvation gas flow rate was set at 500 L/h. The electrospray needle voltage was set at 3.0 kV. The HPRT1 sense strand, antisense strand, and IS-1 were scanned from mass-to-charge ratio (m/z) 600 to m/z 2,400 with negative ionization mode. Figure 1a, c, and e are the mass spectra for the HPRT1 sense strand, antisense strand, and IS-1, respectively. Figure 1b, d, and f show the deconvoluted spectra of the HPRT1 sense strand, antisense strand, and IS-1, respectively. The experimental molecular weights obtained by deconvolution of mass spectra were 8,035.7 Da (Dalton) for the sense strand, 8,698.4 Da for the antisense strand, and 9,439.8 Da for the IS-1.
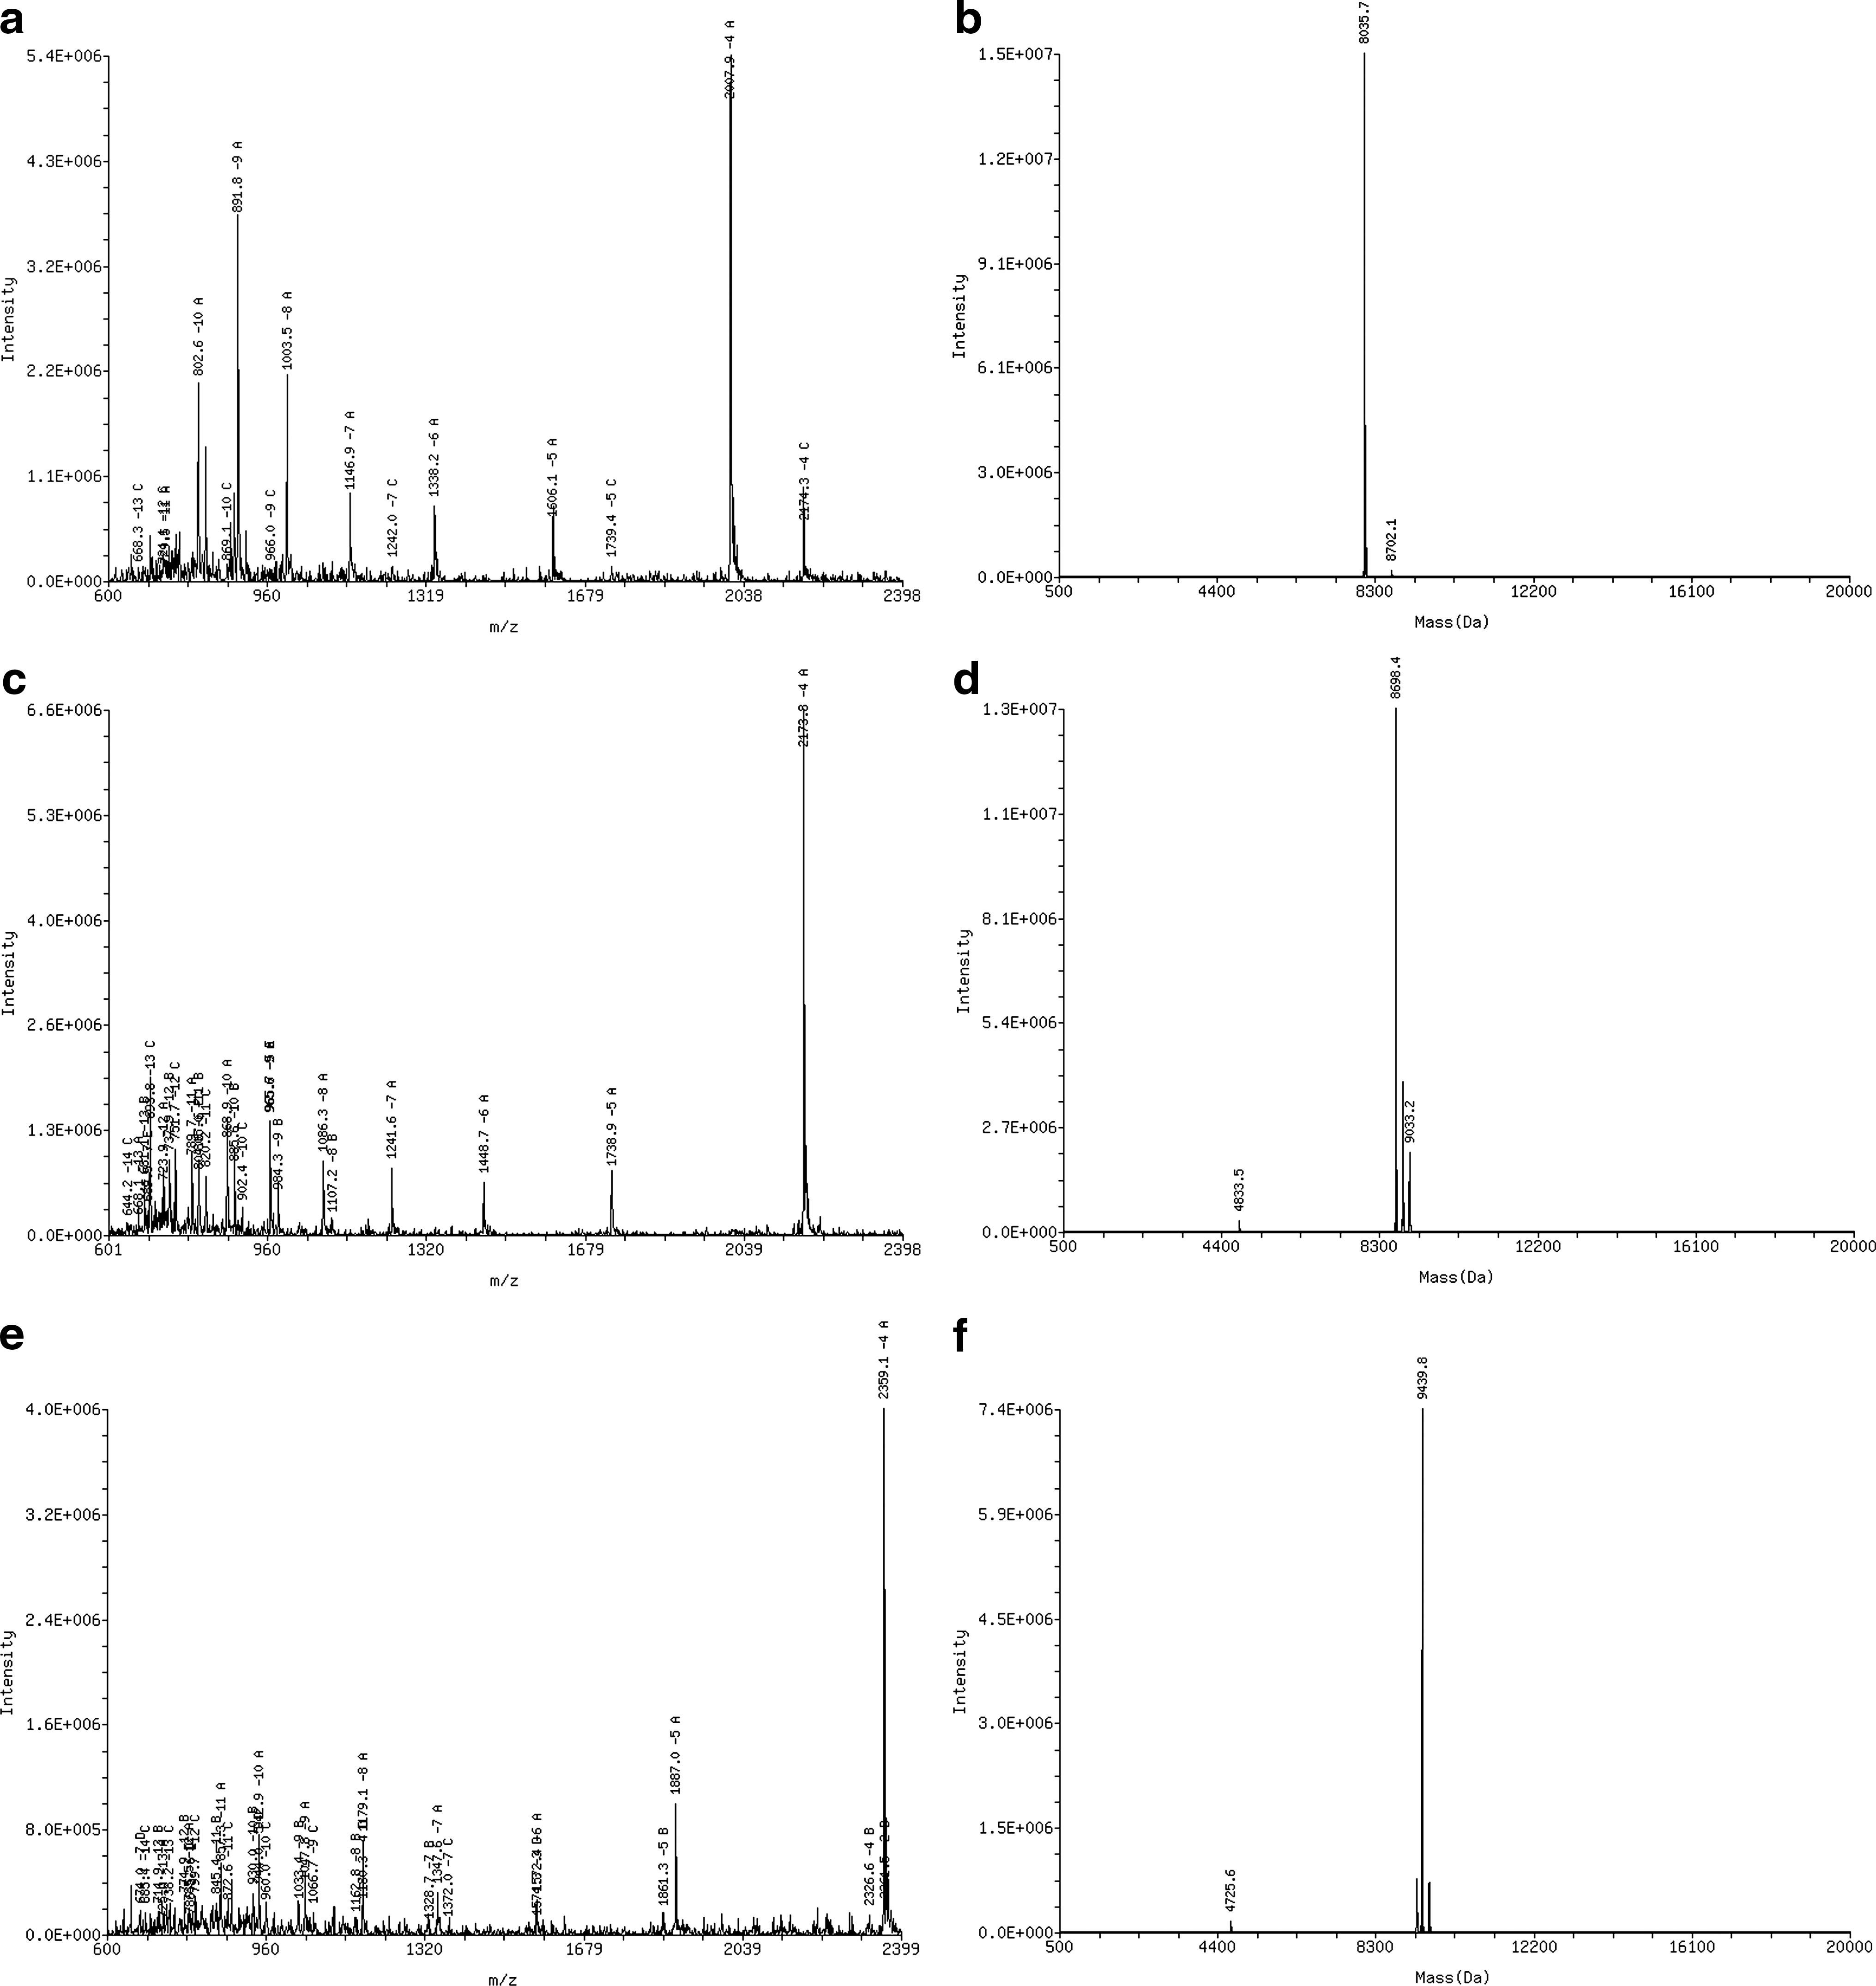
The mass spectra of HPRT1 duplex and IS-1 ([predicted m/z]/[experimental m/z]):
Selected reaction monitoring (SRM) with negative electrospray ionization mode was employed as the analytical method. The −4 charge state ions were selected as SRM parent ions for all three strands based on their signal abundance and ion peak stability. The SRM ion transitions monitored for the MS/MS operation were m/z 2,008.25–1,970.3 for the sense strand, m/z 2,173.95–2,140 for the antisense strand, and m/z 2,359.25–2,325.54 for IS-1. The SRM product ions were established based on the most stable and abundant product ion for each oligonucleotide.
Results and Discussion
UHPLC Separation of the Sense and the Antisense Strands
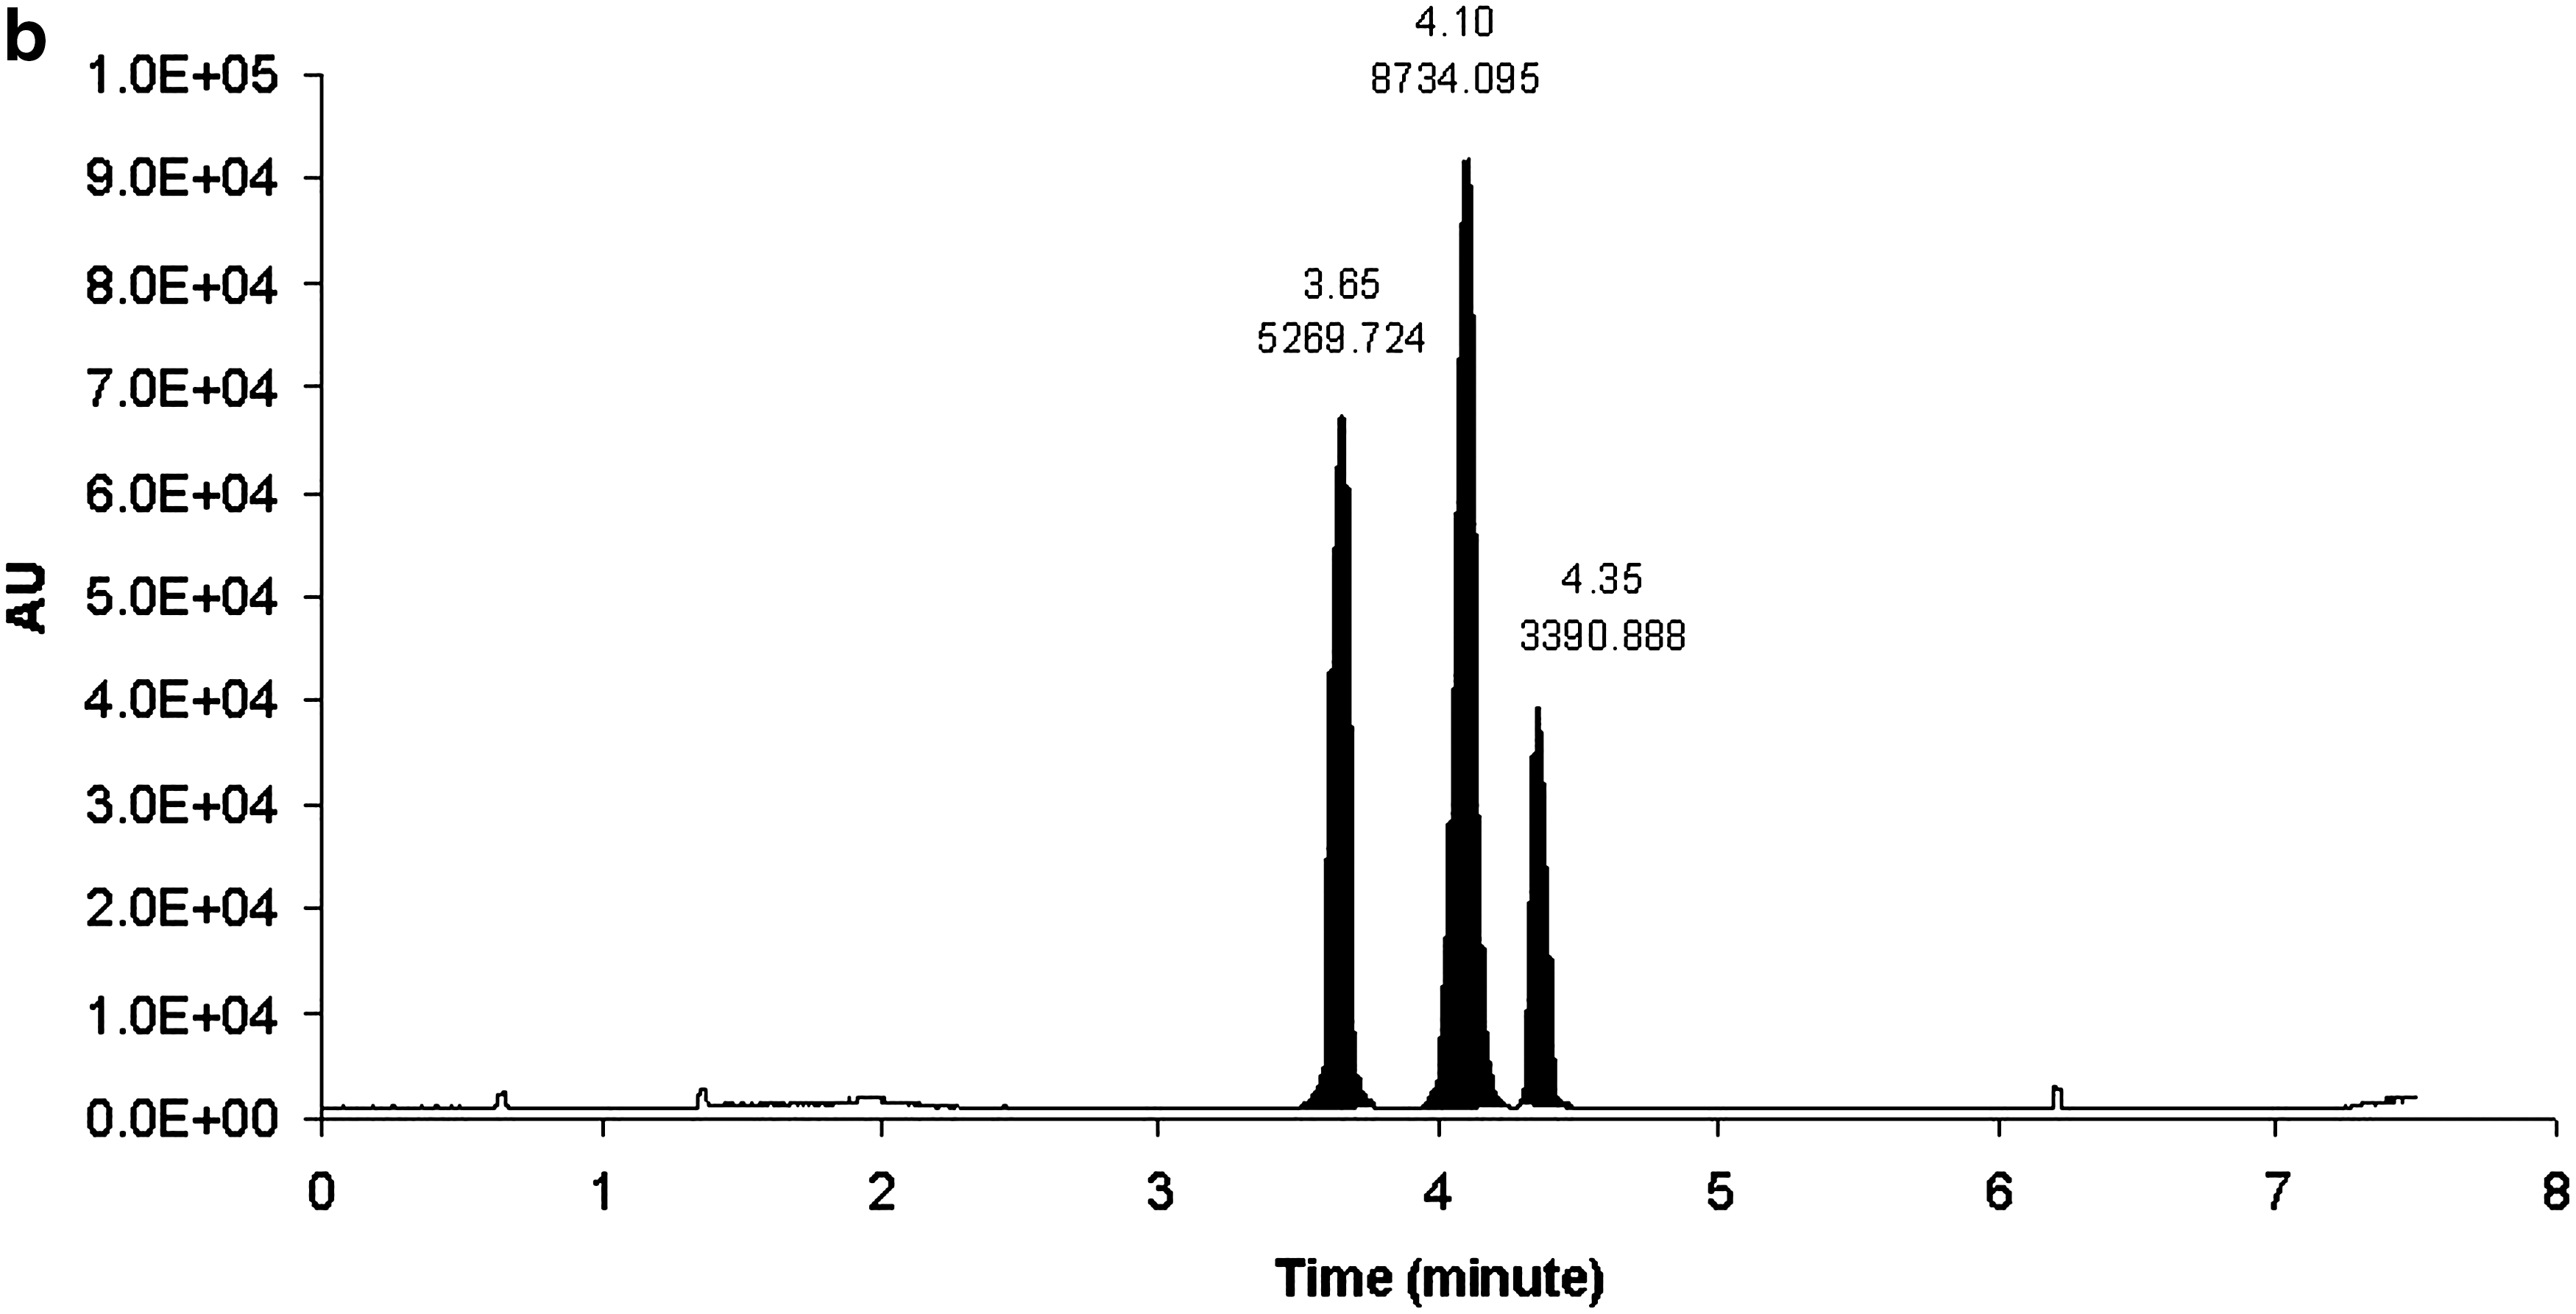
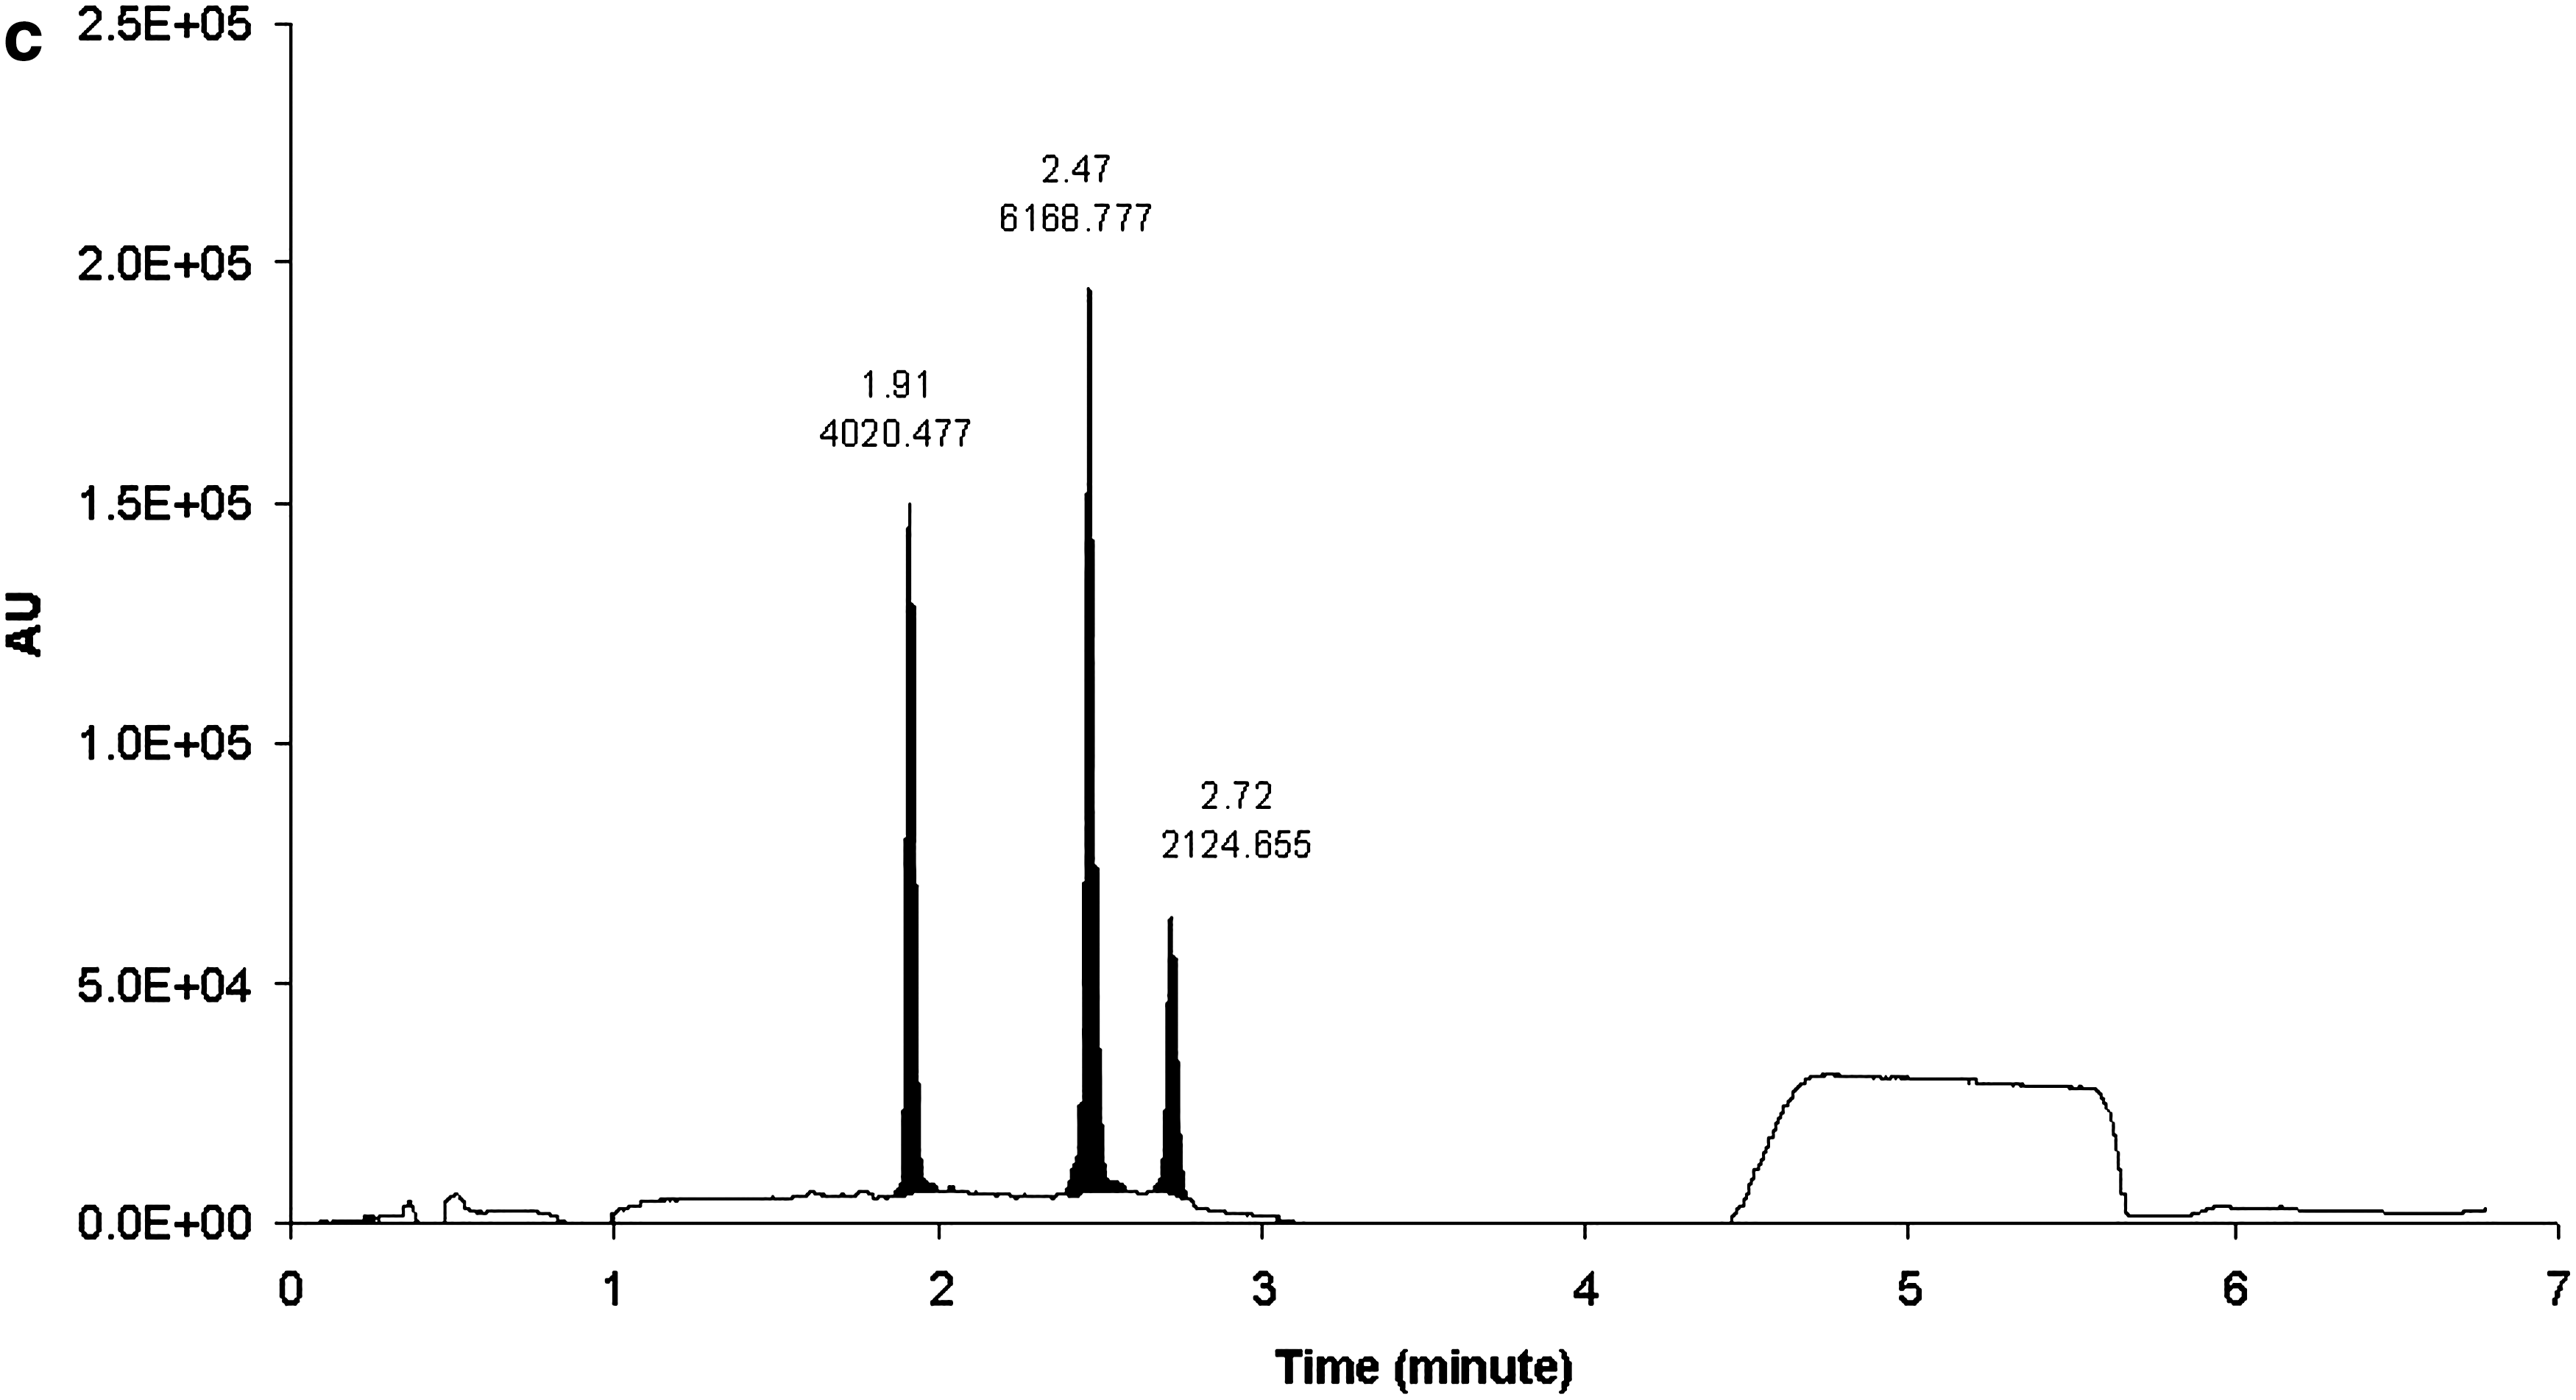
The HPRT1 DsiRNA sense and antisense strands were separated by reversed-phase (RP) UHPLC using HFIP/TEA buffer system with methanol as an organic eluting solvent. The sense and antisense strands eluted at 5.56 and 6.73 min, respectively (Fig 2a, b). Different combinations of mobile phases that were evaluated for RP-UHPLC to separate oligonucleotides included (i) Mobile phase A: 15 mM TEA, 400 mM HFIP in water; mobile phase B: 8 mM TEA, 200 mM HFIP in methanol, (ii) mobile phase A: 1.7 mM TEA, 400 mM HFIP in water; mobile phase B: methanol, and (iii) mobile phase A: 8.6 mM TEA, 100 mM HFIP in water; mobile phase B: 8.6 mM TEA, 100 mM HFIP in methanol. The first combination of mobile phases did not produce clear and sensitive multiple charge distribution profile, and extensive sodium adduction was observed (data not shown). Figure 3 shows the chromatograms of mobile phases (ii) (Fig. 3c) and (iii) (Fig. 3a, b) at 260 nm wavelength. Even though both mobile phase combination (ii) and (iii) provided baseline separation, the UV responses of all three components in mobile phase combination (iii) (Fig. 3a) were improved by at least 50% when compared with mobile phase combination (ii) (Fig. 3c). Combination (iii) also demonstrated better resolution (Fig. 3a) compared with mobile phase (ii) system (Fig. 3c). We also compared a conventional HPLC column with UHPLC column. Shown in Figure 3 are the chromatograms of UHPLC C18 (particle size 1.7 μm, 2.1 × 50 mm) (Fig. 3a) and conventional C18 (particle size 3.5 μm, 2.1 × 50 mm) (Fig. 3b) with a UV detection of 260 nm. The three components showed 7.5%–75% improvement by the UHPLC column compared with the HPLC column.
Chromatographic separation of
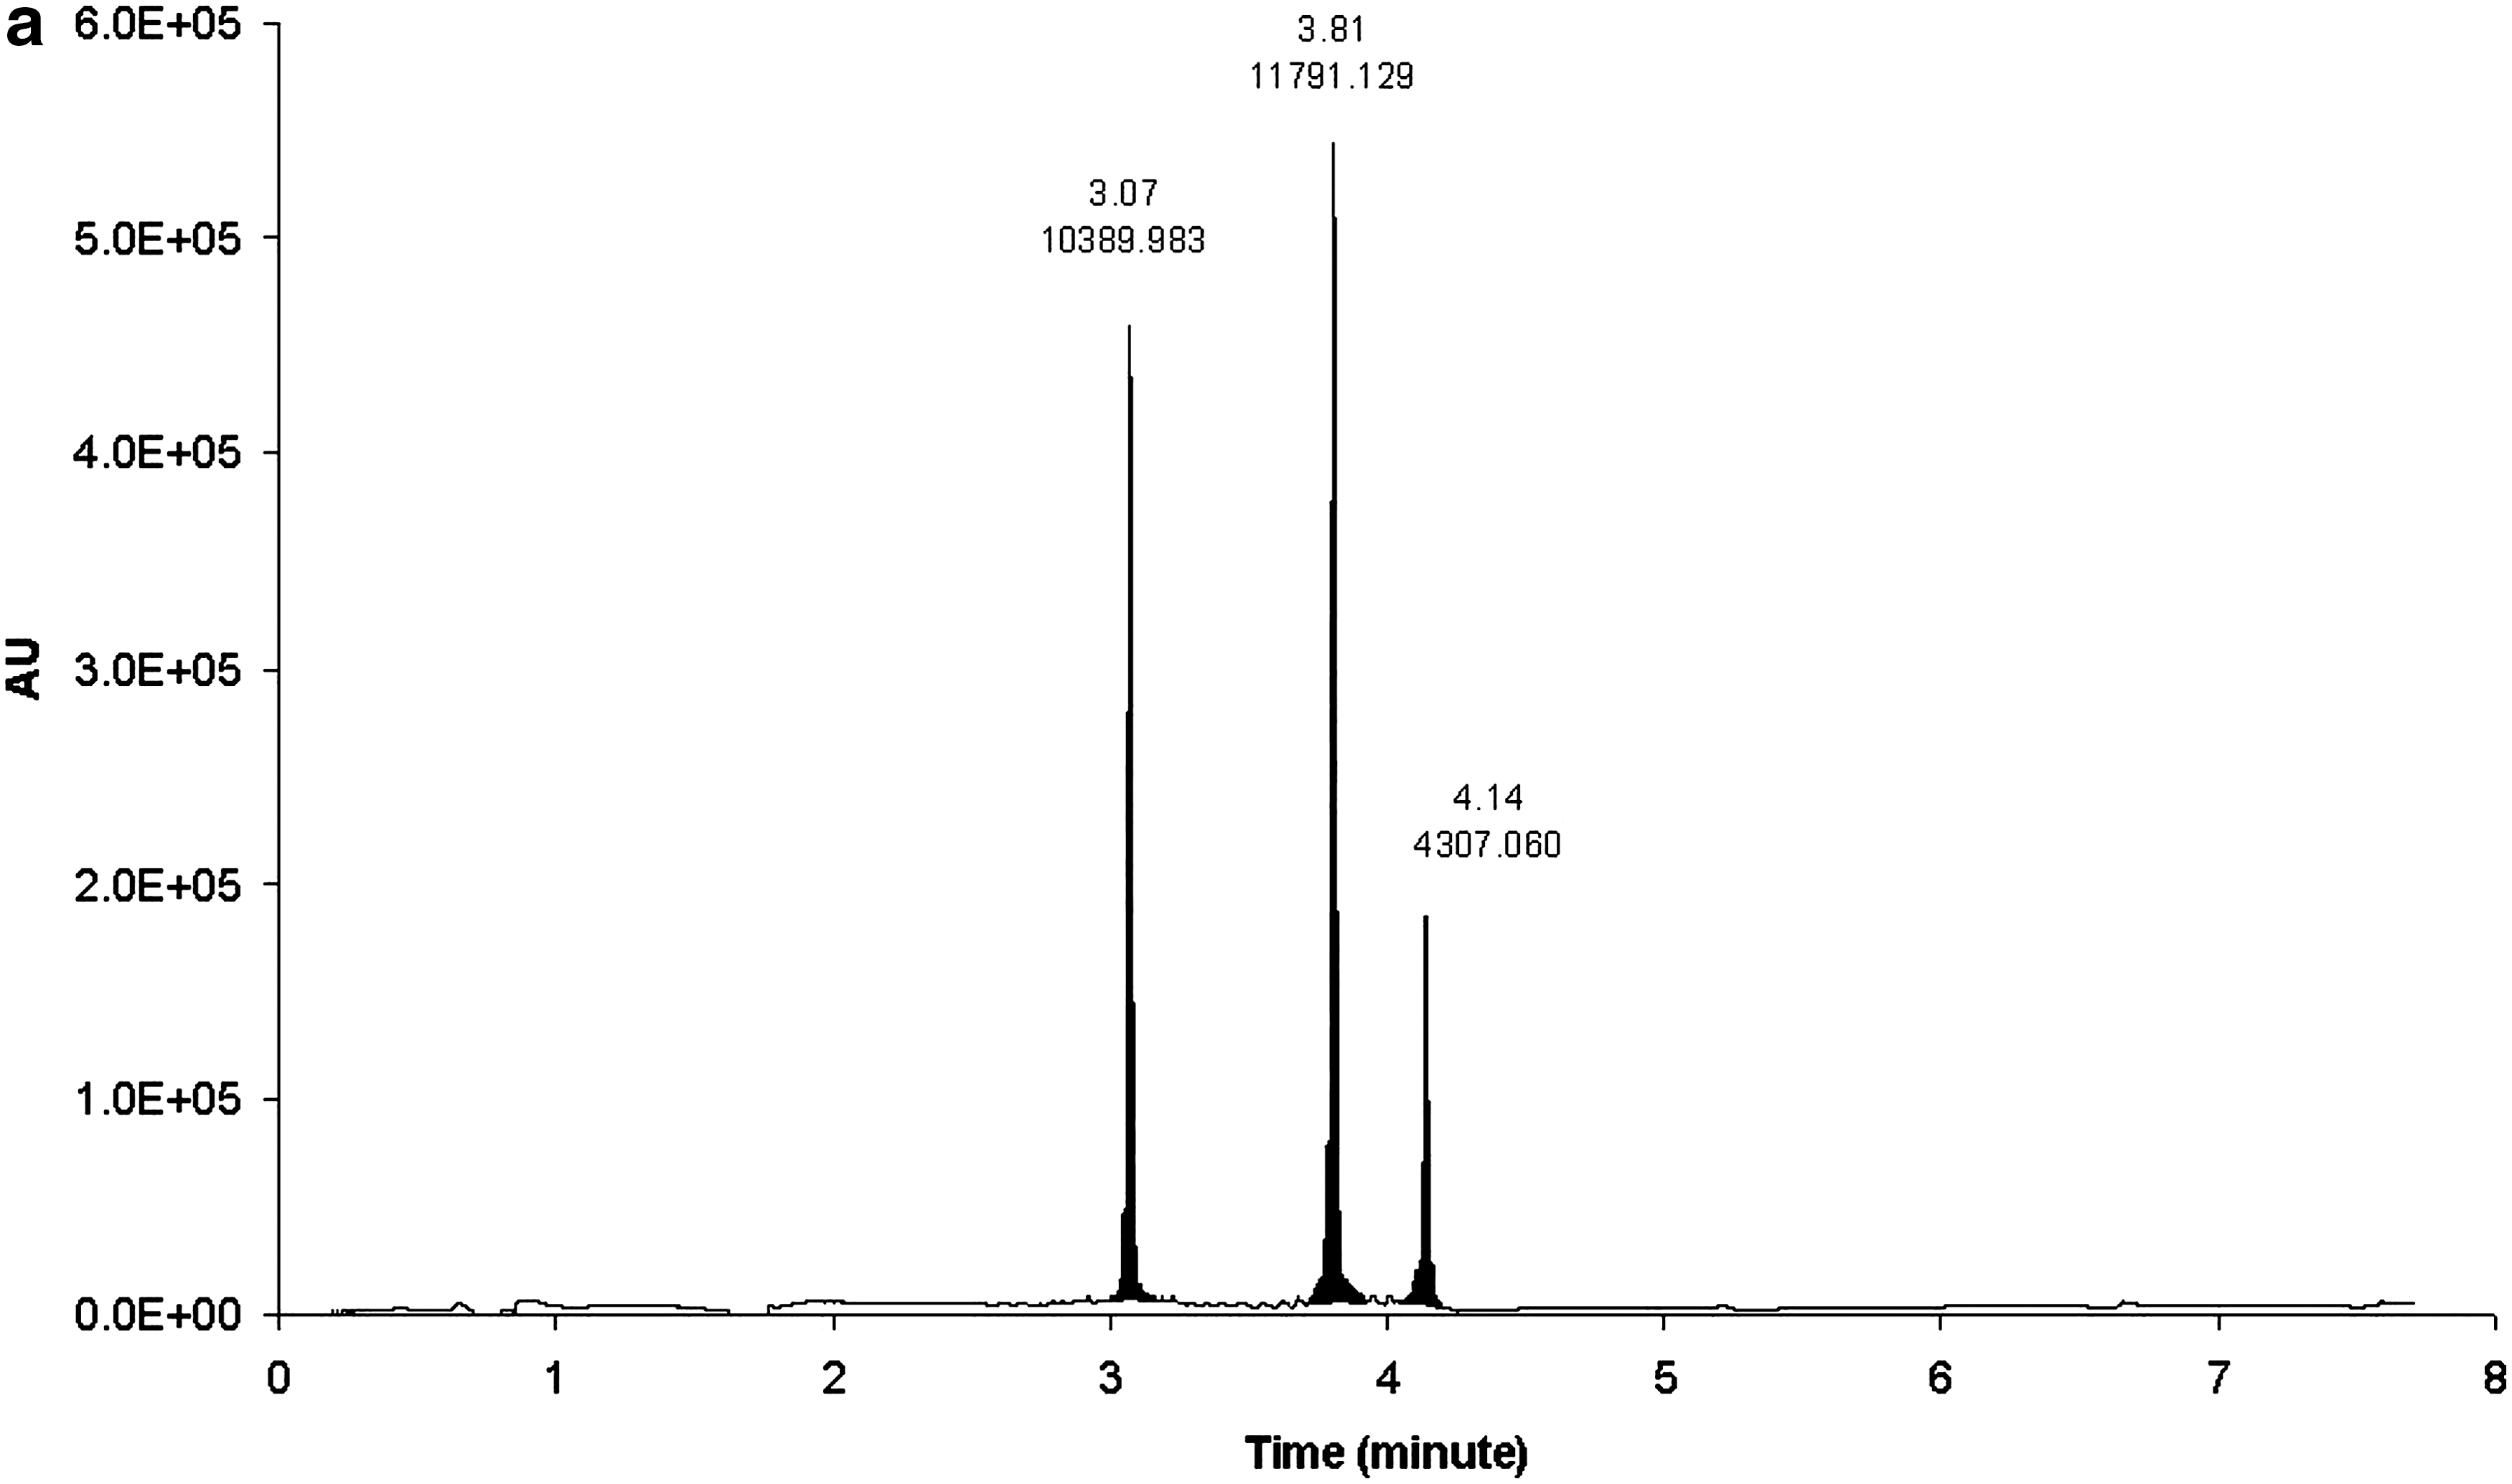
Chromatograms of HPRT1 sense strand, antisense strand, and internal standard (IS-1) with:
Electrospray Ionization Tandem Mass Spectrometry
The mass spectra of HPRT1 sense strand, antisense strand, and IS-1 are shown in Figure 1a, c, and e with the deconvoluted spectra shown in Figure 1b, d, and f, respectively. The −4 charge state ions were selected as parent ions for the SRM mode based on their signal abundance and peak stability. In addition, product ion signal abundance and peak stability were also considered for the selection of parent ions for SRM. To increase the abundance of the parent ion that was selected for SRM detection, electrospray voltages were optimized for all three oligonucleotides. As shown in Figure 4, HPRT1 DsiRNA antisense strand demonstrated the improved abundance for the −4 charge state ion after optimization (Fig. 4b) when compared with the original method (Fig. 4a). The loss of a base unit was selected for all three product ions for the SRM mode with the HPRT1 sense minus Guanine and HPRT1 antisense and IS-1 minus Adenine.
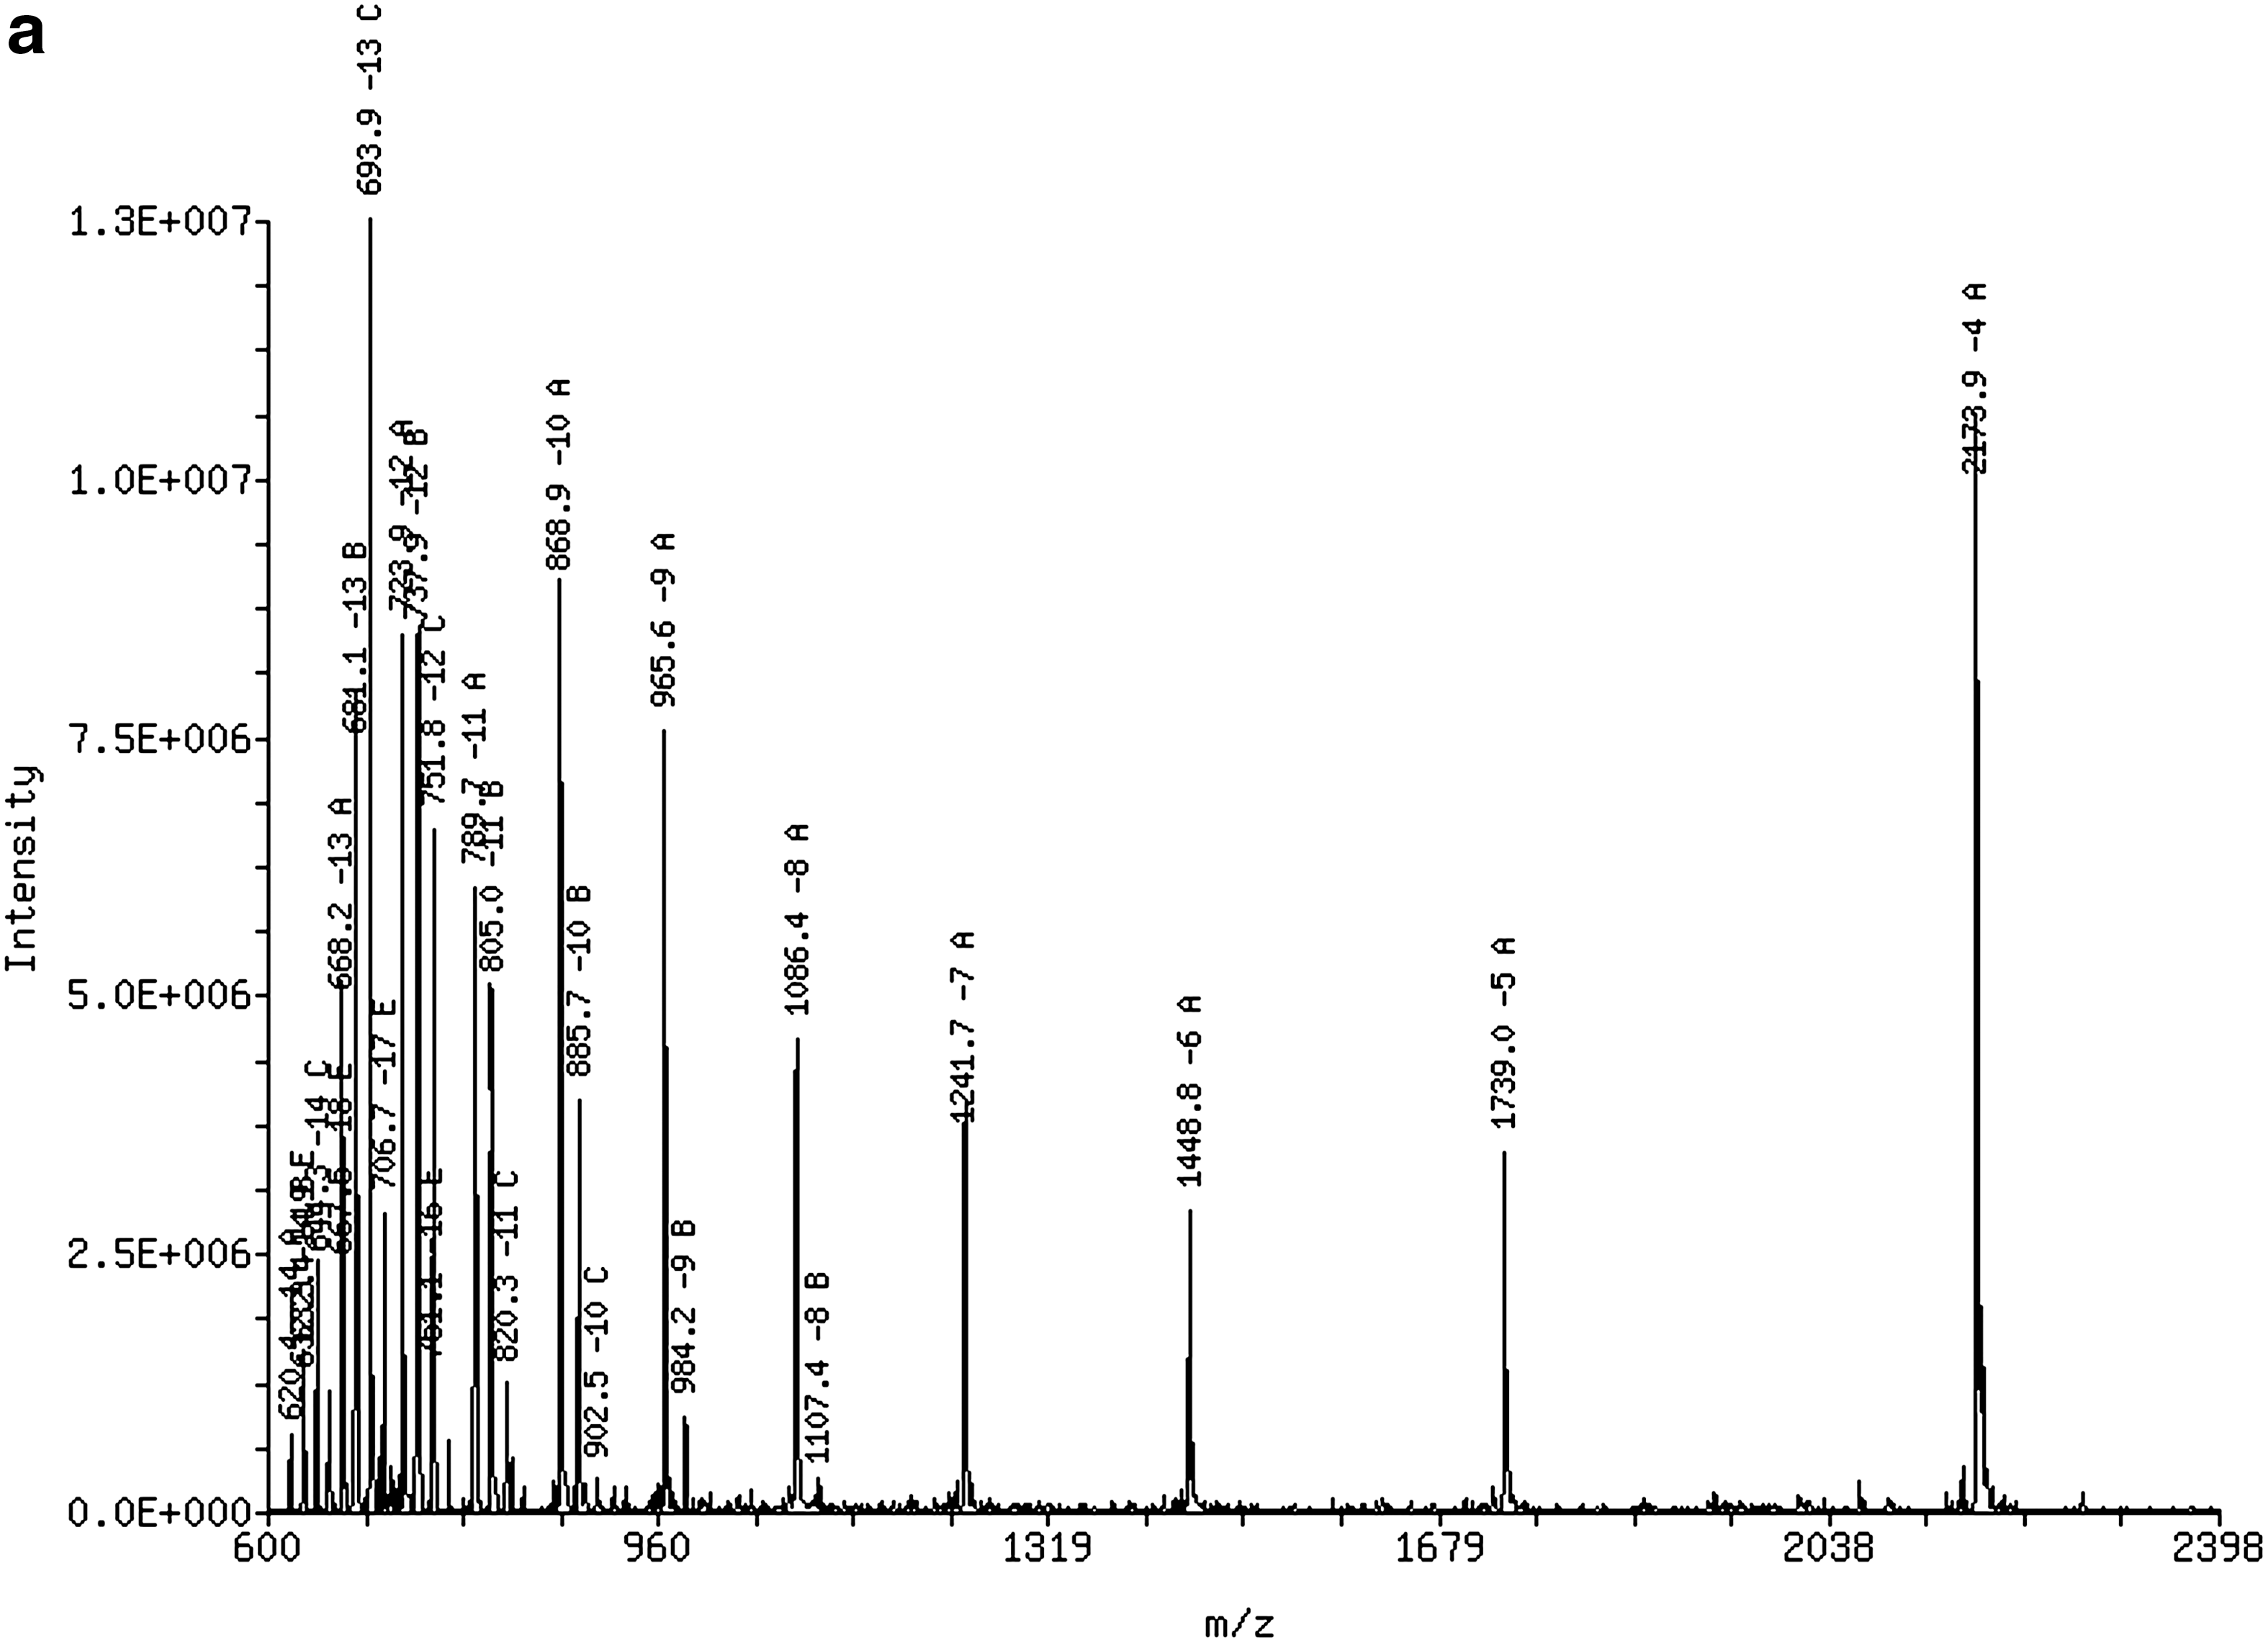

Limited levels of sodium and low levels of potassium adduct ions are observed in mass spectra for all three oligonucleotides. Figure 5 is an enlargement of the −4 charge state HPRT1 sense strand ion peak shown in Figure 1a, revealing the sodium and potassium adduct peaks. The sensitivity of the SRM analysis of the oligonucleotides was inversely proportional to the amount of sodium and potassium adducts. The use of the organic base such as TEA limits the formation of adducts as demonstrated in Figure 5, through displacement of sodium by pairing with the negatively charged phosphate groups of the oligonucleotides, thus reducing the charge states observed in the MS.
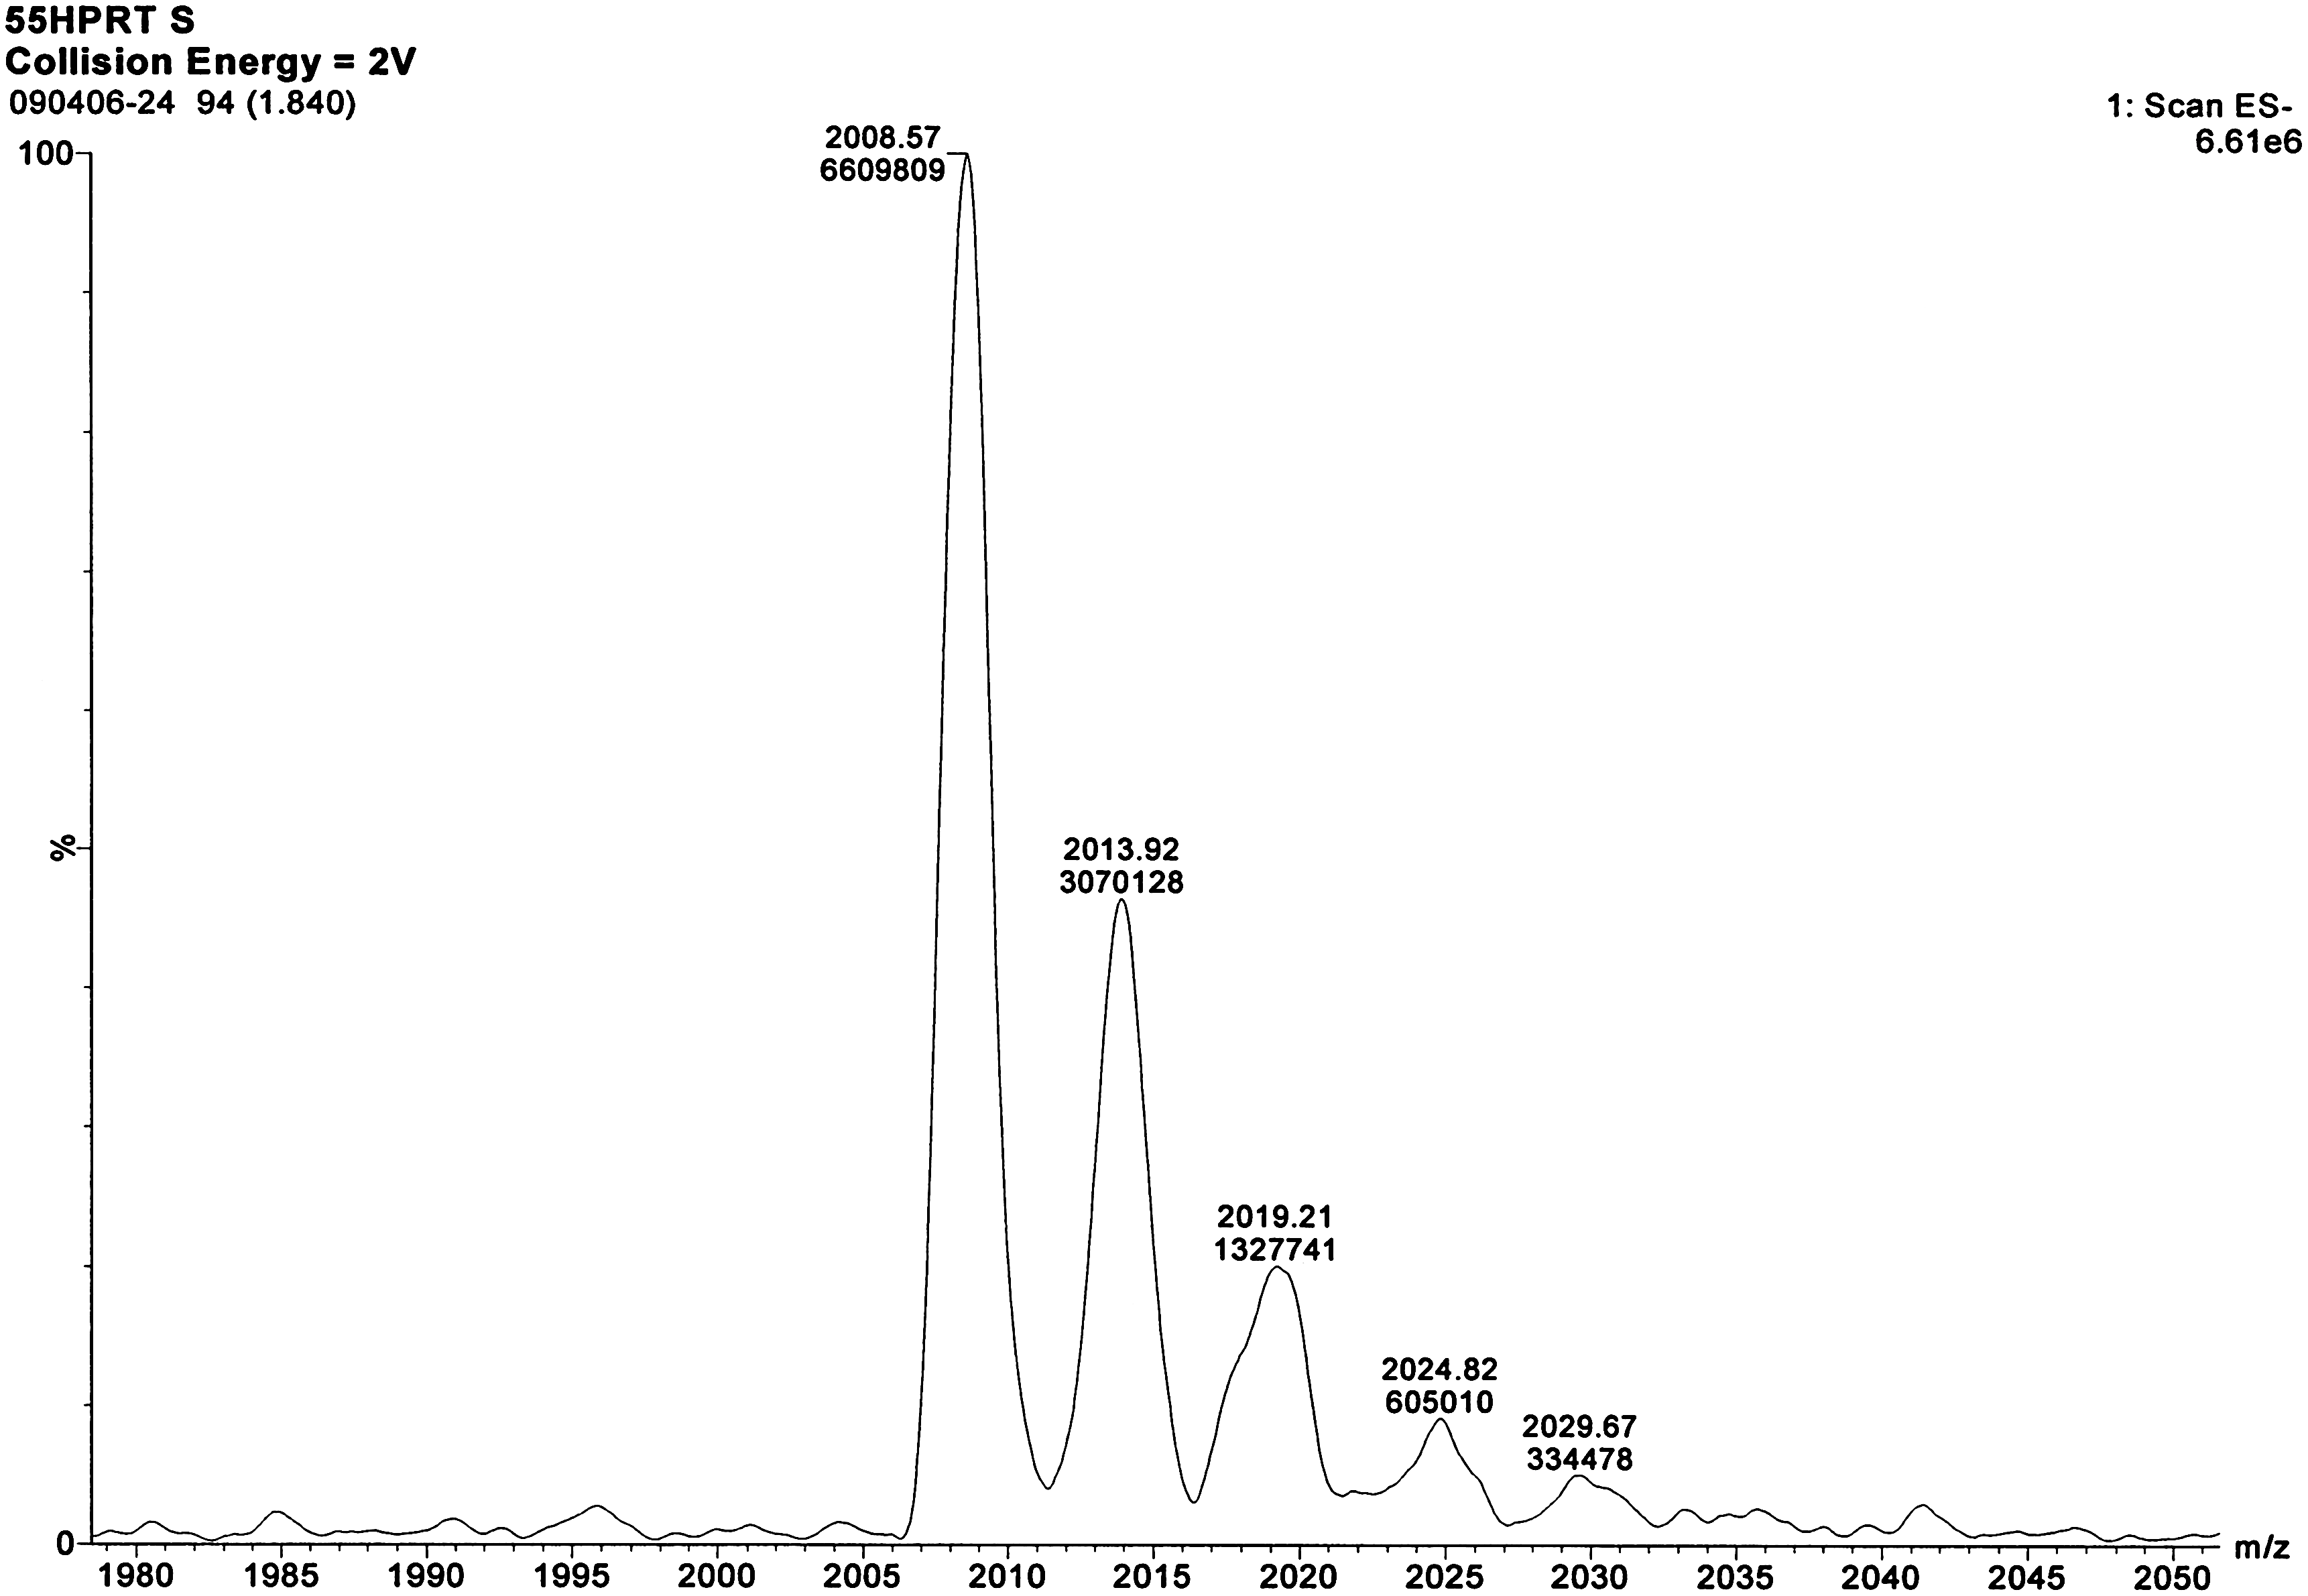
An enlargement of the HPRT1 sense strand −4 charge state ion peak from Fig. 1a.
Method Validation
Table 2a and b list the standard calibration data for the HPRT1 sense and antisense strands, respectively. The third column is the standard response area that corresponds to the concentration listed in the second column. The IS area corresponds to the IS concentration that was spiked in each standard. The MS response is calculated as (standard response area) × (IS concentration)/(IS response area). The concentration of the analyte was calculated using the equation y=mx + y 0, where y is the MS response, m represents the sensitivity (slope), x is the analyte concentration, and y 0 is a constant that describes the background (intercept). The relative deviation (%Dev) on the right column describes how close the calculated value to the mean over the whole calibration range. The calculations were performed with Waters Corporation QuanLynx program. The calibration curves are with weighting factor 1/x 2 for more accurate calculation of lower-concentration samples. 29
Hypoxanthine Phosphoribosyltransferase 1 Sense Standard Calibration Data, Prepared Using Untreated Mouse Liver for the In Vivo Study
MS, mass spectrometry; QC, Quality control.
Hypoxanthine Phosphoribosyltransferase 1 Antisense Standard Calibration Data, Prepared Using Untreated Mouse Liver for the In Vivo Study
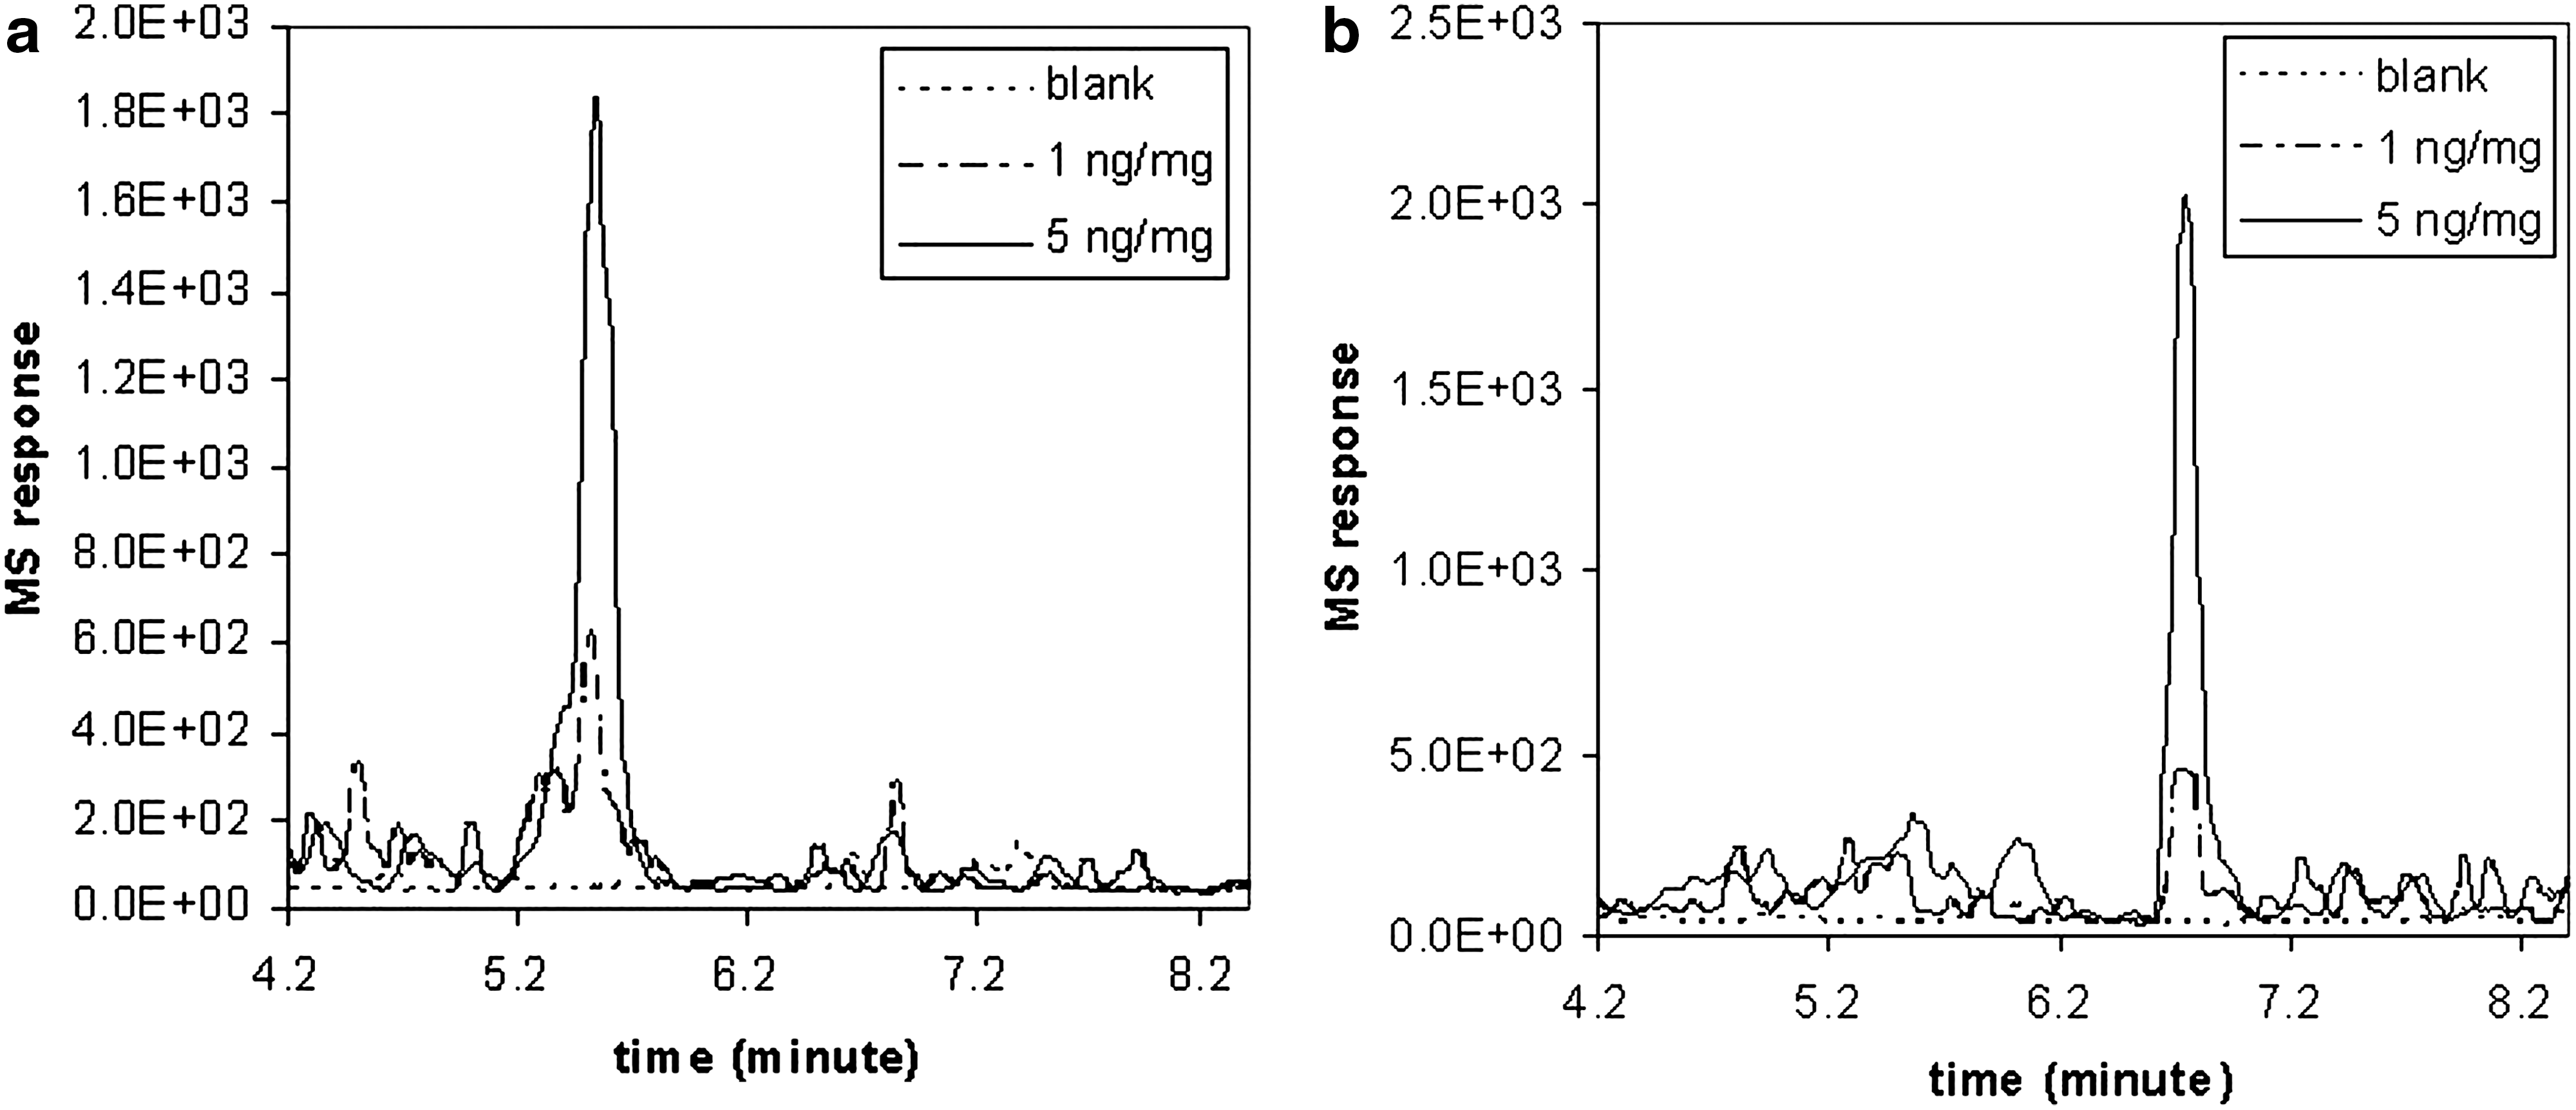
The standard curves established from the calibration data (Fig. 6) enabled us to quantify the sense and antisense strands in the mouse liver matrix over a range of 5 ng/mg–1,000 ng/mg and 1 ng/mg–1,000 ng/mg, respectively. The lower limit of detection (LLOD) for the sense strand was ∼1 ng/mg, as a deviation of 1 ng/mg level was more than 20%. 25 Both sense and antisense strands showed similar signal intensity. Figure 2a, b show the signal intensity (SRM chromatograms) with samples consisting 0, 1, and 5 ng/mg HPRT1 DsiRNA duplex spiked in liver tissues. The selectivity of the method was demonstrated by the liver sample without oligonucleotides, as shown in Figure 2a, b. There were no detectable matrix interference for HPRT1 sense and antisense strands. Before LC-MS-MS analysis, liver samples were processed by using Phenomenex Clarity OTX cartridge (96-well). Multiple injections (n=3) were made for spiked QC liver samples. There were two precision levels measured for the method; the first precision level was multiple injections (n=3) of the same QC liver samples. The precision was <15% relative standard deviation (RSD) for both QC 1 (25 ng/mg) and QC 2 (250 ng/mg) samples. The second level of precision was the RSDs of liver standards over the linear curve range; this precision was <14% RSD over the standard calibration curve. The data are shown in Table 2a and b for the sense and antisense strands, respectively.

Standard calibration curve of HPRT1 antisense (♦; – –) and sense (□ — —) strands in liver tissue. HPRT1 DsiRNA was added to the homogenized liver tissue of 1, 5, 10, 25 (QC1), 50, 100, 250 (QC2), 500, and 1,000 ng/mg, and extracted by SPE. SRM response area was plotted against the oligonucleotide concentration in the liver tissue. SPE, solid phase extraction; DsiRNA, dicer substrate interfering ribonucleic acid; SRM, selected reaction monitoring.
The accuracy of this method is expressed by both the linearity of the spiked standard calibration curve and RSD over the standard calibration range. The correlation coefficient (R 2) over linear calibration curves were 0.9972 (six points) for the sense strand and 0.9931 (seven points) for the antisense strand. The RSDs over the calibration curves were between±0.4% and±13.6% for the sense strand and between±2.5% and±13.6% for the antisense strand. The assay showed no detectable matrix interference for the lower limit of detection at 1 ng/mg and over the calibration curve range. The use of sample matrix in preparing the calibration standards minimized the effects of interference by the matrix in the experimental samples.
Pharmacokinetic Study
The HPRT1 DsiRNA was administered to mice via an intravenous injection, and the oligonucleotide concentration in the liver was quantified by UHPLC-ESI-MS-MS over a 72 h time period. Individual values of liver tissue concentration for each oligonucleotide, as well as the mean values from 3 mice per time point, are reported in Table 3a and b and in Figure 7. Both sense and antisense strands could be detected and quantified as early as 15 min. after injection. The maximum level for both sense and antisense strands of HPRT1 DsiRNA were observed one hour after the injection. After 24 h, the level of both strands decreased below the Lower limits of quantifications (LLOQs) of the method. During the course of 24 h, the sense and antisense strands showed parallel biphasic decay.
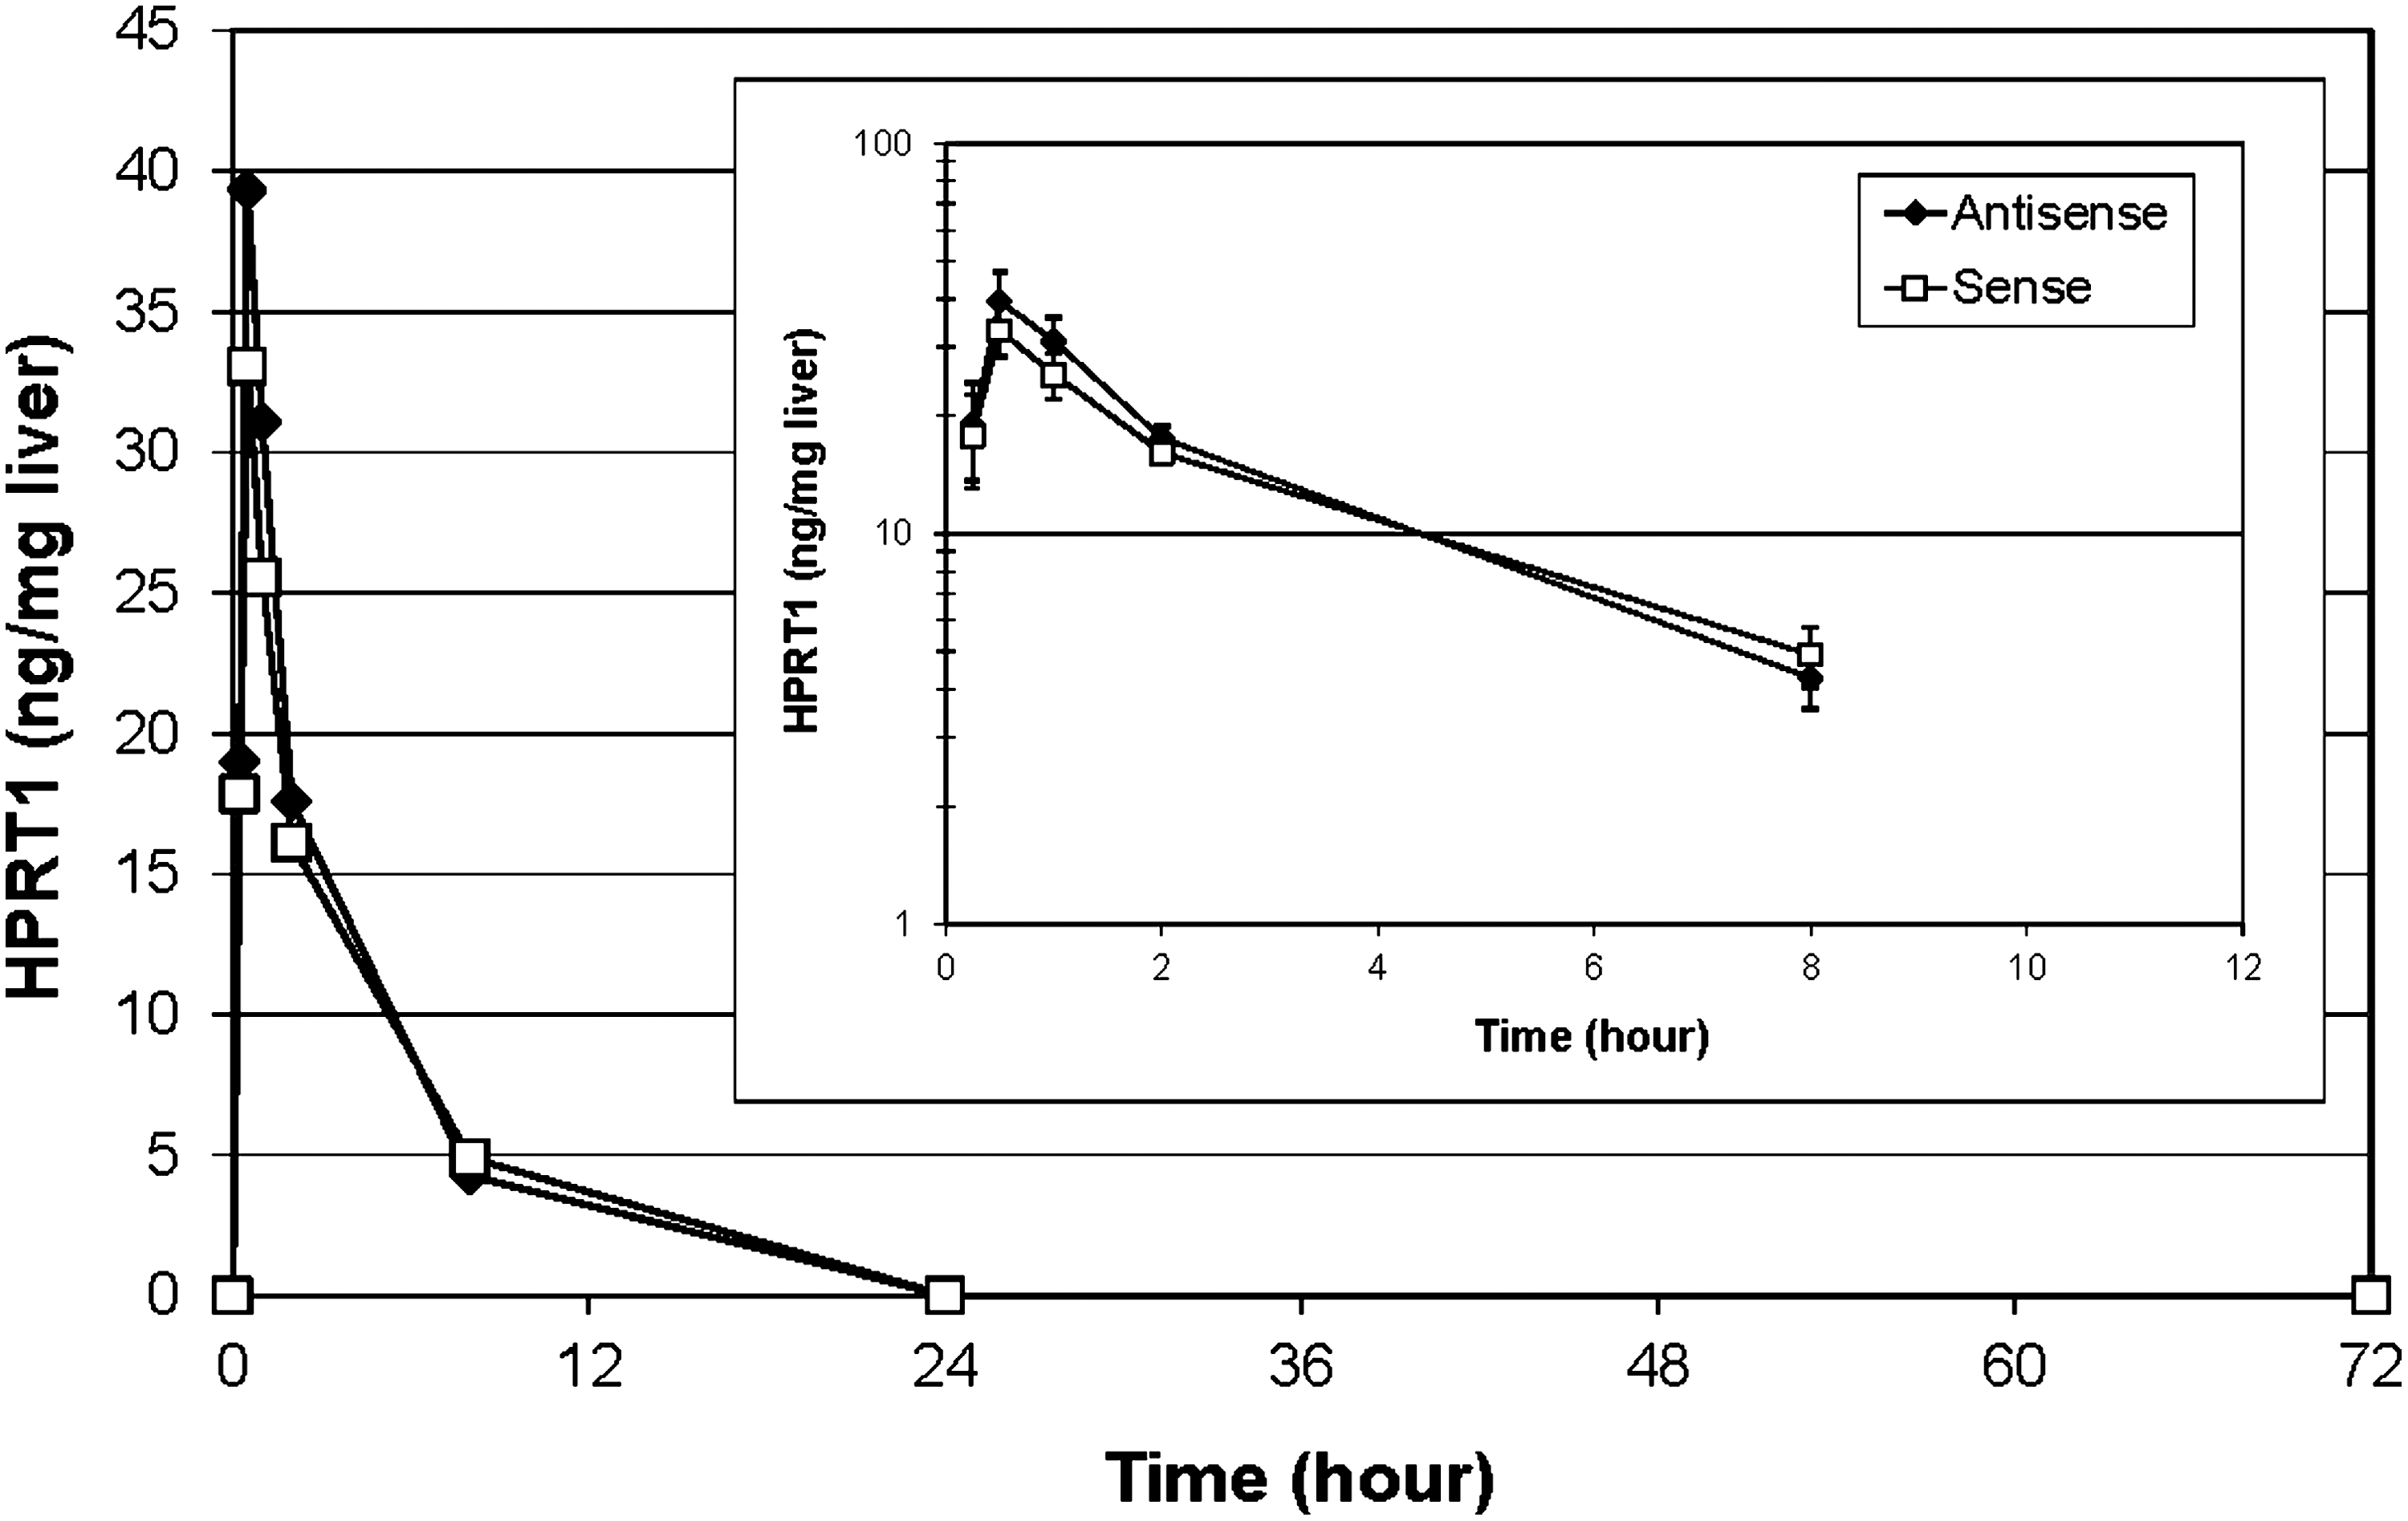
Linear plot of HPRT1 sense and antisense strand concentration with regard to time in mice liver tissue. The test article was administered in mice intravenously at a dose level of 10 mg/kg in a total vol. of 0.1 mL/10g body weight (N=3/group) at a concentration of 1 mg/mL as a single dose. The oligonucleotide concentration was measured at 15 min, 30 min, 1 h, 2 h, 8 h, 24 h, and 72 h post injection, by UHPLC-ESI-MS. Inset: Log plot of HPRT1 sense and antisense strand concentration with regard to time up to 8 h time point in mice liver tissue. Error bars represent the standard deviation of DsiRNA concentration values. ESI-MS, electrospray ionization tandem mass spectrometry
Hypoxanthine Phosphoribosyltransferase 1 Dicer Substrate Interfering Ribonucleic Acid Sense Strand Quantification From the In Vivo Study
LLOD=1 ng/mg, liver. n=3 for all time points except for the time zero and last two time points (n=1).
NA, not available; LLOD, lower limits of detection.
Hypoxanthine Phosphoribosyltransferase 1 Dicer Substrate Interfering Ribonucleic Acid Antisense Strand Quantification from the In Vivo Study
LLOQ=1 ng/mg, liver. n=3 for all time points except for the time zero and last two time points (n=1).
LLOQ, lower limits of quantification.
Conclusions
A rapid, sensitive, and specific method based on UHPLC coupled to tandem mass spectrometry has been developed to quantify oligonucleotides in liver tissue. In comparison to traditional HPLC-UV, 30 the UHPLC-ESI-MS method we developed here, at least 10 times higher in sensitivity and higher specificity was also obtained by using SRM detection. Using DsiRNA directed against the HPTR1 mRNA as an example, we established the assay dynamic ranges for the sense and antisense strands in mouse liver matrices at 5 ng/mg–1,000 ng/mg and 1 ng/mg–1,000 ng/mg, respectively, with R 2>0.99. The LLOQ is determined as 5 ng/mg for the sense strand and 1 ng/mg for the antisense strand. LLODs for both the sense and antisense strands are ∼1 ng/mg. Using this method, we successfully performed PK study of an LNP formulation of a HPRT1 DsiRNA in mouse liver tissue. We found that HPRT1 DsiRNA directed against the HPRT1 mRNA reaches a peak concentration in mouse liver after 1 h of dosing, and is reduced to below the limit of detection after 24 h. This method will also be tested for application to other tissues, plasma, and urine.
Footnotes
Acknowledgments
The authors thank Lou Lamphere and the Dicerna Pharmaceuticals pharmacology group for providing the liver samples and sample information. The authors also thank Brian Rivera and Greg Scott (Phenomenex, Torrance, CA) for discussions regarding sample preparation techniques.
Disclosure Statement
No competing financial interests exist.