Özalp VC: Dual-polarization interferometry for quantification of small molecules using aptamers. Anal Bioanal Chem 2012;402:799-804.
Abstract: An interferometry-based method was developed for detection of a small molecule, argininamide. The quantification of argininamide was demonstrated using aptamers immobilized on silicone oxynitride sensor surface via avidin–biotin binding. The aptamers formed a thin film over avidin layer corresponding to a thickness of 1.2 nm, consistent with a molecular positioning of multipoint attachment to the surface. The binding of argininamide did not cause any significant changes in the thickness of the aptamer film, suggesting that the specific binding did not affect the overall conformation of the aptamer molecules after adaptive rearrangement of aptamer molecules. However, the binding results in clearly detectable changes in mass calculated from multiple parameters determined by mass deposition and structural changes. The limit of detection of the developed sensor was determined to be 5 μM. The sensor can monitor real-time changes in argininamide concentrations with high reliability and sensitivity. The model system demonstrated that a combined measurement considering structural and mass changes through interferometry-based techniques can overcome one of the major problems associated with real-time monitoring of small mass analytes.
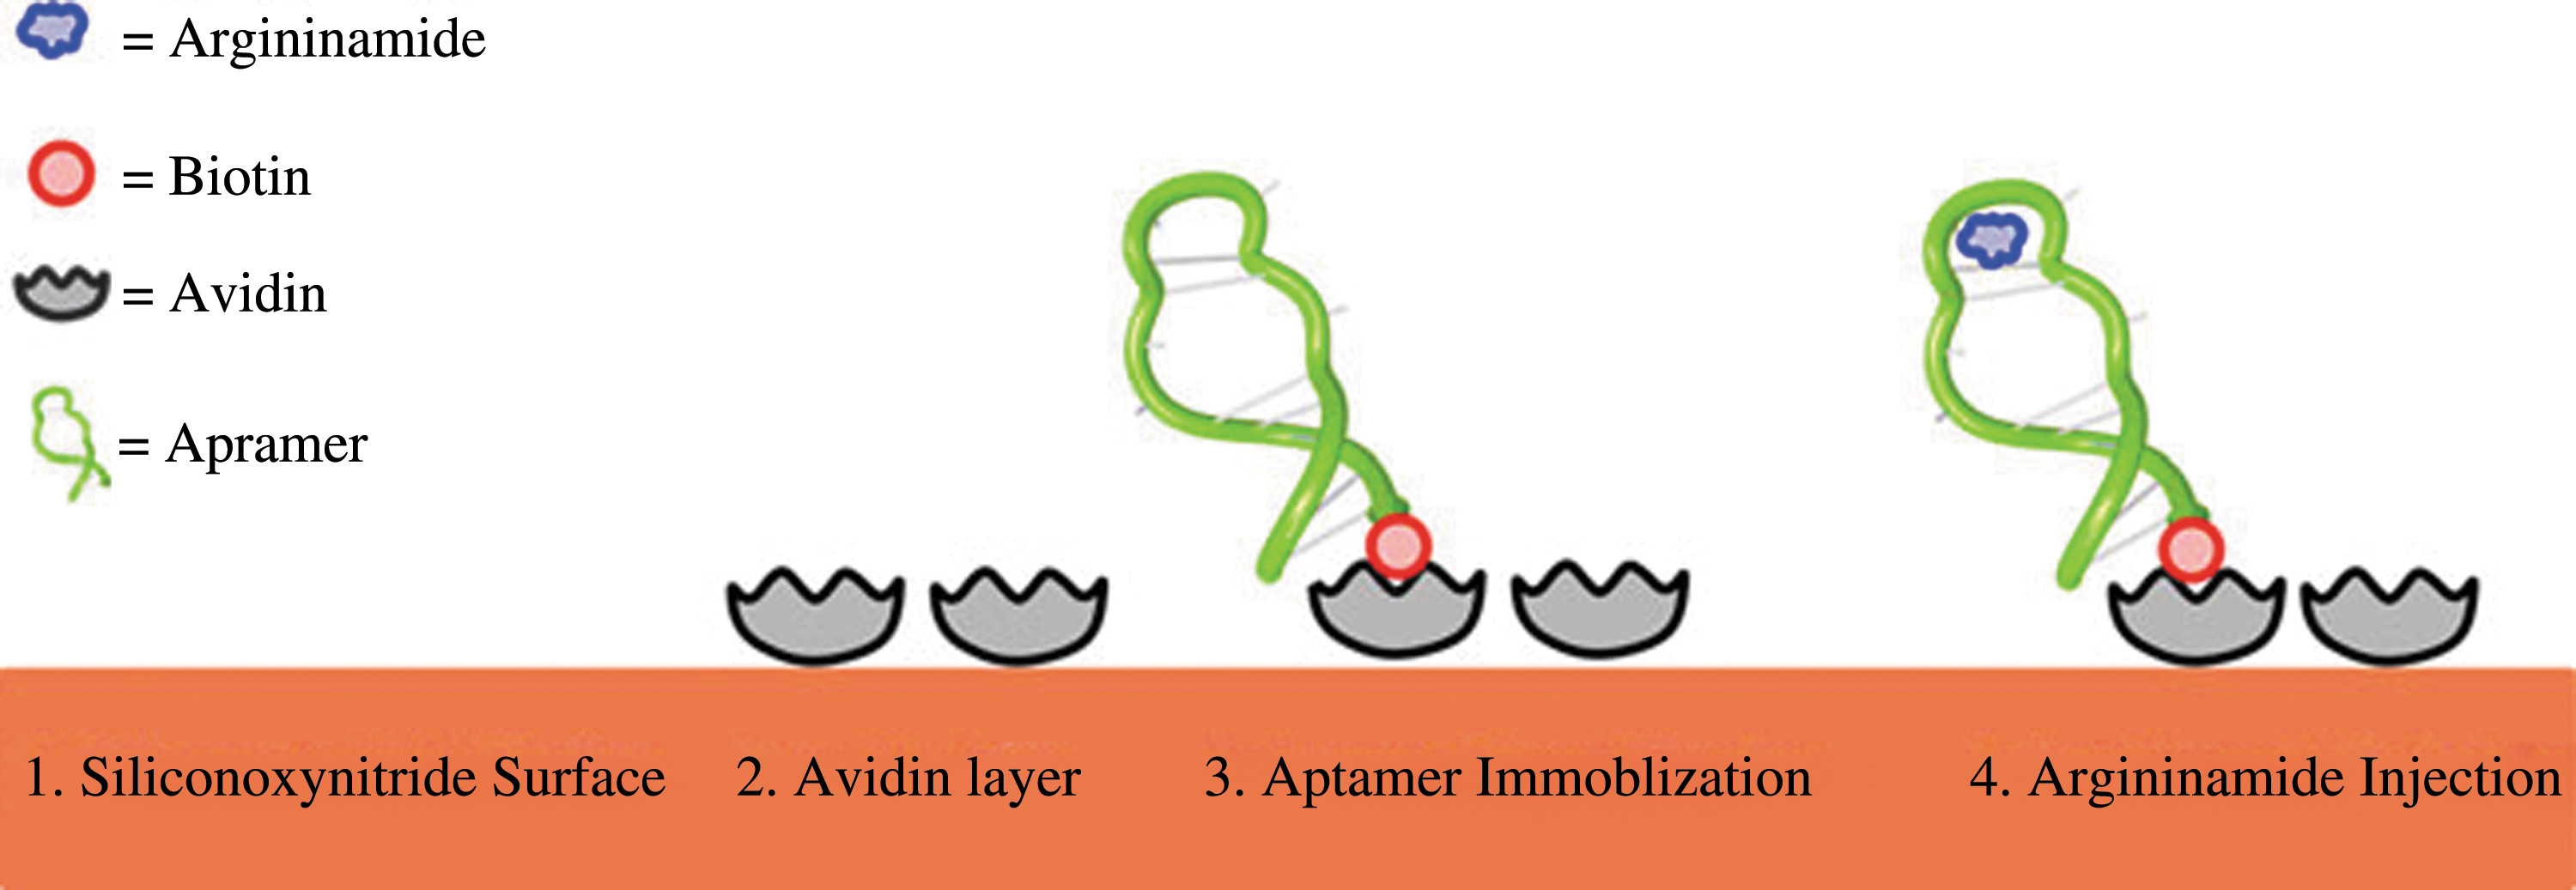
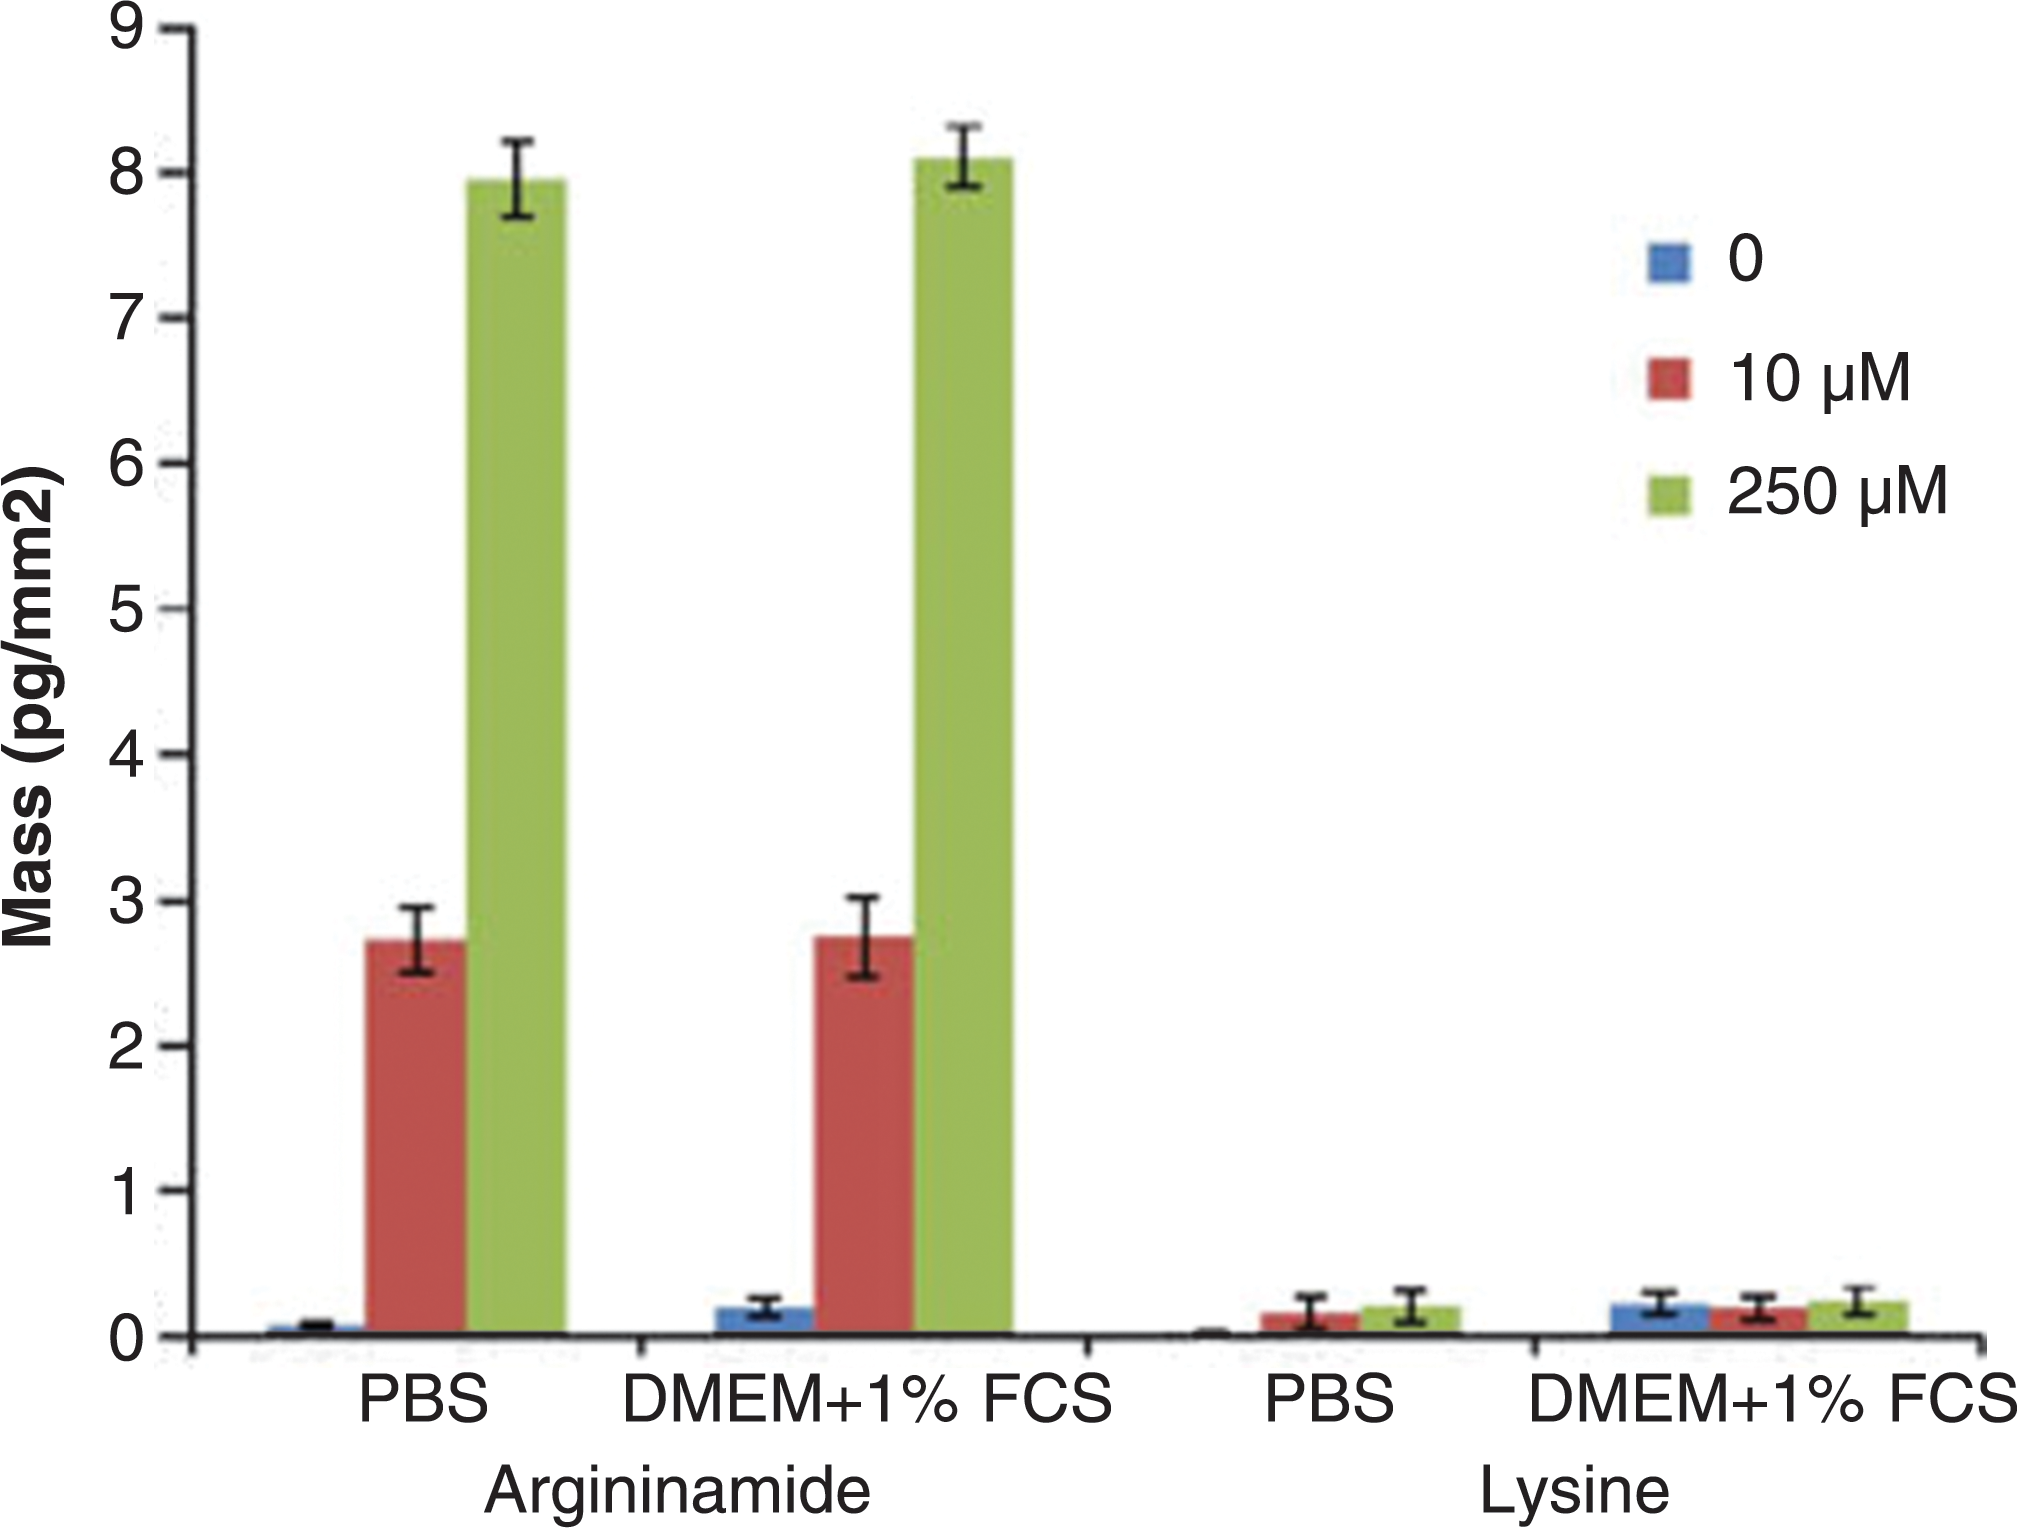
Commentary:Dual-polarization interferometry (DPI) was first described in 2003 as an alternative biosensor technique to SPR. Instead of using single transverse magnetic (TM) polarization for measurements, DPI allows both TM and transverse electric (TE) modes. This provides researchers an opportunity to dissect both thickness and density of biolayers in solution in real-time (Cross et al., Biosensors and Bioelectronics 2003;19:383–390). Additionally, the technique has been illustrated for its ability to determine binding stoichiometry, to differentiate specific from nonspecific interaction, and to provide insight on protein structural change upon binding (Swann et al., Anal Biochem 2004;329:190–198). Recently, DPI has been used to monitor kinetic and structural properties of DNA molecules through the detection of molecular dimension changes upon small molecule binding (Wang et al., Anal Chem 2009;81:4914–4921; Wang et al., Anal Chem 2010;82:5455–5462). Herein, Özalp presents a “proof-of-principle” study to illustrate DPI's ability for quantification of small molecules through their binding to DNA aptamers. In this study, the author utilized an argininamide aptamer-argininamide model system for the development and validation of a real-time biosensor. Biotinylated argininamide aptamer was first captured on the surface of silicone oxynitride sensor chips on which avidin was immobilized (see
first figure
). Argininamide was subsequently injected over a range of concentrations (1–250 μM). Interestingly, it was observed that although no significant change occurred in the vertical thickness of the aptamer film, optical extinction increased during the binding process. The author suggested an adaptive binding mechanism in which structural rearrangements might have taken place on the aptamer in a way that did not affect the vertical thickness of the biolayer but was detectable based on TE increase and subsequently mass increase. The method provided a detection limit of 5 μM, and a double digit micromolar binding affinity (Kd) was inferred between argininamide and the aptamer based on a 1:1 ratio. Appropriate controls, such as an arginine analyte, were also included in the study and the biosensor was shown to specifically bind to argininamide. The same binding interaction was recapitulated in biological fluids (DMEM + 1% FCS) (see
second figure
). This could be significant as evaluation of small molecule interaction with targets of interest in biological liquids is more physiologically relevant, thus facilitating efficient drug development (Wienken et al., Nat Commun 2010;1:100). Overall, this method represents a potentially universal platform for small molecule quantification since DNA aptamers can be obtained by in vitro selection for desired analytes. Contributed by Wendy Lea.
A schematic showing the steps in preparation of sensor surface for argininamide-binding experiments.
The effect of buffer composition on the response of the sensor. The mass changes of 10 or 250 μM argininamide and lysine were measured in PBS or cell culture buffer (DMEM + 1% FCS). The values are the average of three experiments.
Dubbing the DUBs
Altun M, Kramer HB, Willems LI, McDermott JL, Leach CA, Goldenberg SJ, Kumar KGS, Konietzny R, Fischer R, Kogan E, Mackeen MM, McGouran J, Khoronenkova SV, Parsons JL, Dianov GL, Nicholson B, Kessler BM: Activity-based chemical proteomics accelerates inhibitor development for deubiquitylating enzymes. Chem Biol 18;2011:1401–1412.
Abstract: Converting lead compounds into drug candidates is a crucial step in drug development, requiring early assessment of potency, selectivity, and off-target effects. We have utilized activity-based chemical proteomics to determine the potency and selectivity of deubiquitylating enzyme (DUB) inhibitors in cell culture models. Importantly, we characterized the small molecule PR-619 as a broad-range DUB inhibitor, and P22077 as a USP7 inhibitor with potential for further development as a chemotherapeutic agent in cancer therapy. A striking accumulation of polyubiquitylated proteins was observed after both selective and general inhibition of cellular DUB activity without direct impairment of proteasomal proteolysis. The repertoire of ubiquitylated substrates was analyzed by tandem mass spectrometry, identifying distinct subsets for general or specific inhibition of DUBs. This enabled identification of previously unknown functional links between USP7 and enzymes involved in DNA repair.
Commentary:This article describes the characterization of two inhibitors of deubiquitylating enzymes (DUBs) using biochemical and proteomic techniques. The inhibitors, PR-619 and P22077 (see
first figure
), were identified in a biochemical assay using a ubiquitin (Ub)-CHOP reporter system (Life Sensors Inc.).The biochemical assay is configured to measure DUB activity by employing a protease (in this case enterokinase) that is inactive when the N-terminal of the protein is modified with a Ub chain. Cleavage of the Ub chain from the protease by a DUB allows for indirect detection of DUB activity by adding a fluorescent substrate for enterokinase. The authors then characterized the specificity of these inhibitors using activity-based probes that were constructed to contain a Ub linked to a reactive group targeting the active site cysteine of DUBs (see
second figure
). These probes can be used in a competition mode to measure the propensity of the DUB inhibitors to protect against modification using immunoblotting analysis. The probes were initially used in cell extracts, which showed PR-619 to be pan active, affecting many DUBs, while P22077 was selective for USP7 (see
first figure
). Similar experiments were then conducted on live cells at concentrations below the cytotoxicity levels for these compounds, and the results supported activity of the inhibitors in living cells. A possible issue with the competition-based method is that the irreversible activity-based probes gradually displaced the inhibitors, although these inhibitors were present at high (5–50 μM) concentrations in the experiments described in the article. However, prolonged labeling of cell extracts (>2 hours) with different concentrations of the activity-based probes following pre-incubation of cells with the inhibitors showed that the inhibition by the DUB inhibitors persisted. Another limitation of the immunoblotting experiment is that many DUBs have similar molecular weights, and are therefore not easily distinguished on gels. Therefore, a quantitative proteomics technique was developed using tandem mass spectrometry. This validated the subset of DUBs that were inhibited by each compound because the mass shift resulting from modification of the DUB by the activity-based probe could be easily detected. The authors then examined the pharmacological consequences of inhibiting USP7. HDM2 is a known target of USP7 and knockdown of USP7 shows a marked decrease in the stability of HDM2 in cells. Treatment of cells with P2207 showed an initial drop in HDM2 levels, consistent with USP7 inhibition, followed by a later rise due to a known p53 feedback mechanism that replenishes HDM2. Additionally, P2207 was shown to lead to destabilization of the scaffold protein claspin, which undergoes ubiquitin-dependent proteasome degradation. Claspin is involved in assembling the Ataxia telangiectasia and Rad3 related (ATR) kinase involved with G1/S and G2/S checkpoints through phosphorylation of Chk1 kinase. Treatment of U2OS cells with P2207 resulted in a decrease in phospho-Chk1 levels. Overall, this article demonstrates a useful set of approaches for characterizing pharmacological modulation of DUBs and their substrates in cells. Contributed by Doug Auld.
DUB inhibition profile in living cells revealed by activity-based quantitative mass spectrometry. (A) HEK293T cells were treated with 25 μM PR-619 or 25 μM P22077 for 6 hours. Crude extracts were incubated with either HAUbVME or with HAUbBr2 followed by anti-HA immunoprecipitation. Eluted material was digested with trypsin and subjected to label-free quantitative mass spectrometry (UPLC-MS/MS) analysis. (B) Inhibition profiles of 25 DUBs identified by tandem mass spectrometry (UPLC-MS/MS). Relative abundance ratios of inhibition based on DUBs isolated from cells treated with PR-619 (green bars) or P22077 (orange bars) as compared to controls. Top panel: Unique DUBs isolated using the HA-UbBr2 probe. Bottom panel: DUBs isolated using the HA-UbVME probe. The abundance of each DUB is based on the ion intensities of tryptic peptides matching a unique DUB protein sequence identified in triplicate analytical runs. Analysis of variance (ANOVA) was used to calculate the statistical significance of the observed changes: *p < 0.05, **p < 0.01, ***p < 0.001 (see the article’s Supplemental Information). One of two independent experiments is shown. (C) As described above, cellular DUBs were isolated by HA-UbVME labeling and anti-HA immunoprecipitation. As a control for the MS experiment (B), input (left panel) and anti-HA immunoprecipitated material (IP, right panel) were separated by 4%–12% Bis-tris SDS-PAGE and analyzed by immunoblotting with HA, USP7, and β-actin (loading control) antibodies.
Synthesis of HAUb-derived probes. (A) The intein-based chemical ligation method. Recombinant HAUb75-intein-chitin binding domain (CBD) fusion protein was bound to a chitin affinity column; on-column cleavage of the HAUb-intein junction was induced by the addition of 2-mercaptoethane sulfonic acid (MESNa). The resulting HAUb75-MESNa thioester was reacted with a desired C-terminal thiol-reactive group as described in the article, generating the desired HAUb-derived probe. (B) Site of attack of a hydrolase on the peptide bond at the C terminus of Ub. (C) Structures of C-terminal thiol-reactive groups used. Figure from Borodovsky et al., Chem Biol 2002;9:1149–1159.
Have You Seen the Invisible Mouse?
Hama H, Kurokawa H, Kawano H, Ando R, Shimogori T, Noda H, Fukami K, Sakaue-Sawano A, Miyawaki A: Scale: a chemical approach for fluorescence imaging and reconstruction of transparent mouse brain. Nat Neurosci 2011;14:1481–1488.
Abstract: Optical methods for viewing neuronal populations and projections in the intact mammalian brain are needed, but light scattering prevents imaging deep into brain structures. We imaged fixed brain tissue using Scale, an aqueous reagent that renders biological samples optically transparent but completely preserves fluorescent signals in the clarified structures. In Scale-treated mouse brain, neurons labeled with genetically encoded fluorescent proteins were visualized at an unprecedented depth in millimeter-scale networks and at subcellular resolution. The improved depth and scale of imaging permitted comprehensive three-dimensional reconstructions of cortical, callosal and hippocampal projections whose extent was limited only by the working distance of the objective lenses. In the intact neurogenic niche of the dentate gyrus, Scale allowed the quantitation of distances of neural stem cells to blood vessels. Our findings suggest that the Scale method will be useful for light microscopy–based connectomics of cellular networks in brain and other tissues.
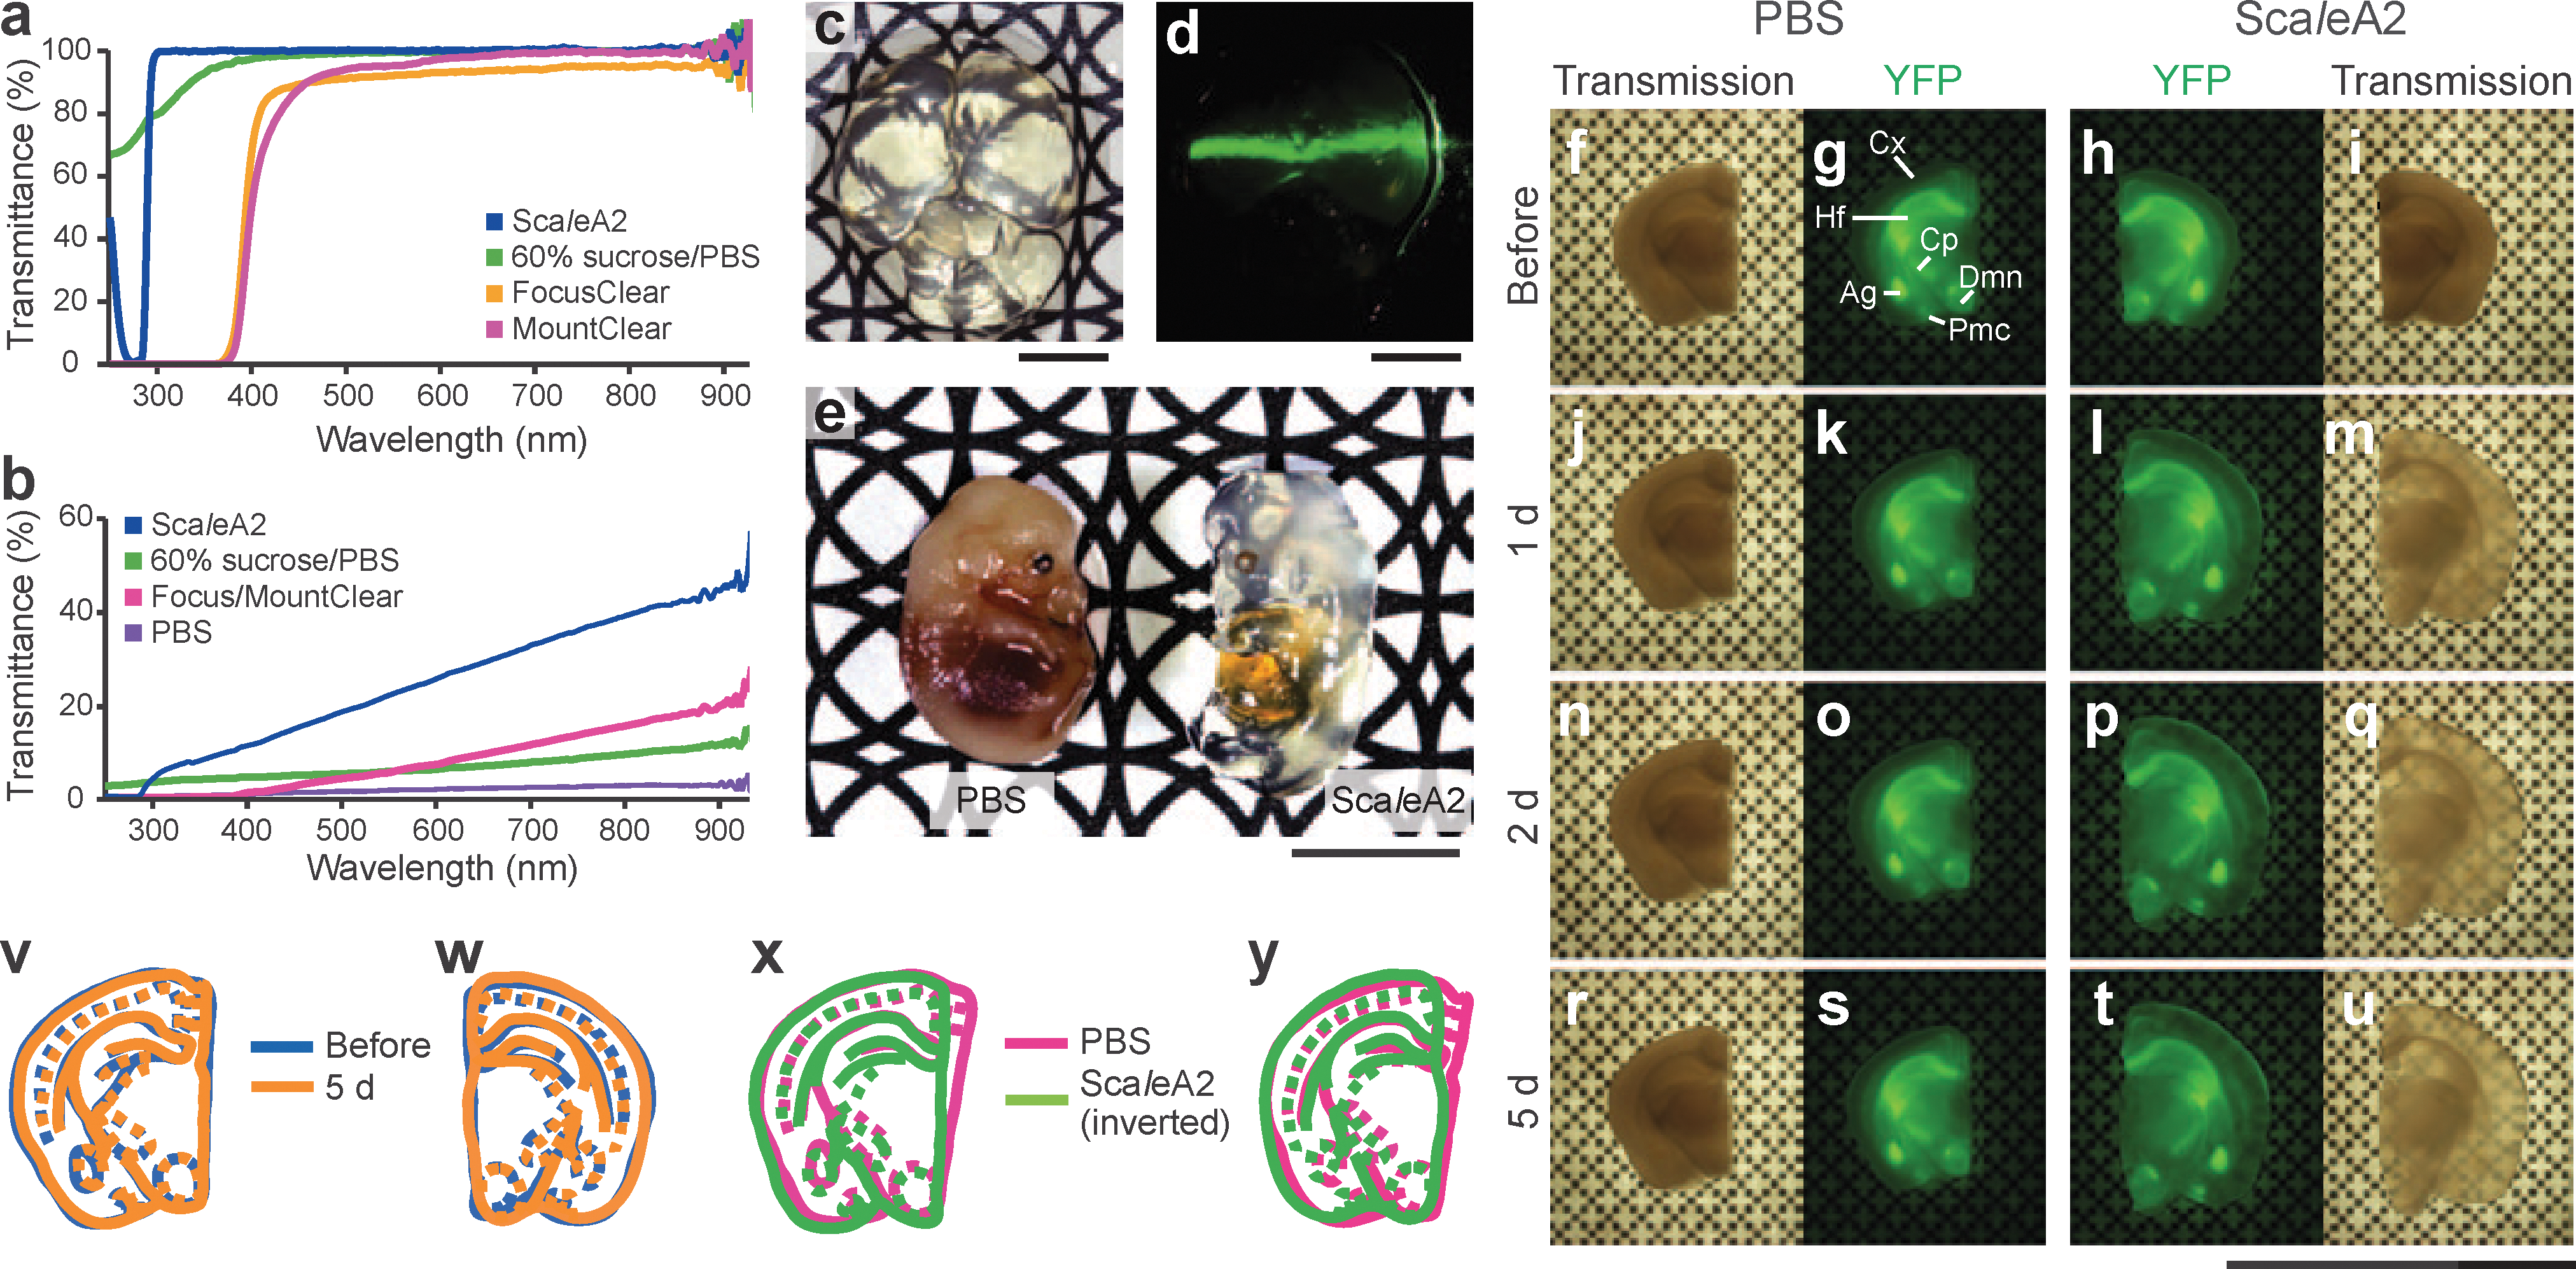
Commentary:Light microscopy is generally limited to tissue samples no thicker than a few hundred micrometers. Confocal microscopes can penetrate up to ∼150 μm and two-photon microscopes can image samples as thick as 800 μm, but tissue slices >1 mm are not currently accessible by light microscopy due to the large amount of light scattering, background fluorescence, and changes in refractive index that occur within a deep sample volume. Optical clearing agents have been developed to help reduce light scattering effects, but these are often expensive and have proprietary formulations that are validated for only a few specific tissue types. As well, many of these can show excessive dehydration with subsequent distortion of organelles and can also quench commonly used fluorophores. The discovery of Scale occurred when it was noticed that a solution of 4 M urea rendered polyvinylidene fluoride membranes transparent. This observation prompted the investigators to search for clearing solutions that could render tissue samples transparent. The optimal formulation, ScaleA2, contains 4 M urea, 10% (w/v) glycerol, and 0.1% (w/v) Triton X-100, the glycerol being present to prevent excess hydration promoted by the high urea concentration. The ScaleA2 solution has a refractive index of ∼1.38 and absorbs light at 276 nm but is transparent to light with >300-nm wavelengths (see
figure
). For standard tissue samples, the clearing solution can be added after treatment with standard fixatives. Alternatively, ScaleA2 can be infused into thick tissue slices or whole mice. For infusing of intact mice the treatment is allowed to proceed for 2 weeks. The brain of the transparent mouse was estimated to swell by approximately 1.25 fold after the 2-week treatment. Importantly, this study found that ScaleA2 did not quench the fluorescence from commonly used fluorescent proteins such as eGFP or YFP (see
figure
). This result showed ScaleA2 to be superior to other solutions that contain organic solvents, many of which quench fluorescent protein's fluorescence. The paper shows imaging data obtained from YFP-expressing neurons by coupling ScaleA2-treated samples with two photon microscopy, which allowed three-dimensional reconstructions of neuronal structures in samples as thick as 2 mm. The imaging depth achievable with ScaleA2 was limited by the working distance of the microscope objective. To provide for a high resolution long working range objective, the authors obtained a specially designed objective from Nikon which has a NA of 1.0 and a working distance of 4 mm (25× magnification). This allowed for imaging deep into the brain of the transparent mouse. The clearing solution described here should extend the range of samples that can be imaged using light microscopy. Contributed by Doug Auld.
Tissue clearing performance of ScaleA2. (a) Transmission curves of ScaleA2 (blue), 60% sucrose/PBS (green), FocusClear (yellow), and MountClear (magenta). (b) Transmission curves of fixed brain slices (1.5 mm thick) in ScaleA2 (blue), 60% sucrose/PBS (green), Focus/MountClear (magenta, a slice treated with FocusClear was placed in MountClear), and PBS (violet) after treatment with the respective solutions. (c,d) A whole fixed and cleared brain of a mouse (P15) after treatment with ScaleA2 for 2 weeks. (c) A photo was taken with a black and white pattern as background. (d) The green light from a 1-mW, 532-nm laser beam pointer traversed the cleared brain. (e) A photo of two embryos (E13.5) taken with a black and white pattern as background. Left, embryo placed in PBS after fixation with 4% PFA. Right, embryo incubated in ScaleA2 solution for 2 weeks after fixation with 4% PFA. (f–y) Characterization of the expansion of macroscopic structures in fixed brain slices of a YFP-H mouse during ScaleA2 treatment. A coronal slice (1 mm thick) containing the hippocampus was prepared from a 9-week-old mouse. The slice was split into two halves and the right half was incubated in ScaleA2 solution for 5 d while the left half was incubated in PBS. Before (0 d, f–i) and 1 d (j–m), 2 d (n–q) or 5 d (r–u) after these incubations, the pair of slices on a coverslip with a patterned background were imaged using a fluorescence stereomicroscope for transmission (f,i,j,m,n,q,r,u) and YFP fluorescence (g,h,k,l,o,p,s,t). The slice became transparent and expanded after a 1–2-d incubation in ScaleA2 solution (l,m,p,q,t,u). The extent of the linear expansion was calculated as 1.28. The outlines of the slices and their internal structures at 0 d and 5 d were drawn with blue and orange, respectively. The outlines of the PBS-treated slice at 0 d and 5 d overlapped substantially (v). Reduced drawings of the outlines of the ScaleA2-treated slice at 5 d also overlapped with the outlines at 0 d extensively (w). In addition, the outlines of the ScaleA2-treated half (green) at 0 d were inverted and overlaid to the outlines of the PBS-treated half (magenta) at 0 d. As the brain slice had been split slightly asymmetrically, the edges of each half were not precisely even, but proper alignment was achieved (x). A similar overlay was done between the size-normalized outlines at 5 d (y). In (x) and (y), the difference between green and red traces indicates the inherent baseline left/right asymmetry of the slice. Notably, the degree and distribution of the asymmetry are almost identical between (x) and (y). All scale bars represent 5 mm. Ag, amygdala; Cp, cerebral peduncle (basal part); Cx, cortex; Dmn, dorsomedial nucleus; Hf, hippocampal formation; Pmc, posteromedial cortical amygdala nucleus.
Is the Combination Therapy More Than Twice as Nice?
Liu R, Liu D, Xing M: The Akt inhibitor MK2206 synergizes, but perifosine antagonizes, the BRAFV600E inhibitor PLX4032 and the MEK1/2 inhibitor AZD6244 in the inhibition of thyroid cancer cells. J Clin Endocrinol Metab 2011 Nov 16 [Epub ahead of print]; doi: 10.1210/jc.2011-1054.
Abstract:Purpose: The purpose of the study was to explore optimal combinations of currently actively developed drugs for dually targeting the Ras → Raf → MAPK kinase (MEK) → MAPK/ERK (MAPK) and the phosphatidylinositol 3-kinase/Akt pathways as effective treatments for thyroid cancer. Experimental Design: We tested the combinations of the Akt inhibitors MK2206 or perifosine with the BRAFV600E inhibitor PLX4032 or the MEK1/2 inhibitor AZD6244 in thyroid cancer cells harboring both the BRAFV600E and PIK3CA mutations. Results: We found that MK2206 could potently, when used alone, and synergistically, when combined with either PLX4032 or AZD6244, inhibit thyroid cancer cell growth with all the combination index values lower than 1. Perifosine could potently inhibit thyroid cancer cell growth when used alone, but a strong antagonism occurred between this drug and PLX4032 or AZD6244 in the inhibition of thyroid cancer cell growth with all combination index values higher than 1. Combinations of MK2206 with PLX4032 or AZD6244 dramatically enhanced G1 cell cycle arrest induced by each drug alone. However, G2 cell cycle arrest uniquely induced by perifosine alone and G1 cell cycle arrest induced by PLX4032 or AZD6244 were both reversed by combination treatments, providing a mechanism for their antagonism. All these drugs could correspondingly inhibit the MAPK and phosphatidylinositol 3-kinase/Akt signalings, confirming their expected target effects. Conclusions: We demonstrated, unexpectedly, opposite outcomes of MK2206 and perifosine in their combinational treatments with BRAFV600E/MEK inhibitors in thyroid cancer cells. The data may help appropriate selection of these prominent drugs for clinical trials of combination therapies for thyroid cancer.
De Raedt T, Walton Z, Yecies JL, Li D, Chen Y, Malone CF, Maertens O, Jeong SM, Bronson R, Lebleu V, Kalluri R, Normant E, Haigis MC, Manning BD, Wong K-K, Macleod KF, Cichowski K: Exploiting cancer cell vulnerabilities to develop a combination therapy for Ras-driven tumors. Cancer Cell 2011;20:400–413.
Abstract: Ras-driven tumors are often refractory to conventional therapies. Here we identify a promising targeted therapeutic strategy for two Ras-driven cancers: Nf1-deficient malignancies and Kras/p53 mutant lung cancer. We show that agents that enhance proteotoxic stress, including the HSP90 inhibitor IPI-504, induce tumor regression in aggressive mouse models, but only when combined with rapamycin. These agents synergize by promoting irresolvable ER stress, resulting in catastrophic ER and mitochondrial damage. This process is fueled by oxidative stress, which is caused by IPI-504-dependent production of reactive oxygen species, and the rapamycin-dependent suppression of glutathione, an important endogenous antioxidant. Notably, the mechanism by which these agents cooperate reveals a therapeutic paradigm that can be expanded to develop additional combinations.
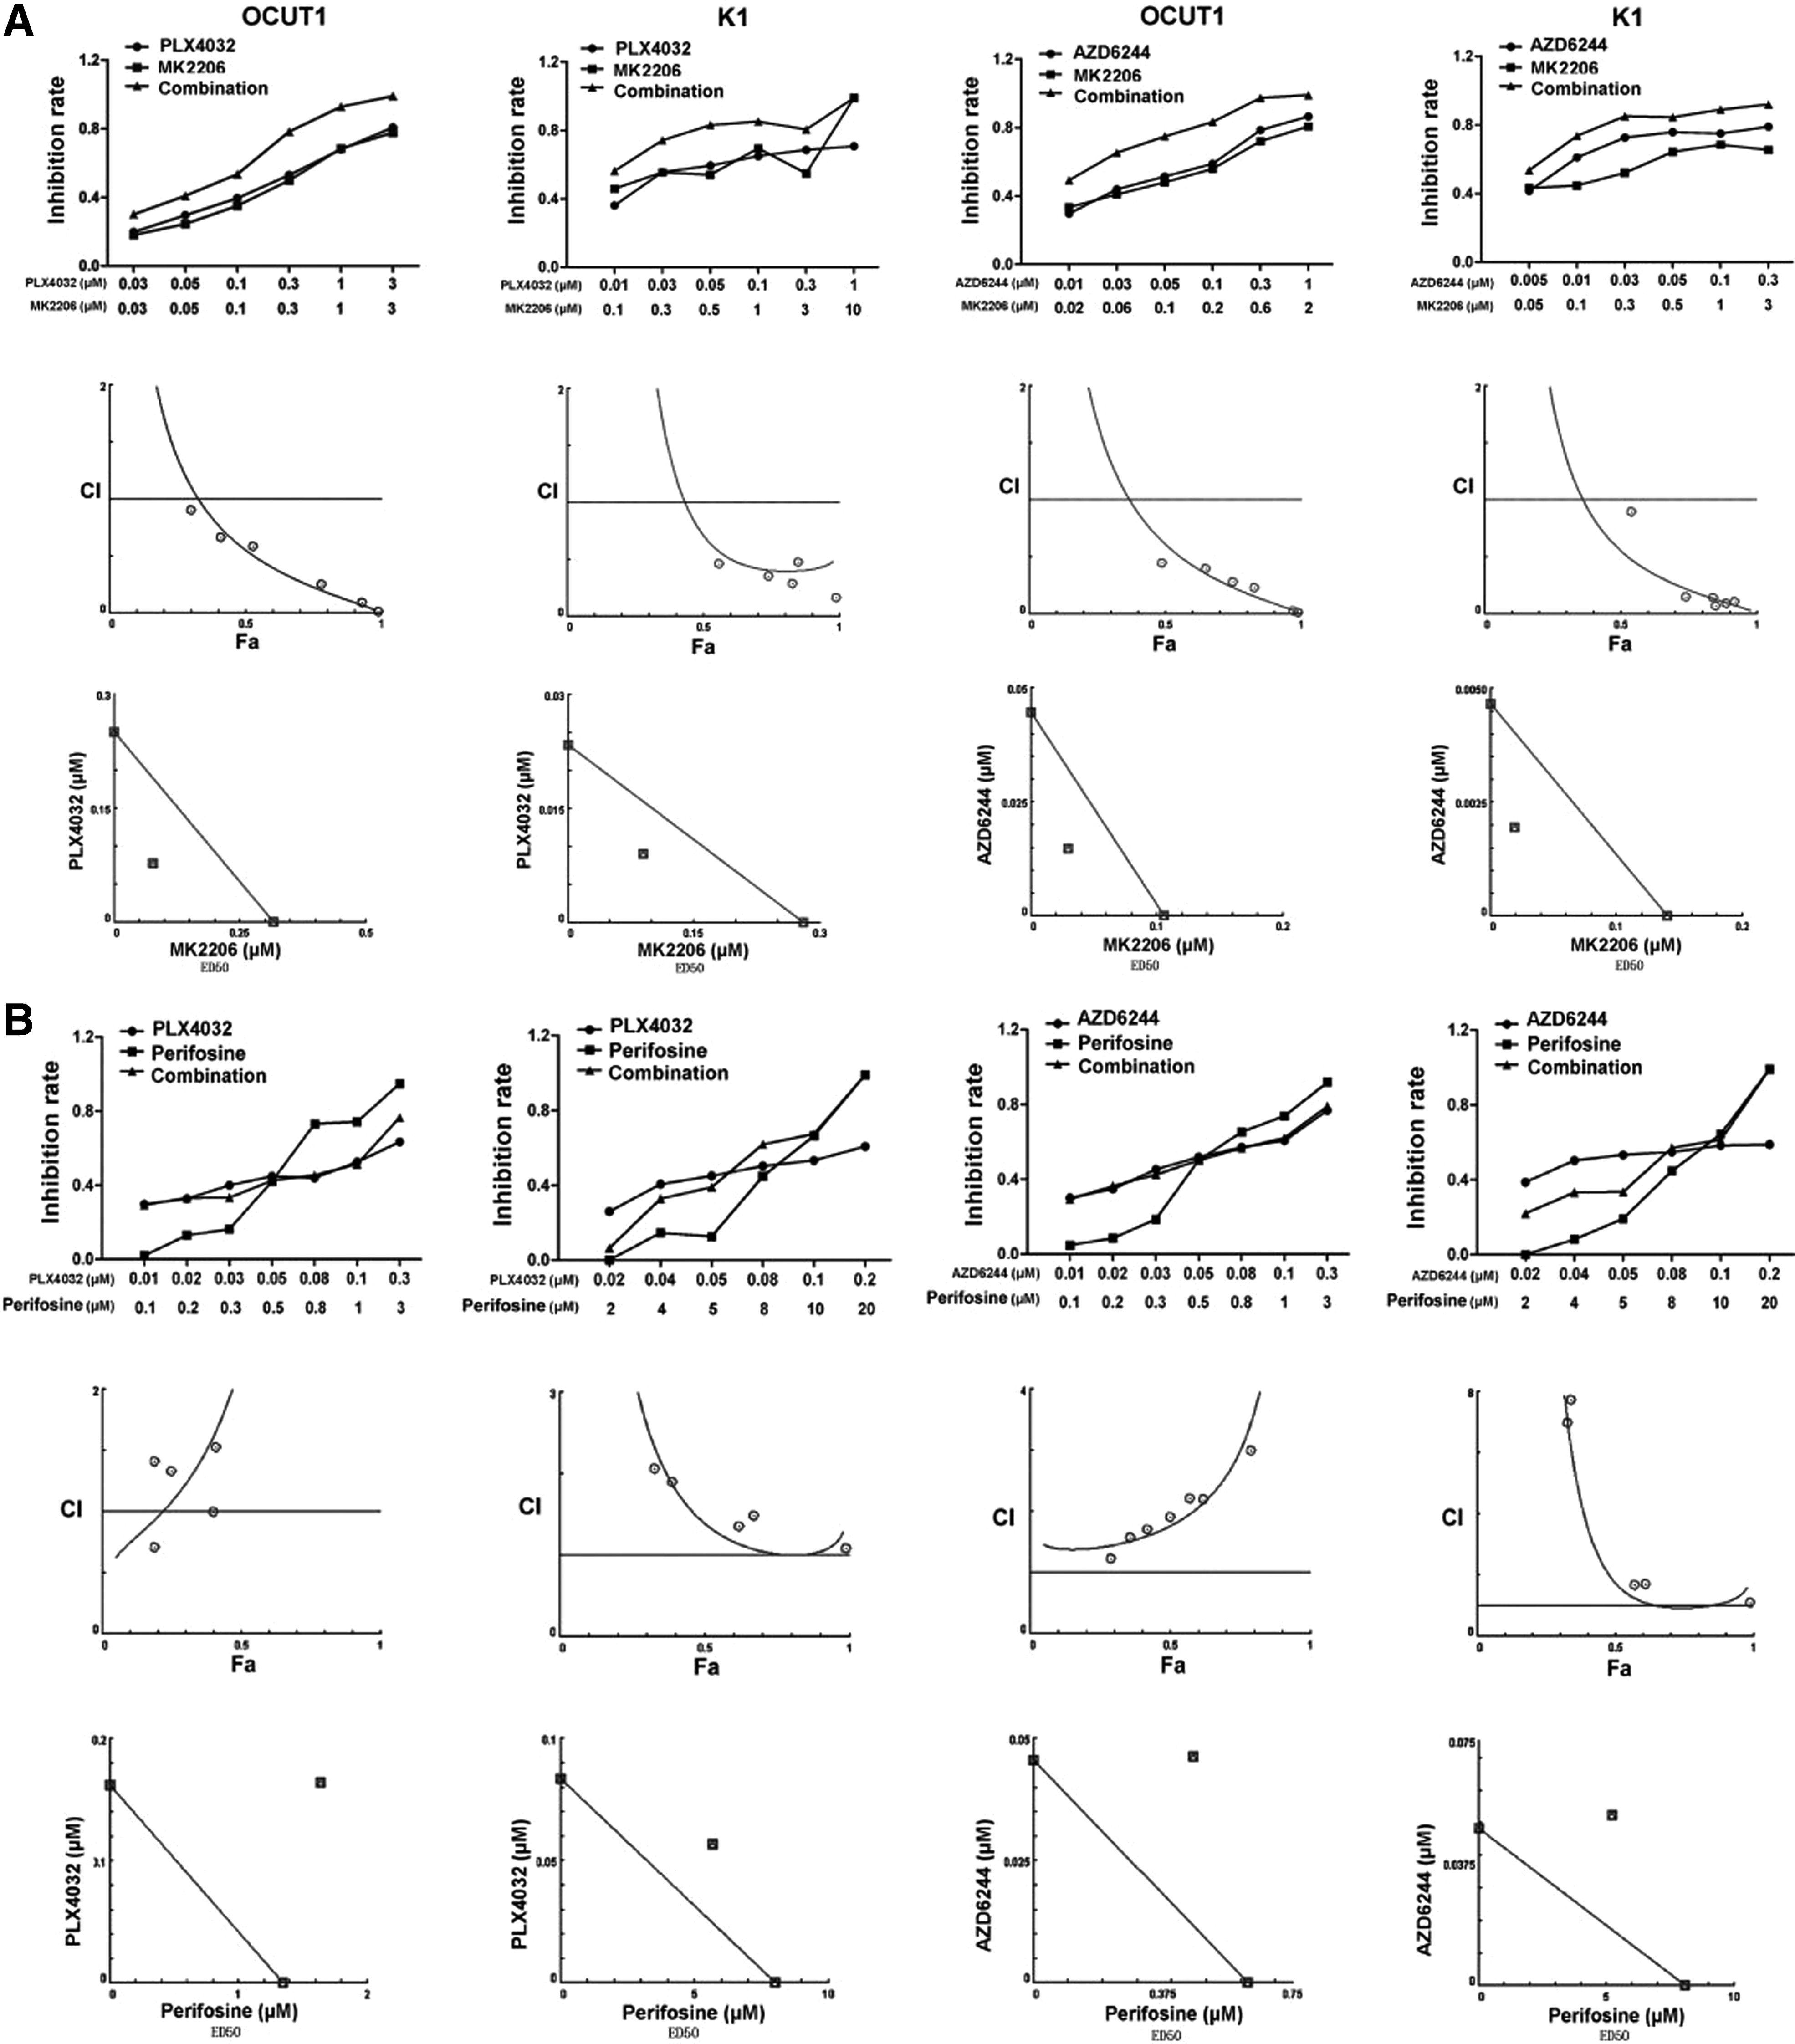
Commentary:Combination therapies have been pursued for many disease areas, such as cancer, central nervous system (CNS) disorders and infectious diseases, such as HIV. For example, the widely used triple drug therapy for HIV leads to long-lasting remission. Combination therapies may lead to a lower risk of resistance, may allow a lower and less toxic dose of each drug to be used, and may provide a synergistic therapeutic effect. Additionally, knocking down one target may sensitize a cell to inhibition by a second target; i.e., be synthetic lethal. Bert Vogelstein of Johns Hopkins University has pointed out that developing a cocktail that corners all of a given cancer's escape routes may be more difficult than for HIV because cancer cells have a greater genetic heterogeneity than HIV within a patient (Kaiser, Science 2011;331:1542). Signaling pathways are complex and contain redundancy and feedback loops. Therefore, a drug that targets just one part of a pathway may not be sufficient for the desired therapeutic effect. A multi-pronged approach may be required. An example of a drug for which resistance has been observed is PLX4032, which is a Braf inhibitor developed for the treatment of malignant melanoma and which also inhibits thyroid cell growth. After initial impressive results of tumor disappearance or shrinkage, tumors began to regrow after about 7 months. The cancer was not fully eliminated in most patients, and cells that were resistant to the treatment began to flourish. It was found that the cells did not have new BRAF mutations but rather some had an activated downstream pathway member, MEK (mitogen-activated protein kinase kinase). PLX4032 may be best combined with another drug that targets the pathway at another point, such as MEK, or targets the tumor through another mechanism. About 80% of the aggressive anaplastic thyroid cancers contain mutations that could activate both the RAS/RAF/MEK/extracellular-signal-regulated kinase (ERK) pathway and the phosphatidylinositol 3-kinase (PI3K)/AKT pathway. Targeting both pathways at once may provide the best chance for treatment success. In the first article, Liu et al. tested an allosteric AKT inhibitor MK2206 in combination with either PLX4032 or the MEK inhibitor AZD6244 to look for drug synergies for the treatment of thyroid cancer. They also tested the AKT inhibitor perifosine, which targets the pleckstrin homology domain of AKT and prevents AKT's translocation, phosphorylation, and activation. MK2206 and AZD6244 showed nice synergy in thyroid cancer cells, consistent with the synergy previously noted for lung cancer and malignant melanoma cells (
first figure
). MK2206 and PLX4032 also showed synergism in cell lines in which both pathways had alterations and did not show synergism in cells in which neither or only one of the two pathways was altered (
first figure
). In contrast to the synergy observed with MK2206, perifosine antagonized the activity of both PLX4032 and AZD6244 (
first figure
). The authors point out that the G2 cell cycle arrest induced by perifosine alone and the G1 cell cycle arrest induced by PLX4032 or AZD6244 alone is reversed when the drugs were used in combination. In the second article, De Raedt et al. examine a combination approach for RAS-driven tumors, which are often difficult to treat with conventional therapies. The combination of the mammalian target of rapamycin (mTOR) inhibitor rapamycin, which suppresses the antioxidant glutathione, and the molecular chaperone heat shock protein 90 (HSP90) inhibitor IPI-504, which enhances proteotoxic stress, exhibits synergy in two RAS-driven cancers (NF1-deficient malignancies and KRAS/p53 mutant lung cancer). Cancer cells, such as RAS-driven cancer and cancer with concomitant aneuploidy, frequently have endoplasmic reticulum (ER) stress, whereby unfolded proteins accumulate in the ER. Cancer cells depend on the cell's ability to properly mitigate this stress. Agents that sensitize cells further to these stresses are of interest as potential therapies. IPI-504, a geldanamycin derivative, is known to induce ER stress by impairing protein folding and by inactivating the unfolded protein response (UPR) pathway. IPI-504 promoted malignant peripheral nerve sheath tumor (MPNST) regression only in combination with rapamycin and not as a single agent in vivo or in vitro (
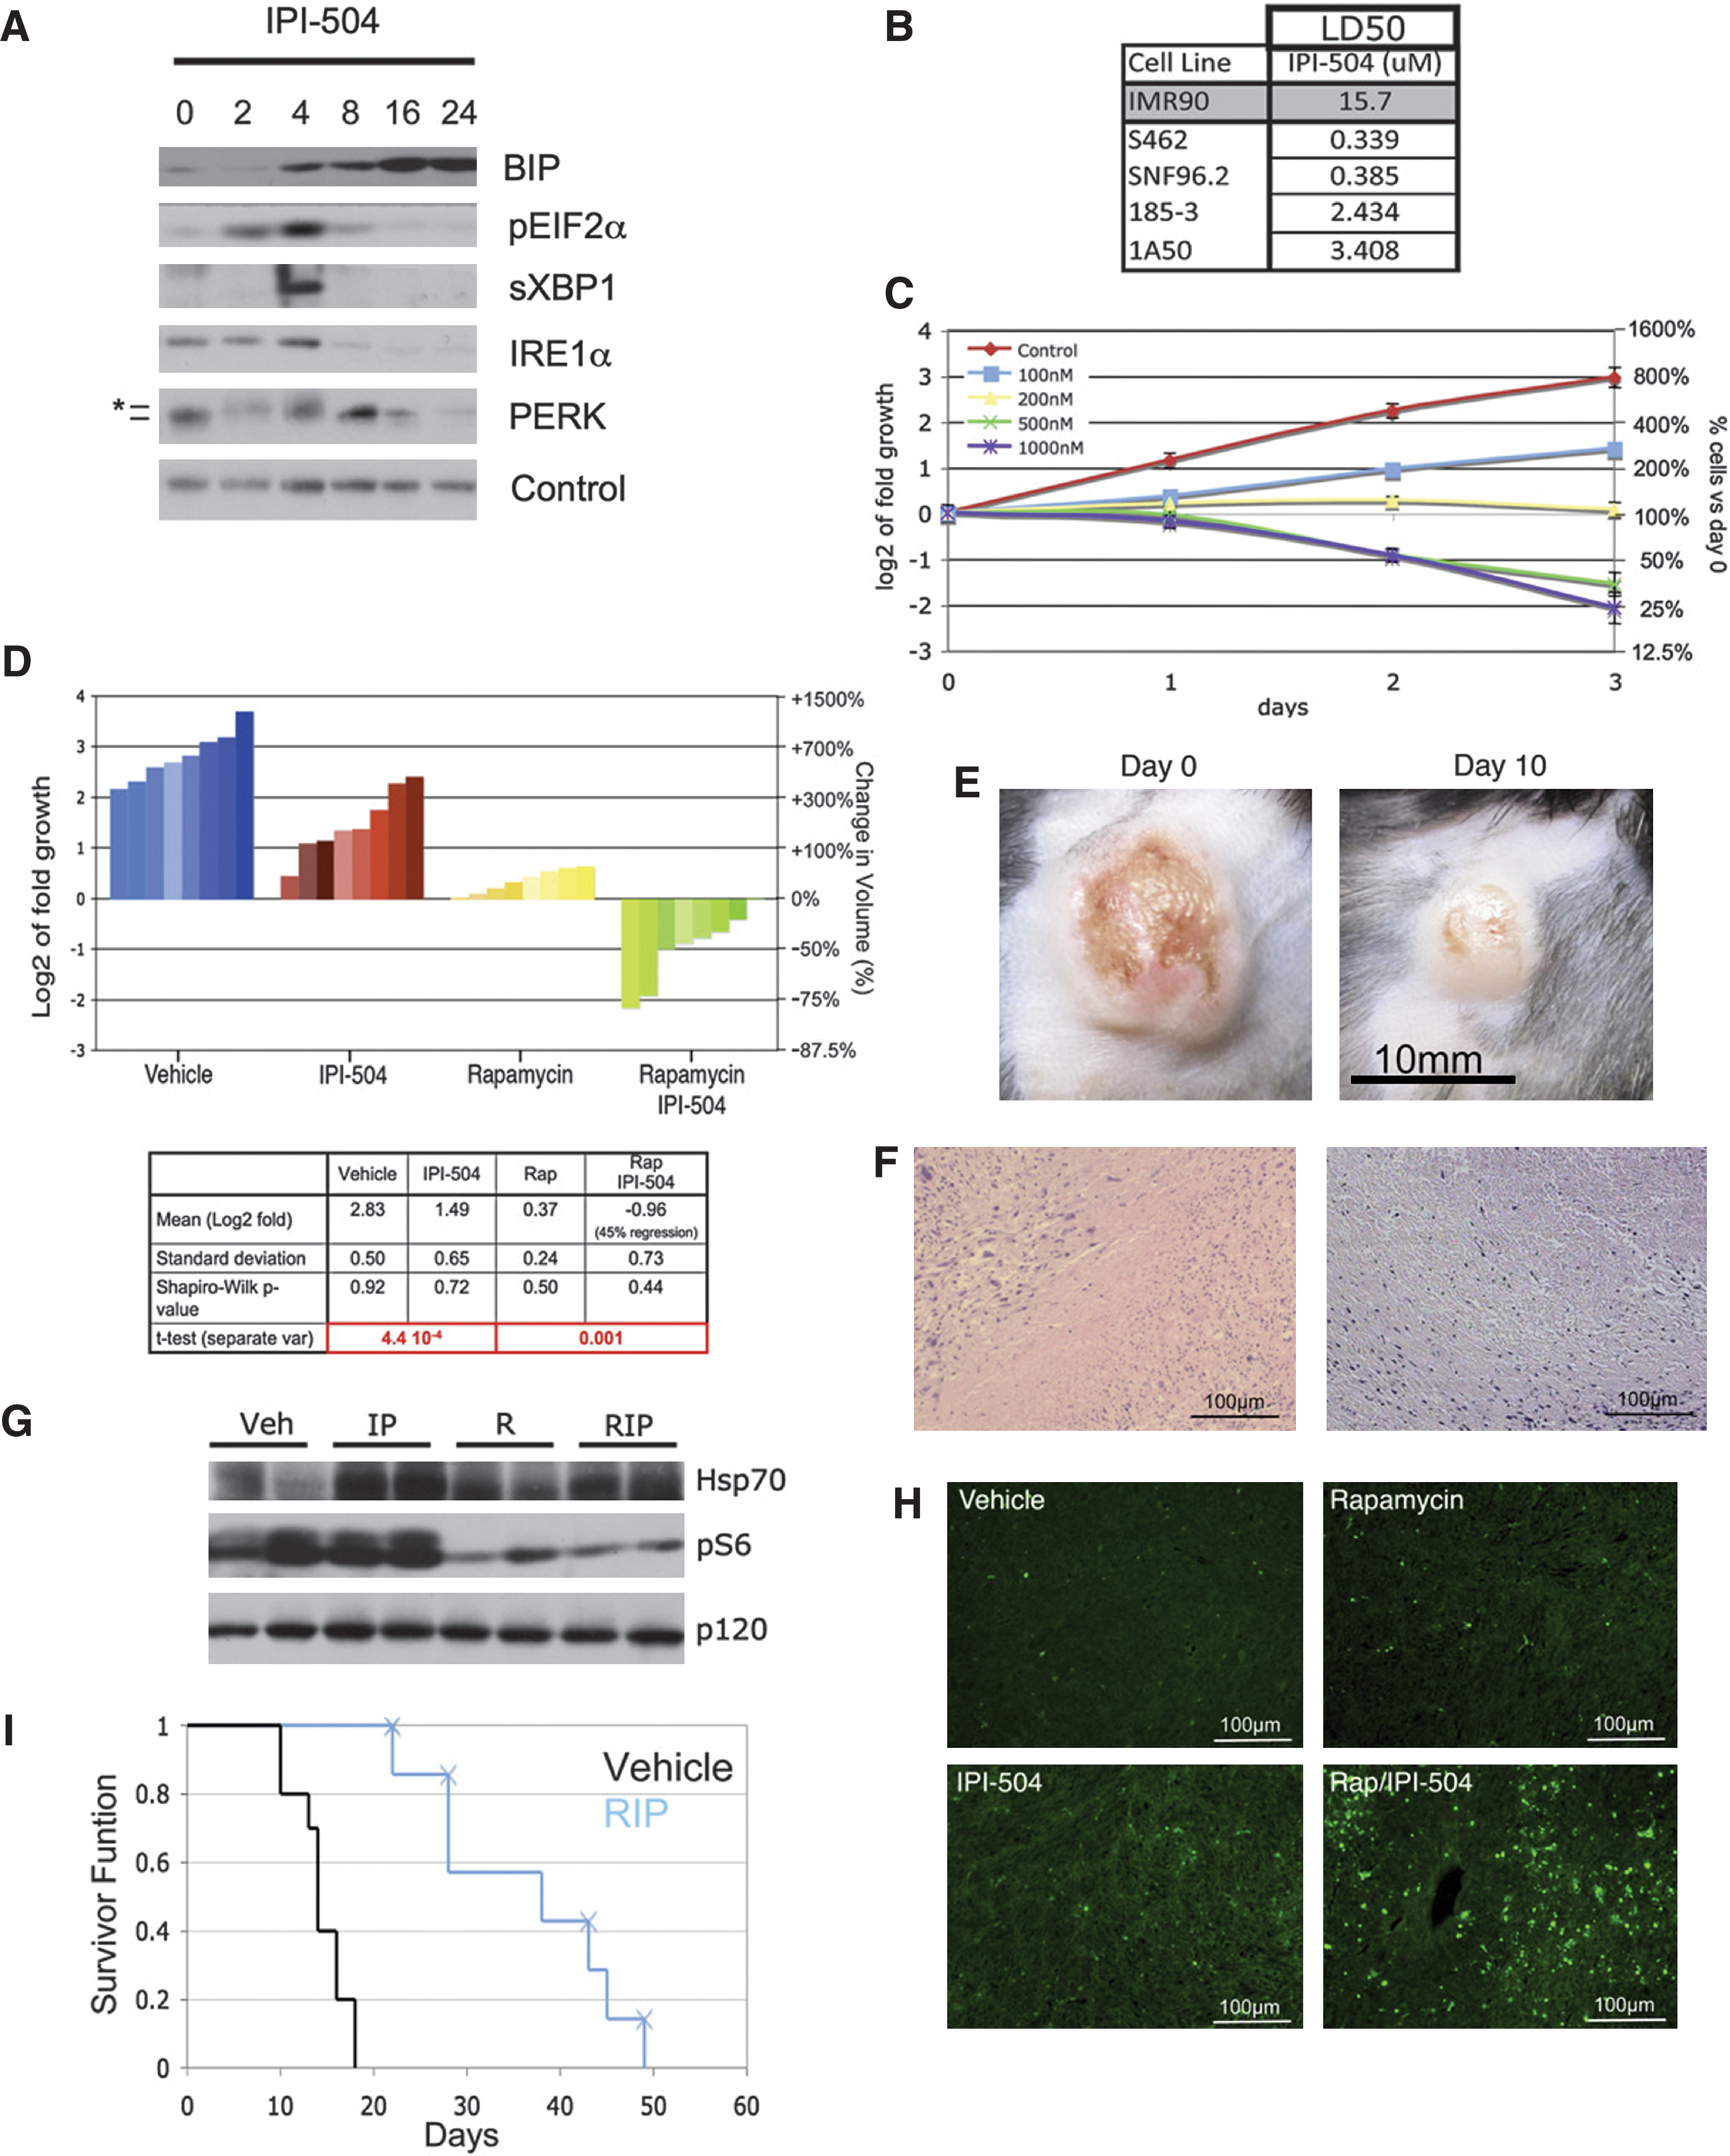
second figure
). This combination leads to a catastrophic destruction of the ER and the mitochondria that is readily apparent in transmission electron microscopy images. The role of reactive oxygen species (ROS) in the cellular effects was confirmed by inhibition of the process by the antioxidant vitamin C. Additionally, tumors treated with rapamycin and IPI-504 had markedly lower levels of reduced glutathione. The authors point out the need to test combinations empirically in rigorous in vivo models. Indeed, Infinity Pharmaceuticals is currently enrolling patients in a combination therapy phase 1b/2 clinical trial for the combination of IPI-504 and an mTOR inhibitor (everolimus). It will be interesting to see how widely applicable this strategy of targeting cancer cells' susceptibility to proteotoxic stress will be. Contributed by Mindy I. Davis.
MK2206 synergistically inhibited the proliferation of thyroid cancer cells when combined with PLX4032 or AZD6244, whereas perifosine antagonized their effects. (A) OCUT1 and K1 cells were treated with MK2206, PLX4032, and AZD6244, individually or in the indicated combinations, with fixed molecular ratios at indicated concentrations for 5 d, followed by an MTT assay [3-(4,5-dimethyl-thiazol-2-yl)-2,5-diphenyltetrazolium bromide assay]. Upper panel: Cell proliferation inhibition rates [defined by OD value (control treatment)/control] of MK2206 (represented by square symbols), PLX4032, or AZD6244 (circles) and the indicated combinations (triangles). Middle panel: Combination index plot for the effects of the combined use of MK2206 with PLX4032 (the left two panels) or AZD6244 (the right two panels). Lower panel: ED50 isobologram for the combination of MK2206 with PLX4032 or AZD6244. (B) OCUT1 and K1 cells were treated with perifosine, PLX4032, or AZD6244 as similarly described in (A). Upper panel: Cell proliferation inhibition rates of perifosine (represented by square symbols), PLX4032, or AZD6244 (circles) and the indicated combinations (triangles). Middle panel: Combination index plot for the effects of combination of perifosine with PLX4032 (the left two panels) or AZD6244 (the right two panels). Lower panel: ED50 isobologram for the combination of perifosine with PLX4032 or AZD6244. Fa, fractional effect.
Rapamycin and IPI-504 promote MPNST regression. (A) Immunoblots of BIP, pEIF2α, sXBP-1, IRE1α, and PERK in human MPNSTs treated with IPI-504 over time (hours). Note that the activation of pEIF2α, sXBP1, IRE1, and PERK (* denotes activated phosphorylated PERK) and initial upregulation of BIP occurs within 2–4 hours. A second wave of BIP upregulation occurs between 8 and 16 hours, as pEIF2α, sXBP-1, IRE1α, and PERK become suppressed. Actin serves as a loading control. (B) LD50 values in response to IPI-504 (72 hours) for normal cells (IMR90), human MPNST cell lines (S462, SNF96.2), and mouse MPNST cell lines (185-3, 1A50). (C) Growth curves of the S462 cell line treated with different concentrations of IPI-504. (D) Waterfall plot depicting tumor growth after 10 days of treatment with vehicle (blue), IPI-504 (red), rapamycin (yellow), and rapamycin/IPI-504 (green). The left y axis indicates the log2 of tumor fold growth versus day 0, and the right y axis shows the change in fold volume. The table reports mean and standard deviation for each treatment arm (n = 8) and mean tumor shrinkage. The Shapiro–Wilk test shows that all datasets have a normal distribution. (E) A photograph of an MPNST is shown at day 0 and after 10 days of treatment with rapamycin/IPI-504. (F) H&E-stained tumors from animals treated with rapamycin/IPI-504. (G) Pharmacodynamic analysis of lung tissue after 16 hours of treatment as shown by an Hsp70 and phosphoS6 immunoblots. p120 serves as a loading control. (H) TUNEL staining of tumors treated for 16 hours. (I) Kaplan–Meier curve of tumor-bearing Nf1/p53 mutant mice treated with vehicle (black) or rapamycin (blue) as described. Xs indicate an animal that was euthanized because of skin ulceration. All error bars show ± SD. H&E, hematoxylin and eosin.
Even More PTMs
Du J, Zhou Y, Su X, Yu JJ, Khan S, Jiang H, Kim J, Woo J, Kim JH, Choi BH, He B, Chen W, Zhang S, Cerione RA, Auwerx J, Hao Q, Lin H: Sirt5 Is a NAD-dependent protein lysine demalonylase and desuccinylase. Science 2011;334:806–809.
Abstract: Silent information regulator 2 (Sir2) proteins (sirtuins) are nicotinamide adenine dinucleotide–dependent deacetylases that regulate important biological processes. Mammals have seven sirtuins, Sirt1 to Sirt7. Four of them (Sirt4 to Sirt7) have no detectable or very weak deacetylase activity. We found that Sirt5 is an efficient protein lysine desuccinylase and demalonylase in vitro. The preference for succinyl and malonyl groups was explained by the presence of an arginine residue (Arg105) and tyrosine residue (Tyr102) in the acyl pocket of Sirt5. Several mammalian proteins were identified with mass spectrometry to have succinyl or malonyl lysine modifications. Deletion of Sirt5 in mice appeared to increase the level of succinylation on carbamoyl phosphate synthase 1, which is a known target of Sirt5. Thus, protein lysine succinylation may represent a posttranslational modification that can be reversed by Sirt5 in vivo.
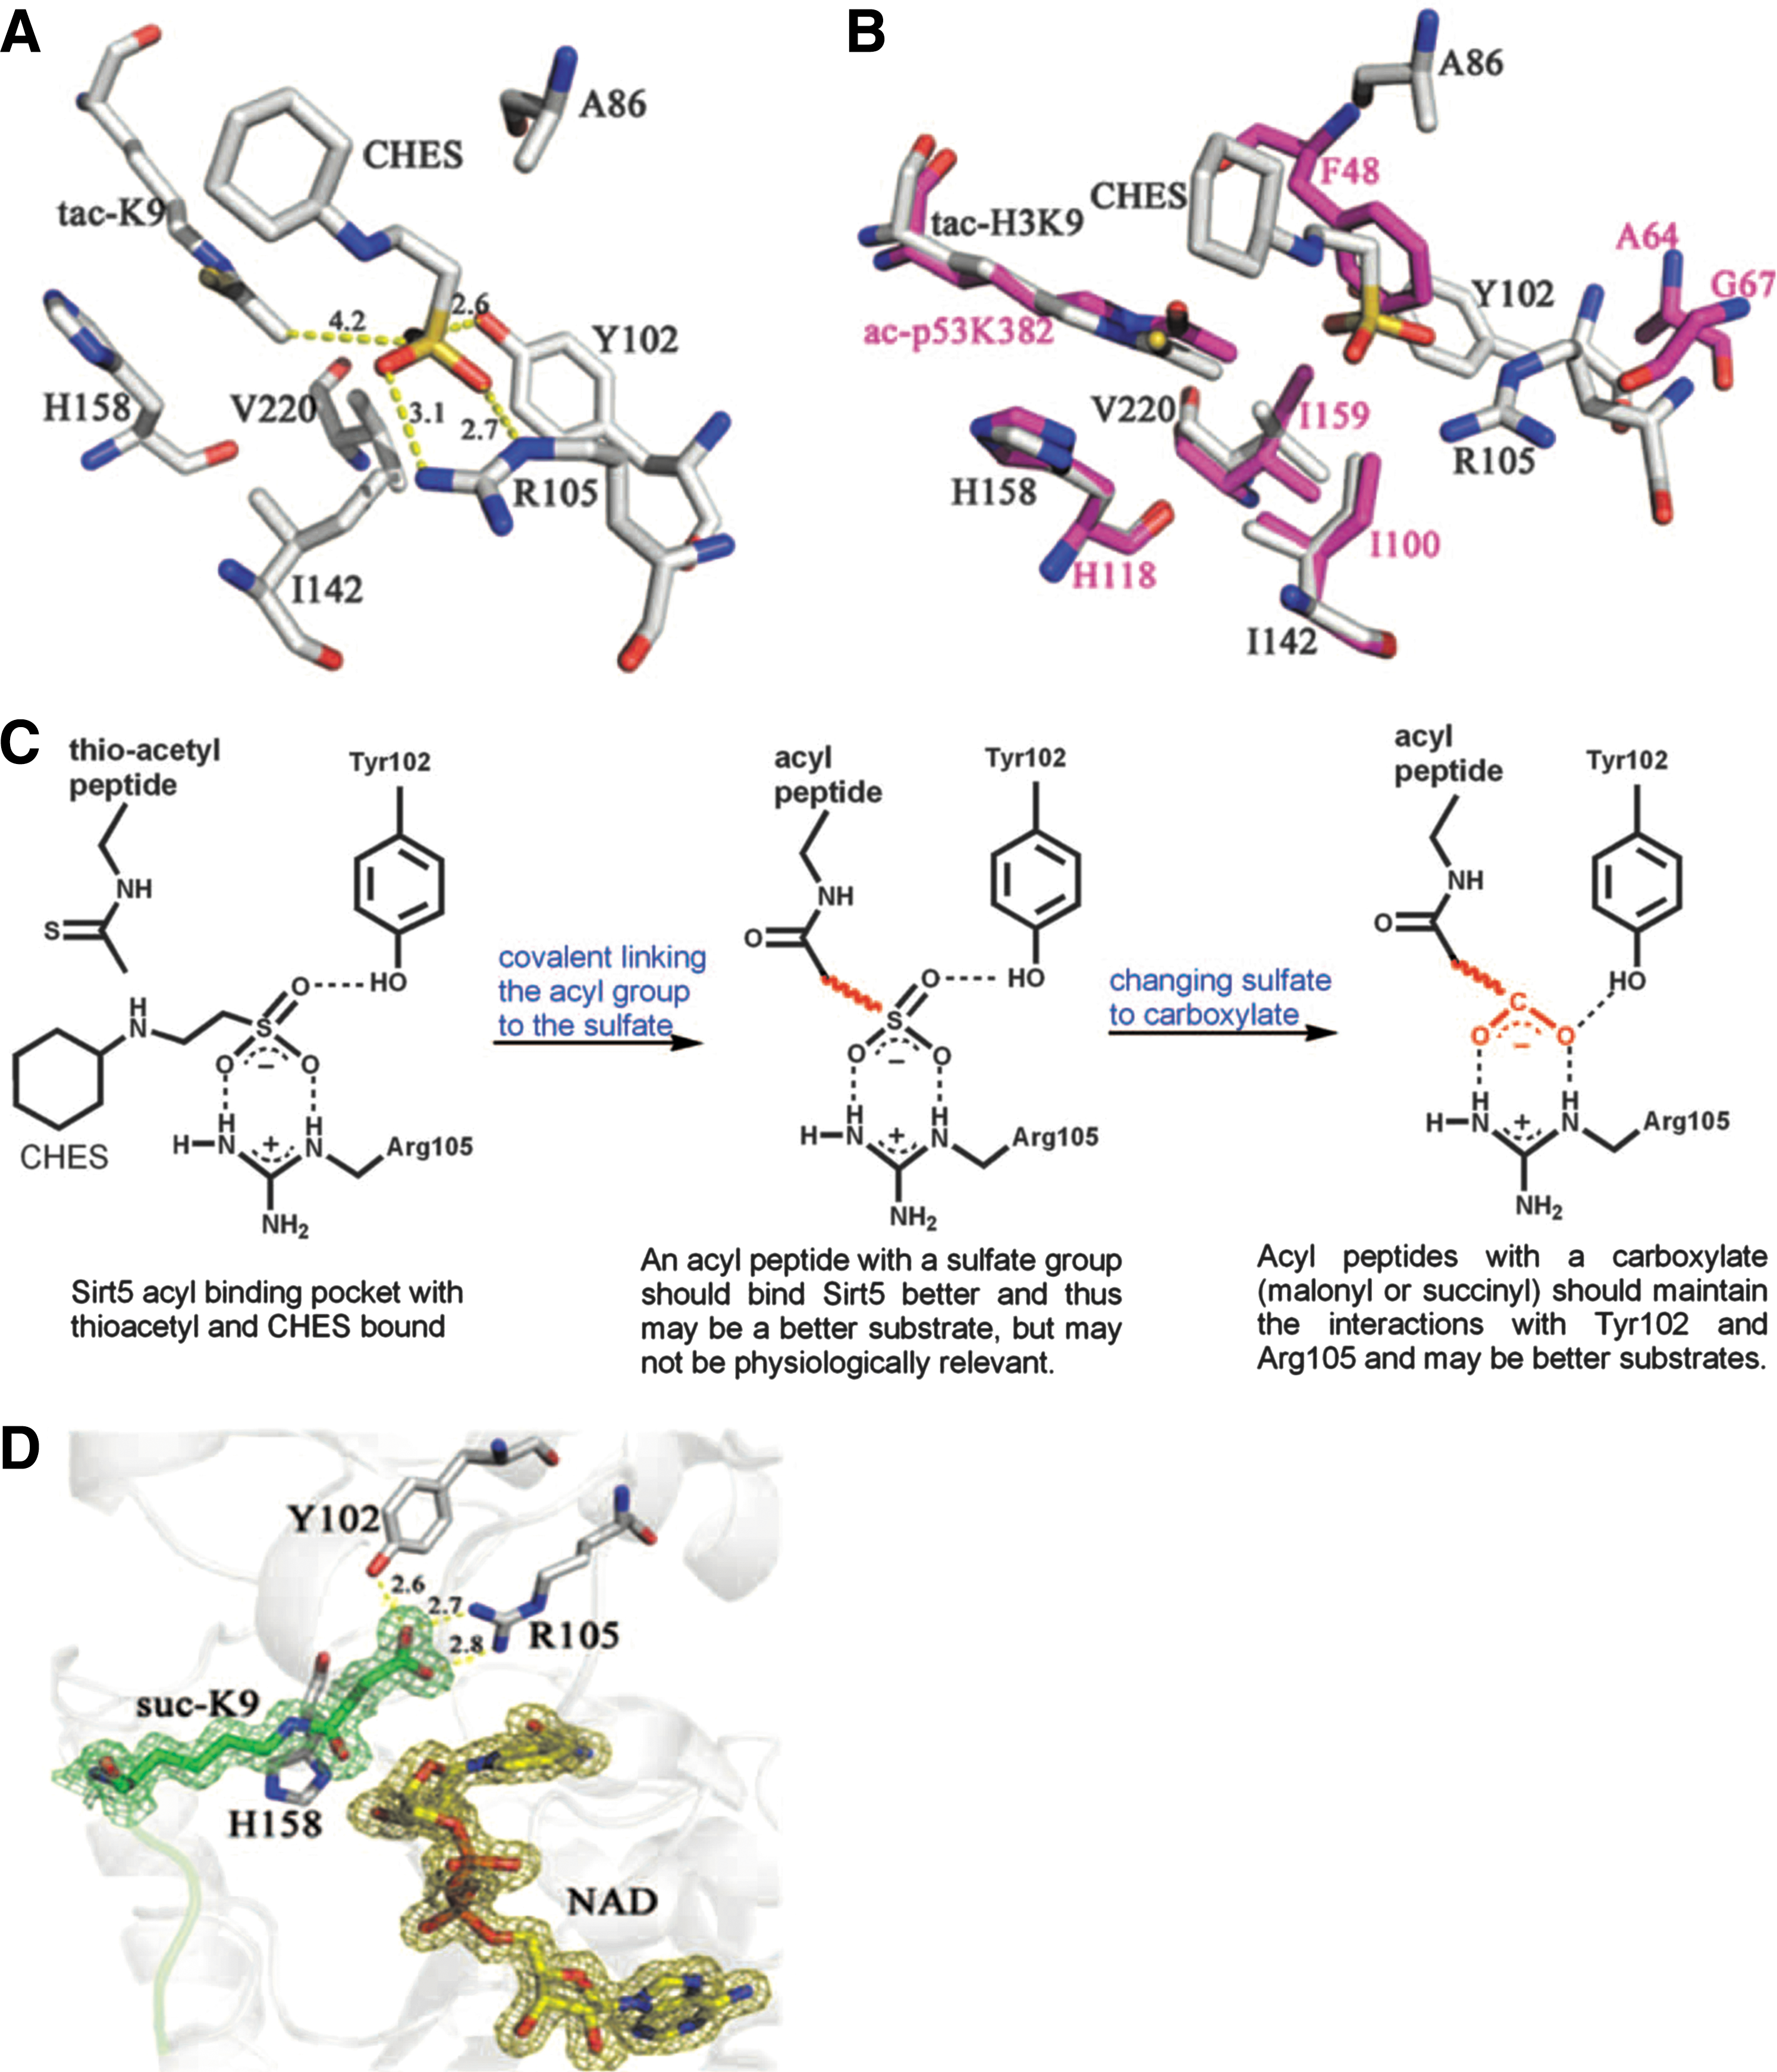
Commentary:The report of Du and colleagues highlights the discovery and initial characterization of yet another protein posttranslational modification (PTM). During the past decade, the number and chemical diversity of PTMs have grown tremendously, with protein acetylation, methylation, ubiquitinylation, and multiple other changes being added to the classical PTM, protein phosphorylation. Sirtuins were originally characterized as NAD-dependent deacetylases, with Sirt1 being the most prominent member of the family. However, some of the more recently isolated sirtuins have displayed very poor enzymatic activity against acetylated protein substrates, complicating the studies of their biological function. In the present study, the authors focused on Sirt5 and, by performing a comparative analysis of its crystal structure, concluded that an acyl group bearing a negatively charged carboxylate should bind to Sirt5 better than a regular acetyl group does, indicating that a dicarboxylate may be a good candidate PTM that Sirt5 operates on. Malonyl-CoA and succinyl-CoA were considered as the obvious candidate precursors due to their relative abundance and utilization in several metabolic processes. Histone H3-derived peptides carrying succinyl and malonyl substitutions of Lysine 9 (H3K9-Su and H3K9-Ma) were tested with several sirtuins, with acetyl counterparts being used as controls (
first figure
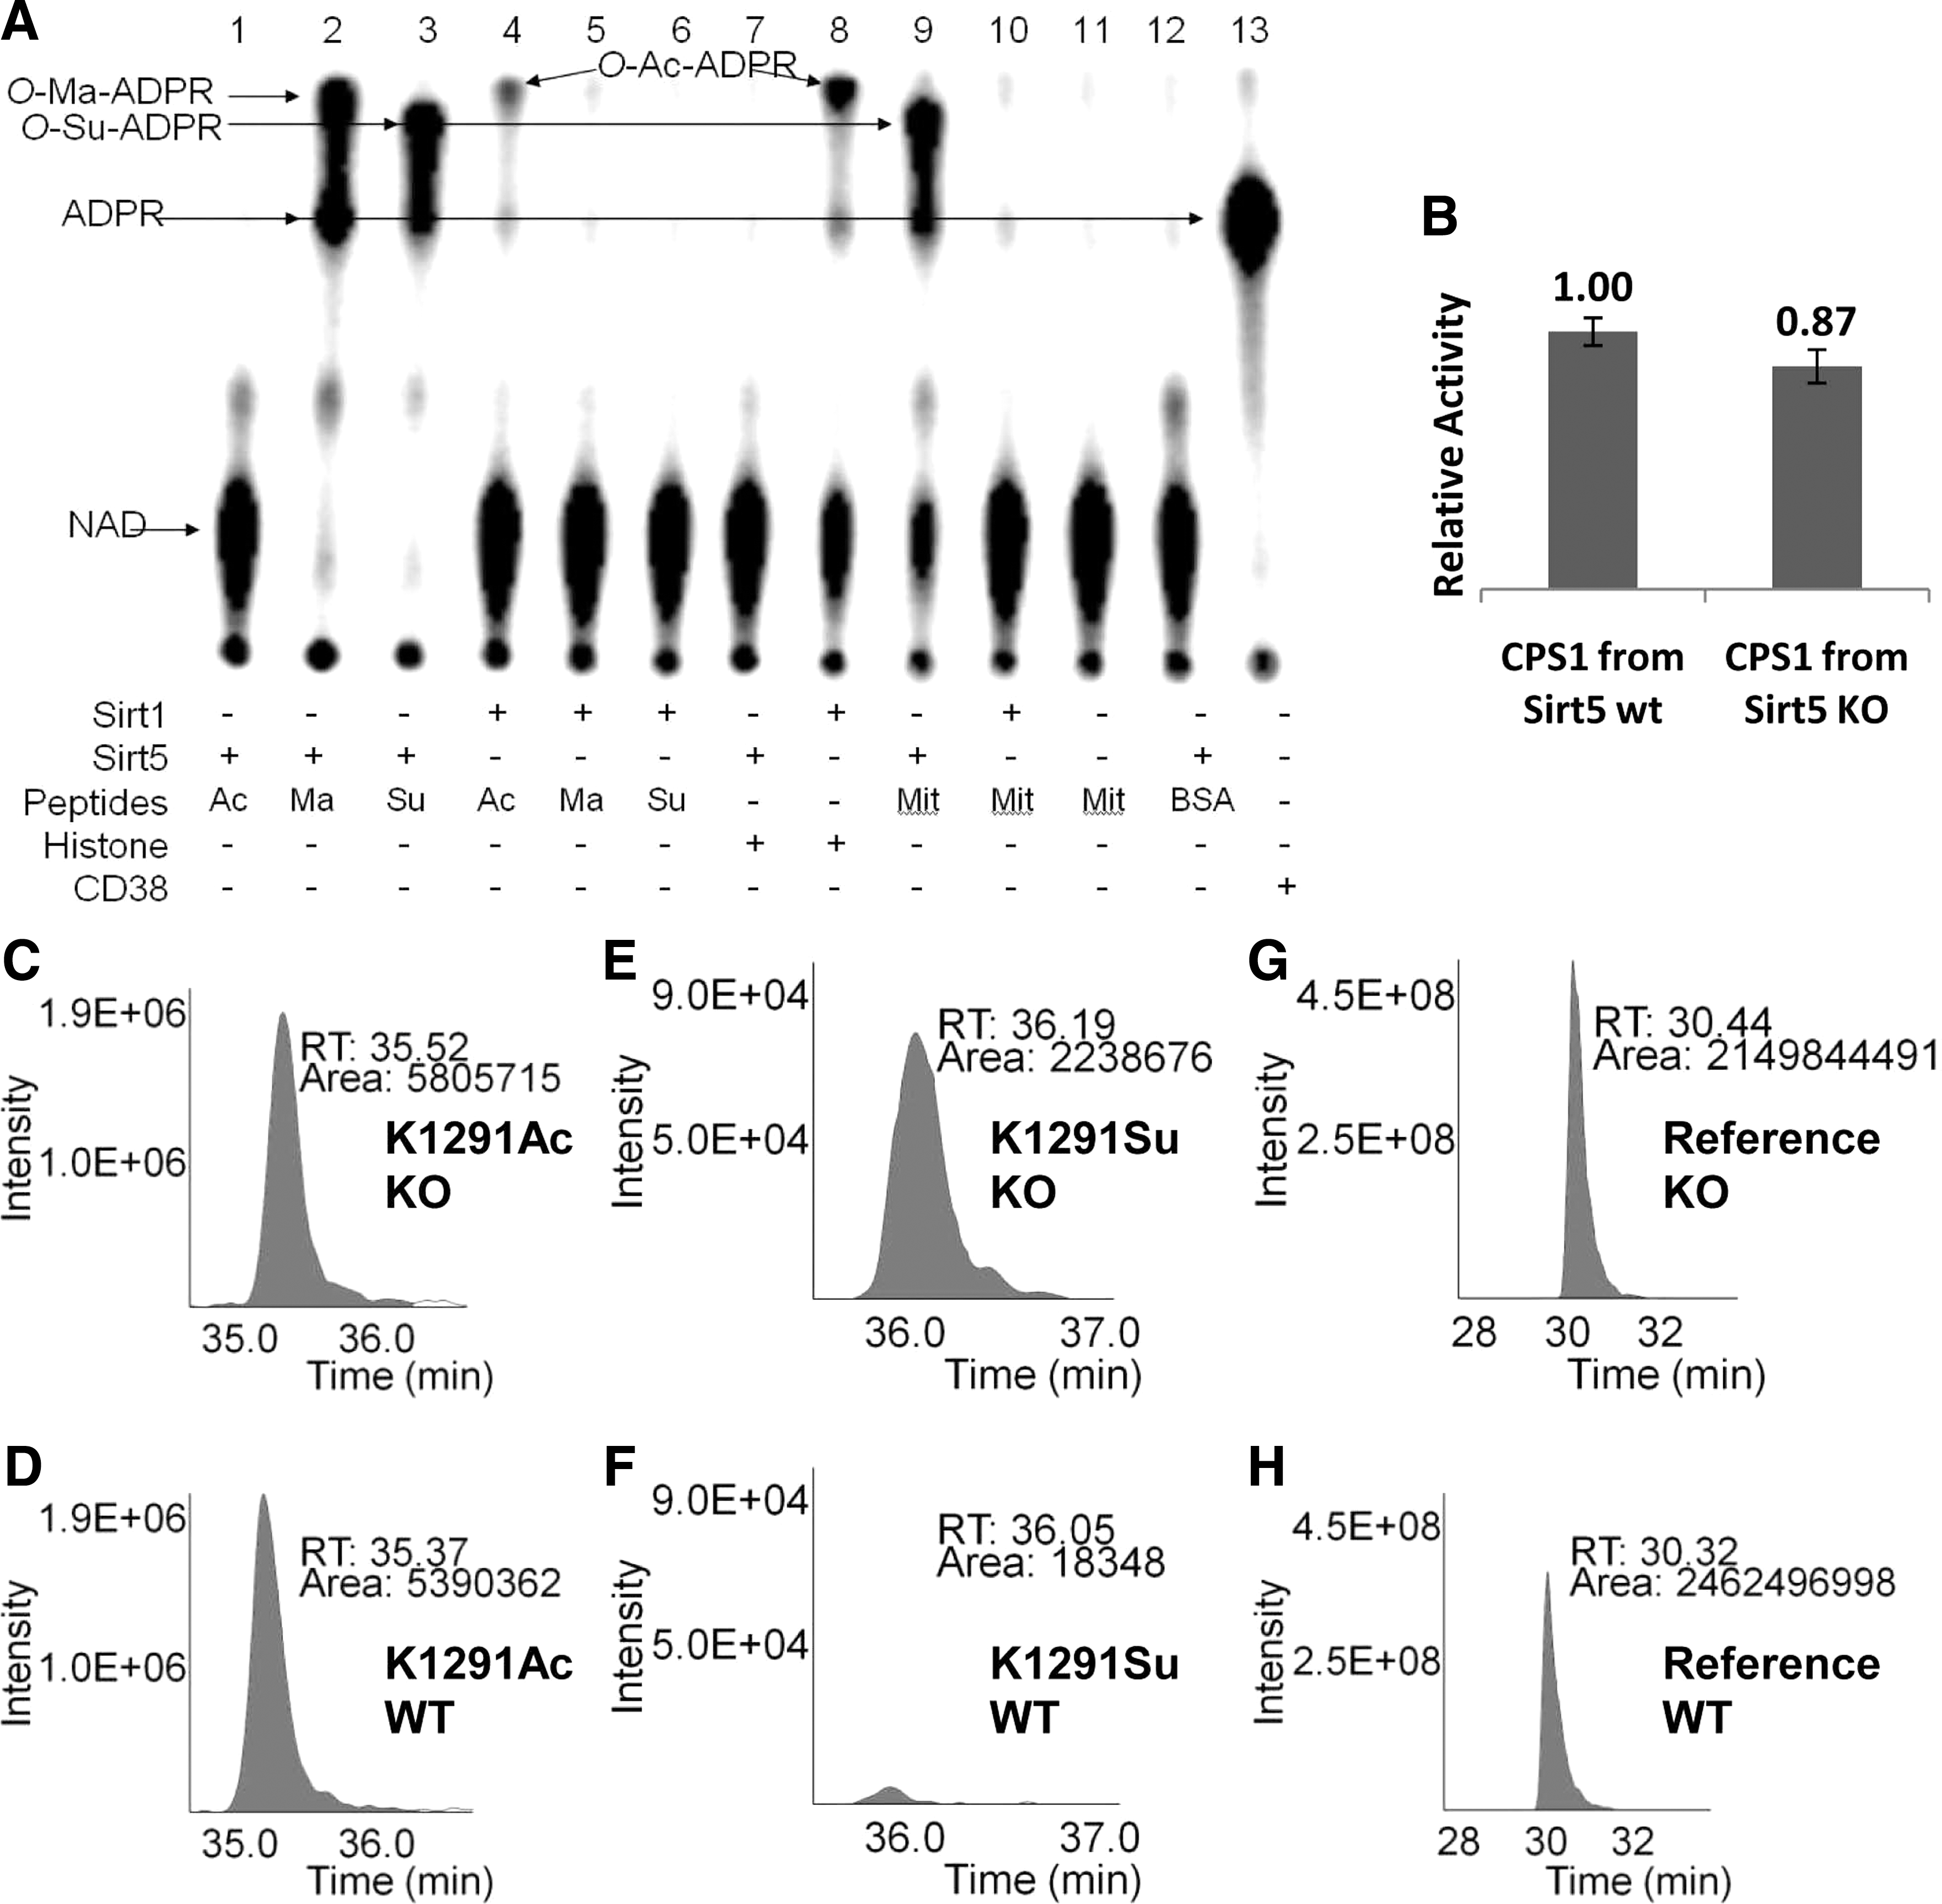
). While Sirt1 efficiently catalyzed the deacetylation of the H3K9-Ac substrate, as expected, Sirt5 almost did not process the acetyl substrate at all and instead showed high efficiency against H3K9-Su and H3K9-Ma. Subsequent X-ray crystallography analysis confirmed the engagement of the succinyl and malonyl substrates into the Sirt5 active site, as predicted from the initial comparative analysis. Using the radiolabeled substrate 32P-NAD, which can form 32P-labeled O-Ma-ADP-ribose and O-Su-ADP-ribose, and treating bovine liver mitochondrial peptides with it and Sirt5, the authors demonstrated the presence of succinylated lysines in mitochondrial proteins (
second figure
). The in vivo relevance of these new PTMs was further demonstrated through affinity capture and purification of succinyl peptides from bovine liver mitochondria via the use of a FLAG-tagged Sirt5, and subsequent protein identification using liquid chromatography and mass spectrometry; by use of a similar approach, malonyl lysine residues were also identified on several proteins. Lastly, a Sirt5 knockout experiment demonstrated that protein lysine succinylation may be a type of PTM that is reversed by the action of Sirt5 in vivo. The relative abundances of these new PTMs in human cells and tissues, as well as their role in human biology, await further elucidation. Contributed by Anton Simeonov.
The structure of Sirt5 revealed an unusual acyl pocket. (A) The acyl pocket of Sirt5 was partially occupied by the sulfate from the N-cyclohexyl-2 aminoethanesulfonic acid (CHES) molecule via interactions with Arg105 and Tyr102. The sulfur was 4.2 Å away from the thioacetyl group. (B) Alignment of Sirt5-thioacetyl peptide structure (gray) and Sir2Tm-acetyl peptide structure (PDB 2h4f, magenta). (C) The rationale for predicting that malonyl/succinyl peptides could be better substrates for Sirt5. (D) Sirt5-succinyl peptide-NAD ternary structure showing that the succinyl group interacted with Tyr102 and Arg105.
(A) Succinyl lysine was detected in bovine liver mitochondria. Sirt5-catalyzed hydrolysis of malonyl and succinyl peptides could be detected by using 32P-NAD, which formed 32P-labeled OMa-ADPR (lane 2) and O-Su-ADPR (lane 3). No reaction occurred with acetyl peptide (lane 1). The formation of O-Ac-ADPR catalyzed by Sirt1 was detected (lanes 4 and 8). O-Su-ADPR was formed when bovine liver mitochondria peptides were incubated with Sirt5 (lane 9) but not with Sirt1 (lane 10). The control with BSA peptides and Sirt5 did not generate O-Su-ADPR (lane 12). CD38-catalyzed hydrolysis of NAD was used to generate the standard 32PADPR spot (lane 13). (B) The CPS1 activities were measured by using the liver lysates from Sirt5 wild-type and Sirt5 KO mice. (n = 3 pairs of mice, p < 0.05). Relative quantitation analysis was achieved by extracted ion chromatograms (XICs) for peak areas of CPS1 K1291 acetyl peptides from (C) Sirt5 KO mice and (D) wild-type mice; of CPS1 K1291 succinyl peptides from (E) Sirt5 KO mice and (F) wild-type mice, and of a reference peptide from (G) Sirt5 KO mice and (H) wild-type mice.
TR-FRET to Identify ATP-Noncompetitive Inhibitors of CDK4
Lo MC, Ngo R, Dai K, Li C, Liang L, Lee J, Emkey R, Eksterowicz J, Ventura M, Young SW, Xiao SH: Development of a time-resolved fluorescence resonance energy transfer assay for cyclin-dependent kinase 4 and identification of its ATP-noncompetitive inhibitors. Anal Biochem 2011 Oct 12 [Epub ahead of print]; doi:10.1016/j.ab.2011.10.014.
Abstract: Protein kinases are recognized as important drug targets due to the pivotal roles they play in human disease. Many kinase inhibitors are ATP competitive, leading to potential problems with poor selectivity and significant loss of potency in vivo due to cellular ATP concentrations being much higher than Km. Consequently, there has been growing interest in the development of ATP-noncompetitive inhibitors to overcome these problems. There are challenges to identifying ATP-noncompetitive inhibitors from compound library screens because ATP-noncompetitive inhibitors are often weaker and commonly excluded by potency-based hit selection criteria in favor of abundant and highly potent ATP-competitive inhibitors in screening libraries. Here we report the development of a time-resolved fluorescence resonance energy transfer (TR-FRET) assay for protein kinase cyclin-dependent kinase 4 (CDK4) and the identification of ATP-noncompetitive inhibitors by high-throughput screening after employing a strategy to favor this type of inhibitors. We also present kinetic characterization that is consistent with the proposed mode of inhibition.
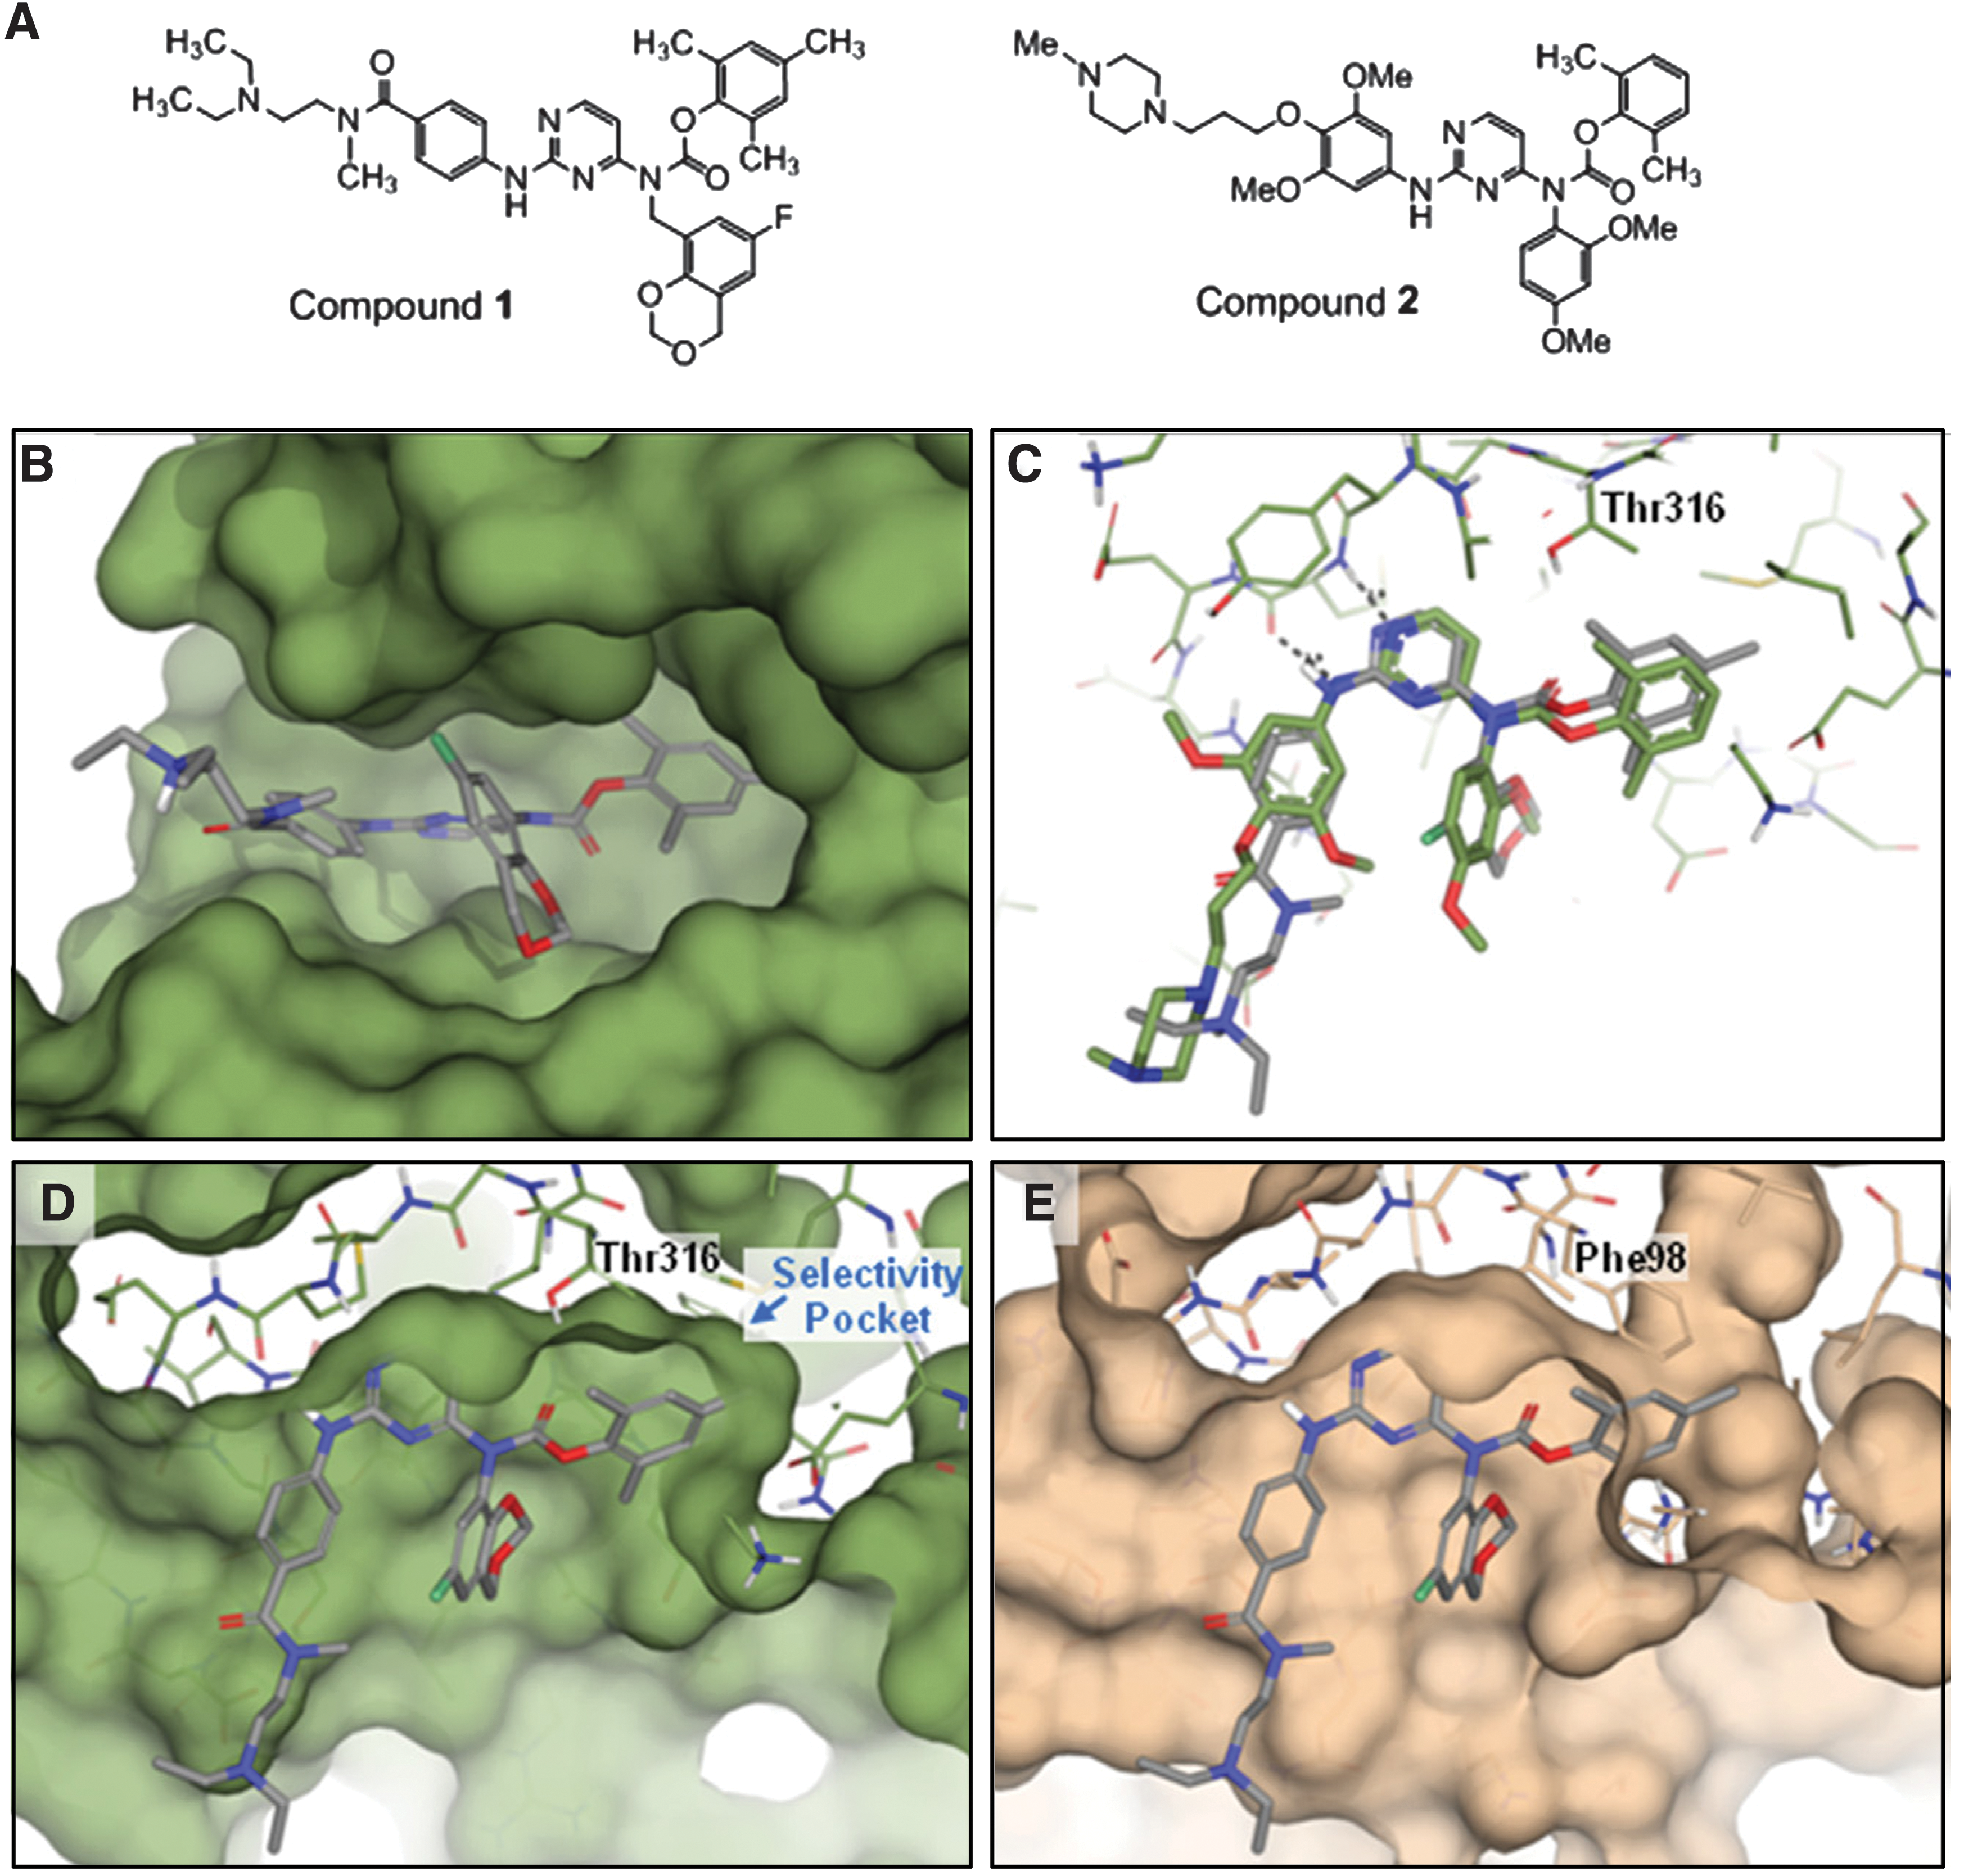
Commentary:ATP-noncompetitive inhibitors of protein kinases offer several potential advantages over ATP-competitive inhibitors. They do not have to compete with the high intracellular concentration of ATP, and they can target less-conserved regions with a possible associated increase in selectivity. ATP-noncompetitive inhibitors are making their way into the clinic; for example, the clinical candidate PD184352 is an ATP-noncompetitive inhibitor of MEK. Cyclin-dependent kinase 4 (CDK4) is a target for the development of cancer therapeutics because it is important for cell proliferation. Peptides and peptidomimetic ATP-noncompetitive inhibitors of CDK4 have been previously identified but suffer from poor cell permeability and poor pharmacokinetic properties. Lo et al. ran their small molecule high-throughput campaign against CDK4 and its binding partner cyclin D1 at 400 μM ATP, which is 12 times the Km of ATP, to bias the hits in favor of ATP-noncompetitve inhibitors. Because potent ATP-competitve inhibitors would also be captured with this technique, hits were later tested at 25 and 400 μM ATP to differentiate the ATP-competitive and noncompetitive inhibitors. ATP-competitive inhibitors would be expected to have a large shift in IC50 at the higher concentration of ATP, while ATP-noncompetitive inhibitors would have little to no shift. For the readout, Lo et al. selected the time-resolved fluorescence resonance enery transfer (TR-FRET) method that measures the amount of phosphorylated peptide product. The method utilizes a biotinylated substrate (a peptide from human retinoblastoma protein was used here) that binds to streptavidin-labeled allophycocyanin as the acceptor and a europium-chelate labelled antibody to the phosphorylated product as the donor. FRET occurs when the donor and acceptor are in close proximity and is proportional to the amount of phosphorylated product produced. A total of 250,000 compounds were screened at 10 μM, and the IC50 values of hits with 50% or greater inhibition were subsequently determined. The structure of the most potent compound that showed a low shift in IC50 upon increasing in ATP concentration is Compound 1, shown in the
figure
(panel A). This compound was also noncompetitive with respect to the peptide substrate. Compound 1 was found to reversibly bind to CDK4; the Ki was determined to be 1.1 μM, and the cellular IC50 was determined to be 8.5 μM. This compound was tested against 34 kinases and found to be potent against seven of them, including LCK (lymphocyte-specific protein tyrosine kinase). Compound 1 bound to LCK competitively with respect to ATP, and a potential binding mode in the ATP pocket is shown in the models in the
figure
. The authors surmise that Compound 1 must be able to bind to both the ATP pocket of some kinases, such as LCK, and a separate pocket in CDK4. Compound 1 is expected not to bind to the CDK4 ATP site due to its large gatekeeper, which would sterically clash with the compound. It will be interesting to see whether this assay format can be used to screen CDK4 against additional libraries to find inhibitors that only bind outside of the kinase ATP pocket or whether medicinal chemistry efforts can further modify Compound 1 to lead to the goal of an ATP-noncompetitive inhibitor of CDK4 that is potent, cell permeable, and selective. Contributed by Mindy I. Davis.
Modeling of compound 1 into LCK and comparison with CDK6. (A) Chemical structures of compound 1 and compound 2. (B) Front view of compound 1 modeled into the 2OFU LCK structure illustrates the expected binding of this compound into the ATP-binding site. (C) Top view of LCK ATP-binding site showing comparison of the modeled structure of compound 1 (gray) with the X-ray structure of compound 2 (green) bound to LCK. The LCK threonine gatekeeper is labeled. (D) Top view of compound 1 modeled into LCK with surface representation highlighting the threonine gatekeeper and the large selectivity pocket. (E) Overlay of compound 1 as modeled into LCK with the X-ray structure of CDK6 (pdb: 3NUP) with surface shown in tan.
AID Aids Affinity Maturation
Bowers PM, Horlick RA, Neben TY, Toobian RM, Tomlinson GL, Dalton JL, Jones HA, Chen A, Altobell L 3rd, Zhang X, Macomber JL, Krapf IP, Wu BF, McConnell A, Chau B, Holland T, Berkebile AD, Neben SS, Boyle WJ, King DJ: Coupling mammalian cell surface display with somatic hypermutation for the discovery and maturation of human antibodies. Proc Natl Acad Sci USA 2011;51:20455–20460.
Abstract: A novel approach has been developed for the isolation and maturation of human antibodies that replicates key features of the adaptive immune system by coupling in vitro somatic hypermutation (SHM) with mammalian cell display. SHM is dependent on the action of the B cell specific enzyme, activation-induced cytidine deaminase (AID), and can be replicated in non-B cells through expression of recombinant AID. A library of human antibodies, based on germline V-gene segments with recombined human (D)J regions was used to isolate low-affinity antibodies to human β nerve growth factor (hβNGF). These antibodies, initially naïve to SHM, were subjected to AID-directed SHM in vitro and selected using the same mammalian cell display system, as illustrated by the maturation of one of the antibodies to low pM KD. This approach overcomes many of the previous limitations of mammalian cell display, enabling direct selection and maturation of antibodies as full-length, glycosylated IgGs.
Commentary:Multiple publicly available and proprietary platforms and processes exist for generating monoclonal antibodies directed against an antigen of interest. In the classical hybridoma approach, mouse immunization with the hapten of choice is followed by hybridoma preparation and selection of one or more clones, in essence using the lab animal as a vehicle for natural selection and affinity maturation of the antibody. In addition, there is a wide range of in vitro selection and maturation techniques that typically utilize naïve or biased antibody libraries in combination with particular display, selection, and maturation protocols. The enormous diversity of methods stems from each step of the process being varied in numerous ways: various phage species, Escherichia coli, yeast, and mammalian cells have been used as hosts and display scaffolds; Fab, single-chain Fv, and other antibody formats have been displayed; the valency of display has been varied; the selection can follow successive direct panning cycles or can incorporate subtractive steps; a maturation step can be included that uses chain shuffling or other techniques; lastly, the “best” clones can be isolated through dilution plating or through fluorescence-activated cell sorting. Despite the diversity of existing methods, a platform that best approximates the antibody generation process in humans is still lacking. In the present work, Bowers and colleagues take the affinity maturation part of the antibody generation process to a new level, by recapitulating somatic hypermutation (SHM) under in vitro settings and coupling SHM with mammalian cell display. Enabling SHM during the process recapitulates the path that the adaptive immune system takes during immunization, while the use of a mammalian cell host for the display ensures that the antibody is produced with the proper glycosylaion pattern. To achieve SHM, the authors used activation-induced cytidine deaminase (AID), an enzyme responsible for initiation of somatic hypermutation in B cells via the deamination of cytidine residues in the IgG genes. To generate a library of IgGs displayed on the surface of mammalian cells, HEK293 cells were transfected with germline V-gene segments, with the heavy chains being modified by addition of a transmembrane domain to ensure a display of the final IgG on the cell surface (
first figure
). In a proof of concept experiment, the library was used to generate novel antibodies against the human cytokine hβNGF. A complex protocol was used that consisted of four rounds of negative selection, followed by a round of positive selection using streptavidin-coated magnetic beads and fluorescence-activated cell sorting. Positive clones resulting from this step were then transfected with AID and subjected to an additional three rounds of selection under increased stringency. Several high-affinity antibodies were obtained using this strategy, including ones that possessed a picomolar affinity for the target cytokine (
second figure
). High-throughput sequencing of final selected clones, as well as clones retained throughout the protocol, revealed that the affinity-matured antibodies were indeed derived from the germline sequences through processes that were consistent with somatic hypermutation. The combined positive features of the new platform—ability to recapitulate natural antibody maturation processes, ability to select for both high-affinity and well-expressing antibody clones, and use of a mammalian cell line that can be employed for subsequent antibody production—make it a welcome addition to the existing tools for production of new therapeutic antibodies. Contributed by Anton Simeonov.
Design of the ABELmAb library for mammalian surface display. (A) Pro-B cells initially recombine V, D, and J regions to express a naïve repertoire of avid IgM antibodies. Antigen binding to specific clones stimulates B-cell maturation, including class switching (IgG), proliferation, and AID-mediated SHM to produce antigen-specific, high-affinity antibodies secreted by plasma cells and presented on circulating memory cells. (B) CDR3/FW4 IgG and IgM diversity was isolated from pooled peripheral blood mononuclear cells (PBMCs) and grafted into selected V regions to produce a library of germline full-length antibodies. Antigen-coated beads were used to isolate low-affinity antibodies, with subsequent FACS selection and AID-mediated maturation of high-affinity antibodies. (C) Design of the ABELmAb full-length library is shown highlighting placement of restriction sites that were used to graft CDR3/FW4 diversity (red, green, and orange regions), amplified from a pool of PBMCs from seven normal donors, into selected IgH (IGHV1-2, 1-69, 3-7, 3-23, 3-30-3, 4-34, 4-59, 5-51, and 6-1), IgK (IGKV4-1, 3-20, 2D-30, 1D-39, and 1-33), and IgL (IGLV1-40, 2-11, 3-21, and 7-43) synthesized V regions. Constant domains were also synthesized, and a transmembrane (blue) and cytoplasmic domain (red) were added to the C-terminal end of the heavy chain.
Biacore and in vitro analysis of affinity maturing S1 strategy anti-βNGF antibodies. Selected sensorgrams and in vitro assays show the progression of antigen-binding kinetics to antibodies produced by HEK293 clones selected over the course of the S1 affinity maturation strategy (see the article’s Materials and Methods section). (A) Incorporation of mutation S31N (APE391) in the HC CDR1 results in detectable binding on Biacore. (B) Addition of mutation L45F in CDR2 of HC (APE583) improves affinity to low micromolar affinity (kon = 9.5 × 10⁴ M−1 s−1, koff = 0.08 s−1). Incorporation of insertion CDR1 GDTFSNYA and a CDR3 mutation D100A (APE803) resulted in an affinity of 760 pM (kon = 7.8 × 10⁶ M−1 s−1, koff = 6.0 × 10⁻³ s−1). (C) Introduction of the remaining HC mutations into a combinatorial library resulted in the identification of an antibody (APE925) with a KD = 25 pM (kon = 1.4 × 10⁷ M−1 s−1, koff = 3.5 × 10⁻⁴ s−1). (D) Antibodies originating from the S1 strategy and an antibody to an irrelevant antigen (APE273) were characterized in a homogeneous time-resolved fluorescence assay for their ability to inhibit binding of tanezumab (APE081), an anti-hβNGF antibody. (E) Affinity matured antibodies APE803, 925, and 928 were able to inhibit binding of hβNGF to its high-affinity receptor TrkA-Fc, and (F) demonstrated potent inhibition of βNGF-dependent ERK1/2 phosphorylation in neuronal PC12 cells (Greene and Tischler, Proc Natl Acad Sci USA 1976;73:2424–2428). RU, resonance units.
Stinky New Role
Shatalin K, Shatalina E, Mironov A, Nudler E: H2S: A universal defense against antibiotics in bacteria. Science 2011;334:986–990.
Abstract: Many prokaryotic species generate hydrogen sulfide (H2S) in their natural environments. However, the biochemistry and physiological role of this gas in nonsulfur bacteria remain largely unknown. Here we demonstrate that inactivation of putative cystathionine β-synthase, cystathionine γ-lyase, or 3-mercaptopyruvate sulfurtransferase in Bacillus anthracis, Pseudomonas aeruginosa, Staphylococcus aureus, and Escherichia coli suppresses H2S production, rendering these pathogens highly sensitive to a multitude of antibiotics. Exogenous H2S suppresses this effect. Moreover, in bacteria that normally produce H2S and nitric oxide, these two gases act synergistically to sustain growth. The mechanism of gas-mediated antibiotic resistance relies on mitigation of oxidative stress imposed by antibiotics.
Commentary:Following in the footsteps of another gaseous agent, nitric oxide (NO), hydrogen sulfide (H2S) is emerging as a key signaling molecule in humans. For example, studies have shown that H2S can act as vasorelaxant and that mice lacking functional cystathionine gamma-lyase (CSE), a key H2S-producing enzyme, display hypertension and decreased vasodilation phenotypes (Yang et al., Science 2008;322:587–590). In the present study by Shatalin and colleagues, H2S turns up in a somewhat unexpected place: the authors show that a key effect of H2S produced by infectious bacteria is to suppress the action of common antibiotics by modulating the oxidative stress triggered by those agents. Genetic analyses have shown that practically all bacterial genomes contain orthologs of mammalian cystathionine γ-synthase (CBS), cystathionine γ-lyase (CSE), and 3-mercaptopyruvate sulfurtransferase (3MST). Here, the authors inactivated each enzyme genetically in four diverse clinically relevant pathogenic species: Bacillus anthracis (Sterne), Pseudomonas aeruginosa (PA14), Staphylococcus aureus (MSSA RN4220 and MRSA MW2), and Escherichia coli (MG1655). The first three species have the CBS/CSE operon, but not 3MST, whereas E. coli carries 3MST, but not CBS/CSE. H2S production was detected using a colorimetric reaction with lead acetate. Deletions of the H2S-producing enzymes indeed corresponded to a loss of lead acetate staining of the bacterial cultures (
first figure
). While the abrogation of H2S production did not lead to changes in growth pattern, unexpectedly, the mutant strains deficient in H2S production were found to be considerably more susceptible to a range of antibiotics. In turn, that sensitivity was modulated by addition of exogenous source of H2S (delivered in the form of sodium sulfide,
first figure
). The authors hypothesized that the protective effect of H2S was exerted through modulation of the oxidative stress caused by the application of antibiotics, akin to effects noted previously for NO. Inclusion of 2,2′-dipyridyl, an iron chelator that suppresses the damaging Fenton reaction, or the hydroxyl radical scavenger thiourea, substantially decreased the toxicity of gentamicin (
second figure
). Further, H2S was shown to protect bacterial DNA from the oxidative damage caused by the Fenton reaction products (
second figure
). Additional analyses indicated that this protective action is at least in part modulated through the activation of catalase and superoxide dismutase enzymes. These studies point to a definitive role of H2S in modulating the effect of commonly used antibiotics and highlights the three H2S-producing enzymes CBS, CST, and 3MST, as potential targets to explore in future therapeutic development. Contributed by Anton Simeonov.
Endogenous H2S protects bacteria against antibiotic toxicity. (A) H2S production by Bacillus anthracis, Staphylococcus aureus, Pseudomonas aeruginosa, and Escherichia coli depends on CBS/CSE and 3MST, respectively. Lead acetate–soaked paper strips show a PbS brown or black stain as a result of reaction with H2S. Strips were affixed to the inner wall of a culture tube, above the level of the liquid culture of wt or mutant bacteria, for 18 hours. CBS/CSE and 3MST inhibitors PAG/AOAA (inh) and aspartate (Asp, 3.2 mM), respectively, were added as indicated. Numbers (%) show the relative decrease in H2S production due to chemical or genetic inhibition of CBS/CSE and 3MST. pMST indicates the E. coli strain that expresses an extra copy of the 3MST gene under a strong pLtetO-1 promoter. (B) Cysteine (Cys) is a substrate for bacterial CBS/CSE and 3MST. Addition of Cys (25 mM for E. coli; 200 mM for other species) greatly stimulated H2S synthesis in wt, but not in CBS/CSE- or 3MST-deficient strains. (C) H2S suppresses antibiotic-mediated bacterial killing. Representative survival curves show the effect of CBS/CSE (B. anthracis) and 3MST (E. coli) deletions or CBS/CSE inhibition (S. aureus and P. aeruginosa) by PAG/AOAA (inh) on Gm-mediated (50 mg/mL) killing. Where indicated, NaHS (0.2 mM) was added before the antibiotic challenge (see the article's Materials and Methods Section). The percentage of surviving cells was determined by counting colony-forming units (CFU) and is shown as the mean ± SD from three experiments.
H2S protects against antibiotic-inflicted oxidative damage (A) H2S acts by diminishing reactive oxygen species (ROS)– mediated antibiotic toxicity. E. coli cells were pretreated with the iron chelator, 2,2′-dipyridyl (0.05 mM) or the ROS scavenger thiourea (15 mM) for 3 min, followed by treatment with Gm. Cells were grown in triplicate at 37°C with aeration using a Bioscreen C automated growth analysis system. The curves represent averaged values from three parallel experiments with a margin of error of less than 5%. (B) Endogenous H2S renders cells more resistant to NA in aerobic conditions, but fails to do so in anaerobic conditions. A paper disk saturated with 20 μg/mL NA was placed on wt or CBS/CSE-deficient B. anthracis lawns that were grown aerobically or anaerobically for the next 18 hours. Zone borders are marked with dashed lines. (C) Endogenous H2S renders bacteria resistant to hydrogen peroxide. Agar plates seeded with the indicated bacteria were incubated overnight with a filter paper disk saturated with 0.125 or 0.45 M H2O2 placed atop the bacterial lawn. CBS/CSE- or 3MST-deficient cells formed a clear 5- to 10-mm zone around the disk, whereas wt cells grew a complete lawn and so demonstrated strong H2S-dependent resistance to hydrogen peroxide. (D) Pulsed-field gel analysis of chromosomal DSBs. Lane 1: 4.6 Mb linearized E. coli chromosomes (I-SceI); lanes 2 and 3: DNA from wt and DMST cells; lanes 6 to 8: DNA from wt, 3MST-deficient, and 3MST-overproducing cells after treatment with 10 μg/ml Amp; lanes 9 and 10: DNA from NaHS-treated cells after Amp treatment; and lane 11: concatemers from 0.05 to 1.0 Mb. “% linear” indicates the relative increase in linearized chromosomal DNA. The values are the average of three independent experiments (p < 0.1). (E) Stimulating effect of H2S on H2O2 degrading activity and SOD activity in crude extracts of wt and 3MST-deficient E. coli cells. Total H2O2 degrading activity was measured as described in Shatalin et al., Proc Natl Acad Sci USA 2008;105:1009–1013. Catalase activity at 100% is 30 mM H2O2 min–1 mg–1. Values shown are the means ± SEM from three experiments. SOD activity was measured using a tetrazolium-based assay kit. (F) Dual protective effect of H2S against oxidative stress: Catalase and SOD are required for prolonged defense against H2O2 toxicity mediated by NaHS but not for immediate protection. Wt, katE, and sodA E. coli cells were grown in Luria-Bertani broth (LB) to absorbance (optical density) OD600 of ∼1.0, treated with NaHS (200 mM) for the indicated time intervals (min), followed by the addition of H2O2 (2 mM) for 10 min. Cell survival was determined by counting CFU and is shown as the mean ± SD from three independent experiments.
Abstract: The control of biochemical fluxes is distributed, and to perturb complex intracellular networks effectively it is often necessary to modulate several steps simultaneously. However, the number of possible permutations leads to a combinatorial explosion in the number of experiments that would have to be performed in a complete analysis. We used a multiobjective evolutionary algorithm to optimize reagent combinations from a dynamic chemical library of 33 compounds with established or predicted targets in the regulatory network controlling IL-1β expression. The evolutionary algorithm converged on excellent solutions within 11 generations, during which we studied just 550 combinations out of the potential search space of ∼9 billion. The top five reagents with the greatest contribution to combinatorial effects throughout the evolutionary algorithm were then optimized pairwise. A p38 MAPK inhibitor together with either an inhibitor of IκB kinase or a chelator of poorly liganded iron yielded synergistic inhibition of macrophage IL-1β expression. Evolutionary searches provide a powerful and general approach to the discovery of new combinations of pharmacological agents with therapeutic indices potentially greater than those of single drugs.
Commentary:Combination-based screening strategies recognize that many signaling pathways have built-in redundancy, rendering it difficult for a single agent to perturb the pathway. The main complication with implementing combination-based screening is the rapidly escalating scale of the experiment, which easily reaches billions of combinations even when relatively small numbers are tested. This study applies evolutionary computing algorithms in which the fitness of solutions to multiobjectives proposed by research is evaluated. Such evolutionary algorithms have been shown to be particularly useful in solving multi-variable problems, an area in which combination-based screening resides. The objectives of this study were to find combinations that inhibit interleukin (IL)-1β expression and induce macrophage cell death at doses lower than the known single agent concentrations. An evolutionary algorithm was applied to test 33 agents with known/predicted targets for IL-1β expression (see
figure
). Randomly chosen combinations were generated and tested using a robotic protocol, and the results were analyzed for “fitness” to the desired objectives. The fittest of parent combinations were then allowed to generate new combinations to evolve improved solutions. In the study, the maximum number of experiments was set to 50 and iterative testing revealed that many successful combinations contained SB203580, a compound known to inhibit the kinase P38, as well as IκB kinase (IKK) inhibitors that are involved with IL-1β expression. Only combinations of two compounds were considered here. In this study, synergy was observed for some pair-wise combinations, but no further effects were observed when triple combinations were tested. The potency of SB203580 was found to improve in the presence of either IKK inhibitors or an iron chelator. This could provide a basis for cocktails in which low doses of SB203580 are employed, which could diminish the known toxic side effects of this compound leading to failures in clinical trials. The automated decision-making process shown here also removes preconceptions, which should improve the identification of unexpected phenotypes from combination testing. Contributed by Doug Auld.
Combinatorial evolutionary inhibition of IL-1β expression. Known drugs were tested alone before being used at a single concentration (3 μM) in a chemical library (loop 1, clockwise). Initialization of IBEA creates a random selection of combinations that are incubated with stimulated cells before measurement of cell death (LDH release) and IL-1β expression. Evaluation of these data against the number of compounds in the combination (n = 3 for all data) is performed by IBEA before a new generation of combinations is computed and tested. After 11 generations, concentration-dependent optimization (loop 2) of five top-ranked reagents was undertaken. Synergy was detected in new dual combinations. L, low; M, medium; H, high; PBS, phosphate-buffered saline; TMB, 3,3′,5,5′-tetramethyl benzidine; HRP, horseradish peroxidase; LDH, lactate dehydrogenase; IBEA, indicator-based evolutionary algorithm.