
Abstract
Angiogenesis is a key step in tumor development, and anti-angiogenesis processes are important for drug discovery and development. The dose–response relationship for an inhibitor is studied using images of endothelial cells captured in vitro by Matrigel assay. In order to improve the quantification of anti-angiogenic processes for faithful synchronization with continuous variation of an inhibitor dose, we have developed an automated image analysis method—mesh-loosening analysis—to evaluate the disruption of tube formation from endothelial cells. The method is based on numerical and morphological changes of mesh regions surrounded by tubes and perceived by considering the spaces between the tubes rather than the tubes themselves. The anti-angiogenic effect of suramin is analyzed comprehensively using four attributes obtained from the mesh regions. The relation between the dose of suramin and response shows an exponential curve that can be approximated as a sigmoid function, even though human assessments yield strong inhibition at moderate doses. The calculated half-minimal inhibitory concentration was in agreement with prior published reports. The results show that mesh-loosening analysis is useful and appropriate for screening applications that need precise and comprehensive quantification of the anti-angiogenic process to compensate for the inadequacy of human assessment. Feasibility study with shikonin shows the robustness of the mesh-loosening analysis.
Introduction
A number of in vitro angiogenesis assays have been developed to obtain dose–response relations for inhibitors and to understand angiogenic processes on the basis of molecular and cellular biology. The most frequently used assay employs an extracellular matrix, Matrigel, which induces endothelial cells to form a capillary-like tube network 3 in a single two-dimensional (2-D) plane.
Quantification of the angiogenesis assays using manual or semi-automatic image processing of light-microscopic images of the culture has been proposed since the 1990s. The main problem is typically segmentation of the cell network in the images. Several reports have described skeletons of the cell network being improved by thresholding procedures that avoid nonuniform lighting effects on microscopic images through automated analysis. 4,5 Several software applications are available for the quantification of endothelial cell tube formation on Matrigel. 6 –8 In addition, related studies have been undertaken with the specific intention of quantifying a state in angiogenesis accurately and efficiently. In one earlier report, 9 the complexity of a network was characterized by topological analysis and fractal analysis. In another study, 10 the morphological distribution and spatial organization of the cell network were quantified after separating the tubular structures and cell aggregations by size and shape using mathematical morphology operators. These studies were performed using skeletons extracted from the cell network by conventional image processing. Researchers have used these software applications, but they remain unsatisfied with the quantification because it is inconsistent with their intuitive assessments.
Moreover, Santos et al. have pointed out that creating in vitro model systems where tubule-like structures can develop in a three-dimensional (3-D) environment is potentially desirable but remains a challenge, because the models should mimic one or more biological stages that occur during in vivo angiogenesis in order to enable biological assessment of key events. 11 They proposed an enhanced biological system that generates a phenotype by using a software solution that allows for image acquisition, image stack collapse, and feature segmentation. The 2-D collapsed images suggest some problems in connectivity along the z-direction in quantification of the degree of cell network formation.
In any case, researchers are eager to find a quantification that agrees with their intuitive assessments for anti-angiogenic processes attributable to continuous variation of an inhibitor dose. In order to meet this requirement in a single 2-D plane, we have developed a mesh-loosening analysis to quantify anti-angiogenic processes synchronized with continuous variation of an inhibitor dose on Matrigel. The mesh-loosening analysis is designed to assess the disruptive processes as numerical and morphological changes of a form model that represents tube formation indirectly. The form model is a mesh region surrounded by the tubes that is perceived by considering the spaces formed between the tubes. The disruption of tube formation is analyzed comprehensively by characterizing numerical and morphological changes of mesh regions using four attributes. We validate the mesh-loosening analysis by evaluation of the anti-angiogenic effects of the inhibitor suramin.
Materials and Methods
Cell Culture
Mouse endothelial KOP2.16 cells were cultured in Dulbecco's modified Eagle's medium (Invitrogen, Carlsbad, CA) supplemented with 10% fetal bovine serum (HyColne, Thermo Fisher Scientific, Waltham, MA), penicillin and streptomycin (Invitrogen) at 37°C in 5% CO2. The cells were washed and trypsinized with TrypLE Express (Invitrogen), then resuspended in Opti-MEM I Reduced-Serum Medium (Invitrogen). Cells were overlaid onto plates containing a GFR-BD Matrigel GFD (Becton, Dickinson and Company, Franklin Lakes, NJ).
Inhibition by Suramin
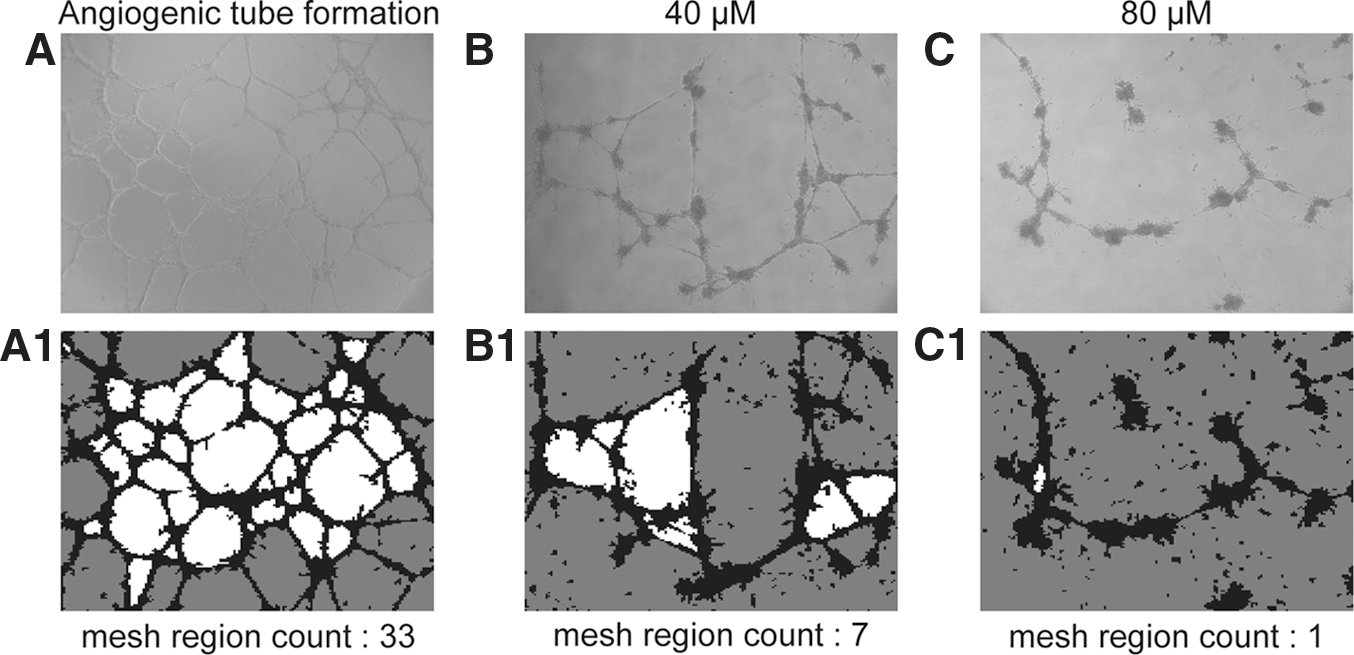
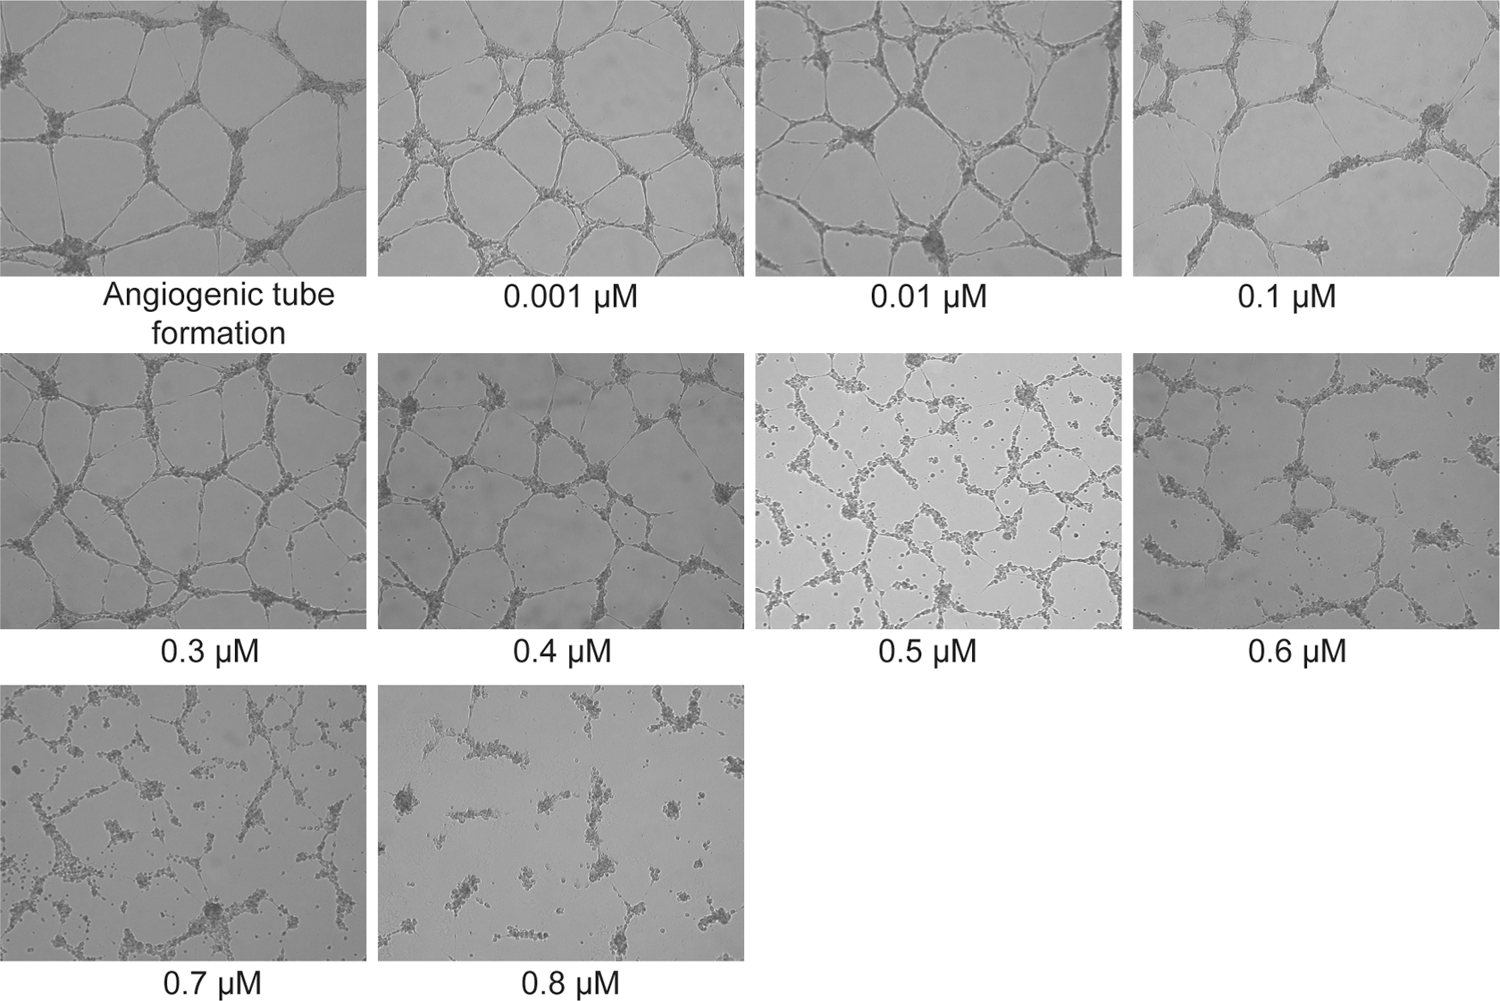
Addition of suramin (Sigma-Aldrich, St. Louis, MO) was performed at the beginning of the experiment in amounts varying from 1 to 100 μM to produce a dose–response relation. The plates were incubated at 37°C in 5% CO2 for 18 h. Light-microscopic images of endothelial cell cultures were captured using an inverted IMT-2 microscope (Olympus, Tokyo, Japan) and saved as image files through a port connected to a digital camera (C-4040, Olympus). About 14 images were acquired for each dose. A dose-variant set of images is shown in Figure 1.

Anti-angiogenic disruption of tube formation due to increasing doses of suramin. Tubes are thinner at doses of 10 and 20 μM. Cells begin to aggregate at 40 μM as tubes become nonuniform in thickness. Then cells aggregate into clusters so that tube formation becomes completely disrupted.
Table 1 shows the step-by-step protocol for the angiogenesis inhibition assay of tube formation.
Step-by-Step Protocol for Inhibition Assay of Angiogenic Tube Formation on Matrigel in 12-Well Plates
Step Notes
1–2. Dilute Matrigel solution twice with medium.
3. Dispense Matrigel solution in each well.
4. Polymerize bottom Matrigel layer in well.
5–6. Dispense and mix in 1.5- mL tubes.
7. Mix inhibitor compounds and cells.
8. Apply cells and inhibitor compound mixture to Matrigel layer.
10. Capture images of cell cultures under microscope.
Image Analysis Method for Extracting Mesh Regions
The images were then processed at 640×480 pixels with 256 gray levels and analyzed by a program running on a PC system (CPU: Intel® Pentium® 4, 3 GHz; RAM: 0.99 GB). This program was developed in the C language by the authors. The program defines a mesh region as an essential form model to represent angiogenic tube formation indirectly, as shown in Figure 2C , and quantifies the anti-angiogenic process through the numerical and morphological changes of the mesh regions (Fig. 3). The mesh region is also assigned attributes, such as thick, thin, or isolated, to represent the state of tubes.
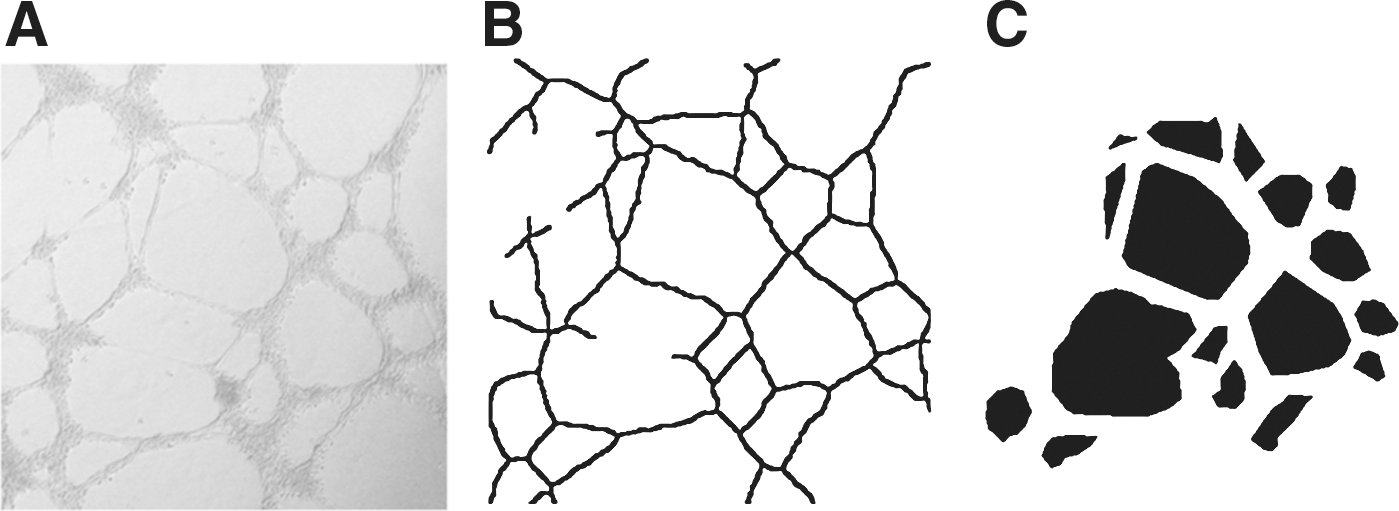
Angiogenic tube formation.
Schematic models for anti-angiogenic tube disruption.
The first procedure applied to the images is mesh region segmentation, as shown in Figure 4 , in which mesh regions are extracted from the original images automatically and directly. Briefly, an original image is divided into microscopic pieces with the same aspect ratio as the original image, and then the standard deviation (SD) of pixel intensity value is calculated in each piece. The image is temporarily converted into an image pyramid created by mosaic of the pieces that have their SD values. In the image with the intensity variation shown in Figure 5 , the SD histogram has a predominant mode at a bin for fairly low values. A mesh region is extracted by connecting pieces whose SD belongs to the mode of the SD histogram on the pyramid. However, three kinds of information are necessary to exclude isolated cell aggregations, small artifacts such as irrelevant particles, and background. The first is the lower limit intensity used to identify isolated cell aggregation. It is automatically calculated as the 95% lower confidence limit on distribution of the intensity on another pyramid created by mosaic of the pieces that have their minimum intensity values. An isolated cell aggregation is defined as pieces that belong to the mode on the pyramid for SD and that have values below the lower limit on the pyramid for minimum intensity. The second is the minimum area of a mesh region required in order to distinguish small artifacts. It should be measured in a few original images because it depends on the cell, the magnification of the microscope, and the size of the image. The third is the location of a piece of the background. It is automatically determined whether or not it is connected to the outer side of the image. A piece on the pyramid is expanded to the pixels equipped with the value according to its segment. The original images are transformed into segmented images (Fig. 4A1, B1, C1). The degree of tube formation is essentially quantified by counting the number of mesh regions as shown under Figure 4A1, B1, C1.
Mesh region segmentation.

Intensity profile. The intensity along the broken line shown on the light-microscopic image is plotted as a profile. Tubes are identified by the high-amplitude and rapid frequency variation of pixel intensity compared with that in mesh regions. Note that the baseline intensity is gradually decreasing from left to right. Images obtained by light microscopy often show such nonuniform lighting effects.
Attributes of Mesh Regions
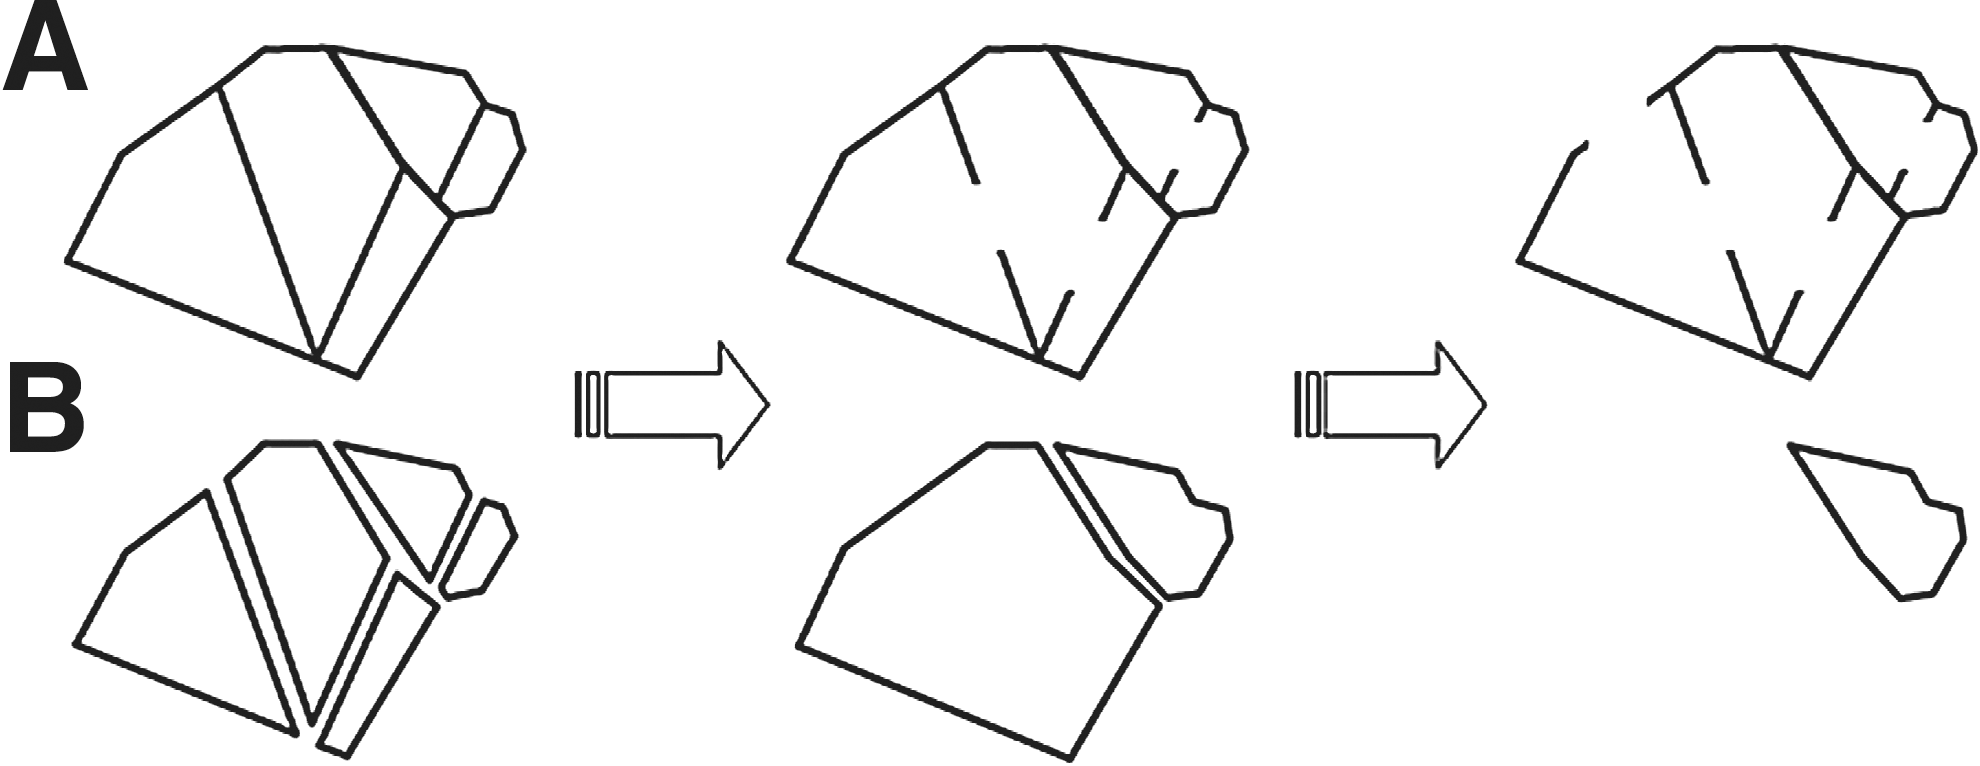
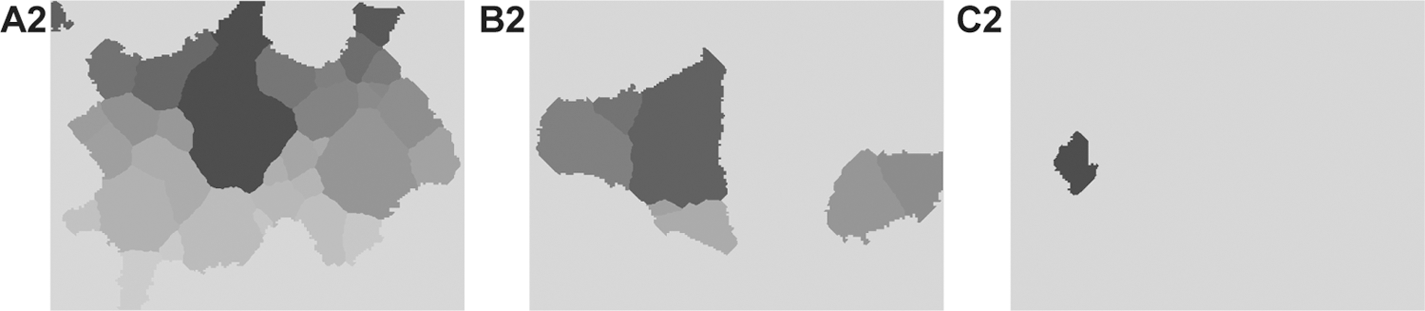
Attributes are designed to quantify various aspects of numerical and morphological changes in the anti-angiogenic process. The first is the previously described mesh region count. It essentially represents the degree of angiogenic tube formation. The second attribute is an area defined as the number of pixels in the mesh region. This represents the reach of the networked tube. In addition, the mesh region is expanded simultaneously with other mesh regions until the growing mesh region itself reaches a growing neighbor. The third attribute is contour length, defined as the number of pixels of the borders separating the grown mesh regions (Fig. 6). The mesh region expands more at a thick tube than at a thin one, because the region shares the width of the tube around itself with its growing neighbor. Whether the tube has thick parts or thin parts is reflected in the contour length of the grown mesh region. A grown mesh region is assigned a number of executions indicating how many times the mesh region has expanded. The fourth attribute is the number of growing operations, which also reflects the state of the tube with respect to thick parts and/or thin parts. In particular, this is an index for an isolated mesh region because the number is high. The isolated mesh region is permitted to expand exclusively to fill the width of the tube around it (Figs. 4C, 4C1, and 6C2).
This method entails analysis of each image. Therefore, the resultant attributes are assigned to the image by the mean values of each attribute, although four attributes are calculated for each mesh region in the image.
Tube-Forming Activity Corresponding to the Dose
The anti-angiogenic process is quantified by comparison with tube formation in angiogenesis. A relative dose–response ratio is calculated as the ratio of the mean of an attribute for each dose to that for no dose. The degree of angiogenic tube formation is quantified by “tube-forming activity” value, which is calculated by the difference between 100% for angiogenesis and the relative dose–response ratio. For each dose, the four values of the tube-forming activity are assembled into a radar chart to represent the anti-angiogenic process.
Dose–Response Inhibition Curve
In order to quantify dose–response inhibition, a power is defined using the tetragon in the radar chart formed by the four values of the tube-forming activity. It is calculated using the ratio of the tube-forming activities to the radius of a circle with the same area as the tetragon.
In many cases, the dose–response curve takes the form of a sigmoid curve. However, the sigmoid curve is approximated as an S-shaped curve that is symmetrical at an inflection point. It is based on the symmetry assumption. The generalized logistic curve is a widely used flexible sigmoid curve without loss of generality, extending the well-known logistic curve in order to deal with an asymmetrical curve. The generalized logistic curve is also known as Richard's curve
12
and is defined as follows.
In Equation (1), y signifies the power and x denotes the dose. There are five parameters: A represents the lower asymptote, C is the upper asymptote, B stands for the rate of inhibiting, M is the time of maximum inhibiting, and Q determines where maximum inhibiting occurs. To obtain an inhibition curve, fitting of the above logistic curve was performed using software (Excel 2007®, Microsoft Corp., Redmond, WA). The parameters were optimized using nonlinear least squares (Solver tool, Excel®, Microsoft Corp.).
Results
Mesh Region Segmentation
Segmentation was performed on several images (n=22, 12, 16, 25, 10, 7, 9, and 11 for doses of 0, 1, 10, 20, 40, 60, 80, and 100 μM, respectively). The mesh region count was then determined for each image. The same set of images was also measured by extracted skeletons and by visual inspection for comparison with the mesh region count (Fig. 7). The mesh region count was approximately correlated with the human assessment (Fig. 7A, D). The mesh region count and the mesh count from the skeleton exhibit a similar decrease, including the standard error of the mean (SEM Fig. 7A, B). The pixel length was measured using the same skeletons as in the measurement of the mesh count. However, the rate of decrease is not similar to that in the mesh count. The value of the pixel length does not decrease monotonically but increases temporarily at 60 μM. The pixel length provides an evaluation that is inconsistent with the human assessment except at low doses.
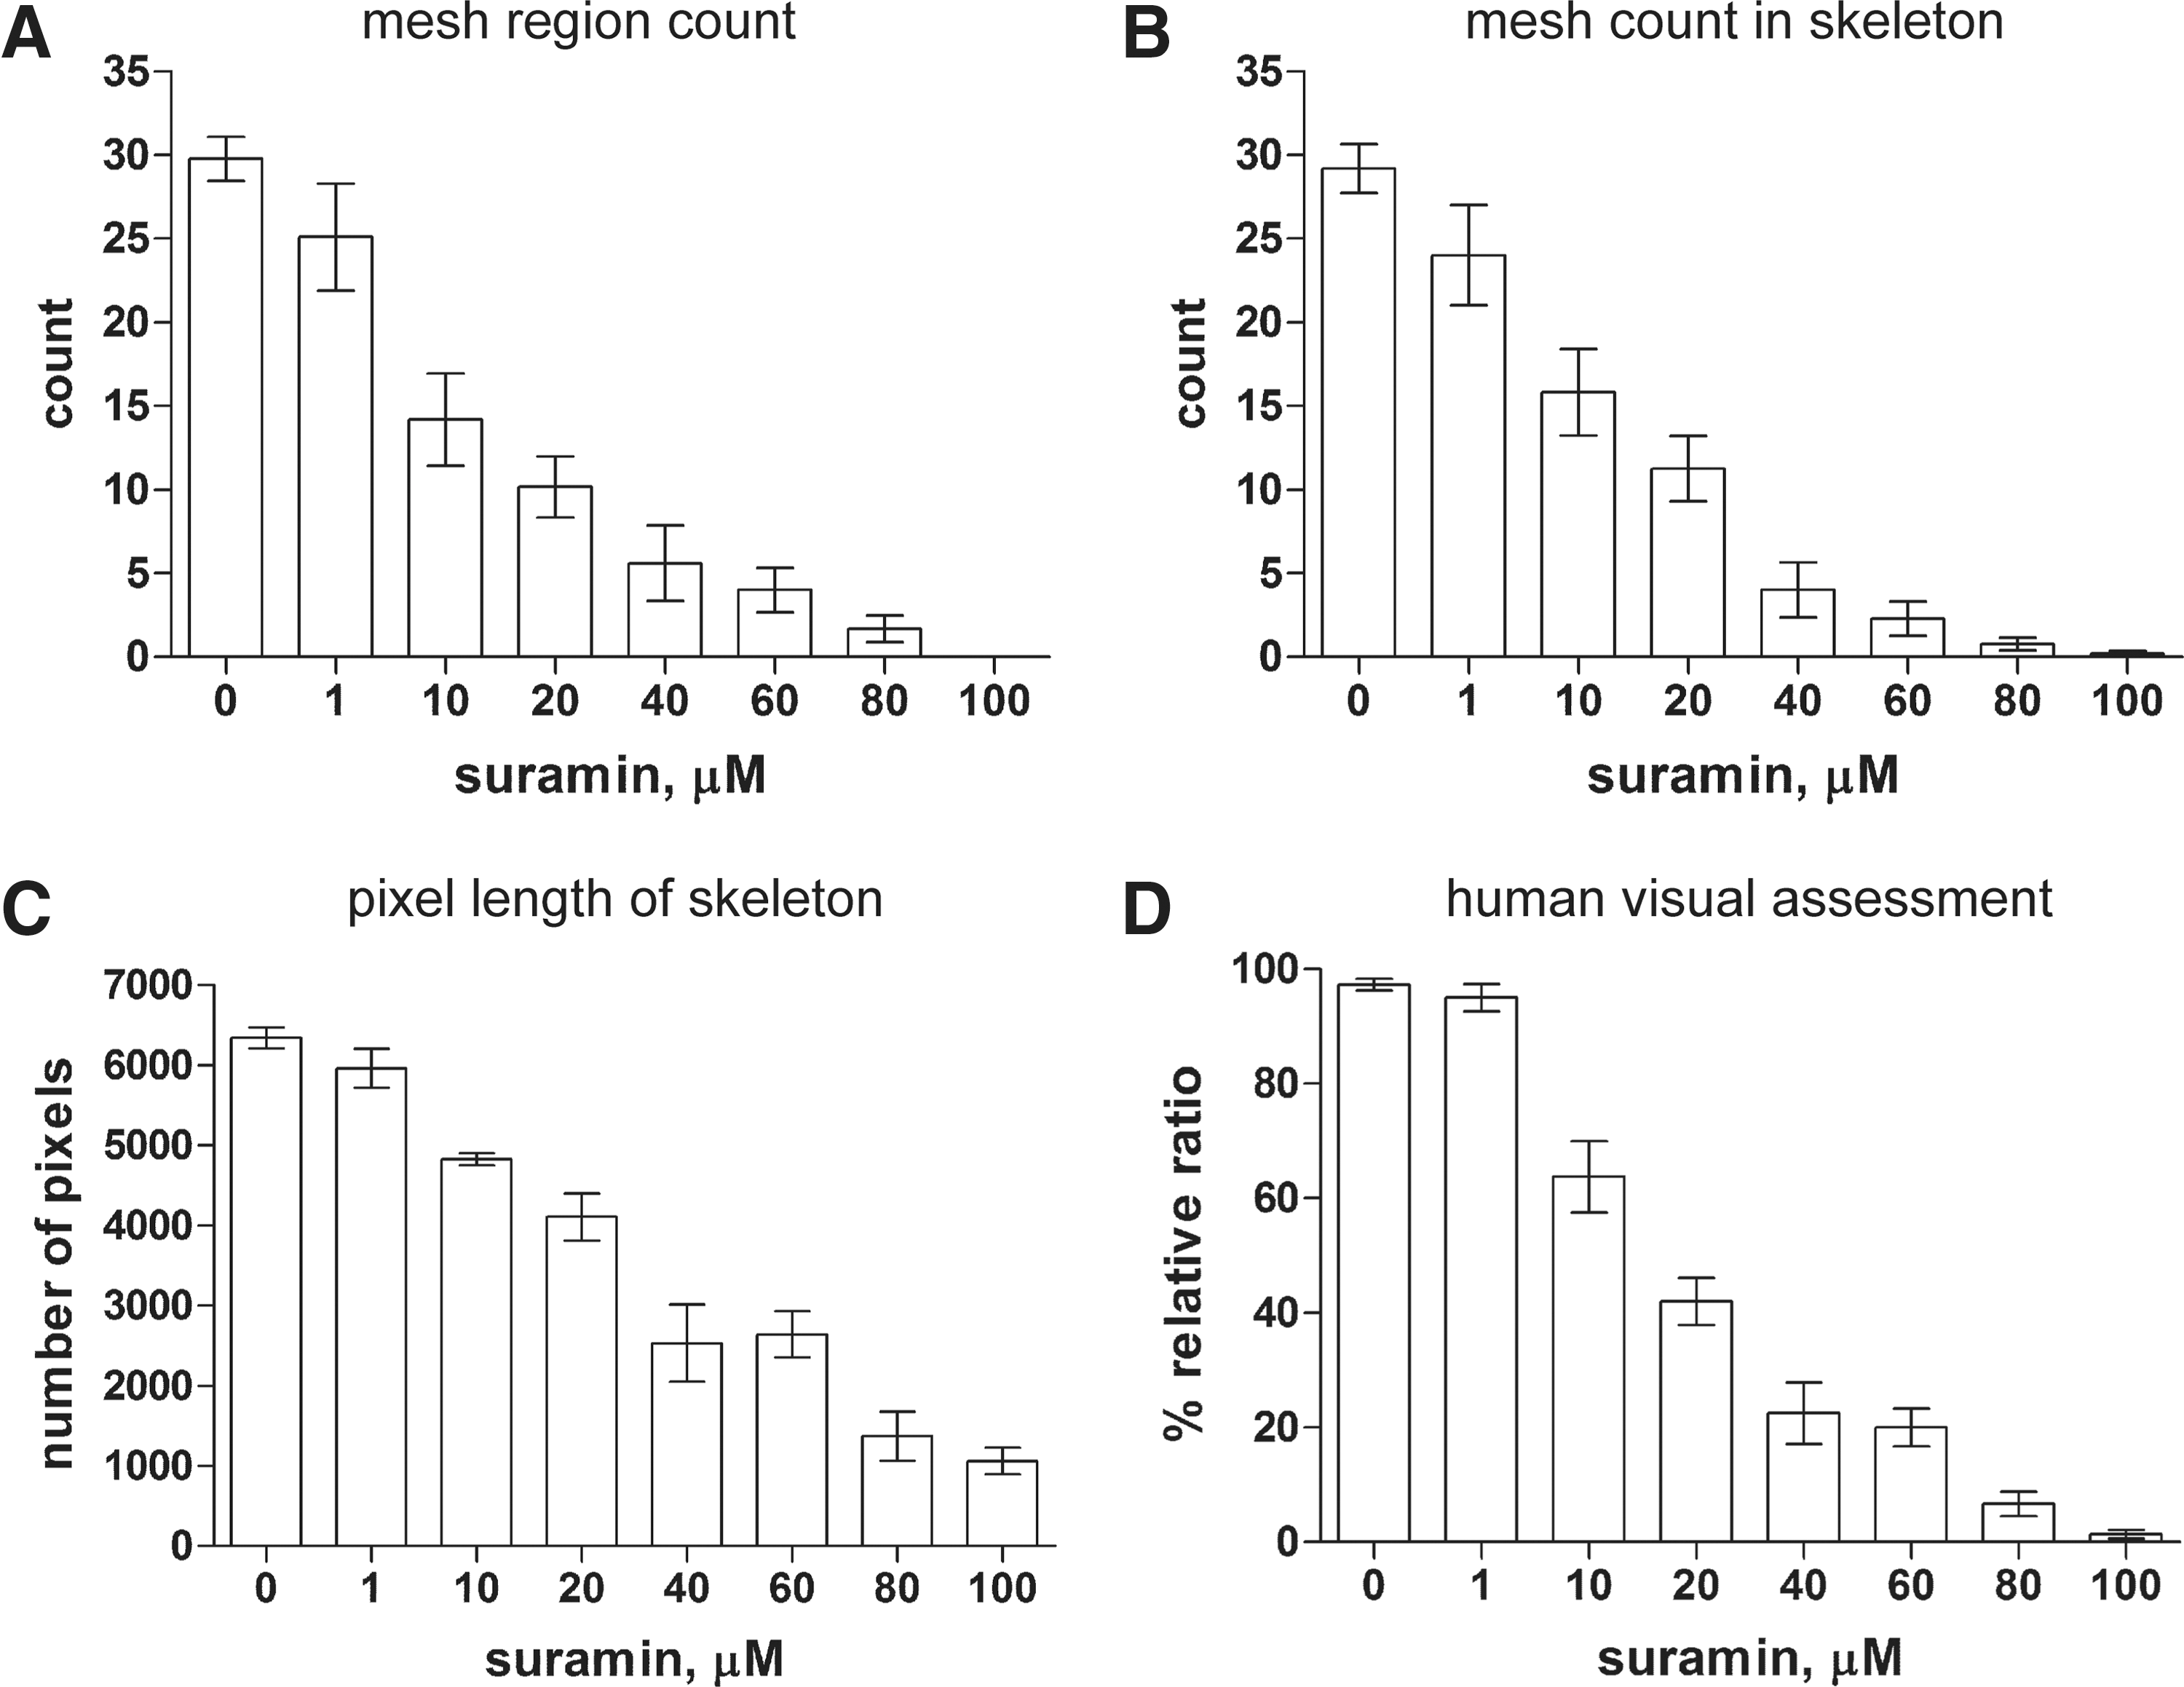
Comparison of various quantifications of the anti-angiogenic process. Data presented are mean±SEM in sample image distribution for a dose. The mesh region count was used to verify the visual count of the mesh regions in the segmented images. Mesh count is a topological measurement of the mesh identified as a path that starts from a turning point and returns to the turning point in skeletons. The skeletons were extracted by filtering, binarization, thinning, thresholding, and morphological operations by conventional image processing. It was also visually confirmed that the skeletons were appropriately extracted from cells in the images and that the meshes were counted appropriately in the skeletons. The pixel length of the skeleton is a simple geometric measure of the length of the connected pixels in the skeleton. Human visual assessment, a relative comparison of the images to those for angiogenesis, was performed by two researchers.
In terms of relative dose–response ratio, both the mesh region count and the mesh count provide almost identical results (Fig. 8). However, the mesh count is closer to the human assessment and higher than the mesh region counts at 10 and 20 μM, while the mesh count is lower than the human assessment at 40 and 60 μM and the mesh region count is close to the human assessment.
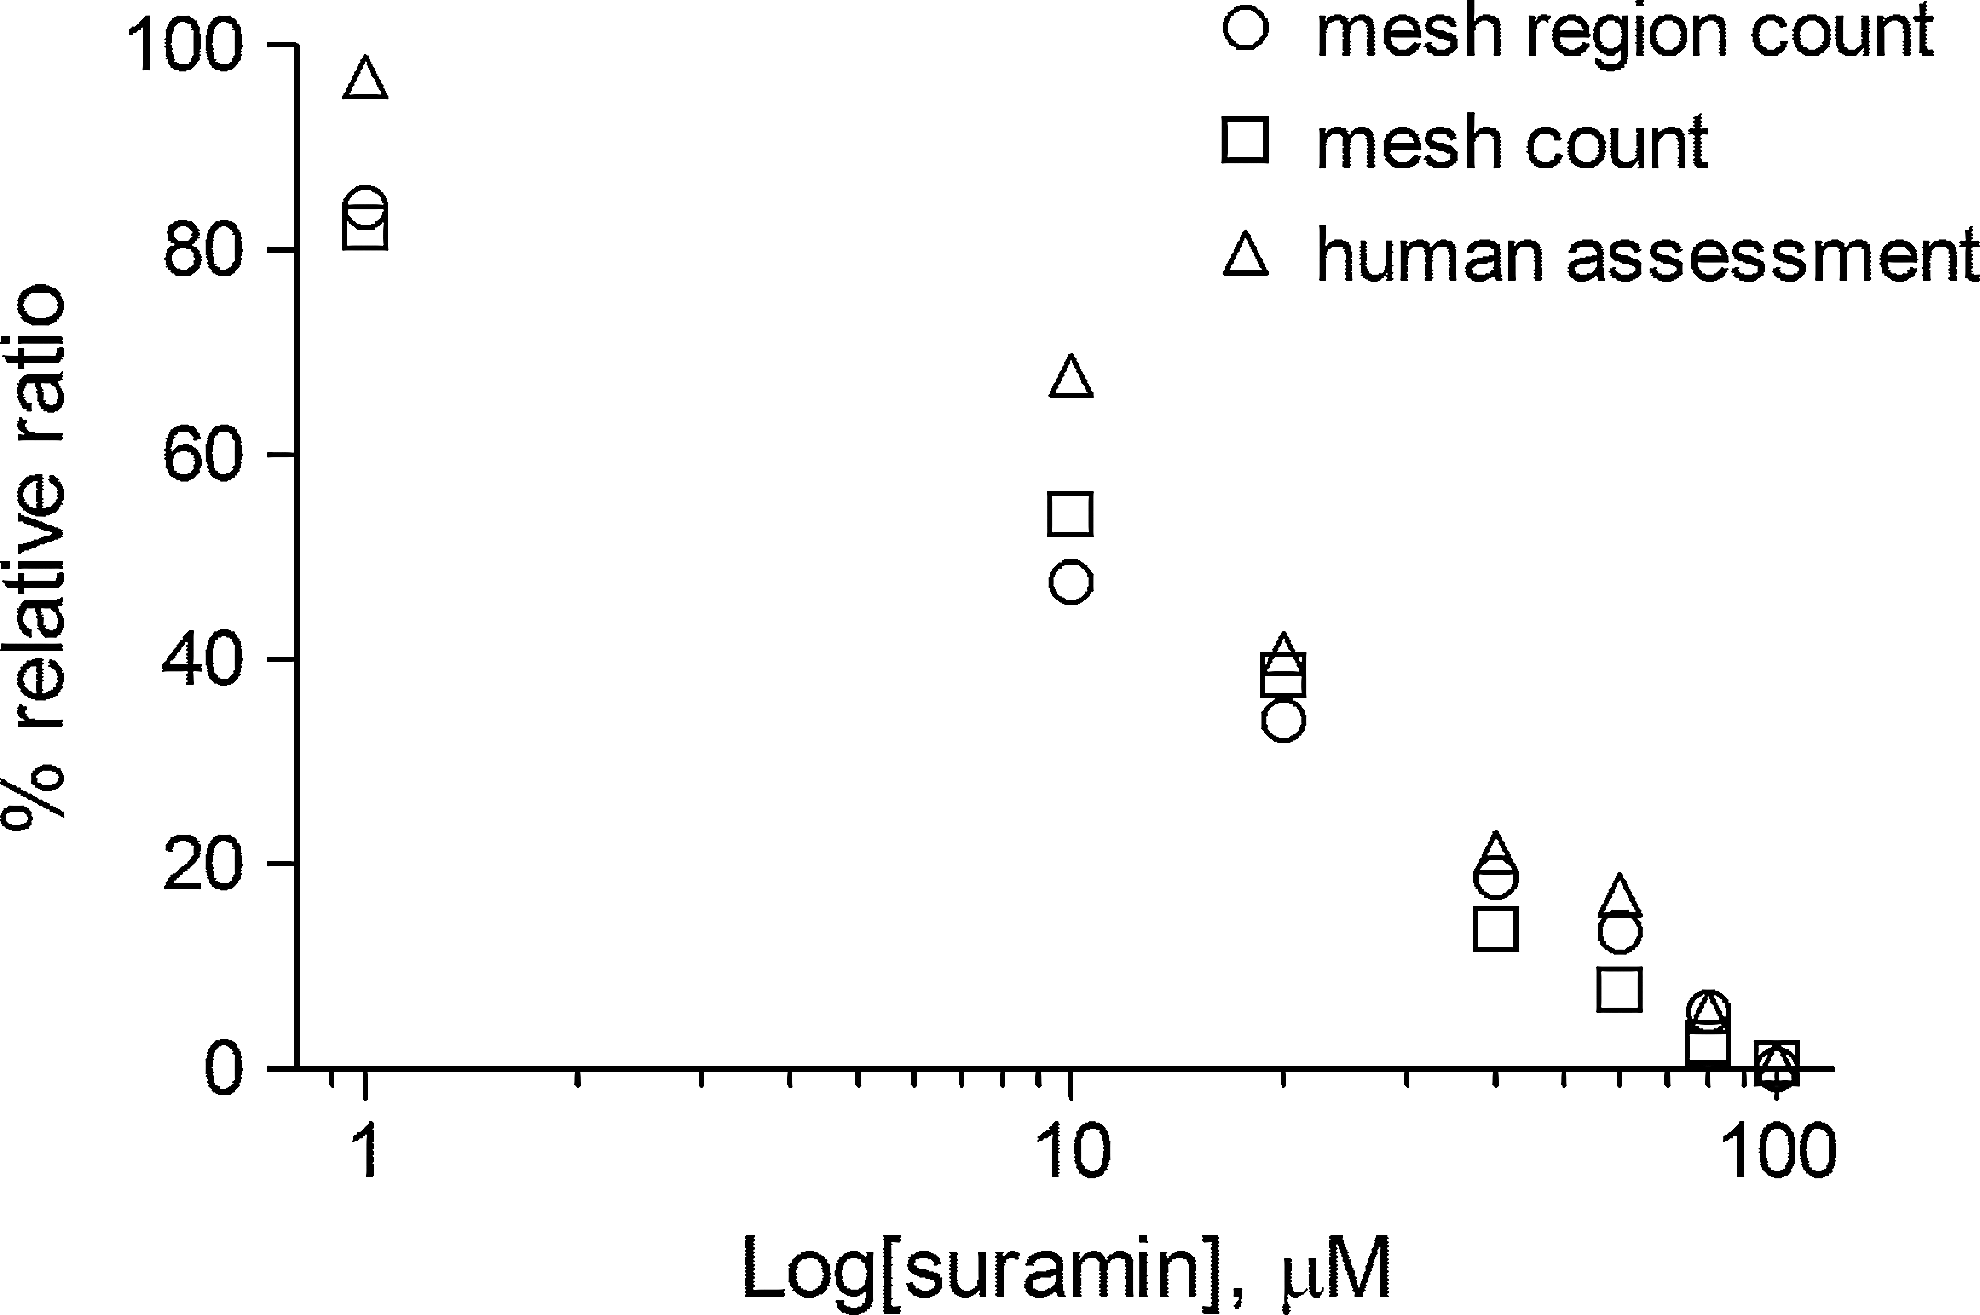
Comparison of relative dose–response ratios for the anti-angiogenic process: the mesh region count (○); the mesh count (□); and the human assessment (▵).
The mesh region count that was automatically measured is more consistent with the human assessment than the mesh count. So it can replace the mesh count. However, the ratios of both the mesh region count and the mesh count are lower than that of the human assessment at low doses. This point remains as a problem that should be solved in either case.
Contribution of the Attributes
As shown in Figure 9 , the four attributes are complementary and represent the behavior of tube formation in the anti-angiogenic process. As the dose rises, the tube formation is disrupted and the reach of network expanded. In the relative dose–response ratio, the mesh region area is greater than the mesh region count. This signifies that the network is locally disrupted; however, it remains globally as a part of the network. The mesh region count decreases monotonically as the dose rises (Fig. 9A). The SEM is small for each dose. The mesh region area initially increases, then decreases, and then this pattern is repeated (Fig. 9B). The SEM, as an estimate of the standard deviation in the mesh region area, is largest at 40 μM, where the dose is marked because a mesh region disappears for the first time in an image. Therefore, the image whose attributes are all zero is notable for almost all images with some mesh regions. In addition, images in which the mesh region disappears continue increasing after 60 μM. The contour length of the grown mesh region (Fig. 9C) and the number of growing operations (Fig. 9D) each show two peaks. The SEM is large at 40, 60, and 80 μM.
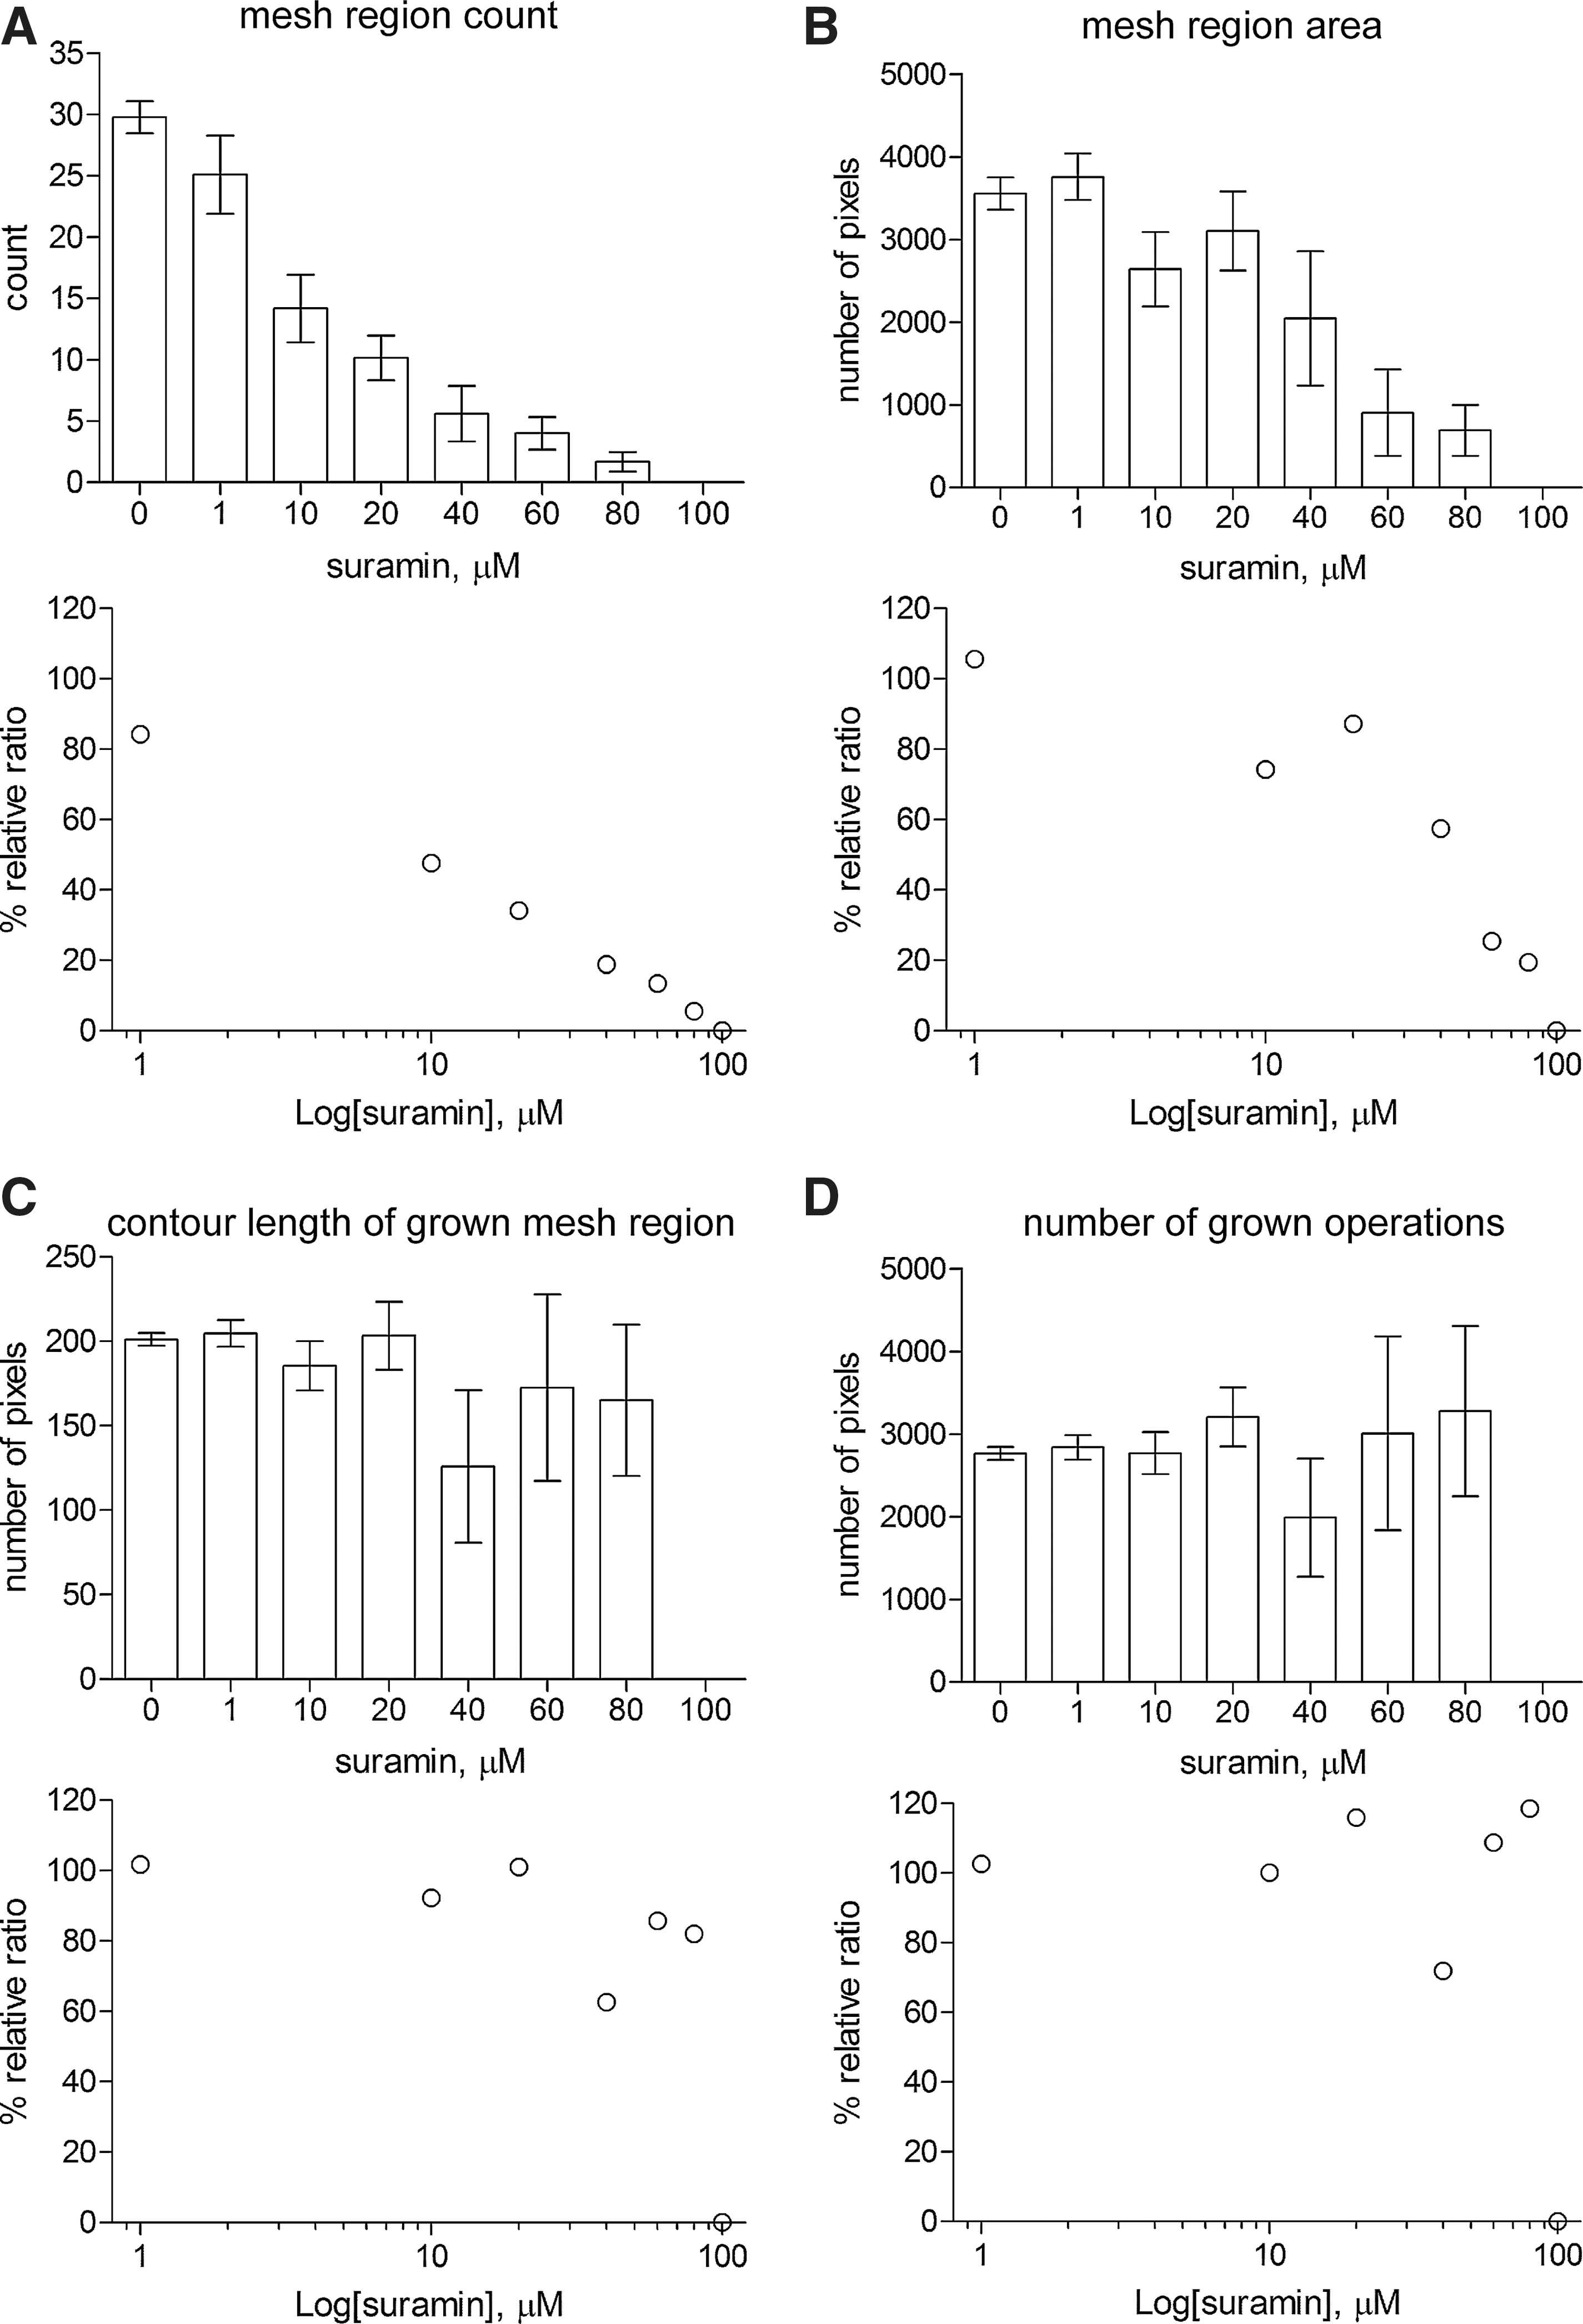
The anti-angiogenic process quantified using the four attributes of mesh regions. Data presented are mean±SEM in sample image distribution for a dose.
Both the contour length of the grown mesh region and the number of growing operations decrease at 40 μM. Thereafter both increase, even though the mesh region area decreases. This indicates that tubes have thick and thin parts conspicuously from 60 μM. The mesh region expands more at the thick parts than at the thin ones. The contour of the grown mesh region creates a meandering line on the boundary. The SEMs, as the standard deviation on the contour of the grown mesh region and the number of growing operations, are large because images in which mesh regions disappear continue increasing after 60 μM. Moreover, the number of growing operations increases at 80 μM and the SEM is also large. This signifies that the network was isolated because the tubes become massed together.
The SEM of the mesh region count is small in all dose-variant sample image distribution. However, the SEM of the other three attributes is larger than that of the mesh region count at middle and high level doses. The other three attributes offer additional measures to reflect the state of tubes at middle and high level doses.
In the relative dose–response ratio, the mesh region area, the contour length of grown mesh regions, and the number of growing operations are higher than the mesh region count including at low-level doses. This is useful for solving the issue that the ratio of the mesh region count is lower than that of the human assessment for low-level doses.
Assessment of the Anti-Angiogenic Process
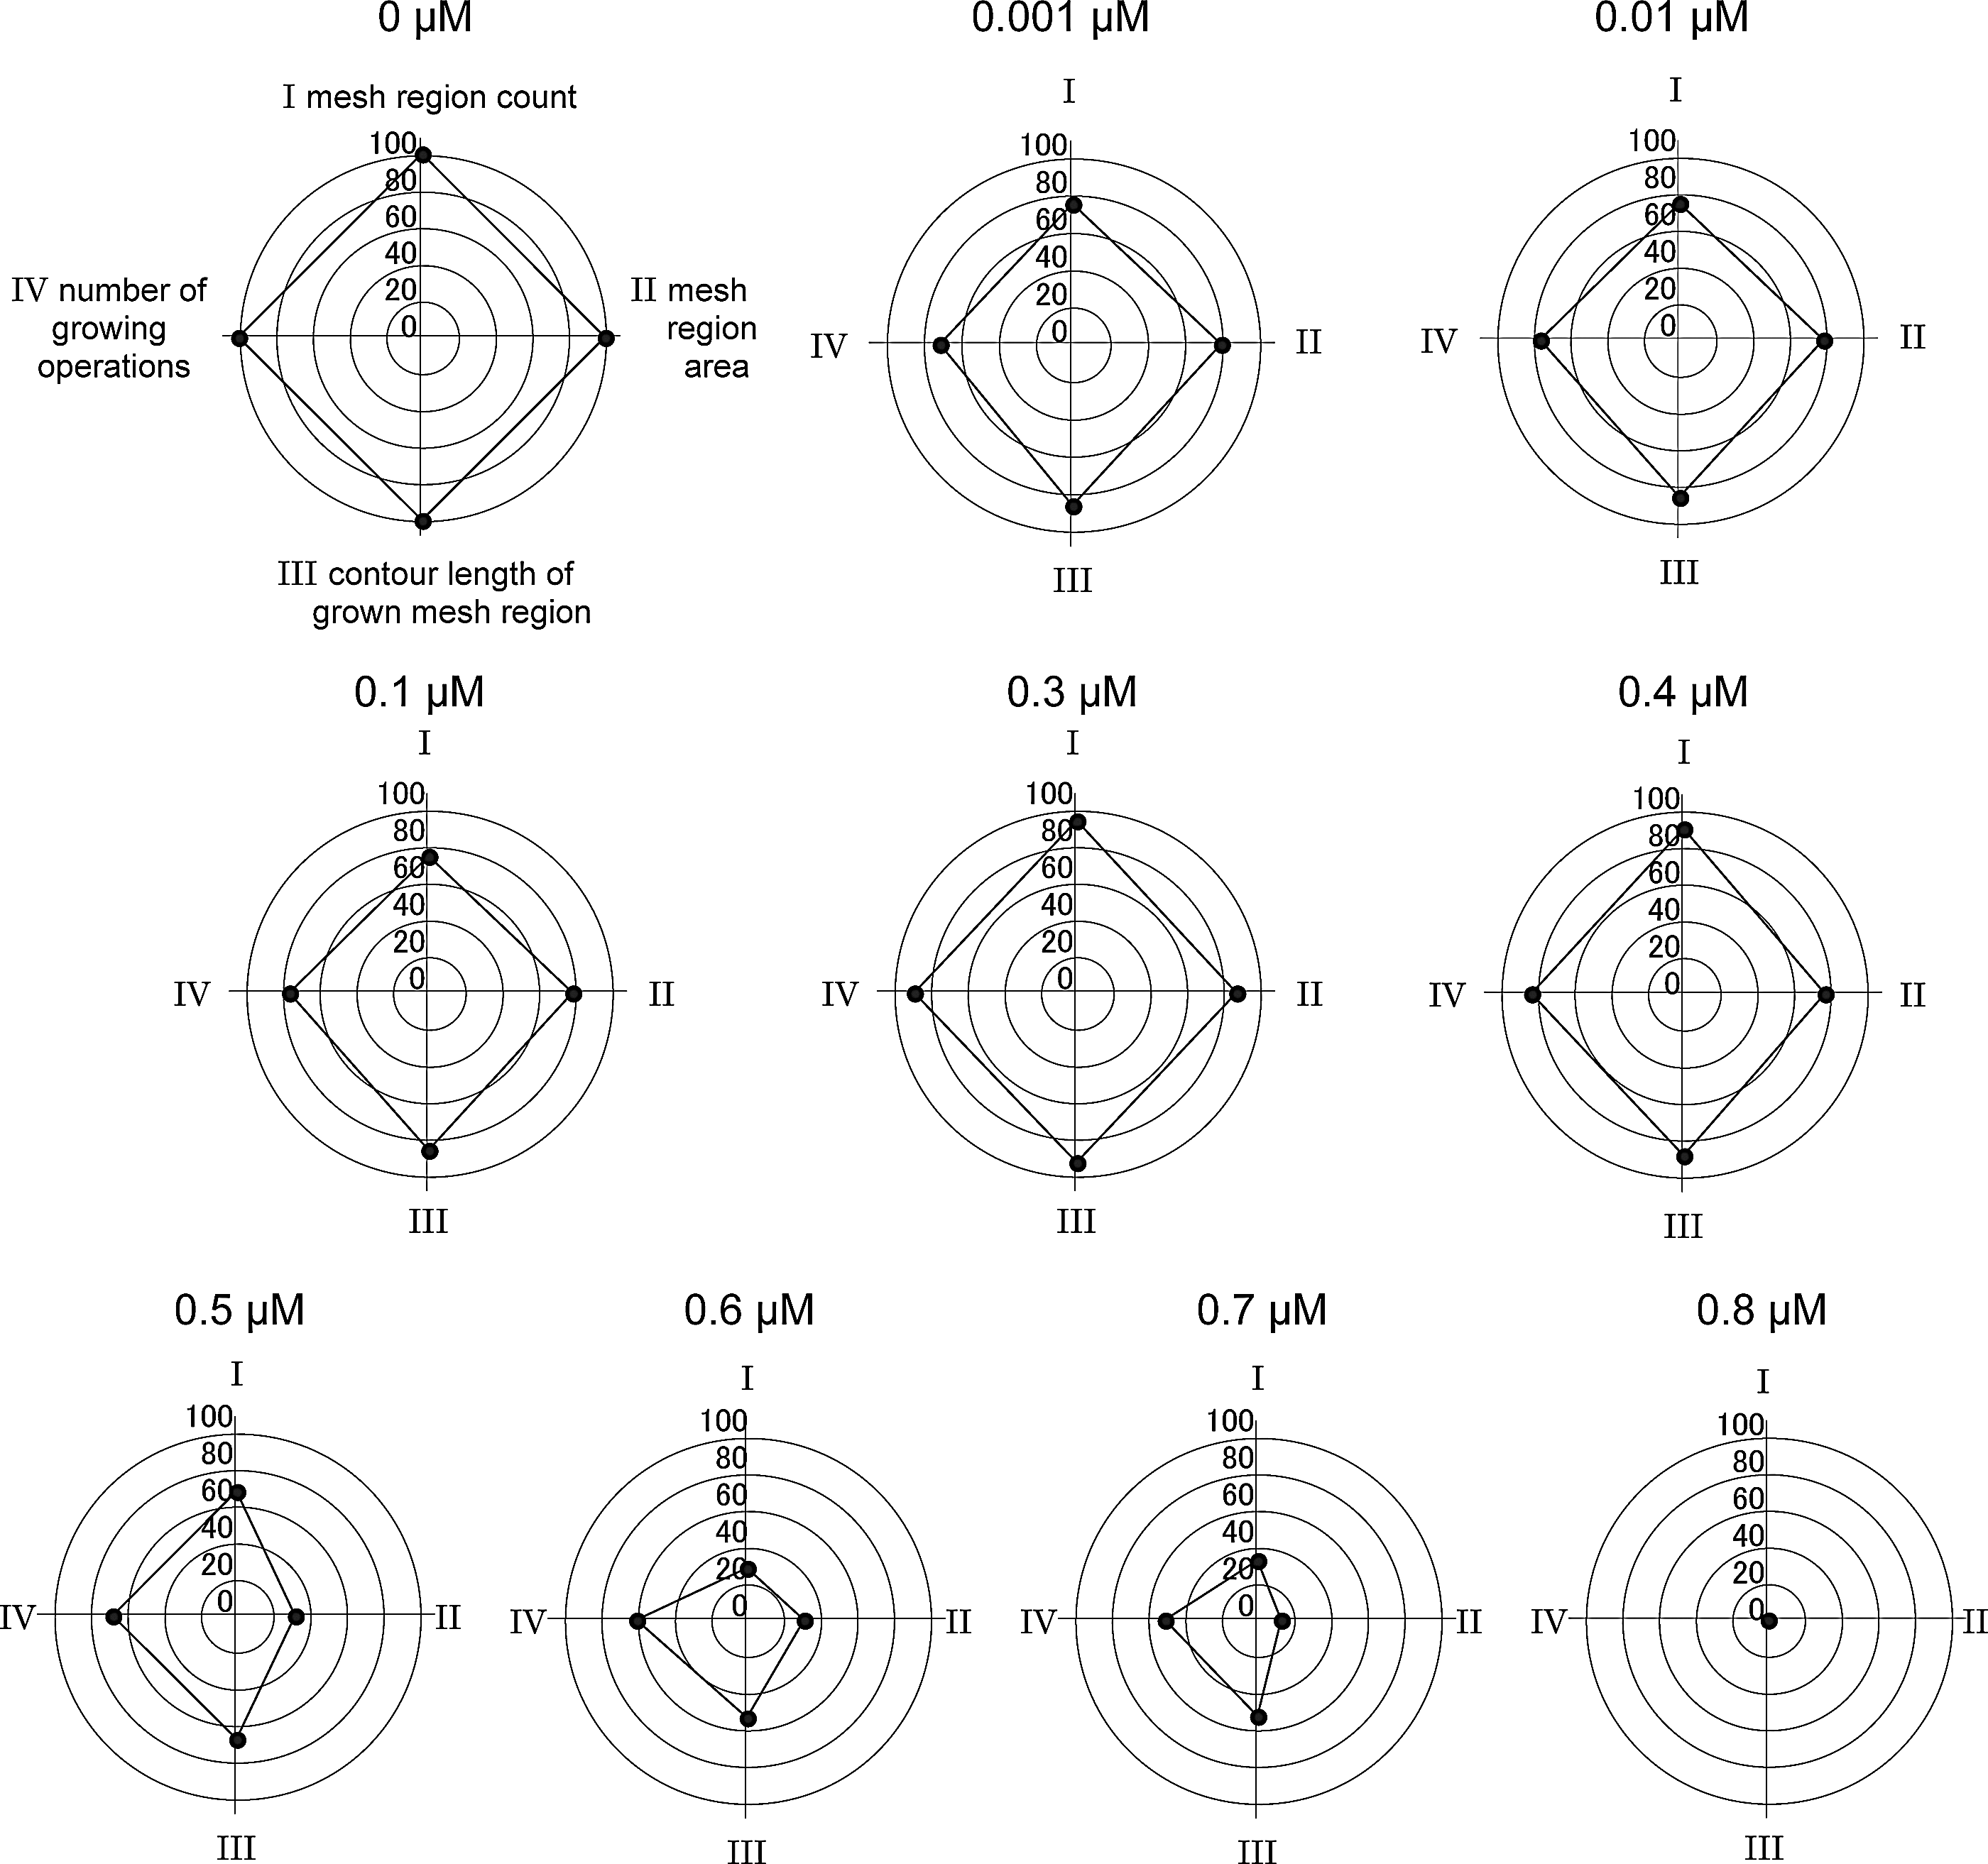
The series of the radar charts provides a qualitative view of the anti-angiogenic process. Changes in size and form of the tetragon are caused by the degree of disruption of tube formation and by the state of tubes. The anti-angiogenic process is represented as morphological changes of the tetragons corresponding to the dose (Fig. 10).
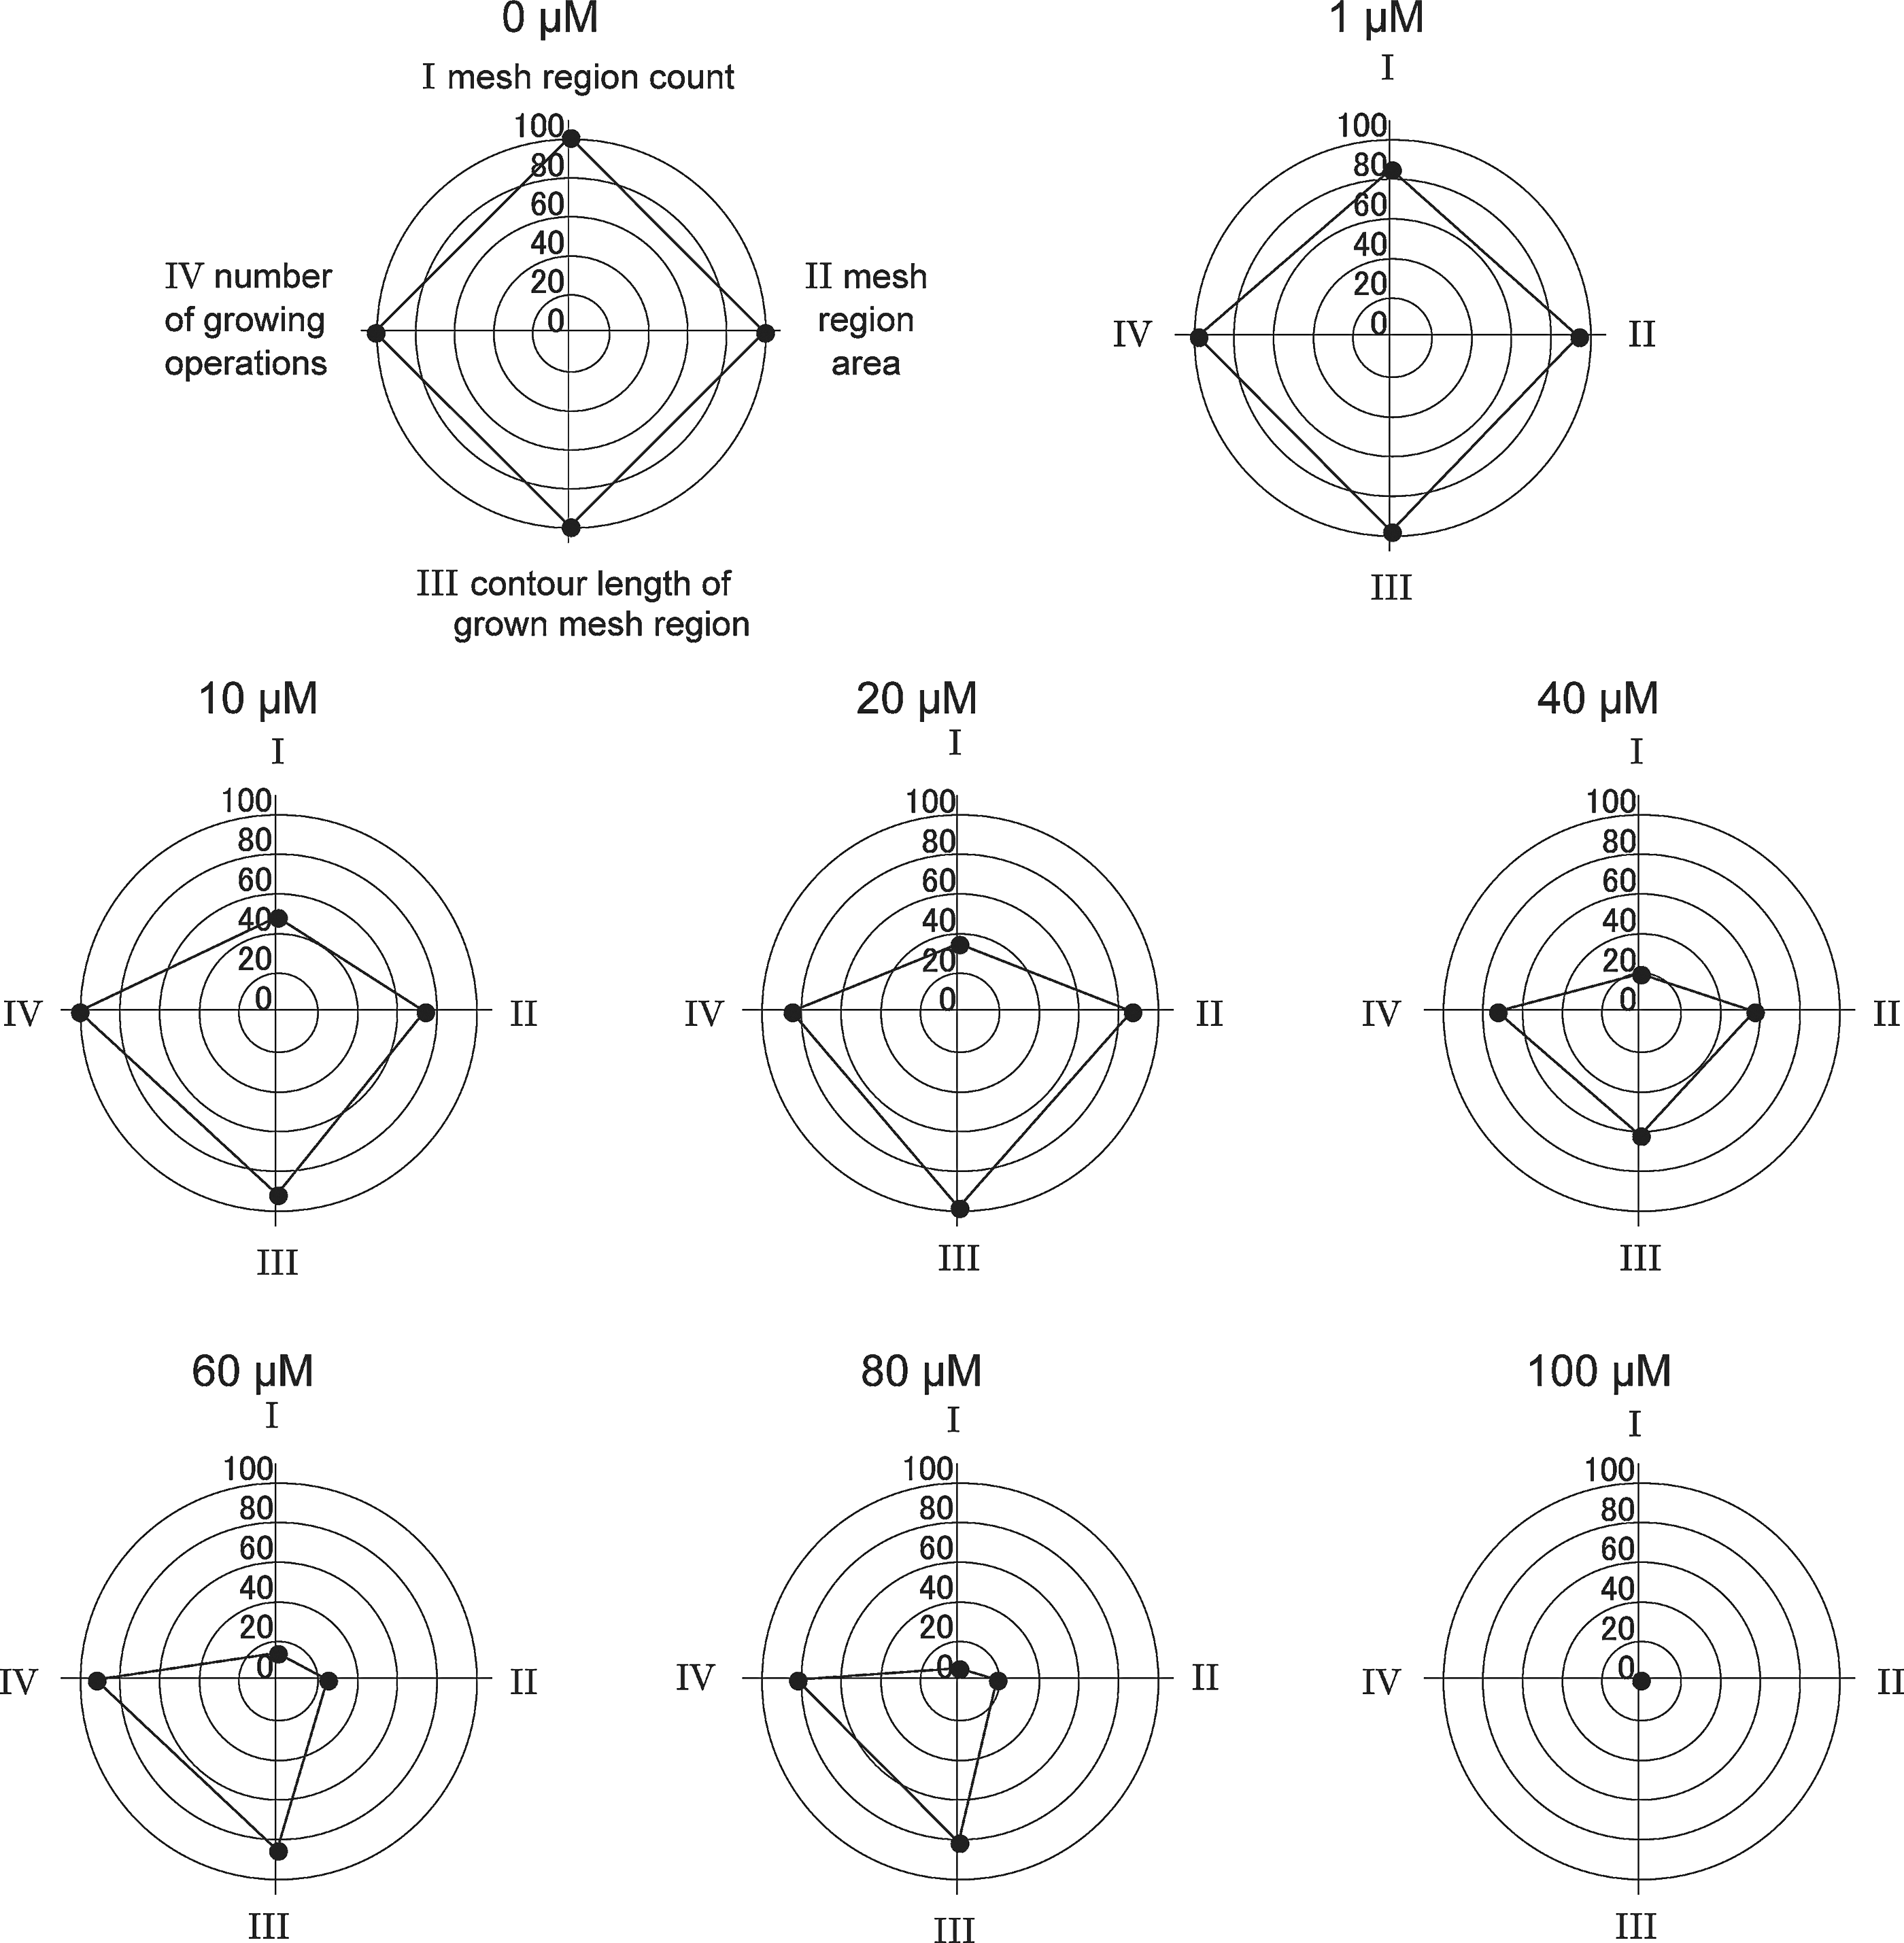
A series of radar charts to represent the anti-angiogenic effect of suramin in doses from 0 to 100 μM.
As the dose rises, the tetragon is immediately crushed along the mesh region count axis, and is expanded or shrunk temporarily along each of the other three axes. Tetragons are almost similar and but reduced in scale down to 40 μM. The form changes distinctly at 60 μM and the overall size becomes small at 80 μM. The tetragon disappears eventually and turns into one point.
As shown in Figure 11, the power shows the response as a gradual inhibition from low-level doses to high, while the human assessment sees the response as strong inhibition for moderate doses though it is almost in agreement with the power for low- and high-level doses. The previously discussed issue is solved by the power as the mesh region count is compensated for by the other three attributes. However, the human assessment is lower than the power in the middle level.
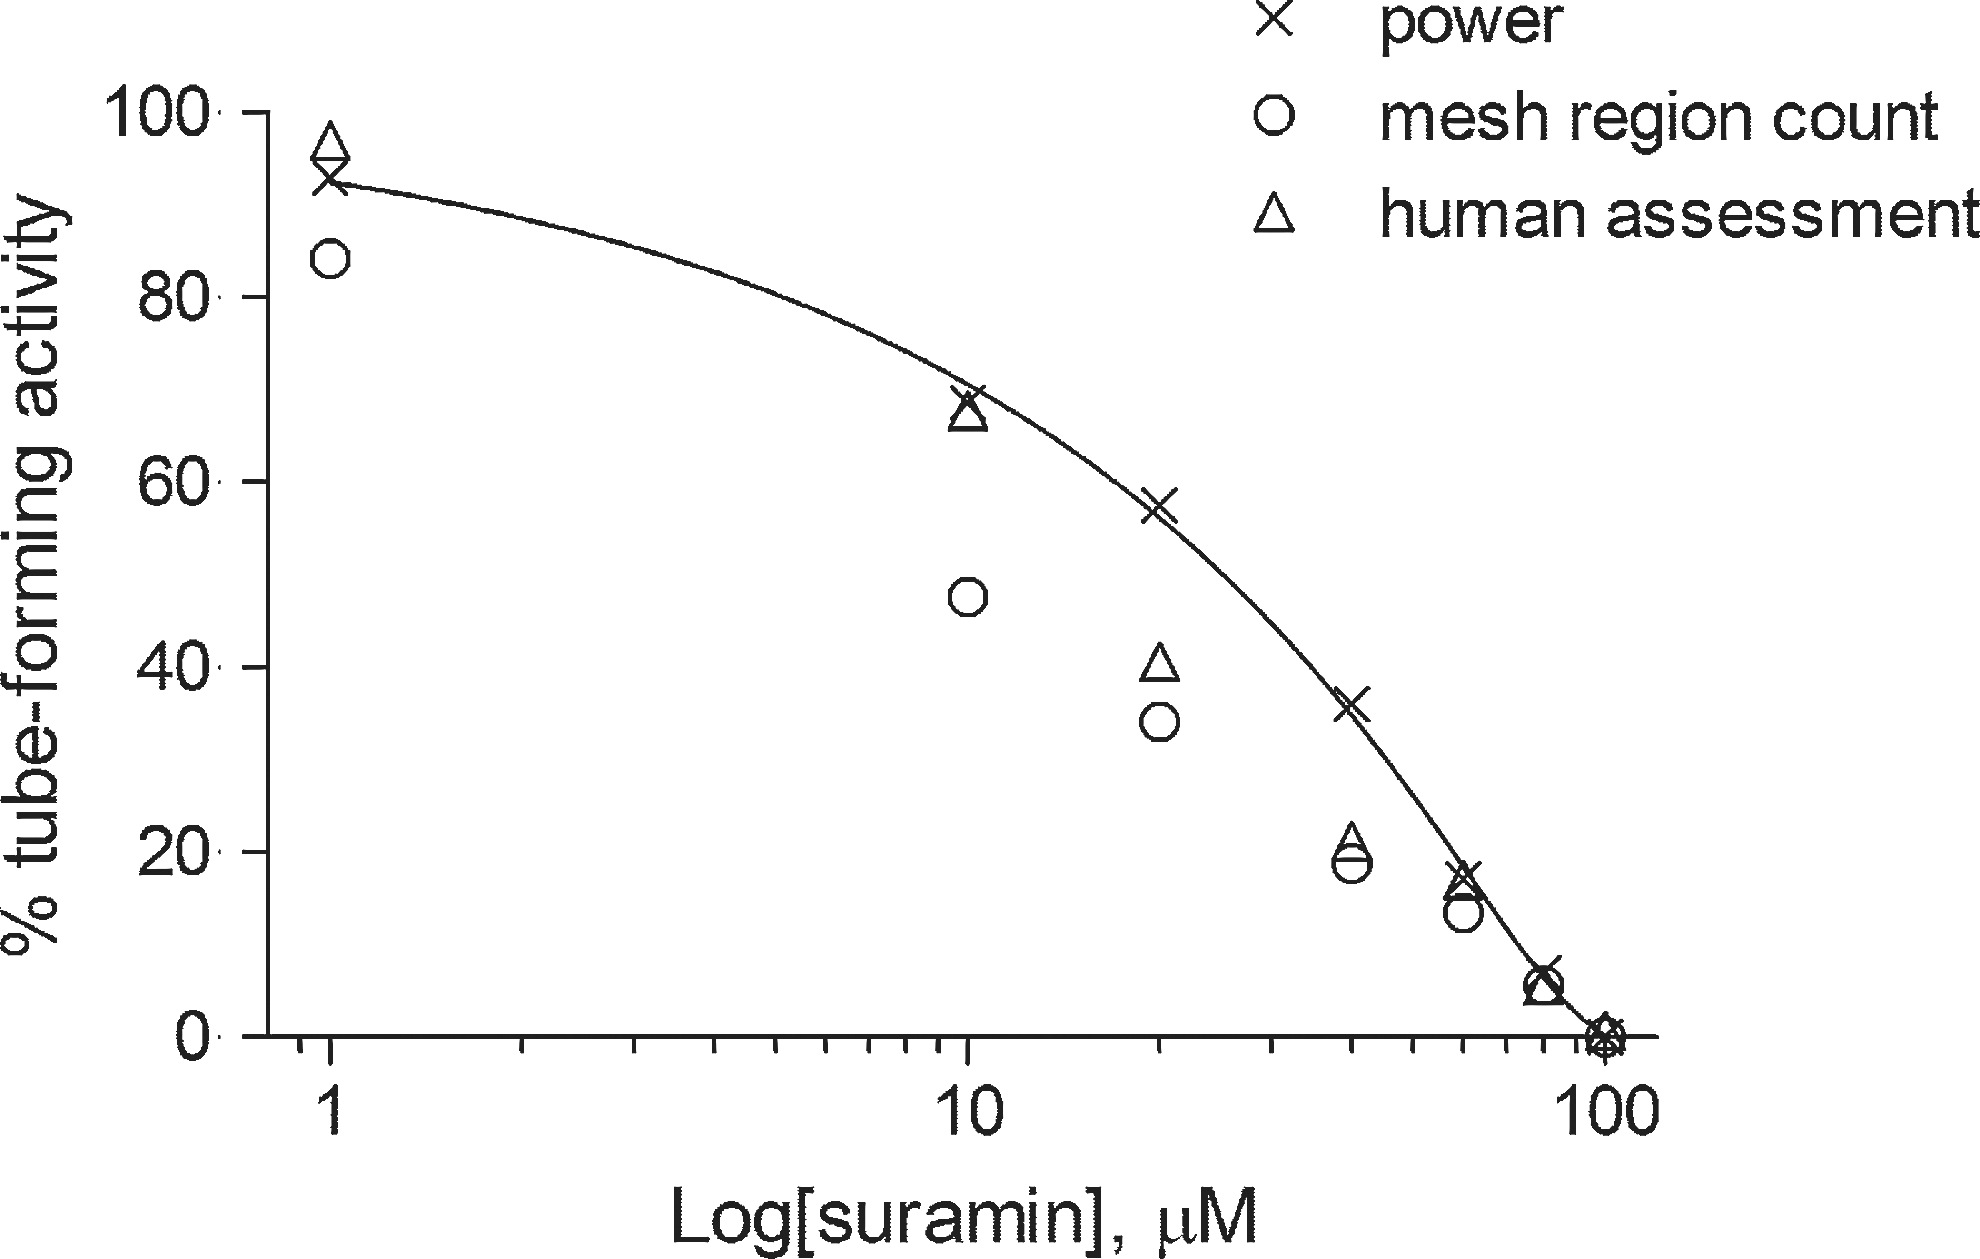
Quantification of the anti-angiogenic process corresponding to the dose of suramin: power (×) with fitted curve; mesh region count (○); human assessment (▵).
When the curve for the power is approximated by the Richard's curve, the half minimal inhibitory concentration (IC50) is calculated to be 25.19 μM using the best-fit parameters and is in agreement with published reports 13 and related estimates; IC50 values of 29 μM have previously been reported for angiogenic tube formation, 6 and also 34.2±1.7 μM with the use of vascular endothelial growth factor. 7
Discussion
We have developed a mesh-loosening analysis to evaluate the disruption of tube formation in anti-angiogenesis. The mesh-loosening analysis provides a relation between suramin dose and response with an approximately sigmoid curve, and an IC50 which is similar to previously reported values. The most important feature of mesh-loosening analysis is that tube formation is evaluated by considering the mesh regions surrounded by the tubes.
In available software applications, tube formation is evaluated by geometric measurements such as length and branching points of the skeleton which are basic textural features of the images, as shown in Figure 2B. Researchers are dissatisfied with the quantification because it is inconsistent with their assessments. These automatic measurements may include small artifacts and isolated cell aggregations because they may be unable to remove them completely from the skeletons. If the removal program were improved, it is likely that some parameter adjustments would be required to match the images to the algorithm, which would make the procedure much harder.
By contrast, the mesh-loosening analysis is user friendly because only one parameter, which is the area of a small mesh region, is required in order to distinguish small artifacts. The other thresholds used in the mesh region segmentation are self-determined statistics such as SD and the 95% lower confidence limit on distribution of intensity. However, a weak point of the mesh region segmentation is that it sometimes fails to find a thin tube at low-level doses because it avoids detecting extremely small changes. It is suggested that the microscopic piece used for the mesh region segmentation should be slightly larger in size than a kernel for the operator of the filtering used to extract the skeleton. The weak point can be addressed simply by changing the size of an image.
A strong point of the method is that it is essentially searching for the background using the mode of the SD histogram instead of searching for tubes. This allows the method to deal with nonuniform lighting effects because the nonuniform lighting causes the base intensity to vary gradually. Moreover, the method is effective on images where some tubes are almost disrupted at moderate doses. In these images, the skeletons of the tubes are apt to be disconnected because the tubes present almost unchanged intensity in a local area. Recognition of meshes is affected so that the mesh count is lower than the mesh region count and the human assessment at moderate doses.
The skeleton is extracted using the variability of the intensity, while the mesh region is extracted using invariability of the intensity. In addition, restricted objects such as mesh regions, background, tubes, and cell aggregations only appear in images obtained from in vitro experiments. As described previously, the logic for extraction is so simple that the mesh region segmentation can lend itself well to automatic recognition in anti-angiogenic studies.
Tube-forming activity is a useful indicator of the degree of tube formation affected by an inhibitor. Specifically, subtraction of the absolute difference between 100% and the relative dose–response ratio is equivalent to standardization. It is then possible to assemble the values of the four attributes into a radar chart, to quantify the dose–response relation, and to calculate IC50. Furthermore, the power derived from the polygon of a radar chart makes it easy to obtain the dose–response relation. The radar chart and the dose–response curve will be able to have error bars on the tube-forming activity value and the power, respectively, if dose-variant sets of images increase in the future.
Human assessors evaluate the inhibition at moderate doses as being greater than that shown by the power though the assessments are similar at lower doses. That is, researchers see tube formation as locally disrupting the cell network. However, the tube formation remains globally as a part of the network. This result suggests that it is hard for researchers to see both local and global areas simultaneously because of characteristics of human perception, and that it is difficult for them to evaluate the state of tubes that have both thick and thin parts.
The mesh-loosening analysis may be applicable to quantifying network connectivity in images along the z-direction, which is roughly separated from the 2-D collapsed image. If the volume data of tubule-like structures related to angiogenesis can be obtained, the mesh-loosening analysis may be applicable to quantifying angiogenic processes in a 3-D environment.
Feasibility Study
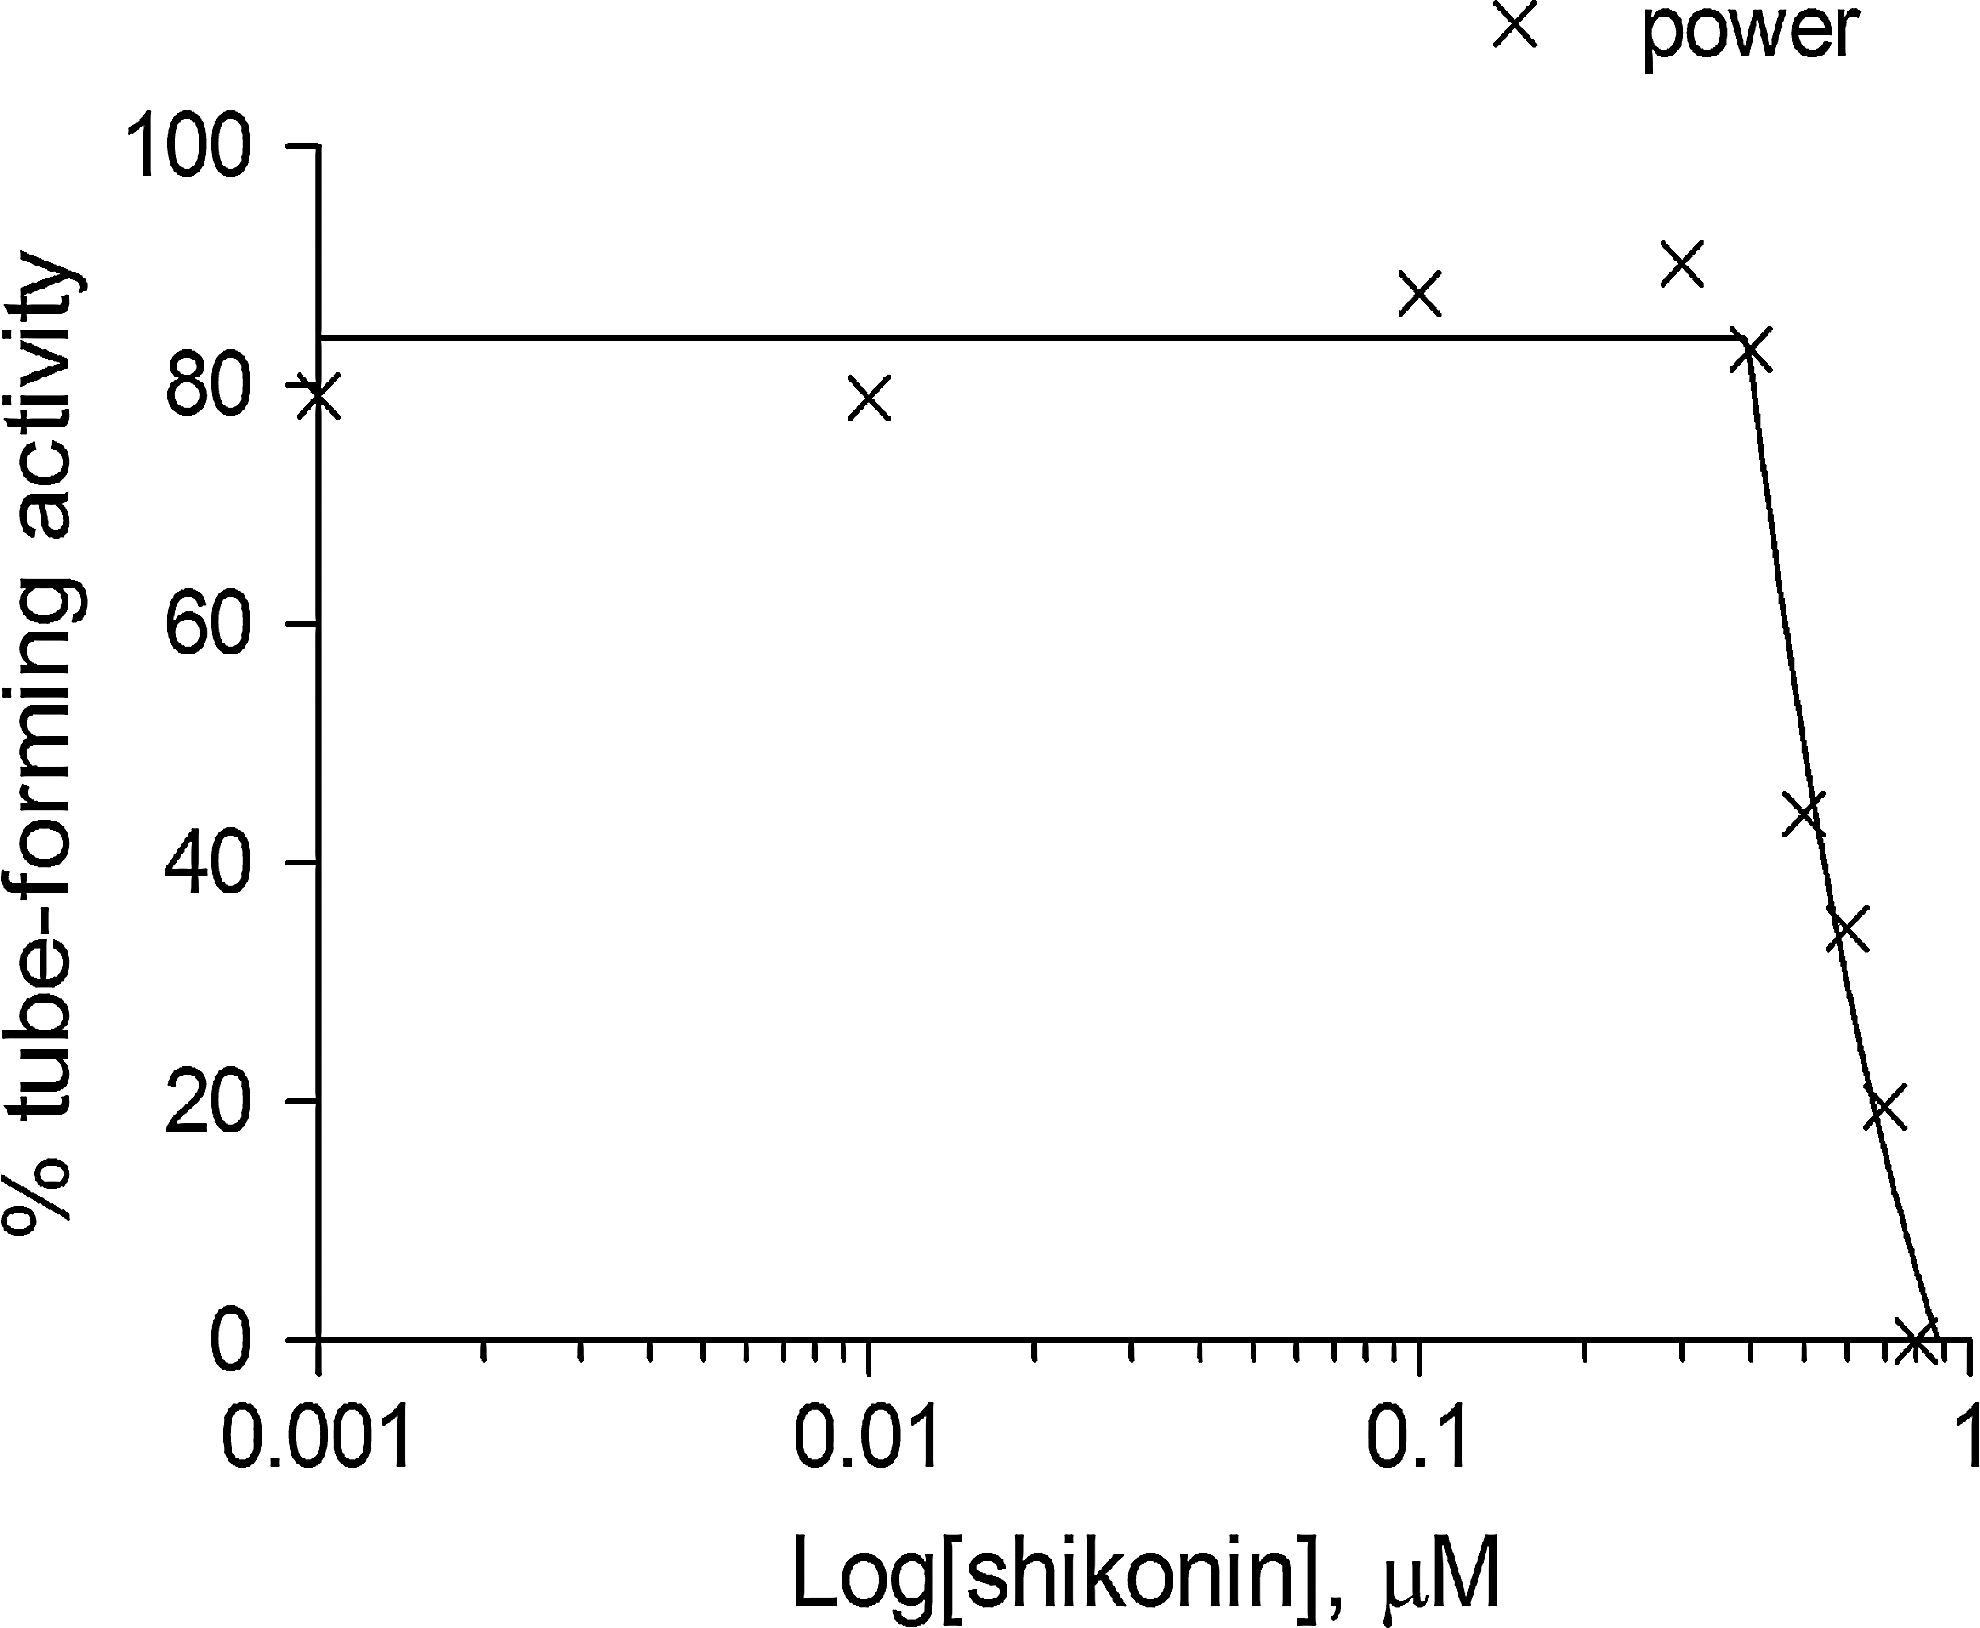
Additional experiments with another inhibitor shikonin (Merck Millipore, Darmstadt, Germany) were performed following the protocol in Table 1 to check the feasibility of the mesh-loosening analysis. Several images were acquired (n=37, 21, 21, 18, 22, 15, 15, 7, 13, and 5 for 0, 0.001, 0.01, 0.1, 0.3, 0.4, 0.5, 0.6, 0.7, and 0.8 μM, respectively). A dose-variant set of images is shown in Figure 12. The mesh-loosening analysis was applied in these images by using the same setup as in the analysis for suramin. It took about 20 min to extract mesh regions and to quantify attributes of them on 174 images for all doses. The four values of the tube-forming activity calculated for each attribute are plotted on a radar chart for each dose in Figure 13 as the qualitative view of the anti-angiogenic process by the inhibitor shikonin. Giving a quantitative view, Figure 14 shows a dose response inhibition curve by Richard's curve fitting of the power calculated using the tetragon in the radar chart. IC50 is calculated to be 0.499 μM using the best-fit parameters. The mesh-loosening analysis was able to evaluate the anti-angiogenic effects of shikonin. Much effort will be required in the case of human visual assessment. The difference between suramin and shikonin with respect to the dose–response relationship is not discussed here because it is beyond the scope of the paper.
Tube formation attributable to increasing dose of shikonin, showing a complicated anti-angiogenic disruptive process. Cell networks temporarily become the dense with vague tubes, and then they collapse as if cells separated.
A series of radar charts to represent the anti-angiogenic effect of shikonin at doses from 0 to 0.8 μM.
Quantification of the anti-angiogenic process corresponding to the dose of shikonin.
Conclusion
We have demonstrated the use of mesh-loosening analysis for the quantification of anti-angiogenic processes and shown that the method produces faithful synchronization with continuous variation of an inhibitor dose on Matrigel. The method is based on the schematic model that the anti-angiogenic process is indirectly represented as numerical and morphological changes of mesh regions perceived by considering the spaces between tubes. Dose–response results for the inhibition of suramin underscore the high accuracy and effectiveness of the method. The results of quantification of the anti-angiogenic effect of shikonin show the robustness of the mesh-loosening analysis.
The human assessment suggests that human beings tend to be restricted by the characteristics of human perception. This implies that objective quantification is required for evaluating inhibition of angiogenic tube formation. Mesh-loosening analysis lends itself to screening applications that necessitate precise and comprehensive quantification of anti-angiogenic processes.
Footnotes
Acknowledgments
The authors thank M. Shimamura for collaboration in human assessments and for insightful comments and suggestions and H. Ashino for providing information about inhibitors.
Author Disclosure Statement
All authors are inventors of No. 2007-282497 for which notice of allowance was given, and No. 2011-64961, which is pending in Japan.