
Abstract
The advent of high-content screening more than a decade ago remodeled drug discovery workflows by recasting the role of cell-based approaches in target identification, primary screening, lead optimization, and toxicity. The ability to identify and quantify compound effects on multiple cellular functions allows for rapid characterization of chemical libraries. Laser scanning imaging cytometry (LSIC) is one of the technologies that is being applied to a broad range of assays utilizing fluorescent labeling, at throughputs compatible with primary screening campaigns. Cellular resolution is achieved using laser scanning excitation through a specialized F-theta scan lens. This configuration results in rapid whole well scanning and large depth of field. The recent availability of systems equipped with multiple sources of laser excitation and arrays of detectors for spectral analysis has significantly increased its applicability through enabling more fluorescent reagents and higher levels of multiplexing. LSIC is being used most extensively for phenotypic screening especially in areas such as cell health, RNA interference (RNAi) screening, and three-dimensional cell models. This review communicates advances in LSIC and how it is being applied by presenting an overview of the technology and a range of real-world case studies.
Introduction
The screening strategies employed in the search for new therapeutics evolve constantly in response to the changing portfolio of therapeutic targets and the specific needs of each lead discovery team. With high throughput screening (HTS) having become a mature discipline in terms of screening capacity, recent years have seen a steady focus toward higher content technologies and data quality for the biological assays. The trend toward profiling of smaller, more chemically focused compound libraries has placed increasing pressure on the relevance of the biological data generated and quality of the list of validated lead compounds. Such changes have, in part, led to an increasing application of the so-called high-content cell-based technologies. Once the bastion of a few laboratories with sufficient capital, the availability of lower cost readers coupled with significant improvements in assay reagents and labware have now delivered a cost-effective robust approach applicable throughout academic and pharmaceutical research.
High-content screening (HCS), also known as high-content analysis (HCA) is an automated method that is used to identify a phenotypic change of a cell or whole organism cultured in microplates in response to a treatment. 1 Normally, multiple features of each individual cell or organism present are measured with one or more fluorescent dyes leading to the term high content. It is this multiparametric readout that underpins the true power of the approach. HCS enables both targeted and phenotypic assays that can measure changes within a cell or movement between cells or permit the analysis of specific sub-populations of cells in a heterogeneous mix that would be difficult or impossible to perform with other technologies.
In 2006, the authors reviewed the technologies being used for HCS. 2 At that time, HCS was largely synonymous with microscope-based charge-coupled device (CCD) imagers following advances in software, automation, and hardware that allowed imaging at greater throughput. The CCD image sensor generates two-dimensional images of objects viewed through standard microscope objectives (normally 10× or 20×) with the readout being fluorescence or brightfield intensity. Increasingly, scientific complementary metal-oxide semiconductor (sCMOS) image sensors are being employed due to their extremely low noise, rapid frame rates, wide dynamic range, and larger field of view, all of which benefit HCS use. The microscopy approach offers high optical resolution (including confocal) and is, thus, particularly suited to morphological readouts, where it provides content-rich data through the application of complex image processing algorithms. The downside is that the approach can generate large quantities of data (up to terabytes), requiring expensive storage and retrieval solutions, plus sample throughput is generally low compared with established screening platforms. Such issues have been mitigated to some degree through the availability of cheaper and higher capacity data storage solutions, however, CCD imagers remain best applied for target identification and validation, where the compound library size is relatively small.
Laser scanning imaging cytometry (LSIC) represents an alternative, and in some functional aspects, an orthogonal approach (Table 1). LSIC enables high throughput, whole well HCA without generating terabytes of information. These features make such instruments ideal for the sustained use in high-content approaches for hit identification and hit-to-lead optimization screens. In simplistic terms, both technologies generate two-dimensional digital images normally exported in TIFF format. Thereafter, functional differences emerge due to the different optics being applied and the manner in which high-content information is derived. LSIC images are produced by raster scanning the sample using a rapidly moving laser spot and detecting the emitted fluorescence at defined time intervals with a serial array of photomultiplier tubes (PMTs, Fig. 1). The precise placement of each reading in the resultant image (pixel) is achieved using a Cartesian coordinate system that in essence defines the image resolution. The spacing between each pixel is defined by the data sampling rate (X dimension) and number of scan lines per well (Y dimension), typically 1 and 8 μm, respectively. These aspects contribute high sensitivity and speed to the design. An equally important feature is the use of an F-theta scan lens, which flat-fields the arcing laser spot to maintain spot size and focus across a large field of view (a central 20×20 mm area is used for scanning). The F-theta scan lens has a large depth of focus (about 25–30 μm, depending on the wavelength of light) which compensates for variations in the bottom of the microplate being scanned. This design does not require refocusing steps during the data capture, as is the case for microscope-based CCD imaging.
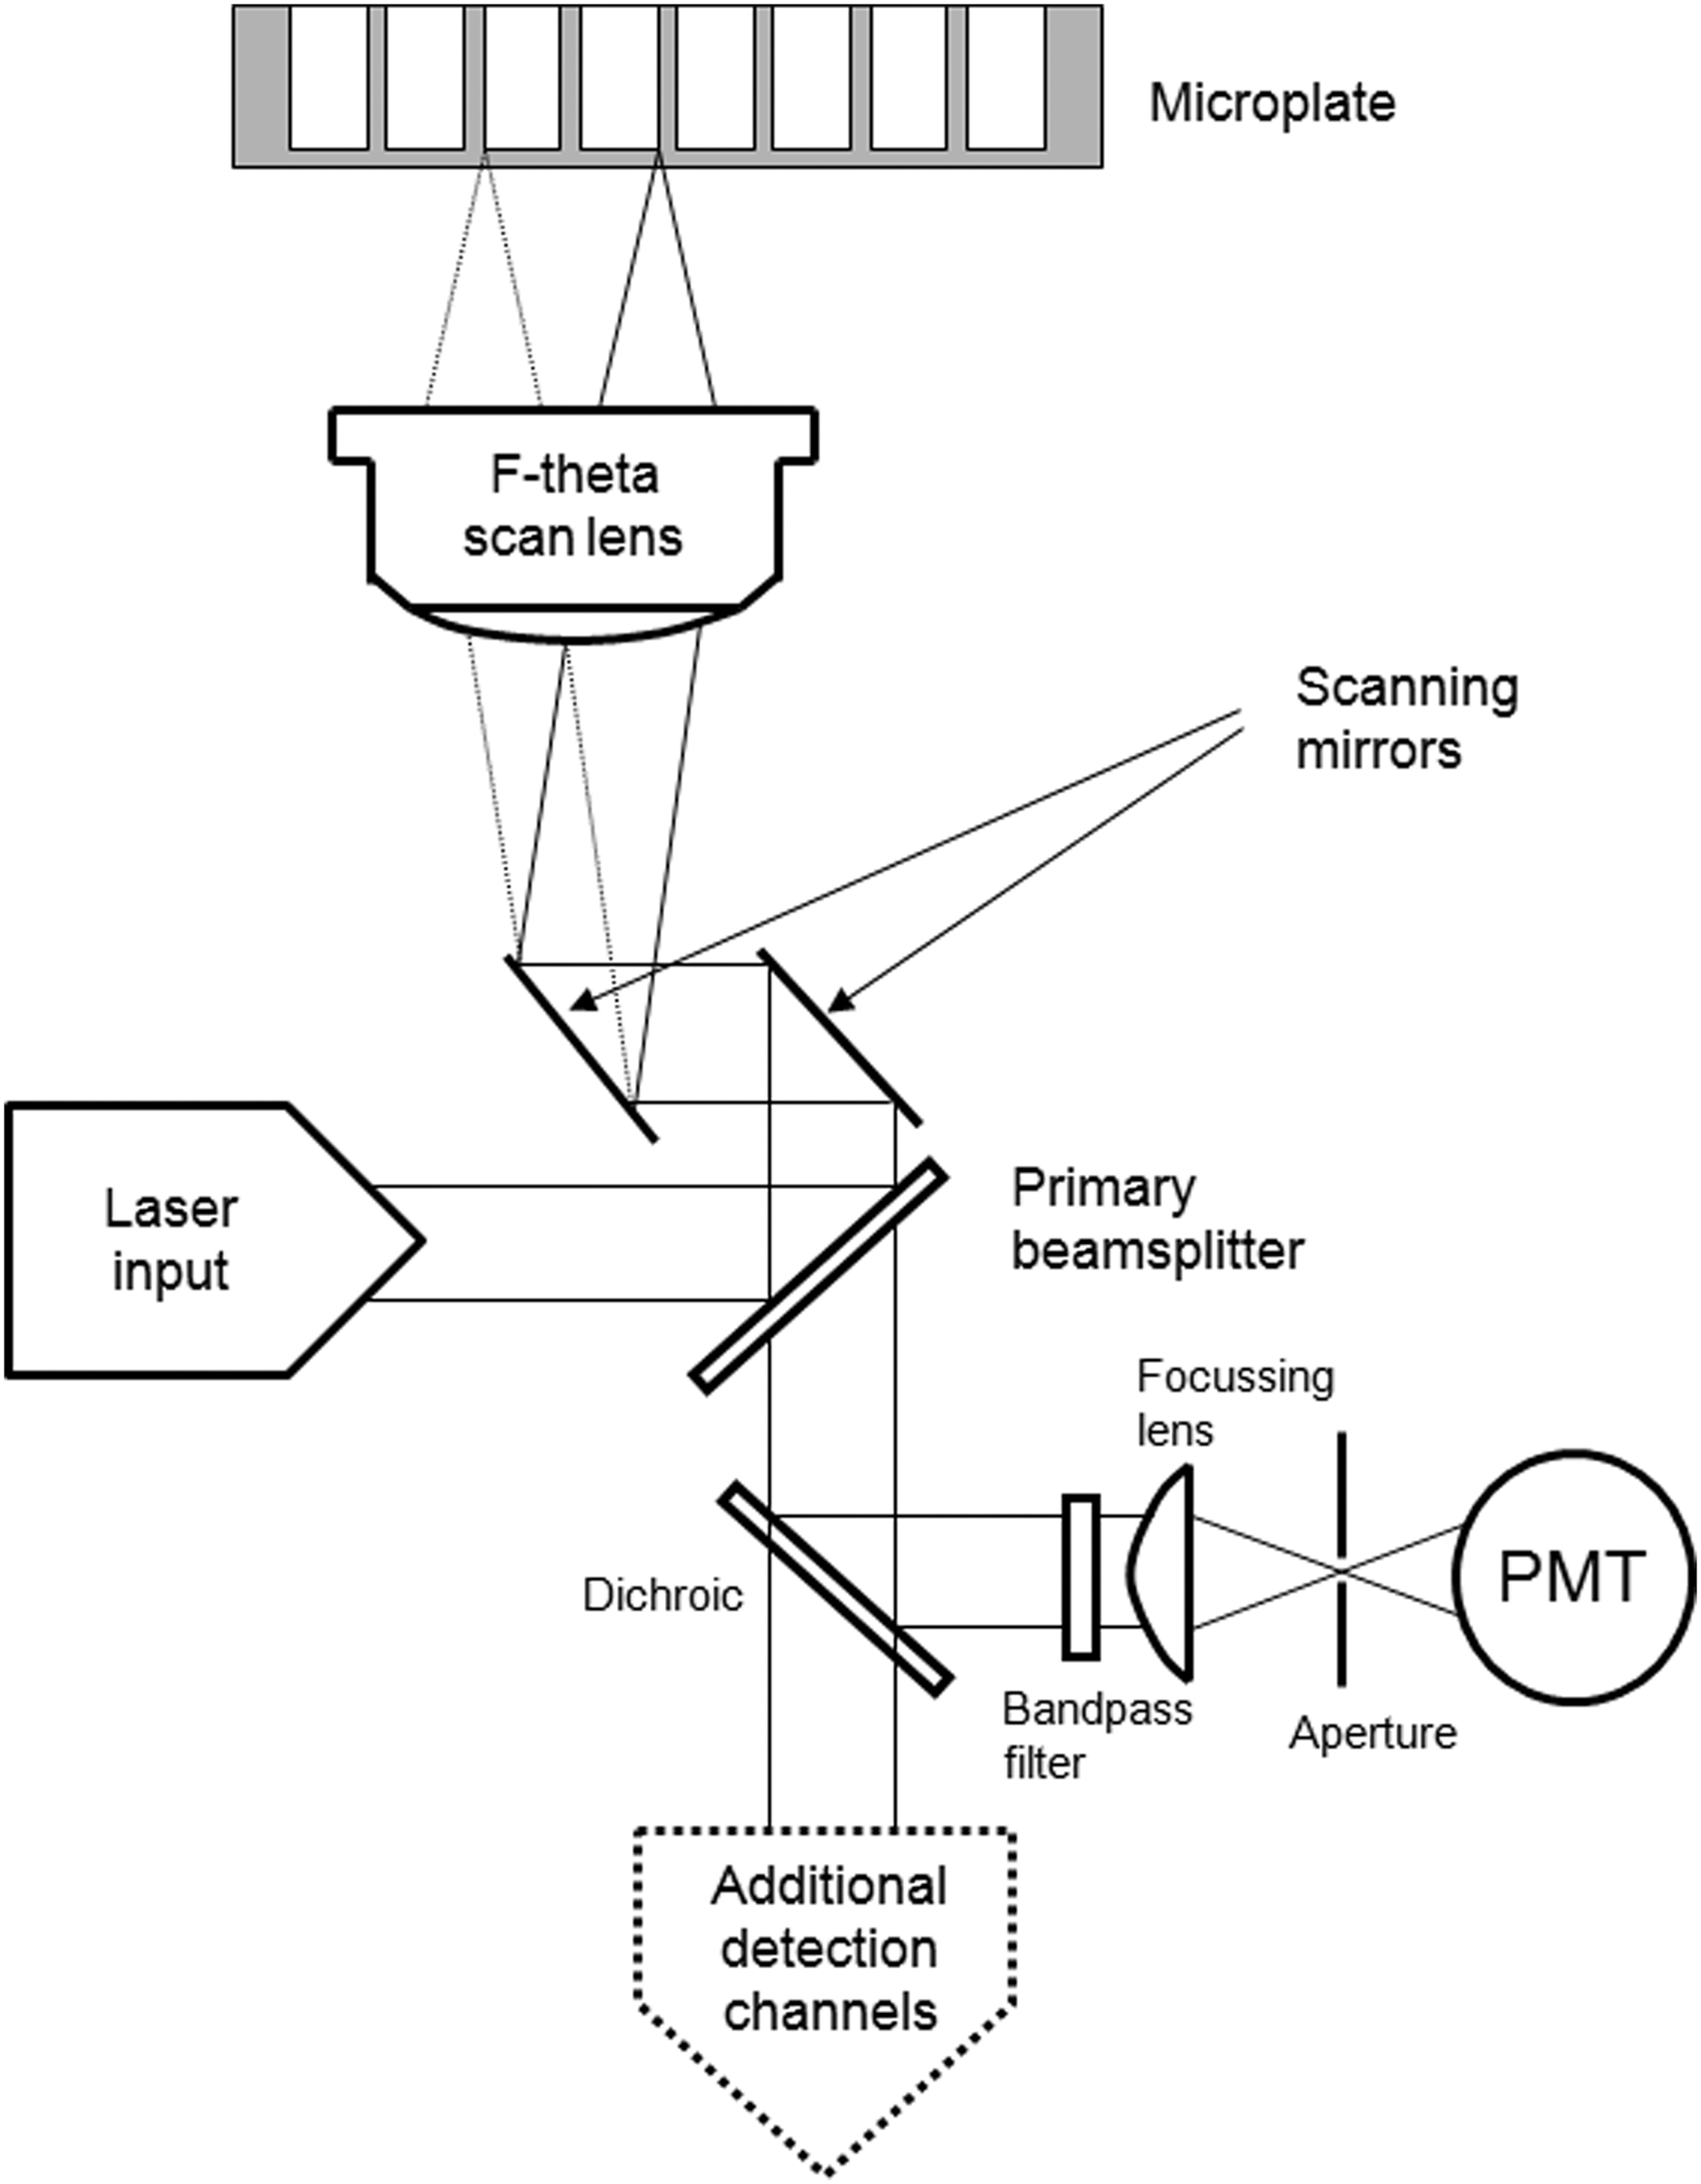
Optical configuration of an acumen laser scanning imaging cytometer. Scanning of microplates is performed through a specialized F-theta scan lens which focuses incident laser light onto the bottom surface. High speed galvanometer mirrors control laser movement in both the X and Y direction across a scan area of 20×20 mm. Emitted fluorescent light passes back through the scan lens and four sets of filter blocks containing bandpass filters and dichroic beamsplitters, which define the bandwidth of each detection channel. Photomultiplier tube (PMT) detectors monitor the light passing through each filter set, providing simultaneous detection of four colors.
Due to the broad range of available microscope-based CCD imagers, typical specifications are presented.
CCD, charge-coupled device; PMT, photomultiplier tube; sCMOS, scientific complementary metal-oxide semiconductor.
The range of applications addressable by LSIC continues to expand in response to emerging therapeutic targets and development of novel reagents and labware (Table 2). 3 –47 This has led to more research teams integrating aspects of high-content biology into their screening workflows, which has driven continuous improvements. At the same time, there has been a move away from well-established immortal cell lines toward primary, isogenic, and stem cells in an attempt to model human disease more closely. Although patient-derived material is increasingly being used in high-content assays to better understand the underlying biology, the small number of cells that can be derived from each sample limits their application in a screening environment. In addition, there has been an industry-wide initiative to adopt more phenotypic-based screening in preference to target-based approaches. 48,49 HCS has always been phenotypic in nature, heightening renewed interest. This review details how LSIC technology has developed in response to these factors with an emphasis on the applications for which it is well suited. Two commercial systems have now been discontinued, namely the ABI 8200 (FMAT®; Applied Biosystems, Waltham, MA) and ImageXpress® Velos (Molecular Devices, Sunnyvale, CA). Therefore, in this study we outline the key features of the acumen® imaging cytometers (TTP Labtech Limited, Melbourn, United Kingdom), and how they are applied within HCS. 50
RNAi, RNA interference.
Technology Developments
Hardware
LSIC enables in situ visualization and analysis of fluorescent objects in microplates by using laser scanning and specialized optics. The first systems were fitted with argon-ion air-cooled lasers emitting 488 nm (blue) light. These required containment in an external module due to their physical size and high heat output. Arguably, 488 nm excitation is the most popular wavelength used in HCS, since it can address the common dyes, including fluorescein, R-phycoerythrin, and propidium iodide, as well as green fluorescent protein (GFP). Since the introduction of LSIC, there has been a significant expansion in the number of spectrally distinct probes, enabling the observation of multiple molecular species (e.g., different proteins) with high specificity (Table 3). This has required a broader choice of excitation wavelengths coupled with re-engineered collection optics with tailored bandwidths. Aside from 488 nm, popular wavelengths on CCD imagers are 405, 565, and 640 nm. When considering increasing the number of lasers in the acumen, it made sense to prioritize these to facilitate the transfer of assays from CCD imagers to acumen for HTS. This decision was perhaps the easiest part of the development since major technical challenges remained.
eGFP, enhanced green fluorescent protein; YFP, yellow fluorescent protein.
Laser unit selection
Additional gas lasers were not an option due to their physical size and service requirements. The range of available wavelengths was also limiting. Therefore, solid state designs were selected due to their compactness, minimal power usage, and heat production plus long-term reliability. The available wavelengths are dictated by the diode chemistries in each laser. At the time of building the first multi-wavelength system there were no lasers available in the 565 nm region. In addition, 565 nm was deemed too close to the 488 nm laser line for optimal spectral separation. Therefore, 405, 488, and 640 nm lasers were specified. In 2012, suitable 561 nm lasers became available so these were offered as an optional replacement for the 640 nm laser source.
F-theta scan lens
These complex optical components focus incident laser light from the scanning mirrors to small spot (6–10 μm) at the sample. Unfortunately, they are designed to operate optimally at specific wavelengths so the pre-existing lens was unsuitable for a multiple laser system. A bespoke design was commissioned that was achromatic between 405 and 640 nm. Also, the path taken by fluorescence emissions was corrected according to the wavelength to ensure that they were focused optimally onto the PMT detectors. The latter improves the performance of the imaging cytometer over the original design, especially in the red region of the spectrum where divergence is most pronounced.
Primary beam splitter
Located in both the excitation and emission path, this filter directs light from the laser into the F-theta lens, but importantly also blocks its transmission into the collection optics. This dual functionality places significant demands on the component to deliver maximum laser power to the sample for high sensitivity and also stop laser light from contaminating the low-level emission for good signal to noise ratios. Furthermore, the beam splitter's operation at a 45° angle calls for highly specialized manufacture. The optical performance of the triple notch beam splitter in the acumen is shown in Figure 2.
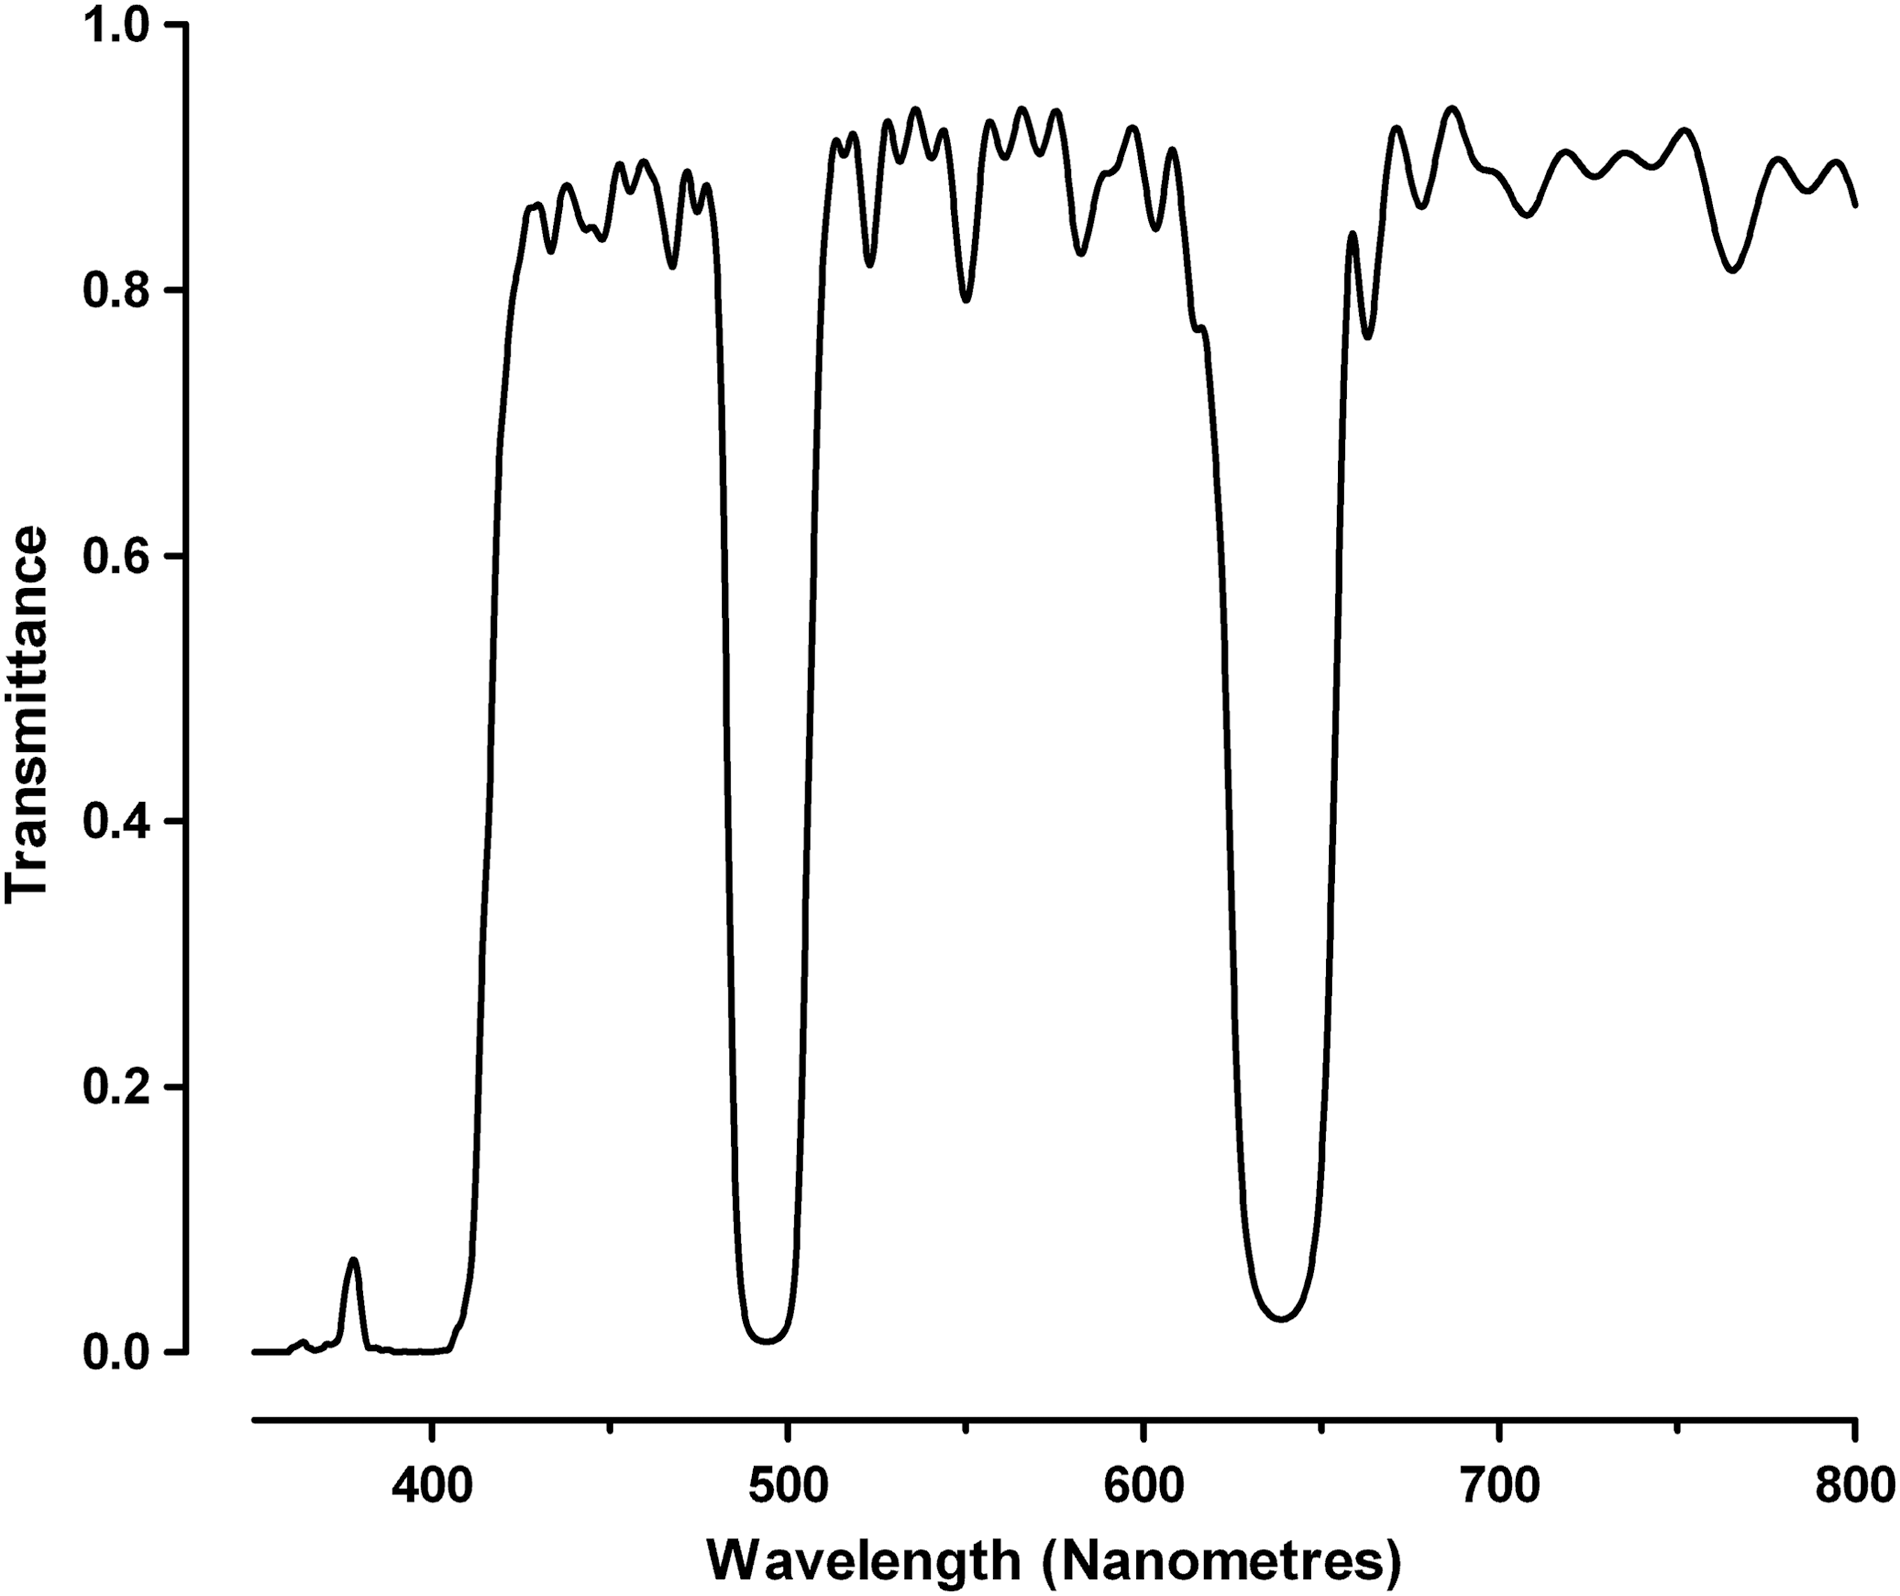
The optical performance of the triple notch primary beam splitter used in the acumen. These optical elements offer high efficiency blocking of designated laser wavelengths (405, 488, and 640 nm in this case) and high transmission over wide passbands. Rejected laser light is reflected for optimal alignment and stray light control.
The other most notable hardware development has been to increase the scan speed. LSICs were already noted for rapid plate throughput, but to keep place with automation enhancements, the 10–15 min plate read times were not optimal in some HTS environments. Recently, the acumen® Cellista HP was introduced offering read and analysis times of 5 min (1×8 μm resolution), allowing it to challenge for the workload of some bulk fluorescence readers.
Software
The fundamental aspects of the cytometric analysis software run on acumen systems have largely remained unchanged. Fluorescent objects in the field of view are routinely identified by applying patented thresholding algorithms. High-content information is subsequently derived from the resultant three-dimensional intensity profiles. 2 However, changes to the hardware, most notably additional lasers, and Windows operating systems necessitated significant developments. The resultant Cellista software operates in 64-bit Windows (version 7 onward), delivering improvements in data analysis time due to faster data processing, plus a range of new features tailored to high-content workflows.
TIFF images
A cytometric data analysis approach is complementary to the high speed data acquisition intrinsic to laser scanning due to its ability to extract multiparametric information line by line. This has the advantage in that there is no need to store data for the entire well as an image file, thus reducing data storage requirements. The downside is that the cytometric method is not well suited to certain high-content applications (e.g., those with high structural complexity) and it can fail to extract all the assay readouts requested by the researcher. To mitigate such issues, the Cellista software enables concurrent cytometric analysis and export of open microscopy environment-compliant TIFF image files of each well. These images are compatible with most commercial imaging packages, including those supplied with other HCS instruments, and also the growing number of freeware packages. 51,52 A functional benefit is that the whole well images are produced, without the need for multiple images or image stitching as is the case for CCD imagers.
Composite objects
The acumen LSIC scans the sample sequentially with each laser due to optical limits imposed by the F-theta scan lens. The major obstacle is wavelength-dependent focusing, which precludes imaging in the same focal plane with multiple laser lines. Therefore, the outputs are distinct populations of objects that cannot be correlated mathematically on a per object basis between laser scans. Some level of population analysis is possible, for instance by normalizing a response from one laser to the number of cell nuclei detected with another. A second optical consideration is the subtle variations in the position of each laser spot within the scan area, which distort object overlap. The Cellista software is now able to correct these aberrations by applying a two-dimensional correction matrix. This capability allows creation of composite objects comprising objects from single laser scans based on their X and Y coordinates within the scan area. The only prerequisite being that objects are present in the same location in each scan. Composite objects have been applied to cell colony formation, in which the growth of two cell types was correlated by staining them differentially with GFP and QTracker-625 and scanning with 488 and 640 nm lasers, respectively. 3 In other studies, they were used to differentiate cells undergoing mitosis in cell cycle analysis (Fig. 3).

Application of composite mode scanning to cell cycle analysis.
Applications
With drug discovery moving toward the implementation of cell- and whole organism-based assays in which screening is performed in a more physiological context than in biochemical assays of isolated targets, researchers are continually striving to broaden the applicability of high-content approaches. HCS gained an initial foothold in oncology research, due to the early applications for measuring cell proliferation and apoptosis. Assays for cell cycle, migration, and angiogenesis soon followed. Thereafter, its use in neurobiology has emerged especially for the study of neuronal morphology, for example, the monitoring of neurite outgrowth. These were supported by high-content applications targeting GPCR function as the major target class for neuronal disorders. A review of the growing compendium of literature provides evidence that HCS is having a perceptible impact on drug discovery and the life sciences. Recent advances have broadened the range of applications to encompass new areas. In this review we outline those found to be addressable by LSIC.
Cell Health
The drug discovery industry requires continual development and production of new drugs to address a wide range of clinical conditions and increase product portfolios. A major problem for the pharmaceutical industry is the failure of promising drug candidates very late in the testing phases due to unpredicted side effects and toxicity issues, which prevent a candidate molecule being taken to market. Such failures at this late stage of the product development pipeline incur substantial time and cost factors. Testing regimes that can identify and exclude toxic molecules as early as possible during the screening program should lead to significant time and cost savings.
Assessing cell membrane integrity is one of the most common ways to measure cell viability and cytotoxic effects. Measurements of dyes that only enter permeated cells or targets exposed after the cell membrane has been compromised can be used to detect these effects. In many systems, a single chemical property or kinetic response is measured to predict cytotoxicity, for example, the reducing potential of cells using a luminescence or ATP system. These assays are based on a singleplex readout where one molecule or activity is being measured. They are high throughput, but will not capture the complexity involved in cellular toxicity. They can also be expensive to run due to the costs of the reagents required for the assay. HCS has overcome the limitations of these existing methods by measuring several parameters simultaneously reducing the risk of a toxic effect being missed. For these reasons, the most common application of HCS remains cytotoxicity.
Previous studies using imaging-based HCA have shown the feasibility of its use in toxicity screening. 53 However, with typical plate read times of approximately an hour followed by additional time for image processing, CCD image-based systems are only compatible with intermediate sample throughput. To achieve high throughputs compatible with primary toxicity screening campaigns, multiplexed assay methods have been developed for the acumen LSIC using triple laser excitation. Three fluorophores were used to monitor the hepatotoxic effects of a small panel of commercially available compounds on HepG2 cells. The 405 nm laser-excited Hoechst 34580 dye stains all nuclei and facilitates enumeration of total cell number (giving a measure of cellular proliferation). Additionally, Hoechst nuclear half-width measurements give a measure of nuclear condensation, which occurs during apoptosis. The 488 nm laser-excited TMRM dye is a cell-permeant, cationic, red–orange fluorescent dye that is readily sequestered by active mitochondria. TOTO-3 is a 640 nm laser-excitable fluorophore, which stains the nuclei of dead/dying cells where the cell membrane has been compromised, thus providing a readout for the total number of dead cells per well.
The time course of compound toxicity in HepG2 cells was monitored by incubation with compounds or vehicle controls, and then staining both control and treated wells with Hoechst, TOTO-3, and TMRM. This approach enabled generation of time-dependent cytotoxicity profiles (relative to vehicle control–treated wells) for the drug panel tested (Fig. 4). As this method enables the measurement of four different cytotoxicity parameters for each compound, it is clear that they have very different modes of action. These results clearly demonstrate the power of multiplex analysis, because if only a single health parameter is measured, other toxic effects could be missed. It also gives the opportunity to redesign compounds, which show some therapeutic benefit, but suffer from undesirable toxicity effects, and in some cases this effect could have more serious consequences.
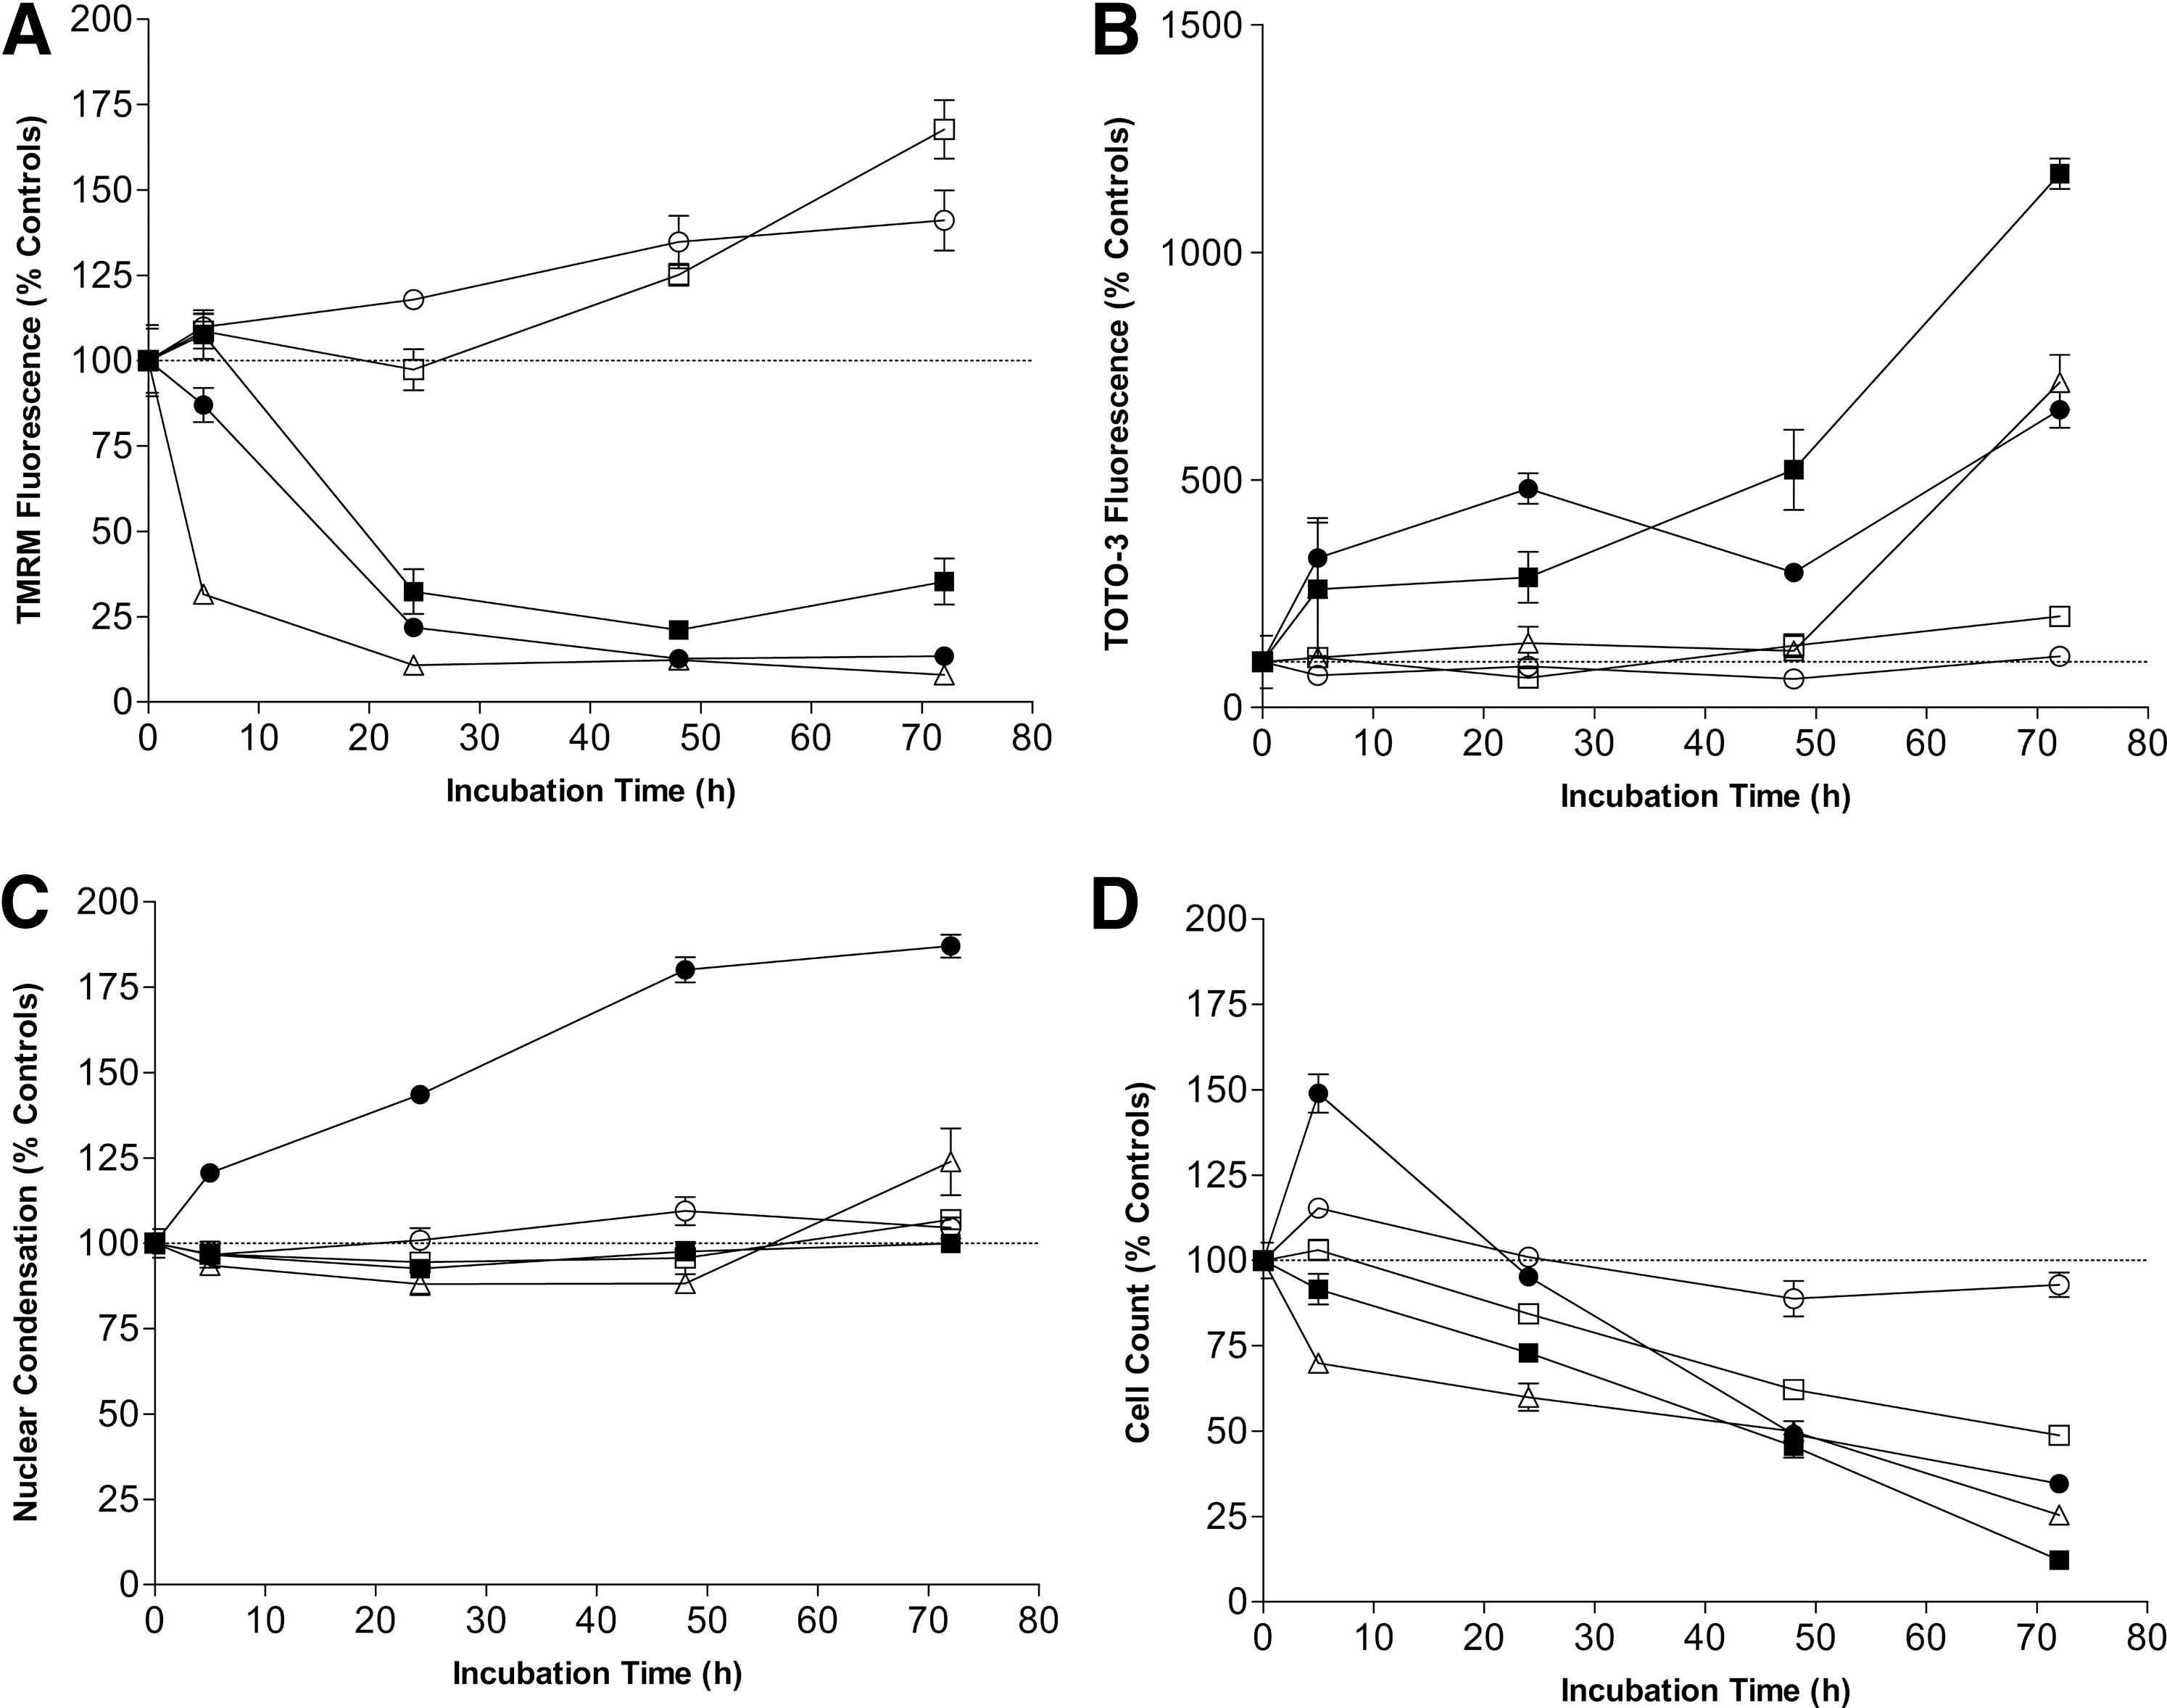
Time course of toxicity measurements in HepG2 cells on treatment with compound (2 μM). Four measures of cell health were quantitated:
Cell Cycle Analysis and RNA Interference Profiling
The cell cycle is one of the most fundamental and important processes in eukaryotic cells, culminating in cell growth and division into two daughter cells. Defects in cell cycle regulation are a characteristic feature of tumor cells and mutations in the genes involved in controlling the cell cycle are extremely common in cancer. Monitoring dysfunctional cell cycle regulation is thus the focus of intense interest, since it provides an opportunity to discover new targets for anticancer drugs and improved therapeutics. The effect of compounds or RNA interference (RNAi) on the cell cycle is widely studied in the drug discovery industry. The cell cycle is divided into two main phases: interphase and mitosis. Interphase is when the cell prepares for mitosis and it is divided into three subphases: G1, S, and G2. Movement across these phases is regulated by a number of complex signaling pathways. Mitosis is when the chromosomes in the nucleus separate into two identical sets (cell division).
Traditionally, cell cycle analysis has been performed using fluorescent dyes to stain for nuclear content using flow cytometry to measure changes in DNA content. The main disadvantages of this technique are low throughput, use of large number of cells, and the inability to analyze adherent cell lines in situ. More recently, however, research groups have used fluorescent imaging systems such as acumen LSIC for these studies, allowing rapid HCS of the effect of compounds on the cell cycle. 54,55 As the need for higher throughputs has grown, the use of LSIC has become the standard method for analyzing the cell cycle in a high throughput manner, where it is capable of reading an entire 384- or 1,536-well microplate in less than 8 min. The method can perform such analyses on cells in situ, markedly simplifying sample preparation. Cell cycle analysis by LSIC is typically performed on permeabilized or fixed cells using a cell-impermeant nucleic acid stain, but is also possible to use live cells and a cell-permeant nucleic acid stain. For fixed cell protocols the most commonly used DNA dye is still propidium iodide. It has the advantage of being excited by 488 nm light and can be used on both flow platforms and LSICs. While the choices for fixed cell staining are varied, there are only a few examples of applicable cell-permeant nucleic acid stains for live cells including Hoechst and the Vybrant® DyeCycle™ reagents.
Of major significance in using LSIC is the ability to analyze adherent cells in situ, which provides valuable secondary information by preserving morphological changes that may have occurred during drug treatment. In addition, multiplex assays (e.g., analysis of the cell cycle alongside receptor or pathway signaling) in microplates eliminate the secondary effects associated with the harsh washing and repeated cell resuspension required for analysis by flow cytometry.
A common effector to study regulators of the cell cycle is RNAi. RNAi can be used to selectively silence the expression of genes of interest. Two types of small ribonucleic acid molecules, microRNA and small interfering RNA are central to RNAi. RNAi has become a valuable research tool, both in cell culture and in living organisms, because synthetic dsRNA introduced into cells can selectively induce suppression of specific genes of interest. By identifying gene products whose knockdown is associated with phenotypic changes, large-scale RNA-mediated interference screens have demonstrated previously unknown components of biological pathways.
LSIC is ideal for RNAi screening studies both in cell culture, for example, cell cycle analysis and toxicity testing, and in whole organisms such as Caenorhabditis elegans or Drosophila. The acumen combines rapid whole well scanning with the ability to measure cell number as part of the same assay, which gives researchers the capacity to normalize responses to total cell number. It has been used in many screens where large RNAi libraries have been studied. 14,54,56,57 This capability eliminates the requirement to run a separate proliferation assay alongside the assay of interest. It also accounts for effects such as patchy cell growth and stimulation within the well, which may be missed when analyzing a smaller field of view. By utilizing the high-throughput capability and rapid analysis of LSIC, this technique can conduct genome-wide cell cycle screens in a matter of days rather than weeks.
Cell Migration and Invasion
The ability of living cells to migrate within their environment is central to a variety of physiological processes such as tissue repair and regeneration, as well as to pathologic processes. Abnormal cell migration has been implicated in diseases such as macular degeneration, diabetic wound healing failure, as well as cancer, where it plays a role in the ability of tumor cells to metastasize. As such, mechanisms involved in cellular migration are key targets for therapeutic treatment and identifying possible candidate molecules that can affect cell migration could be utilized in a number of disease states.
Traditional methods to monitor 2D wound closure have utilized scratch assays. This is achieved by physically scoring a confluent cell monolayer to create an area where there are no cells using a special scratch tool, or often using a modified setting on a multichannel pipette. The movement of cells into the scratch zone is then measured. This mechanical scoring can often produce inconsistent detection zones that are not readily compatible with image-based HTS strategies. An additional caveat of using the scratch assay is that dead and dying cells resulting from the scratch process may release apoptotic factors and other cytokines that could potentially affect signal transduction pathways in the cells that close the wound. 58 Although this method has been adequate for qualitative characterization of migration inhibitors, it does not provide the highly reproducible results required for quantitative compound structure–activity relationship evaluation because of the inconsistent size and placement of the wound area within the microplate well.
One technique that has sought to bring consistency to the placement and size of the wound area and make it more amenable to HTS is the Oris™ Cell Migration Assay. 59 This technique utilizes cell-seeding stoppers to create a detection zone for visualizing cell migration and invasion. Silicone stoppers are inserted in each well of a 96-well plate, around which adherent cells form an annular pattern 4–18 h after seeding. Removal of the stopper reveals a uniform 2 mm detection zone in the center of the monolayer into which the cells can migrate (Fig. 5). More recent advances in the technique now use a proprietary biocompatible gel to provide cell migration assays that are suitable for automated liquid handling and analysis, as they take away the manual step of removing the silicone stoppers. In these, as in all cell migration assays, the entire wound area needs to be measured and, therefore, a large field-of-view is needed to accurately identify the migration zone. In a CCD imaging system, this means either multiple images being taken and stitched together, or a compromise is required to use a lower magnification objective. Measuring only the migration zone, however, is not sufficient in itself. Many treatments are toxic, or result in the cells lifting off the well of the plate. Either of these phenotypes could easily be interpreted as an inhibition of migration if this extra analysis is not investigated. 60 As this area of cell loss can be random within the well, an area distant to the migration zone is defined and a cell count is performed within it, to confirm that the treatment does not have any other negative effects other than the cell migration phenotype being determined (Fig. 5).
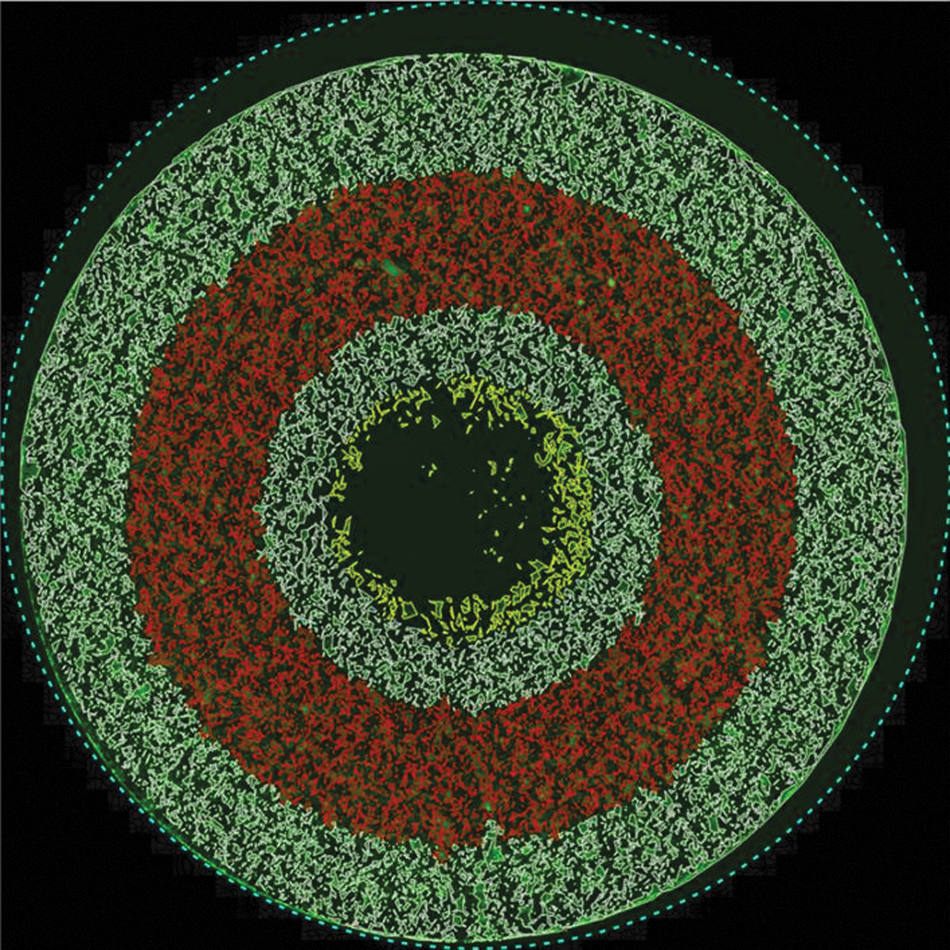
Whole well scan and cytometric analysis of a cell migration assay. A central circular area (yellow) is defined as the migration zone, which is created by either a plunger or hydrogel. A second outer region (red) is used to identify cytotoxicity and/or cell loss due to treatment, to control for off-target effects.
Three-Dimensional Cell Culture Models
While 2D culture of adherent cells has been the mainstay in oncology phenotypic screening, it has become clear that such cultures are poor preclinical models for tumor growth and progression, as they lack many of the complex biological features found in vivo. Cells cultured in 2D adherent monolayers adopt a non-native flattened morphology, aimed to maximize the cell's access to nutrients and oxygen in the culture vessel. 61 With increasing passage number, this culture format will impose a strong selective pressure toward the most rapidly proliferating cells, as well as those cells able to grow without the support of extracellular factors and/or other cell types. 61 This is in stark contrast to the heterogeneous tumor environment in vivo, where the cells are typically exposed to significant metabolic gradients (e.g., for oxygen, carbon dioxide, nutrients, waste), and display distinct cellular phenotypes. 62 In addition to the cancerous cells, tumors comprise a range of other cell types, such as fibroblasts, innate and adaptive immune cells, as well as cells that line blood and lymphatic vessels, which together with the extracellular matrix critically influence its growth and survival. 63,64 It is, therefore, hardly surprising that drug screens of 2D cell cultures have limited predictability on the efficacy of cancer drugs in vivo.
It has long been accepted that cells grown in a 3D environment retain many of the phenotypic and genetic traits of tumors and, therefore, could bridge the gap between in vitro and in vivo screening models. 65 Only in recent years, however, have the technologies to culture and analyze large numbers of cells in 3D become commercially available, which has in turn enabled the adoption of these cell culture models in high throughput and HCS. At present, no single 3D culture format has been established as a gold standard for drug discovery and the choice of format (e.g., ultra-low attachment [Corning, Inc., Corning, NY] and hanging drop [3D Biomatrix, Inc., Ann Arbor, MI; InSphero AG, Schlieren, Switzerland] plates, soft agar systems 3 ) depends on the needs of the experimenter. Many of the plates comply with the SBS standard required for automation and offer a choice of either 96- or 384-well format.
While the assay format of choice should aim to represent the biology of the disease model as closely as possible, the technical challenge of culturing a large number of specialized cells in 3D for screening must also be considered. Important deciding factors can be the ease of setup of the 3D cell culture, as well as the ease of culture maintenance and drug addition; the need for and cost of specialized plate types; the ability to analyze cells on the culture plate; the ability to take time point measurements; with each assay format having its respective advantages and disadvantages (Table 4).
✓, Difficult; ✓✓, requires practice; ✓✓✓, easy.
LSIC, laser scanning imaging cytometry.
Similarly, a number of analysis options exist for 3D cell cultures: spectrophotometric assays (e.g., alamarBlue®, CellTiter-Glo®), utilize metabolically reactive substrates to provide an indirect measure of cell viability, which can also serve as a surrogate readout for cell proliferation. As whole well intensity measurements, however, these assays can only offer singleplex readouts. HCA by contrast can provide additional automated readouts, such as the number, shape, and size of individual cultures, as well as the distribution of different cell types within the 3D structure. LSIC is particularly suited to the analysis of 3D cultures, as even large (>1 mm diameter) objects can be imaged without stitching multiple images using the area-based scan mechanism of the instruments. Furthermore, the large focused depth of field of the F-theta scan lens allows large objects to be imaged in a single scan, thereby offering significantly faster read times than conventional CCD-based imagers, which require a Z-stack of images to be taken to reconstruct the 3D objects in a well.
Imaging of 3D cell cultures by LSIC is accomplished by one of two methods: either the cells are stained with fluorescent viability dyes (e.g., calcein-AM and propidium iodide or CyQUANT®) immediately before imaging to give an endpoint reading. Alternatively, cells expressing fluorescent proteins (e.g., GFP or RFP) or cells with a long-term stain (e.g., CellTracker™) can be imaged over an extended time period. The advantage of the first method is the multiplexed nature of the assay readout (Fig. 6), as well as its wide applicability to most cell lines. In an HCS context, the ability to take only endpoint measurement should not be limiting. For more sophisticated 3D models comprising more than one cell type or for assays requiring time point measurements, the second method can be advantageous, as it is possible to track the growth of (different) cell lines over longer periods of time. However, there are some drawbacks: the creation of cell lines expressing the fluorescent protein of choice is laborious, and transiently transfected cells or cells labeled with CellTracker dyes can only be tracked for a low number of cell divisions.
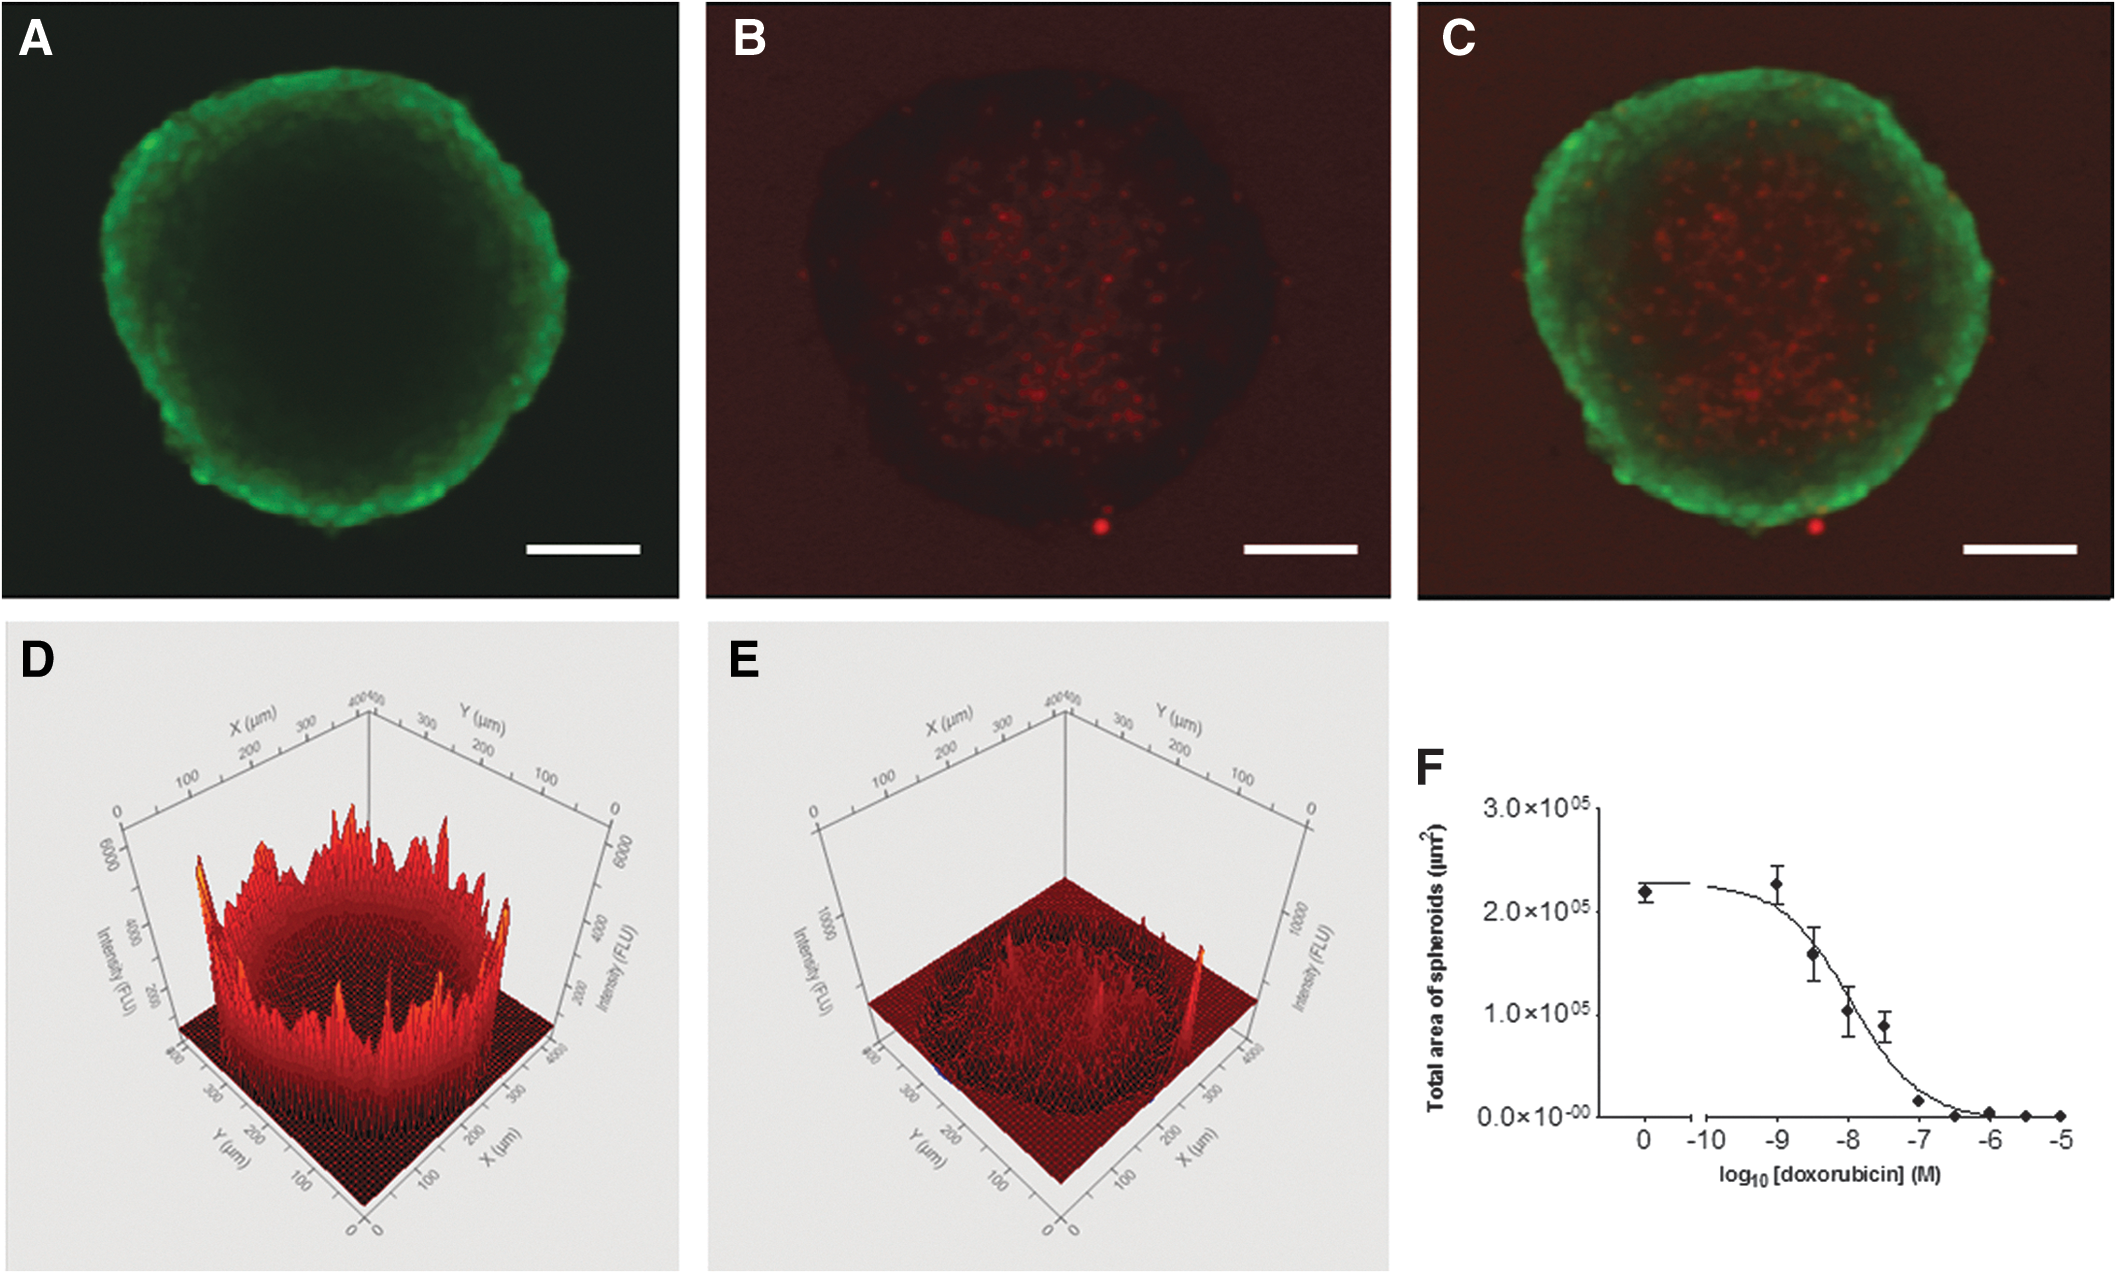
A HepG2 tumor spheroid grown on an ultra-low attachment plate; stained with calcein-AM (live cells [green], 1 μM) and propidium iodide (dead cells [red], 2.5 μM) (scale bar 100 μm).
Multimodal Workflows in HCS
As HCS programs have become more established and more routinely used within drug screening, this has created a number of new problems which need to be overcome. The most obvious block is the throughput that can be achieved using CCD imaging with microscope objectives. In the early years, the number of test compounds was limited to the tens of thousands, which for CCD imagers was a manageable number. The size of compound screens using phenotypic screening has become much larger, however, so while the speed of image capture is often very rapid, the time required to image a large area of the well and stitch the images together for analysis still takes significantly longer to perform. This is especially true when looking at multiple fluorophores in multiple fields of view. So the bottleneck in the process has now moved away from the image capture stage and IT infrastructure structure required to store large image data sets, to the image analysis itself and data handling of such large data libraries. 66
This change is driving researchers to use more integrated phenotypic screening strategies. In this model, two or more approaches are used within a screen to identify hit compounds in a fast, user-friendly manner. Not only can this significantly increase throughput, but it also has the added benefit of being able to do both primary low-content screening and secondary high-content hit validation on the same plate, which reduces expensive reagent and labor costs. LSIC lends itself to this approach very well, as the whole well can be imaged rapidly even when using multiple fluorophores, and critically, the data is analyzed and exported at the same time, resulting in real-time data export. Subsequently, these data can be used to run the hit confirmation on the same plate.
The acumen LSIC has the added benefit in that it can be used in a multimodal workflow to enable different approaches to integrated phenotypic screening. The system can be run in four different modes and are shown in Table 5. Mode 1 uses LSIC in isolation to screen compounds and is a non-integrated approach for high throughput phenotypic screening. Modes 2–4 utilize different features of the instrument and allow it to integrate with other approaches. Mode 2 utilizes the open source TIFF export function of the software, whereby whole well TIFFs for each fluorophore can be exported in as little as 5 min for a plate and then imported into off-line image analysis software for further analysis. 67 A common reason to use this approach is that in many assays, data from the whole well can be required to give statistically robust data. Imaging the entire well area using CCD image-based technologies can be both slow and difficult in terms of image stitching before analysis; the use of LSIC for whole well TIFF export removes this problem. Mode 3 uses a combination of Modes 1 and 2. The plate is first imaged by LSIC, the data are then analyzed and exported concurrently with the TIFF images. From the cytometric data, a hit list is created that determines which TIFF images will be analyzed in more detail in a third party image package using high-end image algorithms. The advantage of using Mode 3 over Mode 2 is that the data processing burden is reduced.
The final mode is the so called Wells to Cells approach pioneered by the National Center for Advancing Translational Sciences (NCATs). 68,69 In this approach, a hit list is created using cytometric data analysis on an acumen, then the plate is moved to a high-content imaging system and only hit wells are imaged at higher optical resolution. This final mode uses LSIC to triage hits in large screening libraries in a simple, fast manner, as only a small number of wells require interrogation on a CCD-based imager. This smaller sample number removes the bottleneck of screening a large compound library using traditional imaging and allows high magnification images to be taken over multiple fields of view to further interrogate the effects of the hit compounds in much greater detail. Indeed a new approach established by NCATs comprises identification of hit wells using LSIC, then only adding secondary assay reagents to hit wells for further analysis. The resultant workflow generates significant cost savings on expensive reagents while maintaining data quality.
This integrated approach solves many of the problems now identified in phenotypic screening centers and allows for a wide range of assays to be run at high throughputs. Several early adopters have automated the workflows, a move that is likely to be replicated due to the perceived benefits on drug discovery productivity.
Summary
The last decade has seen a tremendous uptake in the use of phenotypic assays as a primary screening tool and in particular in the use of HCS. More recently, the advances in fluorescent dyes, plate types, and assay formats have allowed many new assays to enter the mainstream in high-throughput phenotypic drug discovery. Considering the long timescales involved in bringing a drug to market, it will take several years before the full impact of these modern phenotypic screens to the drug discovery process can be truly evaluated. In the meantime, it is expected that the drive to develop more refined cellular models of disease will continue, with primary cells, induced pluripotent stem cells, cellular cocultures and pseudotissues playing an increasingly important role in phenotypic screening. As new approaches to HCS technologies continue to offer increased throughput and more sophisticated assay readouts, the shift from spectrophotometric assay readouts to high-content reports to capture the full biological complexity of these cellular responses will continue. Ultimately successful drug screening strategies will probably require a multimodal approach that encompasses both primary phenotypic screens, as well as specific target-based assays.
Footnotes
Disclosure Statement
All authors are employees of the TTP Labtech Limited, the company that markets the acumen laser scanning imaging cytometers, which are the main focus of this Technology Review. References are made to two other laser scanning systems, however, since both have now been discontinued it was felt that no detailed description was required.