




Abstract
High-content screening (HCS) is a powerful technique for monitoring phenotypic responses to treatments on a cellular and subcellular level. Cellular phenotypes can be characterized by multivariate image readouts such as shape, intensity, or texture. The corresponding feature vectors can thus be defined as HCS fingerprints that serve as a powerful biological compound descriptor. Therefore, clustering or classification of HCS fingerprints across compound treatments allows for the identification of similarities in protein targets or pathways. We developed an HCS-based profiling panel that serves as basis for characterizing the mode of action of compounds. This panel measures phenotypic effects in six different compartments of U-2OS cells, namely the nucleus, the cytoplasm, the endoplasmic reticulum, the Golgi apparatus, and the cytoskeleton. We profiled a set of 2,725 well-annotated compounds and clustered their corresponding HCS fingerprints to establish links between predominant cellular phenotypes and cellular processes and protein targets. We found various different clusters enriched for individual targets (e.g., HDAC, HSP90, TOP1, HMGCR, TUB), signaling pathways (e.g., PIK3/AKT/mTOR), or gene sets associated with diseases (e.g., psoriasis, leukemia). Based on this clustering we were able to identify novel compound-target associations for selected compounds such as a submicromolar inhibitory activity of Silmitasertib (a casein kinase inhibitor) on PI3K and mTOR.
Introduction
In today's drug discovery campaigns we observe a clear trend toward more complex assay environments. While target-based high-throughput screening (HTS) still plays an important role, phenotypic screening techniques are gaining importance. 1 Phenotypic screening assays are believed to be more closely linked to a given disease state than target-based approaches where the molecular hypothesis might not be relevant for disease pathogenesis.
One approach to phenotypic drug discovery is high-content screening (HCS), an HTS technique based on automated microscopy. HCS allows for highly multiplexed assay readouts that can be used to simultaneously assay several modes of action or toxicity. 2 Additionally, HCS enables screening in a controlled and disease-relevant environment by even using patient-derived cell cultures. 3
While there are many advantages to phenotypic screening, additional knowledge about the targets being modulated to bring about the desired phenotype can be highly beneficial, for example, in lead optimization, by helping interpretation of structure activity relationships. In addition, knowledge of the target can also help to identify related targets that may bring about challenges in designing selective lead molecules.
Various techniques have been developed to support target identification for compounds active in phenotypic assays. These include approaches such as affinity chromatography, biochemical fractionation, radioactive ligand binding assays, drug affinity responsive target stability. 4,5 Alternative approaches are based on in vivo chemical genomic assays developed in yeast Saccharomyces cerevisiae 6 or in silico approaches using historic knowledge about compound target associations. In silico methods predict possible targets for a compound by comparing the similarity of the compound's profile (using chemical similarity, gene expression profile, or HCS experiments) to those of previously characterized compounds with known target.
The latter predict compound targets by similarity and nearest neighbor approaches that incorporate for example, similarities in chemical structure, 7 –10 gene expression response, 11,12 or HCS experiments. 13 –19
Methods based on chemical descriptors can exploit the depth of knowledge available from data bases such as ChEMBL, 20 Integrity (Thomson Reuters), or GOSTAR (GVK Biosciences Private Limited). Methods using chemical similarity perform well in generating target hypotheses if the chemical structure class under consideration is sufficiently represented in the knowledge base and has already been annotated to the correct target. However, predictions for new scaffold and target classes are rather difficult. 7
Biological descriptors derived from multiplexed phenotypic experimental data detect compound similarities in terms of induced biological effects, independent of the chemical structure and the actual binding mode of the compounds. Even though several studies have shown the applicability of biological descriptors to detect similarities between target profiles of compounds, 11 –15 these approaches generally suffer from only having a relatively small knowledge base. 21 This is because the descriptors cannot be obtained by just calculations using the chemical structure, but rather require significant experimental effort to obtain each profile. Moreover, not every compound induces a measurable effect in each assay system, thereby decreasing the information content available for such compounds. The design of broadly applicable profiling assay systems capable of simultaneously measuring different biological effects is, therefore, highly desirable. 22
We present a novel biological descriptor that is based on a panel of image-based assays measuring morphological changes in six different cellular compartments of U-2OS cells (nucleus, cytoplasm, cytoskeleton, Golgi, endoplasmic reticulum [ER], and mitochondria). We profiled a data set of 2,725 well-characterized compounds to link their reported modes of action to the observed cellular phenotypes. For this we collected publically available compound annotations and gene sets representing individual targets, pathways, or diseases. These were used to test for gene set enrichment in clusters obtained from clustering the HCS fingerprints of the compounds. We found characteristic phenotypes for modulators of different target classes such as histone deacetylases (HDAC), 3-hydroxy-3-methylglutaryl-coenzyme A reductase (HMGCR), or tubulin (TUB). Moreover, we identified phenotypes linked to cellular processes such as the PI3K/AKT/mTOR pathway. The obtained associations were used to predict inhibitory activity of the casein kinase II (CK2) inhibitor Silmitasertib on phosphatidylinositol-4,5-bisphosphate 3-kinase (PI3K) and mechanistic target of rapamycin (mTOR).
Materials and Methods
Experimental Part of Panel
U-2OS cells (ATCC 40345) were used due to their favorable properties for imaging single cells, consistent morphology, photogenic, and adherent. The nuclei were stained with Hoechst 33342 (Invitrogen H3570), which binds to the minor groove of double-stranded DNA with a preference for sequences rich in adenine and thymine. Hoechst dyes are cell permeable and can bind to DNA in live or fixed cells. CellMask Deep Red (Life Technologies H32721) was used to visualize the shape of the cytoplasm. It stains the entire cell; the exact target of this stain is unknown due to data privacy from Life Technologies. An Anti-KDEL antibody (Enzo Life Sciences ADI-SPA-827) was used to stain the ER. The tetrapeptide KDEL located at the carboxy-terminal sequence of luminal proteins is a retrieval motif essential for the precise sorting of the proteins along the secretory pathway. KDEL proteins perform essential functions in the ER related to protein folding and assembly. The localization of chaperones and other soluble proteins in the ER is achieved by their continuous retrieval from post-ER compartments by the KDEL receptor, which is a membrane protein localized in the Golgi apparatus. Anti-Giantin antibody (Covance PRB-114C) was used as a marker for the Golgi complex in mammalian cells. This polyclonal antibody was raised against the N-terminus (residues 1-469) of human giantin. Giantin is a membrane-inserted component of the cis and medial Golgi with a large rod-like cytoplasmic domain.
To stain for tubulin, an anti-alpha-tubulin antibody (Rockland 200-301-880) was used. Tubulin itself is a globular protein consisting of two polypeptides (alpha and beta tubulin), which are assembled to filaments that form microtubules. To stain for mitochondrial morphology TOM20 (Santa Cruz Biotechnology FL-145) antibody was utilized. The mitochondrial translocase of the outer membrane (TOM) is a multisubunit protein complex that facilitates the import of nucleus-encoded precursor proteins across the mitochondrial outer membrane. TOM20 was raised against amino acids 1-145 representing full-length TOM20 of human origin. The secondary antibodies with a fluorescent label used in this study were goat anti-rabbit 488 IgG (Life Technologies A11034) and goat anti-mouse 488 IgG (Life Technologies A11017).
U-2OS cells were incubated with 10 μM compounds for 24 h at 37°C, 5% CO2 in 1,536-well plates. The cells were fixed with 4% formaldehyde solution (Electron Microscopy Sciences) for 45 min and washed at least four times with phosphate-buffered saline (PBS), then incubated with first antibody for 1 h 30 min at 37°C, 5% CO2, and permeabilized with 0.15% Triton 100X+20% fetal calf serum (FCS)+2% penicillin–streptomycin mixture. After a washing step, cells were incubated in a solution of PBS mixed with the secondary antibody and dyes (Hoechst and CellMask), during 1 h 30 min at 37°C, 5% CO2.
To avoid cross reaction within an experiment, we used four different sets of experiments (Fig. 2): A. Hoechst, CellMask, and anti-tubulin antibody B. Hoechst, CellMask, and anti-TOM20 antibody C. Hoechst, CellMask, and anti-KDEL antibody D. Hoechst, CellMask, and anti-Golgi antibody

Phenotypes of six tool compounds targeting different cellular compartments. In all figures nuclei are colored purple, the cytoplasm red.
The IN Cell Analyzer 2000 (GE Healthcare) was used to generate the images (1 field/well, Nikon 20×, NA 0.45), which were analyzed with the Harmony Software (Perkin Elmer) for nuclei, cytoplasm, and the respective compartment morphology and intensity readouts. With these settings, we detected about 250 cells per well (median of 268, mean of 250 cells in dimethyl sulfoxide [DMSO] wells), which we found to be sufficient for providing robust results (median Spearman correlation between replicates 0.87; mean Spearman correlation between replicates: 0.80).
Compound-Target Activity Assays
Data set
In this study we tested a compilation of 2,725 compounds with mostly well-characterized modes of action. This set is frequently used during assay development at the Novartis Institutes for BioMedical Research (NIBR) and all compounds have been selected to serve as potential probes for different targets and biological processes relevant to drug discovery. For all targets and processes that were actively considered during compilation of this set, at least three different compounds were included in the set. With this setup, we achieved on average about 5 target annotations per compound. However, we are aware that the annotations might be biased by the data sources and the screening campaigns the data originate from.
Plate layout and normalization
HCS readouts were derived by automatic image analysis with the Harmony Software package.
23
To obtain well-based readouts, median values were calculated for all single cell-derived features. The complete list of measured readouts can be found in Supplementary Table S1 (Supplementary Data are available online at
HCS fingerprint aggregation
To allow for the analysis of compound-induced morphological changes in all different cellular compartments at once, cellular readouts from the four different assays were pooled into one representative HCS fingerprint. For this, median values of all measurements per readout were derived for each compound (Fig. 1). Because of our assay setup, median values of features from the nucleus and the cytoplasm were calculated from in total 12 measurements per compound (three replicates in each of the four experimental settings). Median values of features measuring morphological changes in any of the other four compartments were calculated from only three measurements. In total, this led to a 135-dimensional HCS fingerprint per compound. From these 135 readouts we removed readouts from clusters of highly correlated features using the findCorrelation function of the caret package (v. 5.17.7) in R. The correlation threshold was set to a Spearman correlation of 0.9. This led to an elimination of 49 features yielding a final 86-dimensional HCS fingerprint per compound. A list of selected features is given in Supplementary Table S2.
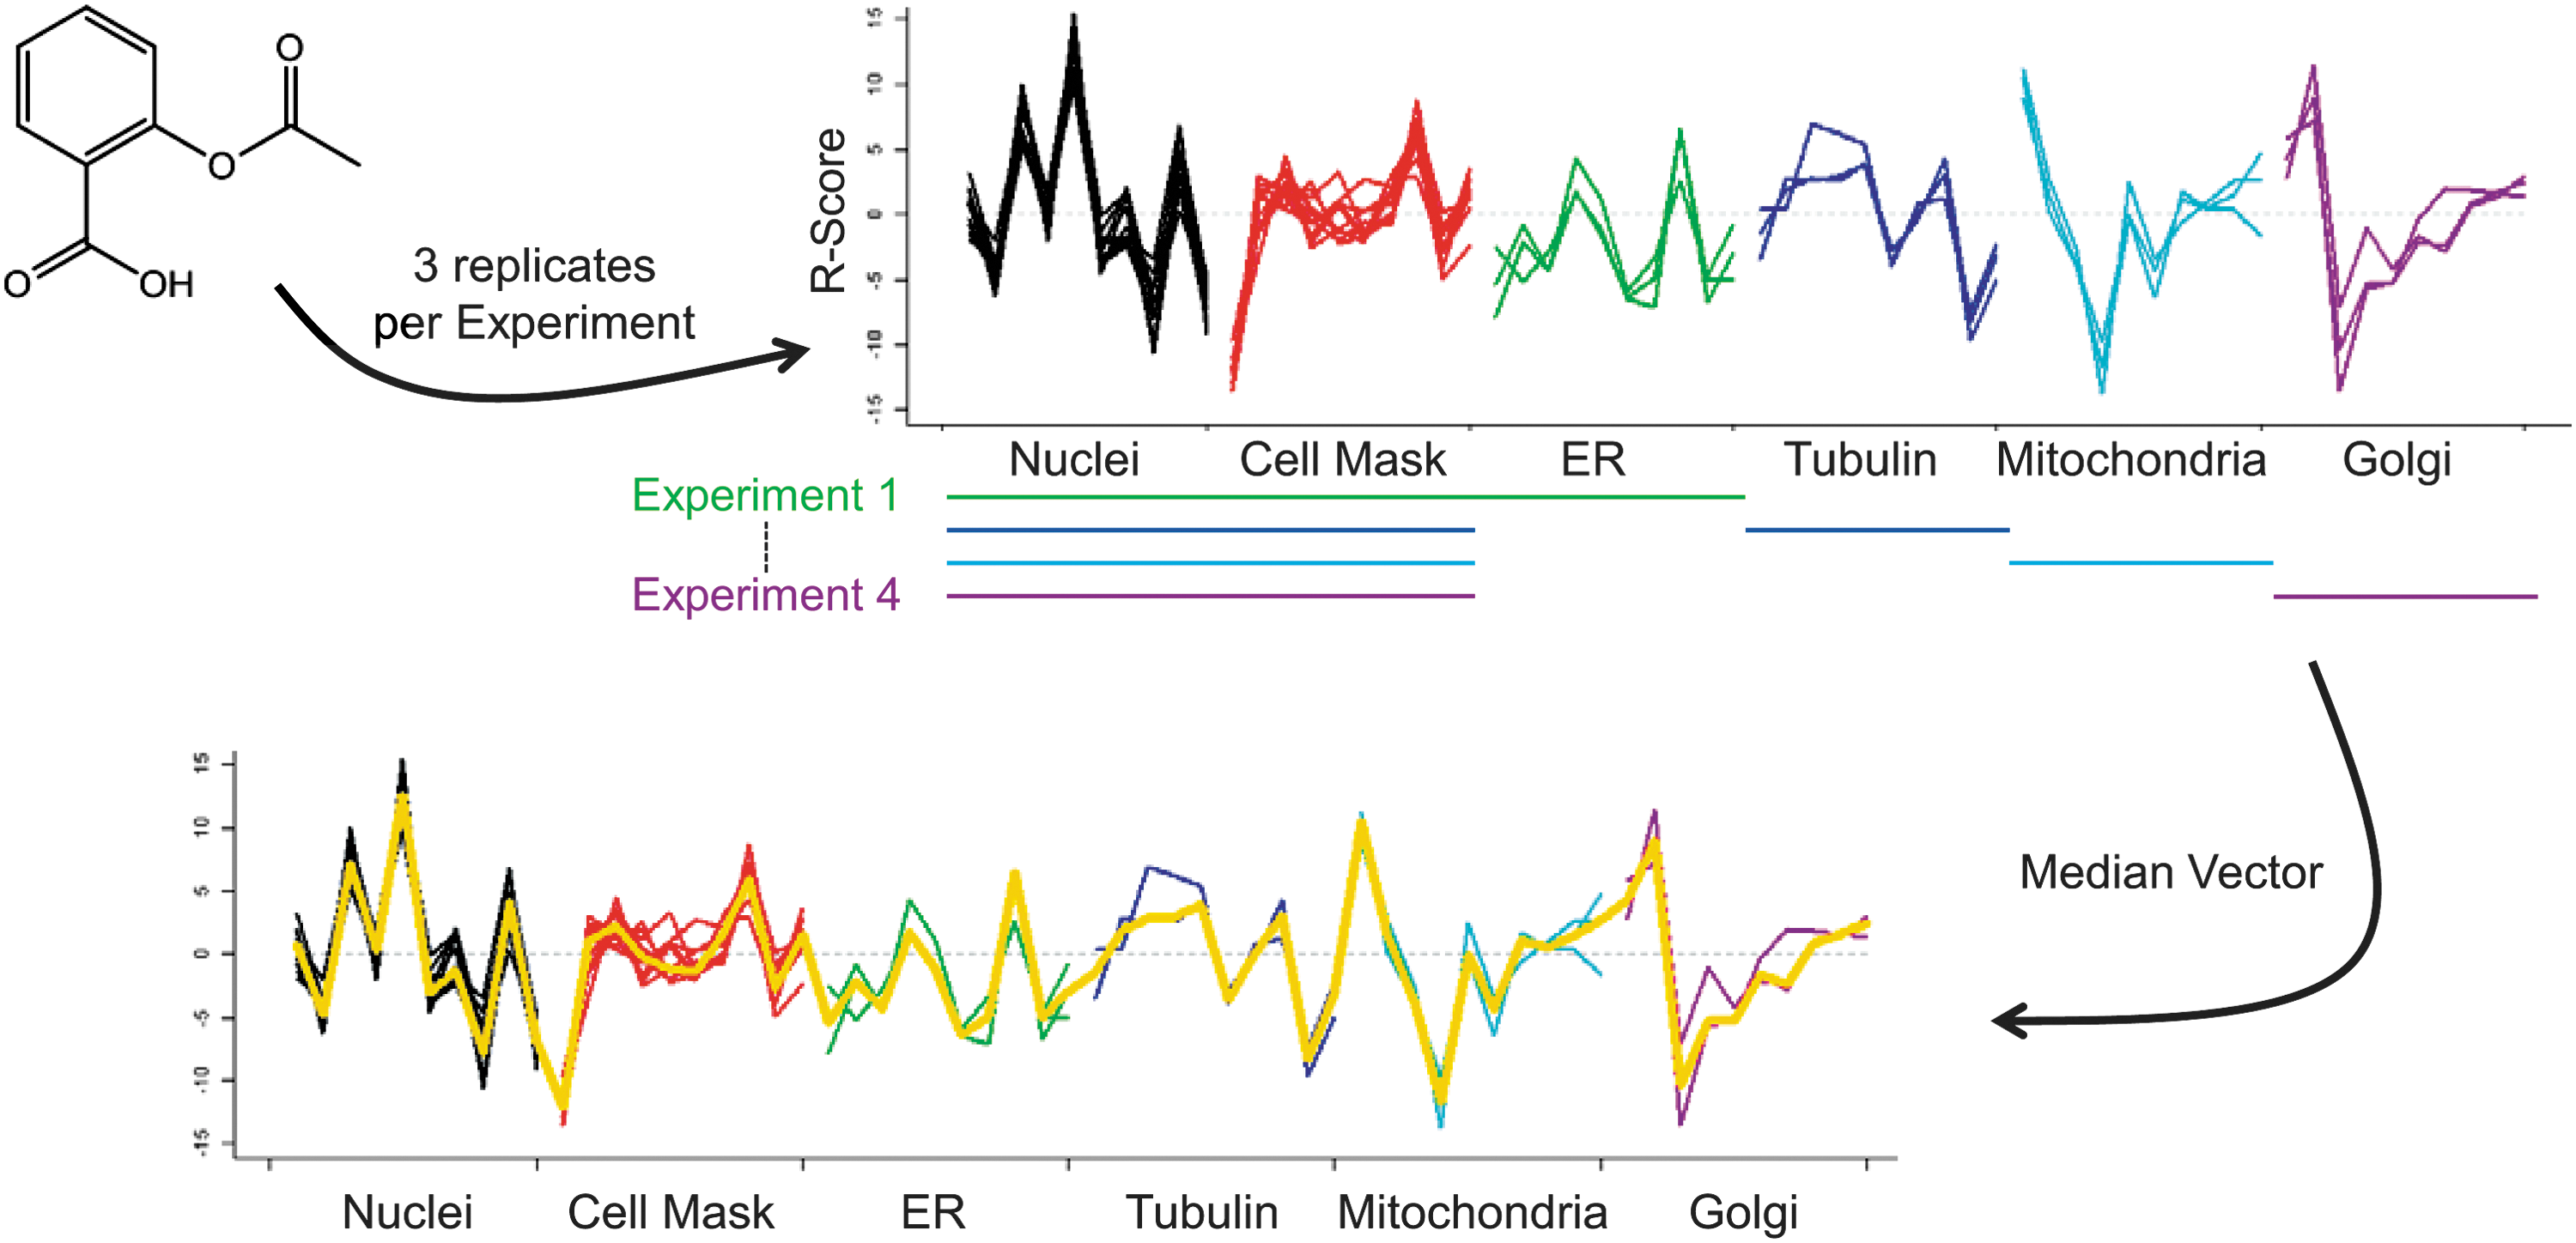
Creation of one high-content screening (HCS) fingerprint from four different experiments. Each compound is measured three times in each of the four experiments. Nuclei (black) and CellMask (red) readouts are measured in each experiment yielding 12 measurements per feature and compound. Readouts from the other four staining (ER=green, tubulin=blue, mitochondria=cyan, Golgi=purple) are measured only three times. The final HCS fingerprint is obtained by taking the median value of each measurement across all experiments (drawn in yellow).
MCL clustering and cluster layout
The HCS fingerprints of the compounds were clustered using the Markov Clustering Algorithm (MCL). 24 MCL is a graph-based clustering method that simulates stochastic flow in the input graph to identify graph regions with high edge density. The required similarity matrix was derived from the calculation of pairwise Spearman correlations between all HCS fingerprints. We decided to focus our cluster analysis on compounds having at least one highly similar neighbor (Spearman correlation >0.8) as we were interested in highly conserved phenotypes rather than singletons in this study. The inflation parameter I (1.7), the maximum number of neighbors per vertex (5), and the minimum edge weight to be considered (0.81) were determined by performing a grid search through the parameter space. The performance of each parameter combination was assessed by the average correlation within and between clusters (Supplementary Fig. S1). Compounds not having any neighbor in the input graph (singletons) were removed before clustering. As MCL sorts the resulting clusters according to size, but does not provide any relationship between clusters, we calculated a clustering layout based on distances between the cluster medoid HCS fingerprints (median values per readout across all compounds in a cluster) to obtain the layout in Figure 3. The cluster distance was calculated as d=−1 × (spearman correlation −1). The obtained cluster distance matrix was used to construct a minimum spanning tree (MST) with the minimum.spanning.tree function of the igraph package v.0.6.6 in R. The layout of this MST was generated in Cytoscape (v. 3.1.1) 25 using the Edge-Weighted Spring-Embedded Layout.

MCL clustering of cellular phenotypes with HCS fingerprints. We obtained 84 clusters from MCL clustering. Cluster medoids were used to calculate a minimum spanning tree. The final layout of the graph was generated with Cytoscape. Gene set enrichment analysis in each cluster led to the identification of links between phenotypes and various targets, target classes, cellular pathways, developmental processes, and diseases. A large fraction of the clustering is enriched for kinase inhibitors (gray shaded). Clusters with significant enrichment are represented by squares, nonsignificant enrichments that require additional validation are represented by circles. The size of the squares and circles corresponds to the number of compounds in the cluster.
Target annotation and gene sets used for gene set enrichment analysis
To link observed phenotypes within clusters to the potential mode of action of the compounds, each cluster was analyzed for enrichment of individual targets and gene sets. The required target annotations for compounds in the data set were taken from the public and commercially available data bases ChEMBL, 20 Drugbank, 26 GVK (GOSTAR), 27 Integrity, 28 and Metabase. 28 A compound was considered as being active on a target, if the reported activity was of type IC50, AC50, Ki, or Kd and the minimum reported value was below 10 μM. In total this yielded 13,896 unique compound-target associations, so that each compound was on average annotated with 5.1 different targets.
The gene sets for enrichment analyses were compiled from various sources: (1) Single target gene sets, where each gene present in the target annotations was defined to be a single-membered gene set; (2) gene sets derived from precompiled pathways, diseases, and biological processes taken from Biosystems, 29 Metabase, and Integrity; (3) Metabase pathway-derived gene sets such as the Metabase noodles; (4) Gene sets from Gene GO Ontologies. 30 For a complete list of gene set origins see Supplementary Table S3. In total, this yielded 249,777 nonunique gene sets for which at least one gene per gene set was targeted by at least one of the tested compounds. After elimination of all genes in the gene sets, for which no activity was reported in our target annotations, we finally obtained 55,389 unique gene sets.
Hypergeometric distribution testing
Each cluster was tested for enrichment of gene sets using the hypergeometric distribution. P values were calculated according to equation Eq. (1):
In Eq. (1) m is the total number of compounds being active on at least one of the targets in gene set g. n is the number of compounds that have at least one target annotation, but are not annotated to be active on targets in g. k is the total number of compounds in cluster c with at least one target annotation and x is the number of compounds in cluster c that are active on at least one target in gene set g.
To account for multiple testing and to control the familywise error rate, we used the Bonferroni correction to determine a significance threshold indicating true enrichment. Given the used public annotations for our compounds, we tested enrichment for 55,389 unique gene sets in 84 clusters. To obtain a familywise significance level of 0.05, our Bonferroni corrected significance threshold t was thus
Results
Analysis of Tool Compounds Affecting the Monitored Cellular Compartments
To assess if the chosen markers in our assay panel were capable of capturing compound effects in the six stained compartments, we investigated induced phenotypes of six tool compounds, each known to induce effects in at least one of the compartments. For the nuclei channel (DAPI), we selected topotecan that arrests cells in the S-phase of the cell cycle due to inhibition of topoisomerase I (TOP1). 31 Cells treated with this compound showed enlarged nuclei and an increased average cell size (Fig. 2A).
For testing effects on the cytoplasm marker, we selected chloroquine, which is known to induce vacuole formation in various cell lines. 32,33 We observed the same effect in our assay with U-2OS cells. Large vacuoles with diameters of up to 6 μm were clearly visible as dark holes in the red-colored cytoplasm (Fig. 2B).
For inspecting potential effects on the tubulin marker, we selected Oncodazole that inhibits the polymerization of tubulin. 34 The expected interference with tubulin polymerization was clearly visible as the tubulin signal was uniformly dispersed within treated cells (Fig. 2C).
Loss of this important component of the cytoskeleton also led to strong deformation of the cells. For evaluation of the mitochondrial marker, we selected uncoupling agent carbonyl cyanide p-trifluoromethoxyphenylhydrazone (FCCP). Treatment with FCCP led to reduced mitochondrial stain intensity in the cells and shrinking of the characteristic mitochondrial network (Fig. 2D).
The behavior of the ER marker was exemplarily assessed with the HSP90 inhibitor Tanespimycin, 35 which induces ER stress by interfering with the vesicular transport between the Golgi and the ER. 36 Tanespimycin treatment led to a more distributed ER staining within the cells and an overall higher staining intensity (Fig. 2E).
The behavior of the Golgi marker was assessed using Brefeldin A (BFA), a macrocyclic lactone that interferes with vesicle trafficking between ER and Golgi. 37 Treatment of U-2OS cells with BFA led to a delocalized Golgi marker signal that was spread throughout the entire cytoplasm (Fig. 2F).
This staining distribution within the cells was similar to the distribution of the ER in untreated cells. This is in agreement with observations made by other groups that treatment with BFA leads to disassembly of the Golgi apparatus and mixing with the ER. 37 Visual inspection of phenotypic responses induced by these six tool compounds show that phenotypic responses could be observed with the chosen markers for all measured cellular compartments.
Activity Overview
After this first sanity check of the assay we wanted to analyze if certain phenotypic responses can be associated with reported modes of actions of the tested compounds. One first step was to identify the number of compounds inducing a phenotype that is different from the neutral control phenotype. Using the HCS fingerprints, we, therefore, calculated the Mahalanobis distance for all neutral controls to the median of the neutral control population. By visual analysis of the respective distance distributions, we selected a distance threshold of five median absolute deviation units from the median for a treatment to be considered as active (Supplementary Fig. S2A).
In total, 1,413 of the tested compounds induced a phenotype having a Mahalanobis distance greater than this threshold, so that for 52% of the compounds a phenotypic response was observable. Calculation of Mahalanobis distances for readouts from individual cellular compartments showed that most of these active compounds affected the morphology of the cytoplasm (30%) and the nuclei (30%), while for the ER (22%), the Golgi (23%), the mitochondria (26%), and the cytoskeleton (16%) fewer compounds showed activity. There is a clear trend observable that compounds induce morphological changes not only in one but multiple compartments. Of the 1,413 active compounds, 363 (26%) affected all compartments at once, 679 (48%) showed activity on at least three compartments, while only 300 (21%) showed activity on a single compartment. With increasing number of measured cellular compartments, the number of active compounds was also increasing (Supplementary Fig. S2B) and most of the compounds being active in one channel were also active when measuring six channels (98%). Despite the observation that most compounds affect multiple compartments at once, correlations between readouts from different channels were low (Supplementary Fig. S2C) and the average absolute Spearman correlation between readouts of different channels is only 0.21 (Supplementary Fig. S2D). These findings indicate that all measured cellular compartments are important for discriminating between the different phenotypes induced by the tested compounds.
Clustering Links Phenotypes Between Different Targets and Cellular Processes
The main hypothesis behind using HCS data for mode of action prediction is that compounds with related mode of action induce similar cellular phenotypes. Thus we set out to identify cellular phenotypes in our assay panel that can be linked to the modulation of specific targets, target classes, or biological processes. We, therefore, clustered the data set with the Markov Clustering Algorithm (MCL) and did an enrichment analysis of gene sets in the clusters. By setting the minimum edge weight between phenotypes to 0.81 and removing singletons from the clustering (cf. Methods), we reduced the number of compounds included in the clustering to 472. For 12 of the 84 resulting clusters we identified significantly enriched gene sets with P values smaller than our Bonferroni-corrected threshold of 1.07×10⁻⁸. The P values for discussed clusters can be found in Table 1.
Most Enriched Gene Sets in Selected Clusters
a P values smaller than the significant threshold t are shaded dark blue.
b x, k, m, and n correspond to the parameters in Eq. (1) that is used to calculate the P values.
HDAC Inhibitors
Cluster 8 showed the most enriched gene sets among all clusters. The top-ranked gene sets hint at HDAC inhibition as potential mode of action and all 15 compounds in the cluster are annotated as HDAC inhibitors. In contrast to cells in neutral control wells, cells in this cluster had an elongated shape with elongated nuclei and an overall reduced cell number. The remaining cells lost adherence and were thus not in close contact to each other. This phenotype is exemplarily shown for the HDAC inhibitor Belinostat 38 (Fig. 4A). The HCS fingerprint shows that readouts from all channels were affected by the treatment with compounds in the cluster (Fig. 4B).
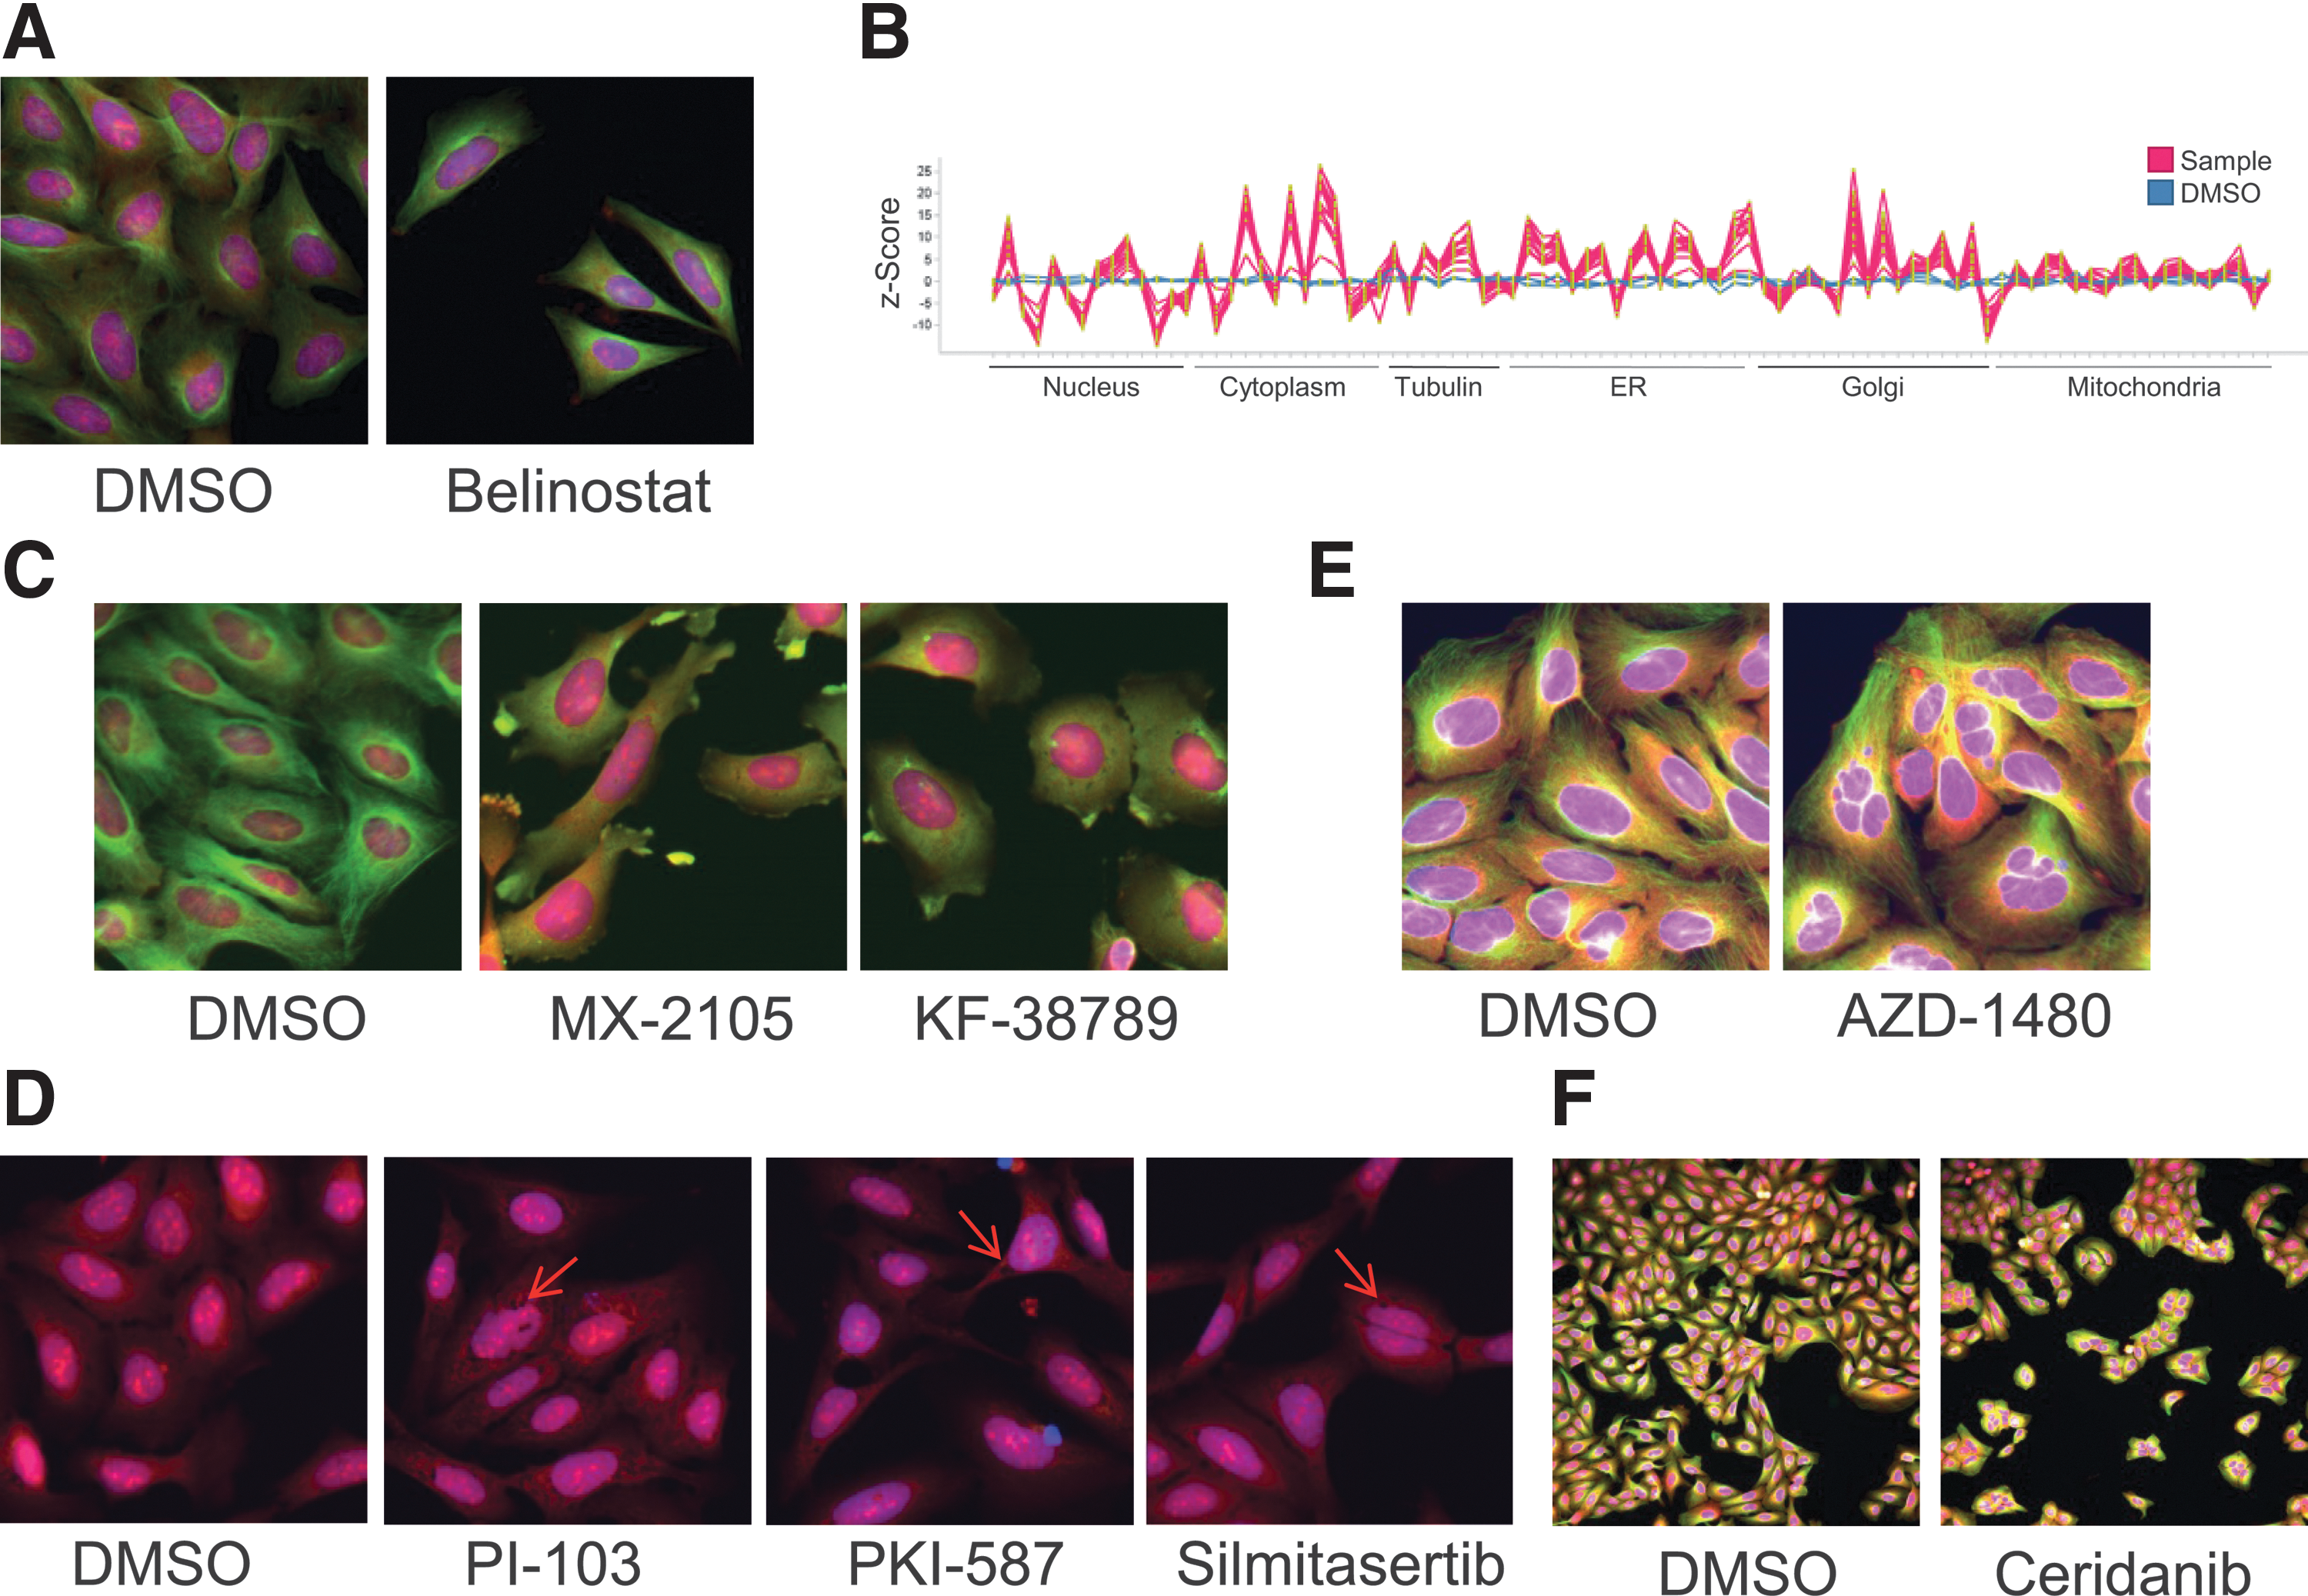
Clusters with characteristic phenotypes.
The neighboring cluster 17 also showed strong enrichment for HDAC inhibitors: 7 of the 8 compounds were annotated as inhibitors of HDAC 1 and the phenotype was similar to that in cluster 8. The HDAC inhibitor Vorinostat 39 was exemplarily chosen as a representative of this cluster (Supplementary Fig. S3A). As can been seen by the HCS fingerprints, phenotypic effects in clusters 8 and 17 are highly similar (Supplementary Fig. S3B).
Tubulin Inhibitors
Analysis of the top-ranked gene sets indicate that the compounds of cluster 7 interfere with the microtubule network of the cells. Five of the 14 compounds in this cluster were annotated as tubulin B inhibitors. Among these known tubulin inhibitors was Oncodazole. Visual inspection of the images revealed a highly conserved phenotype among compounds in the cluster, namely loss of tubulin filaments and strong deformation of the cells (Figs. 2C and 4C). As observable on the HCS fingerprint of compounds in this cluster, also the Golgi marker is strongly effected (Supplementary Fig. S4). The P-Selectin inhibitor KF38789 40 and the apoptosis inducer MX-2105 are two examples for compounds in this cluster having a highly similar phenotype to Oncodazole. MX-2105 has recently been described as tubulin inhibitor, 41 but the inhibitory activity of this compound has not been included in the used target annotation for P value calculation. To the best of our knowledge, KF38789 has not been described as a tubulin inhibitor.
PI3K/AKT/mTOR Pathway
In cluster 4 we found enriched gene sets being related to the PI3K/AKT/mTOR pathway. The most enriched gene set was MSP—14-3-3 theta—VEGF-A (2), a metabase noodle (cf. Methods) of genes such as mTOR, PDPK1, and PI3K. Eleven of the 19 compounds in the cluster were annotated as inhibitors of at least one of this noodle's gene products. Treatment with compounds in this cluster led to reduced cell numbers and HCS fingerprints showed strong peaking in texture readouts from all cellular compartments (Supplementary Fig. S4). The majority of the compounds such as the dual mTOR/PIK3 inhibitors PKI-58742 and PI-10343 induced strong vacuole formation in the cytoplasm (Fig. 4D), an effect that has been linked to autophagosome formation in glioma cells. 44 HCS fingerprints for all compounds in cluster 4 can be found in Supplementary Fig. S5.
The neighboring cluster, number 9 was also enriched for gene sets containing targets of the PI3K/AKT/mTOR pathway. The Integrity-derived gene set phosphoinositide-dependent kinase (PDK) 1 inhibitors had the lowest P value (1.41×10−09) among all gene sets in this cluster. Representative compounds of this cluster were the dual mTOR/PIK3 inhibitors PF-0469150245 and GSK-1059615, 46 which also induced strong vacuole formation in the cytoplasm (Supplementary Fig. S6).
Kinase Clusters
Cluster 6 had enriched gene sets associated with protein phosphorylation by kinases. The highest ranked gene set was the Protein Kinase, ATP binding site from InterPro. Sixteen of the 17 compounds were annotated as kinase inhibitors in the public domain. One compound in the cluster is a proprietary structure that has shown widespread activity on kinases (data not shown). The induced phenotypes in this cluster showed an increased nuclei area with nonroundish nuclei (Supplementary Fig. S7 for the HCS fingerprints). Some of the compounds such as the JAK2 inhibitor AZD-1480 by AstraZeneca induced polynucleation in the cells (Fig. 4F).
Cluster 3, similar to cluster 6, was the largest cluster for which highly enriched gene sets were identified. The InterPro-derived gene set Protein kinase-like domain had the lowest calculated P value. Twenty-two of the 28 compounds were annotated as inhibitors of kinases, with ABL1, ALK, and RET being the targets with most annotations (each 7). Testing of the remaining compounds in a kinase panel showed activity on different kinases for all six compounds (data not shown). One of these compounds was apilimod, an IL-12 and IL-23 production inhibitor that has been developed by Synta Pharmaceuticals for potential treatment of Crohn's disease and other autoimmune diseases. 47 This compound has recently been shown to bind phosphatidylinositol-3-phosphate 5-kinase, 48 an activity that has not been present in the public compound annotations when we used it for this study. All treatments in this cluster induced strong cell number reduction and showed an impact on texture readouts from all measured channels (Supplementary Fig. S8 for HCS fingerprints).
Additional kinase clusters are discussed in detail in the Supplementary Data.
HMGCR Cluster
One interesting aspect about using HCS fingerprints for creating target hypothesis for compounds is the fact that this biological readout is not calculated from the chemical structure of the compounds and can thus be seen as a complementary approach to, for example, using chemical fingerprints. This is exemplarily shown on cluster 22 that consisted of four different HMGCR inhibitors. Treatment with these statins, namely atorvastatin, simvastatin, pitavastatin,and a thiophene-based compound (ChEMBL1205806) 49 induced a similar phenotypic response in all six measured compartments. A very dominant effect was the decreased nuclear and cytoplasm area (Fig. 5). While the induced cellular phenotype and the associated HCS fingerprints are highly similar among these compounds (average Spearman correlation of 0.95), they share only little chemical similarity (average similarity of 0.25, as measured using the Tanimoto index on the molecular descriptor ECFP_4). Even though, atorvastin, pitavastatin, and ChEMBL1205806share an open lactone, which is also present in simvastatin as a closed form, the major parts of the scaffolds differ between the compounds.
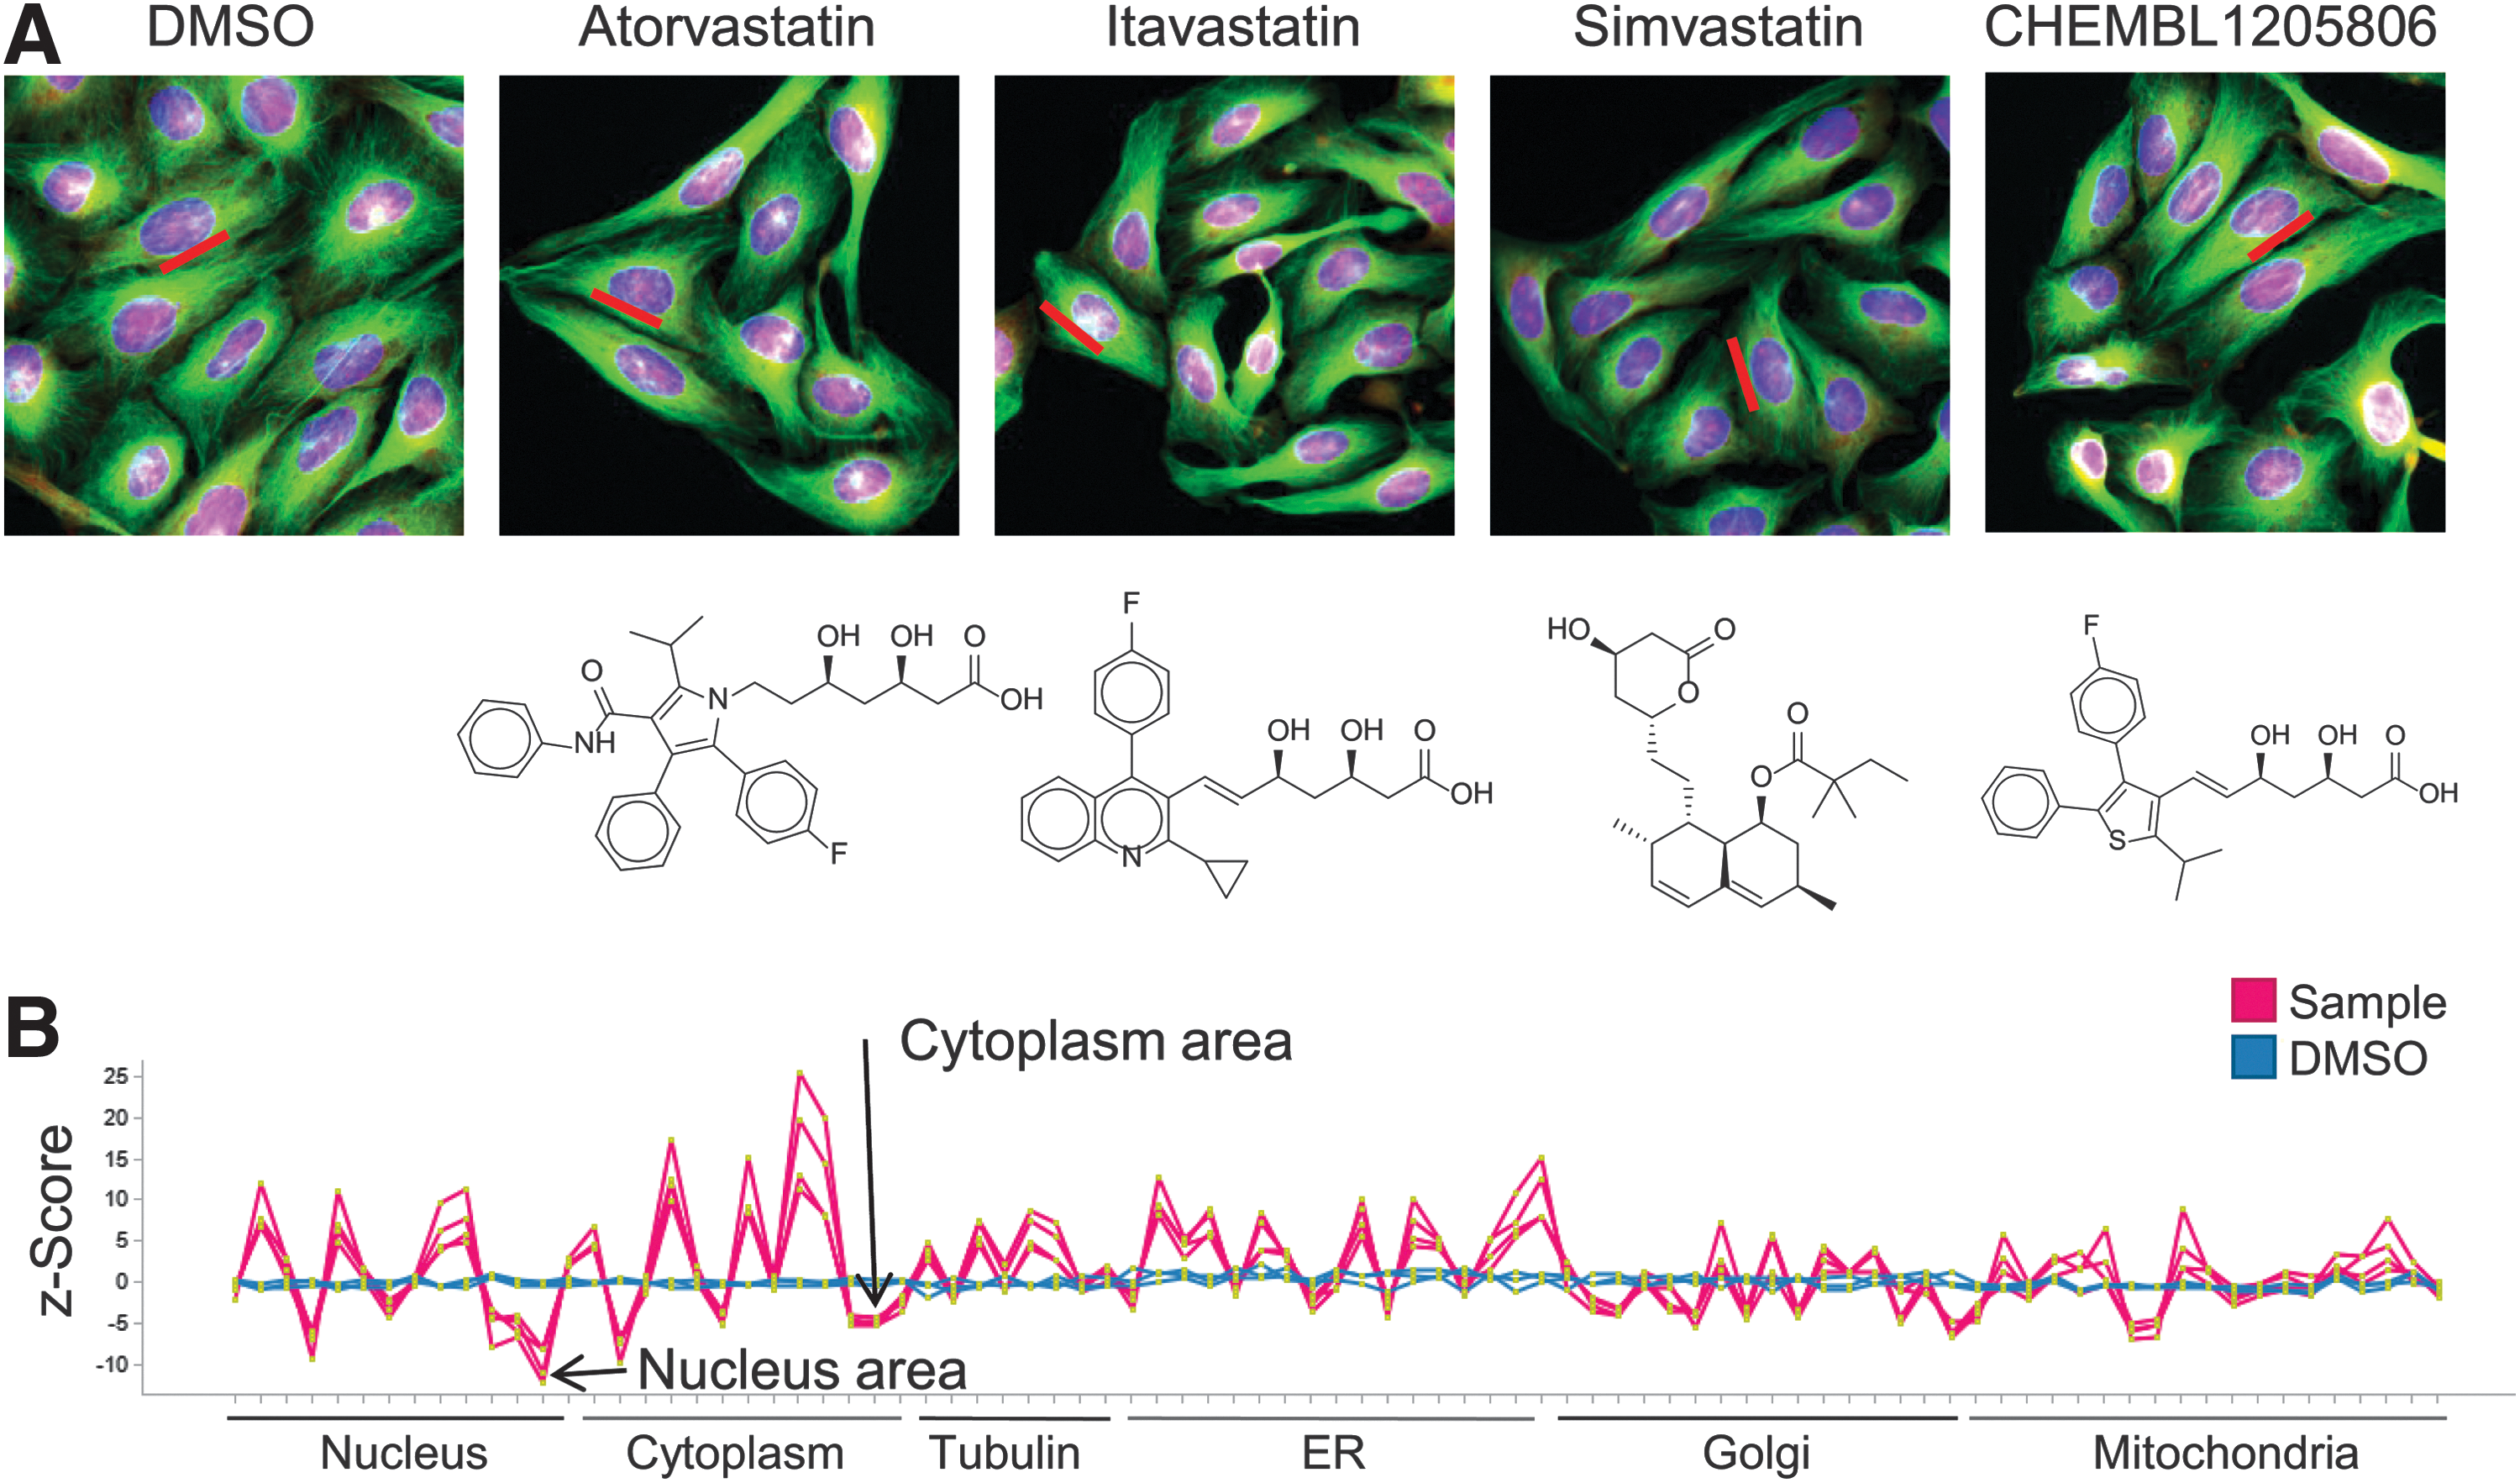
Similarity between phenotypic responses in cluster 22.
Prospective Testing of Compounds
To analyze if novel compound-target associations can be predicted based on the obtained clustering and the calculated gene set enrichments, we selected two nonproprietary compounds from cluster 4 that previously had not been associated with modulation of PI3K, mTOR, or PDPK1, the predominant genes in the enriched gene sets. The cluster was chosen because gene sets in this cluster had lowest P values among all clusters apart from cluster 8, which consisted of HDAC inhibitors only and was thus not suitable for a prediction.
The first tested compound was the JAK3 inhibitor 6-[6-(Diethylamino)pyridin-3-yl]-N-[4-(4-morpholinyl)phenyl]-9H-purin-2-amine, a purine derivative that was developed as an immunosuppressant by Palau Pharma (patent WO 2008090181). 50 When tested in-house, this compound showed an IC50 of 1,200 nM activity on PDPK1 (biochemical enzymatic in-house assay).
The second tested compound was Silmitasertib, an ATP-competitive protein kinase inhibitor of casein kinase II (CK2) (1 nM biochemical enzymatic assay,∼5,500 nM in cellular functional assays 51 ), which is involved in a diverse array of prosurvival cellular processes, including epidermal growth factor receptor signaling and PI3K/AKT/mTOR signaling, besides others which all play important roles in resistance to various chemotherapeutics. 52 With an IC50 of 390 nM on mTOR and an IC50 of 461 nM on PI3Ka (biochemical enzymatic in-house assay) this compound showed strong inhibitory activity on two of the predicted targets. The phenotype of this compound was in agreement with that of other dual mTOR/PI3K inhibitors in the cluster as it also induced strong vacuole formation (Fig. 4D). These two examples indicate that applying our assay panel allows for establishing phenotype-pathway links that can be used to generate valid target hypothesis.
Additional clusters that do not have significantly enriched gene sets are discussed in more detail in the Supplementary Data.
Discussion
Experimental Setup
We set out to establish a molecular profiling system that is capable of characterizing a broad range of compound-target relationships. Therefore, we decided to measure compound effects in multiple cellular compartments for capturing as many different phenotypic responses as possible. To avoid potential interference between readouts when measuring multiple markers within one experiment, we decided to split the measurements of six chosen cellular compartments into four experiments and reassemble the readouts in a subsequent step. Even though this required more separate measurements per compound it also improved the reliability of the generated HCS fingerprints as they were constructed not only from one, but also from up to twelve repeated measurements per compound.
We assessed the importance of the chosen compartment markers in two ways. We first examined the phenotypic responses upon treatment with six selected tool compounds, each known to affect one of the six compartments. For all tool compounds clear morphological changes were observable in the targeted compartments supporting the utility of the used markers. We then analyzed the activity of the complete set of tested compounds in the individual cellular compartments. This showed that the number of active compounds increased with the number of measured compartments, which indicates that the large number of used markers is beneficial for characterizing as many compounds as possible.
We also found that many compounds induced morphological changes in multiple cellular compartments at once. Since the correlation between readouts from different compartments was low, we assume measuring all six different channels yields a more detailed picture of the phenotypic responses than if a smaller number of channels were measured. This justifies the effort of measuring the compounds in multiple separate experiments. Additionally, the experimental effort of our profiling system is still well suited for higher throughput due to the used 1,536-well plate format.
Although we observed already a high activity rate of 52%, it would be beneficial to further increase the sensitivity to other modes of actions. One possibility for this is to expand the measurement to other cellular compartments such as liposomes, lysosomes, or peroxisomes. To a certain extent this strategy might help to characterize, that is, identify a phenotypic response for an even greater fraction of compounds. As there can be big differences in the response to compound treatments between different cell lines, another approach to increase the number of active compounds is the use of additional cell lines. The required selection of a representative cell line collection might be supported by incorporating information about genotypes and transcript levels obtained in large scale cell line profiling approaches such as the cancer cell line encyclopedia. 53 Also the incorporation of primary cell lines and iPS-derived cells might be valuable to monitor other disease relevant cell models.
Our approach might further benefit from testing the compounds at multiple concentrations. Some of the compounds may show different phenotypic responses at lower concentrations as less off-target effects are to be expected. This might especially be the case for compounds being active on large target classes such as kinases where selectivity for individual kinases cannot be assumed at the tested concentration. Therefore, lower testing concentrations might help to distinguish better for example, between certain kinase subfamilies. On the other hand, testing at multiple concentrations of course adds another layer of complexity to the experimental setup, thereby increasing the number of measured wells and also the computational effort for the data analysis. Another approach could be to test compounds at individual concentrations that are chosen according to the compound's affinity to their primary target. Nevertheless, such an approach ideally has to overcome the problem of dealing with unknown target expression levels in the monitored cell line and the unknown cell permeability of the compounds. Thus, finding the right concentration for each compound without additional biological testing might be difficult.
Observed Modes of Action
In 11 of the 84 clusters we found significantly enriched gene sets representing different aspects of cellular processes such as transcription control (HDAC), protein folding (HSP90), cytoskeleton homeostasis (TUB), proliferation (TOP1, Cyclins), cholesterol synthesis (HMGCR), and cell signaling (PI3K/mTOR/PDPK1 pathway). Additionally, we identified clusters enriched for various kinase inhibitors that are not selective at the tested concentrations. Nevertheless, phenotypic differences could be detected between some of the major kinase classes as we found for example, a tyrosine kinase cluster.
The presented results from enriched clusters rely heavily on compound activity annotation and gene set enrichment analysis, which both are challenging tasks. Compound activity annotation is complicated by false positive results and polypharmacology. In this study, we have applied the most confident data collection to our knowledge and included all annotations for any given compound. However, potentially further in-depth examination of compound activity annotation, such as considering counter assays, weighing annotations based on confidence scores, could enhance our results. Gene set enrichment analysis outcome can be influenced by the selection of gene sets and statistical methods. 54,55 Under these considerations, we also revisited clusters, where no statistically significant enrichment was found, especially for small clusters with only 2–3 members. Further inspection of such clusters suggested additional target classes such as aspartic proteases, G-coupled receptors (CaSR), nuclear receptors (RAR), or targets linked to epigenetic regulation (bromodomains).
Additionally, we found disease-related clusters with compounds that are used as treatments against breast cancer, colon cancer, leukemia, or psoriasis. Even though further investigations and testing of additional tool compounds might be necessary to increase the trust in these nonsignificant phenotype-target associations, the observed broad range of different biological processes shows the strong potential of our developed profiling system. A systematic optimization of the model by testing more compounds that might improve trust in low-confidence clusters, as typically done in active learning approaches, would therefore be a promising next step in our research. This includes also a systematic evaluation of target classes that could not be monitored with our approach. Evaluating target enrichment among nonactive compounds could identify these targets. Knowledge about these targets might also help to select additional markers or cell lines that could be used for profiling.
For example by using the statin cluster we further demonstrated the potential independence from HCS fingerprints of chemical structure. While many of the observed clusters have members with high phenotypic and high chemical similarity, a high phenotypic similarity is sufficient to identify potential similarities between the modes of action of compounds. This was also observable for the two compounds for which novel targets could be identified. For both compounds, Silmitasertib and the JAK3 inhibitor by Paula Pharma, no other member of cluster 4 shares the same chemical scaffold. Nevertheless, strong similarity of their phenotypes to other members of cluster 4 was evident. Consequently, we hypothesized inhibitory activity on PI3K, mTOR, or PDPK1 as these targets were the predominantly inhibited members of the enriched gene sets. We could confirm these target hypotheses in biochemical assays, where both compounds showed inhibitory activities at submicromolar concentration. Silmitasertib is a dual PI3K/mTOR inhibitor and the other compound is active on PDPK1. This demonstrates that HCS-based profiling can be used to successfully identify new compound-target associations. By profiling for example, hits from a phenotypic screen in a drug discovery project, such predictions can support approaches aiming at the identification of targets relevant for disease pathogenesis.
Conclusion
We developed a powerful HCS-based profiling panel that allows one to link treatment-induced cellular phenotypes to the compounds' modes of action. By measuring effects on a total of six different cellular compartments, it was possible to capture and classify phenotypic responses for 52% of the tested compounds, thus making the approach broadly applicable. Clustering of the induced phenotypic responses with MCL led to the identification of various different phenotypes that could be linked to the inhibition of individual targets, the modulation of cellular pathways, or gene sets associated with different diseases. We showed that detecting similarities among treatments is not dependent on high chemical similarity and is thus a valuable alternative to approaches solely based on chemical structures. Moreover, we demonstrated the predictive power of this approach by successful testing of two novel compound target associations.
Footnotes
Acknowledgments
The authors thank the Education Office of the Novartis Institutes for BioMedical Research for granting the postdoctoral fellowship of Felix Reisen. The authors thank Christian N. Parker (Novartis Institutes for BioMedical Research, Basel) and Robert F. Murphy (Carnegie Mellon University, Pittsburgh) for many fruitful discussions.
Disclosure Statement
The authors declare no conflicts of interest.