




Abstract
Correct subcellular localization of proteins is a requirement for appropriate function. This is especially true in epithelial cells, which rely on the precise localization of a diverse array of epithelial polarity and cellular adhesion proteins. Loss of cell polarity and adhesion is a hallmark of cancer, and mislocalization of core polarity proteins, such as Scribble, is observed in a range of human epithelial tumors and is prognostic of poor survival. Despite this, little is known about how Scribble membrane localization is regulated. Here, we describe the development and application of a phenotypic high-content screening assay that is designed to specifically quantify membrane levels of Scribble to identify regulators of its membrane localization. A screening platform that is capable of resolving individual cells and quantifying membrane protein localization in confluent epithelial monolayers was developed by using the cytoplasm-to-cell-membrane bioapplication integrated with the Cellomics ArrayScan high-content imaging platform. Application of this method to a boutique human epithelial polarity and signaling small interfering RNA (siRNA) library resulted in highly robust coefficient-of-variance and Z′ factor values. As proof of concept, we present two candidate genes whose depletion specifically reduces Scribble protein levels at the membrane. Data mining revealed that these proteins interact with components of the Scribble polarity complex, providing support for the utility of the screening approach. This method is broadly applicable to genome-wide and large-scale compound screening of membrane-bound proteins, and when coupled with pathway analysis the dataset becomes even more valuable and can provide predictive mechanistic insight.
Introduction
Many proteins in polarized epithelial cells rely on localization to function appropriately, and protein mislocalization has been increasingly associated with diseases such as cancer. Epithelial polarity arises from spatiotemporal regulation of a diverse array of epithelial polarity proteins, their spatial cues, including cell–cell and cell–ECM adhesion, and conserved cellular machineries that serve as their functional effectors, including the actin and myosin cytoskeleton and vesicle transport system. 1 –3 A major functional class of epithelial polarity proteins is the apico-basal polarity complexes. These include the apically localized PAR (PAR3, PAR6, aPKC) and Crumbs (CRB, PATJ, MPDZ) complexes, and the basolaterally localized Scribble (SCRIB, DLG, lethal giant larvae [LGL]) complex. These polarity complexes interact both genetically and physically to specify and control the apical and basal membrane domains of epithelial cells in close association with the cadherin–catenin cell–cell adhesion complexes. 1 –3
Many cell polarity and adhesion proteins require localization to the cell membrane to function appropriately; however, mechanisms that control this localization remain largely unknown. Indeed, loss of cell polarity and adhesion represents a hallmark of cancer; mislocalization of core apicobasal polarity proteins, such as Scribble, is frequently observed in a range of epithelial tumors, and its mislocalization has prognostic value in breast, prostate, and colon cancer. 4 –7 Notably, reconstitution of appropriate Scribble expression and localization can suppress oncogenic transformation that is mediated by potent oncogenes such as RASV12, 8 and membrane localization of Scribble is required for its full oncogene-suppressive function. 4,9
Here, we describe the development of a phenotypic high-content screening assay that is designed to specifically quantify localization of proteins at the cell membrane in confluent epithelial monolayers, with the specific aim of identifying regulators of Scribble membrane localization. To successfully develop and apply bio-image analysis assays to high-throughput screening, the image analysis component must be considered an experimental protocol in its own right, and, as such, requires extensive characterization and optimization. Accurate cell segmentation in confluent monolayers represents a computational challenge; therefore, we made use of the Cellomics Arrayscan Cytoplasm for Membrane BioApplication. This algorithm first identifies individual cells based on nuclei stained with 4′,6-diamidino-2-phenylindole (DAPI), followed by generation of a membrane mask based on immunostaining of a suitable membrane marker. By quantifying both the membrane and cytoplasmic levels of the target, this algorithm allows additional spatial parameters to be generated, such as the membrane-to-cytoplasm ratio (membrane/cytoplasm ratio), providing a measure of membrane protein mislocalization. Application of this method to a boutique human epithelial polarity and signaling small interfering RNA (siRNA) library resulted in highly robust Z′ factor values, suggesting that this method is suited to large-scale compound or whole-genome siRNA screening.
Materials and Methods
Cell Culture
Human MCF10A mammary epithelial cells were maintained in Dulbecco's modified Eagle's medium:F12 that was supplemented with 5% donor horse serum (Gibco; Life Technologies,), 10 mg/mL insulin (Novo Pharmaceuticals), 0.5 mg/mL hydrocortisone (Sigma Aldrich), 20 ng/mL EGF (Cytolab Ltd.), 100 ng/mL cholera toxin (Sigma Aldrich), penicillin (100 U/mL), and streptomycin (100 U/mL) (MCF10A growth medium). All cultures were maintained at 37°C in 5% CO2.
siRNA Library
A custom-designed library of siGENOME SMARTpool reagents was obtained from Dharmacon RNAi Technologies (ThermoFisher Scientific). The SMARTpool reagents contain four individual siRNA oligos targeted to distinct regions of a single gene. The RNAi library targeted 700 genes, and it was designed to include the known compendium of cell polarity genes and the vast majority of the associated interactome, including central signaling and cytoskeletal components and regulators (Supplementary Table S1; Supplementary Data are available online at
High-Content Immunofluorescence Automated Microscopy
MCF10A cells were assayed in black-walled 384-well imaging plates (Costar), and all liquid-handling steps were performed by using a robotic BioTek 406 liquid-handling platform (25 μL/well, 5 μL cassette, high flow rate; aspirator coordinates: Z = 35) (BioTek). All fixation and immunostaining solutions were filtered (0.45 μm filter) before use, and plates were briefly centrifuged (500 g for 30 s) before all incubations. Cells were fixed with 4% paraformaldehyde (PFA; Electron Microscopy Sciences) for 10 min and were permeabilized with 0.3% Triton X-100 for 10 min. Cells were blocked by using 3% bovine serum albumin (BSA) in phosphate-buffered saline (PBS; Sigma-Aldrich) for 1 h at room temperature. Primary antibodies targeting Scribble (SantaCruz, #SC-11049; 1:200) and CTNNB1 (Becton Dickinson, #610153; 1:1,000) were diluted in 3% BSA in PBS and incubated overnight at 4°C (20 μL/well). Plates were washed twice in 0.01% Tween-20 in PBS (PBST) and once in PBS by using the BioTek 406 wash-aspirator manifold. The robotic protocol consisted of two wash cycles “Washer-aspirate, aspirator coordinates: Z = 35, travel rate 1CW, 200 ms delay; washer-dispense 80 μL PBST/well, flow rate = 3; washer-aspirate, aspirator coordinates: Z = 35, travel rate 1CW, 200 ms delay.” The third cycle was identical; however, PBS was loaded into the washer-dispense manifold. Plates were then incubated with the appropriate AlexaFluor® secondary antibodies (anti-Goat 488 and anti-mouse 594; 1:1,000; 20 μL/well) (Invitrogen, Life Technologies) for 1 h at room temperature. The plates were washed as described earlier, stained with DAPI DNA dye (10 μg/mL; 20 μL/well for 20 min) (Invitrogen, Life Technologies), and mounted with 80 μL PBS. Plates were thermosealed with foil plate seals and stored at 4°C before imaging on a Cellomics ArrayScan VTi automated microscope (Cellomics, Life Technologies) by using a 20× air objective.
High-Content Immunofluorescence Analysis of Membrane Proteins in Confluent Epithelial Cell Populations
Cells were identified based on detection and segmentation of the nucleus until a minimum of 3,000 individual cells was recorded per well. Individual nuclei were segmented based on intensity thresholds by using the DAPI signal acquired in imaging channel 1 (Fig. 1). Additional size and shape parameters were also utilized to improve the accuracy of the nuclear mask (defined as “CIRC”) and to exclude any potential imaging artifacts. Routine inspection of the nuclear mask (blue) revealed successful segmentation in >98% of cells, and in all cases, cells located on the edge of imaging fields (orange) were excluded from analysis to prevent incorporation of incomplete cellular events. Field limitations were set to 35 for each well to account for wells where a strong death phenotype was observed (Supplementary Table S2). Cell number and field limitations can be adjusted relative to screening scale to reduce scan time and to suit individual assay needs. Effects of each siRNA on viability and proliferation were monitored by using the cells/field parameter.
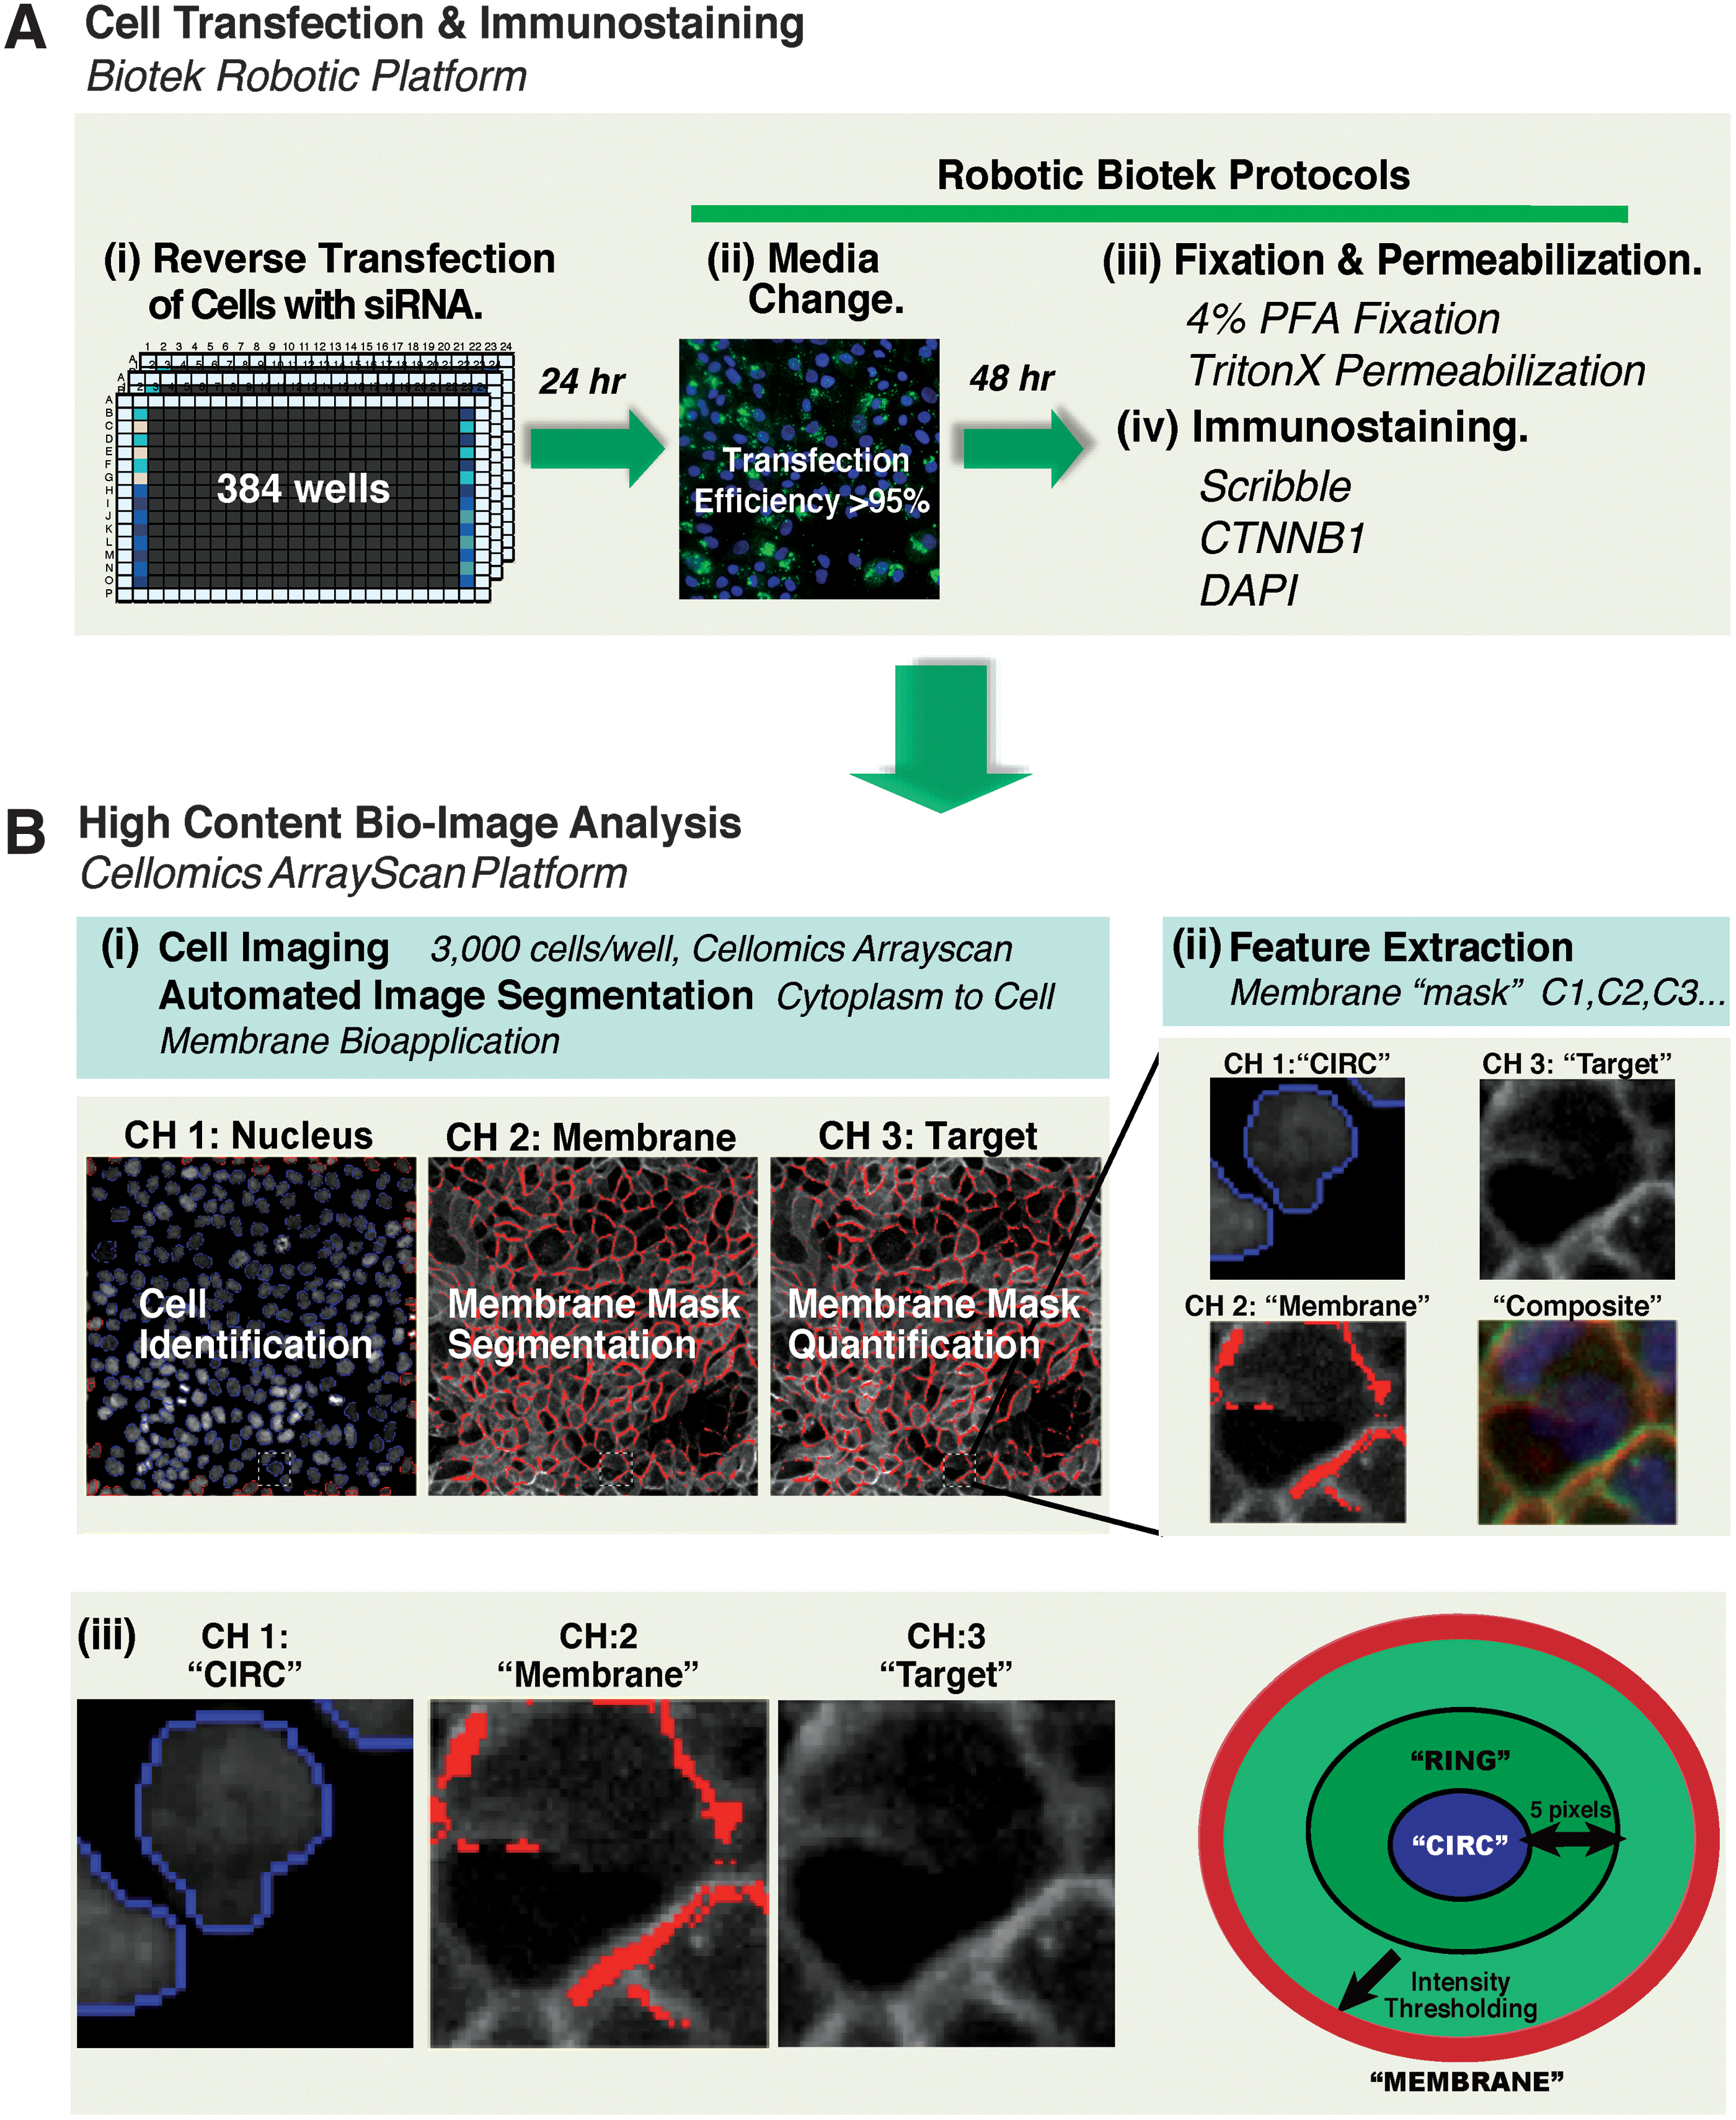
A phenotypic high-content imaging assay for regulators of membrane protein localization.
To monitor membrane protein localization in MCF10A cells, the Cellomics Cytoplasm to Cell Membrane BioApplication was utilized (Supplementary Table S2). This algorithm allowed the extraction of numerical features such as the intensity of a given protein within the cytoplasm or cell membrane. The cytoplasmic mask (denoted as the RING) was calculated as an annulus of 5 pixels width radial to the nuclear mask generated from DAPI staining in channel 1 (denoted as the CIRC) (Fig. 1B). The Cytoplasm to Cell Membrane BioApplication utilizes a membrane marker imaged in channel 2 to accurately identify and segment the cell membrane. The membrane mask is generated by intensity thresholding and additional size, shape, and CIRC and RING exclusion parameters were applied to further improve the accuracy of membrane segmentation (Fig. 1). The cytoplasm and membrane masks were then applied to channel 3 to quantify the mean pixel intensity of the target protein in the cytoplasm and membrane masks of each cell. The mean pixel intensities of the membrane and cytoplasm masks were then used to calculate the membrane-to-cytoplasm ratio (membrane/cytoplasm ratio), which is used to quantify mislocalization of the membrane protein to the cytoplasm. The mean membrane intensity and the mean membrane/cytoplasm ratio were calculated from single-cell data and reported for each well.
High-Content Immunofluorescence Screening
siRNA transfection
For high-content immunofluorescence (HCIF) screening, MCF10A cells were robotically reverse transfected with the boutique polarity siRNA library by using a Caliper Sciclone ALH3000 liquid-handling robot (Perkin Elmer) in black-walled 384-well imaging plates (Corning). Batch-consistent cryo-preserved MCF10A cells at passage 8 were utilized for all replicate screens. Before screening, 30 μL of 1 μM control siRNA SMARTpools was prepared and manually added to the designated control wells within columns 2 and 23 of each library plate, and all screening assay plates were labeled with a unique barcode. For each library plate, a 1 × 384-well daughter plate (“Screen plate A”) was prepared with 22 μL DharmaFECT 3 Lipid/OPTI-MEM mix per well by using a robotic BioTek 406 liquid handler platform (BioTek 406). The lipid was prepared to the equivalent of 0.04 μL lipid per well. The Caliper Sciclone ALH3000 robot then transferred 3 μL of 1 μM siRNA from each library plate to screen plate A. Lipid/siRNA/OPTI-MEM was then mixed by the Caliper ALH3000, and 12.5 μL was transferred to screen plate B and allowed to complex at room temperature for 20 min. MCF10A cells (1,500 cells/well) were then dispensed by using the BioTek liquid-handling robot (25 μL/well, 5 μL cassette, high flow rate), such that the final siRNA concentration was 40 nM per well. Plates were then briefly centrifuged at 500 g for 30 s, and they were left at room temperature for 10 min before transferring them into a Liconic STX200 automated microplate adapted humidified incubator (37°C with 5% CO2) (LiCONiC Instruments). The screen was performed as two independent biological replicates (screens performed on different days, with different batches of cells), and each library plate was assayed in duplicate for each screen (technical replicates), such that four independent datasets for each library plate were generated.
HCIF and automated microscopy
For the screen, transfection media were replaced with 50 μL of normal MCF10A growth medium 24 h post-transfection, and cells were cultured in normal conditions before fixation with 4% PFA at 72 h post-transfection (BioTek 406, 5 μL cassette, medium flow rate; aspirator coordinates: Z = 35). The screening assay plates were permeabilized, immunostained, and prepared for automated microscopy by using the BioTek platform as previously described (see earlier). The antibodies utilized for the screen were as follows: primary antibodies: Scribble (C10) (goat) (SantaCruz #SC-11049), 1:200 in 3% BSA; β-catenin (mouse) (Becton Dickinson #610153), 1:1,000 in 3% BSA; secondary antibodies: AlexaFluor Goat 488 and mouse 563 (Invitrogen, Life Technologies), 1:1,000 in 3% BSA. Automated image acquisition was performed on the Cellomics ArrayScan VTi as previously described (see earlier); to quantify Scribble and β-catenin membrane levels and localization, the Cellomics Cytoplasm to Cell Membrane BioApplication was applied as previously described (see earlier). Note, to quantify Scribble at the membrane, β-catenin was imaged in channel 2 and utilized as the “membrane marker,” and Scribble was imaged in channel 3 and analyzed as the “target.” The assay parameters used to generate the final output of the screen were mean membrane intensity and mean membrane/cytoplasm ratio (Table 1 and Supplementary Table S2). Viability was also assessed by using the cells/field parameter to control for cell number. The controls used in the screen were siSCRIB as a positive control for loss of Scribble protein levels, and siCTNNB1 for loss of β-catenin protein levels. To control for transfection efficiency throughout the screen, we used siCTNNA1 due to a strong and highly reproducible change in cell morphology that was evident 24 h post-transfection.
Screen data normalization and statistical analysis
Normalization of the data was performed to allow comparison and combination of data from different plates and screen replicates. Given the targeted nature of the pilot screen, data were normalized to the median value of on-plate non-targeting controls (siGAPDH, n = 8 and siGFP, n = 8). All non-targeting control values were inspected for potential outliers. Outliers were defined as samples that generated values that were three standard deviations above or below the mean of all on-plate non-targeting and mock transfection controls, and they were excluded from the analysis. After normalization of the screening data, additional well-level quality control metrics (Z′ value, non-targeting controls versus positive assay controls; coefficient of variance, %CV) were applied to ensure screen quality.
Hits were identified by using the mean ± K standard deviations approach, and a three standard deviation threshold was applied. Fold change values below the statistical threshold, extreme statistical outliers, or low-quality image datasets contributed to a given siRNA being designated as “not applicable” (N/A) within a given replicate screen dataset, and they did not contribute to the final average fold change score for that gene. Genes satisfying these criteria in three out of four independent datasets were designated as hits.
Results and Discussion
A Phenotypic High-Content Imaging Assay to Identify Regulators of Scribble Membrane Levels and Localization
To identify regulators of Scribble membrane localization, we developed a bio-image analysis protocol that was suitable for high-content RNAi screening of confluent epithelial cells (Table 1). The assay was designed such that 24 h post-transfection with Dharmacon SMARTpool siRNA reagents (transfection efficiency ≥95%) and wild-type MCF10A cell populations were cultured for 48 h in normal growth conditions until non-targeting control populations reached confluence (Fig. 1A). Cells were then fixed and immunostained for membrane proteins of interest and nuclear DNA content, by using an automated liquid-handling platform (see Materials and Methods section). The underlying design principle of the high-content bio-imaging assay is shown in Figure 1B. Accurate segmentation of individual cells in confluent monolayers represents a computational challenge; therefore, we made use of the Cellomics Cytoplasm to Cell Membrane BioApplication. The algorithm first identifies individual cells based on DAPI-stained nuclei (denoted as the CIRC) in channel 1, and it then generates a membrane mask based on a suitable membrane marker protein imaged in channel 2 (Fig. 1B). A cytoplasmic mask (denoted as the RING) is then calculated as an annulus of 5 pixels width radial to the nuclear mask (Fig. 1Biii). The membrane and cytoplasm masks are then applied to the target protein imaged in channel 3, and the mean membrane intensity is calculated. The algorithm also quantifies membrane protein mislocalization by calculating the membrane-to-cytoplasm ratio (membrane/cytoplasm ratio). A low ratio indicates mislocalization of membrane proteins to the cytoplasm, and a high ratio indicates increased localization to the membrane. Because Scribble specifically localizes to the lateral cell membrane in association with cell–cell adhesion, 10,11 we reasoned that an adherens junction protein would be a suitable membrane marker for Scribble. A comparison of antibodies raised against E-cadherin (CDH1) and β-catenin (CTNNB1) revealed that the β-catenin signal was comparable to Scribble, and β-catenin immunostaining was a more reliable and accurate marker of the lateral membrane in a variety of conditions in MCF10A cells (data not shown). Based on these features, β-catenin was chosen to generate the membrane mask. An obvious caveat of this approach is loss of the β-catenin membrane signal on treatment with test siRNAs during the screen. However, because loss of the membrane mask can be identified by the algorithm, this does not generate false negatives and can easily be resolved on review of the associated images.
High-Content Screening Assay Protocol
1a. siRNA screening was performed in technical and biological duplicates by using 384-well, black-walled, clear-bottom plates (Corning 3712). The lipid/OPTIMEM mixture was dispensed by using the Biotek platform in a tissue culture hood (see Materials and Methods section for details).
1b. Addition of siRNA was performed by using a Caliper liquid-handling robot. Controls were pre-plated into a master transfection control plate and aliquoted into each screening assay plate. Controls were plated at a 40 nM final concentration.
BSA, bovine serum albumin; DAPI, 4′,6-diamidino-2-phenylindole; PBS, phosphate-buffered saline; PBST, Tween-20 in PBS; siRNA, small interfering RNA.
We next tested the sensitivity of the bio-image analysis protocol for detection of Scribble membrane levels. Robust knockdown of Scribble protein was observed in MCF10A cells that were transfected with SCRIB siRNA (Fig. 2A) and importantly, this was accurately quantified by using our bio-image analysis protocol (Fig. 2B). Assessment of the assay based on quantification of the membrane signal across multiple biological repeats demonstrated strong reproducibility as evidenced by low %CV and high Z′ factors (siGAPDH membrane, %CV = 5.6; siSCRIB membrane, %CV = 12.7; Z′ = 0.85) (Fig. 2B), indicating that the assay is suitable for high-throughput screening. Although at the time we did not have a positive control for Scribble membrane localization, a decrease in the membrane/cytoplasm ratio was observed (Fig. 2C), consistent with strongly reduced membrane levels and ubiquitous cytoplasmic Scribble staining in the cells. Assessment of the membrane/cytoplasm ratio across multiple biological repeats again demonstrated strong reproducibility (siGAPDH membrane/cytoplasm ratio, %CV = 5.0; siSCRIB membrane/cytoplasm ratio, %CV = 16.16, Z′ = 0.74) and suitability for high-throughput screening (Fig. 2C). These data confirm that the bio-image analysis protocol is highly sensitive, and they demonstrate that this method can accurately quantify changes in Scribble membrane levels and localization.
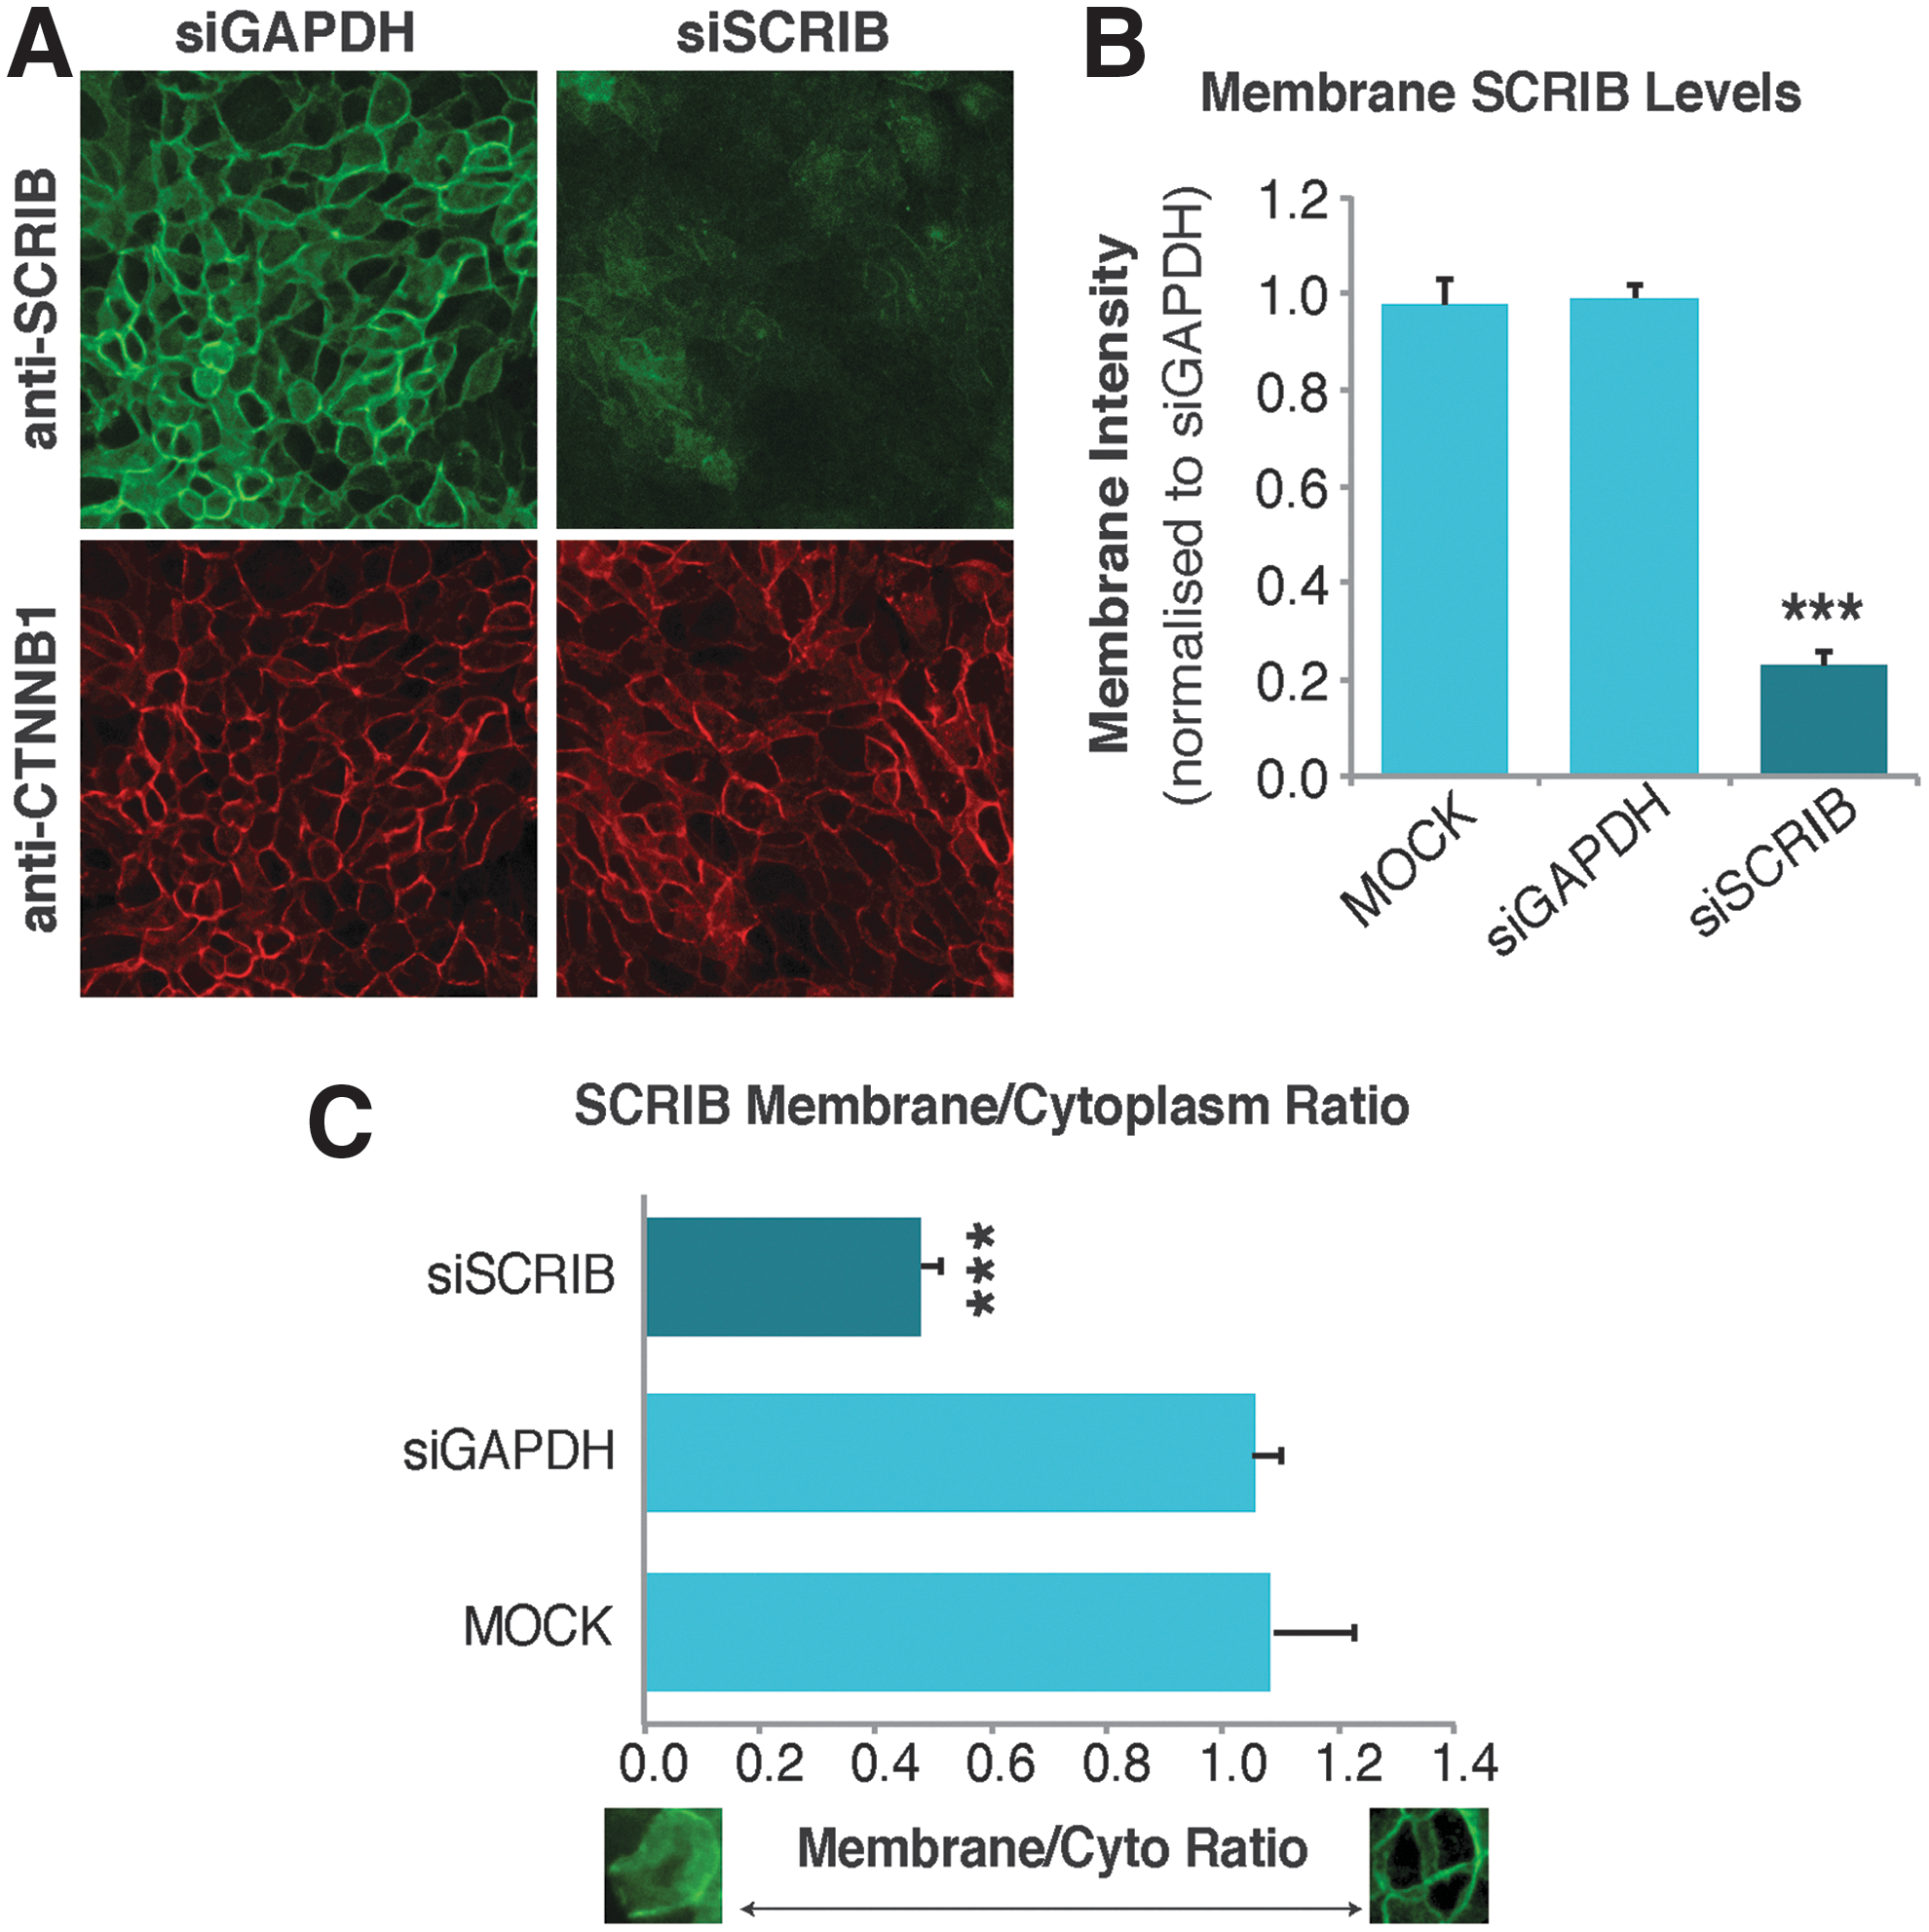
Quantitation of Scribble membrane levels and localization by using the membrane-to-cytoplasm high-content bio-imaging assay.
A Phenotypic High-Content Screen to Identify Regulators of Scribble Membrane Levels and Localization
For the screen, we obtained a custom-designed boutique polarity siGenome SMARTpool library from Dharmacon RNAi Technologies. This library targeted 700 genes and included the known compendium of cell polarity genes and the vast majority of the associated interactome, including central cell signaling and cytoskeletal components and regulators (Supplementary Table S1). siRNA SMARTpools targeting GFP and GAPDH were used as non-targeting controls, and SMARTpools targeting SCRIB and CTNNB1 were used as positive controls for the screening assay (Fig. 3A and Supplementary Fig. S1). To control for transfection efficiency throughout the screen, we made use of SMARTpools targeting CTNNA1 due to a prominent morphological phenotype that was induced 24 h post-transfection (Supplementary Fig. S2). The positive control wells (siSCRIB, siCTNNB1, siCTNNA1) were arranged into an alternating configuration with non-targeting control wells (siGAPDH and siGFP) such that an “image bar-code” was produced (Fig. 3A, B). Indeed, when composite images are viewed, an overlay of Scribble and β-catenin generates a yellow signal; a reduction in Scribble levels generates a red signal; and a reduction in β-catenin generates a green signal. This effectively generates a useful “traffic light” system to assist in interpretation of the bio-image dataset (Fig. 3B and Supplementary Fig. S1). Columns 1 and 24, and rows A and P were used for mock transfection controls (Fig. 3A). MCF10A cells were robotically reverse transfected with the boutique polarity siRNA library in biological duplicate, with technical replicates performed for each screen (Fig. 3B). Transfection media were replaced 24 h post-transfection, and siCTNNA1 transfection control wells were assessed to ensure optimal transfection efficiency for each plate. Cells were then fixed and immunostained 72 h post-transfection, when non-targeting control wells (siGAPDH and siGFP) reached confluency (see Materials and Methods section for details). The screening assay plates were then robotically loaded into the Cellomics ArrayScan VTi automated microscope for imaging and analysis by using the Cytoplasm to Cell Membrane BioApplication (Supplementary Table S2). The parameters used to define the outcome of the high-content screen were mean membrane intensity (Scribble membrane levels), mean membrane/cytoplasm ratio (Scribble membrane localization), and mean cells/field (cell number).
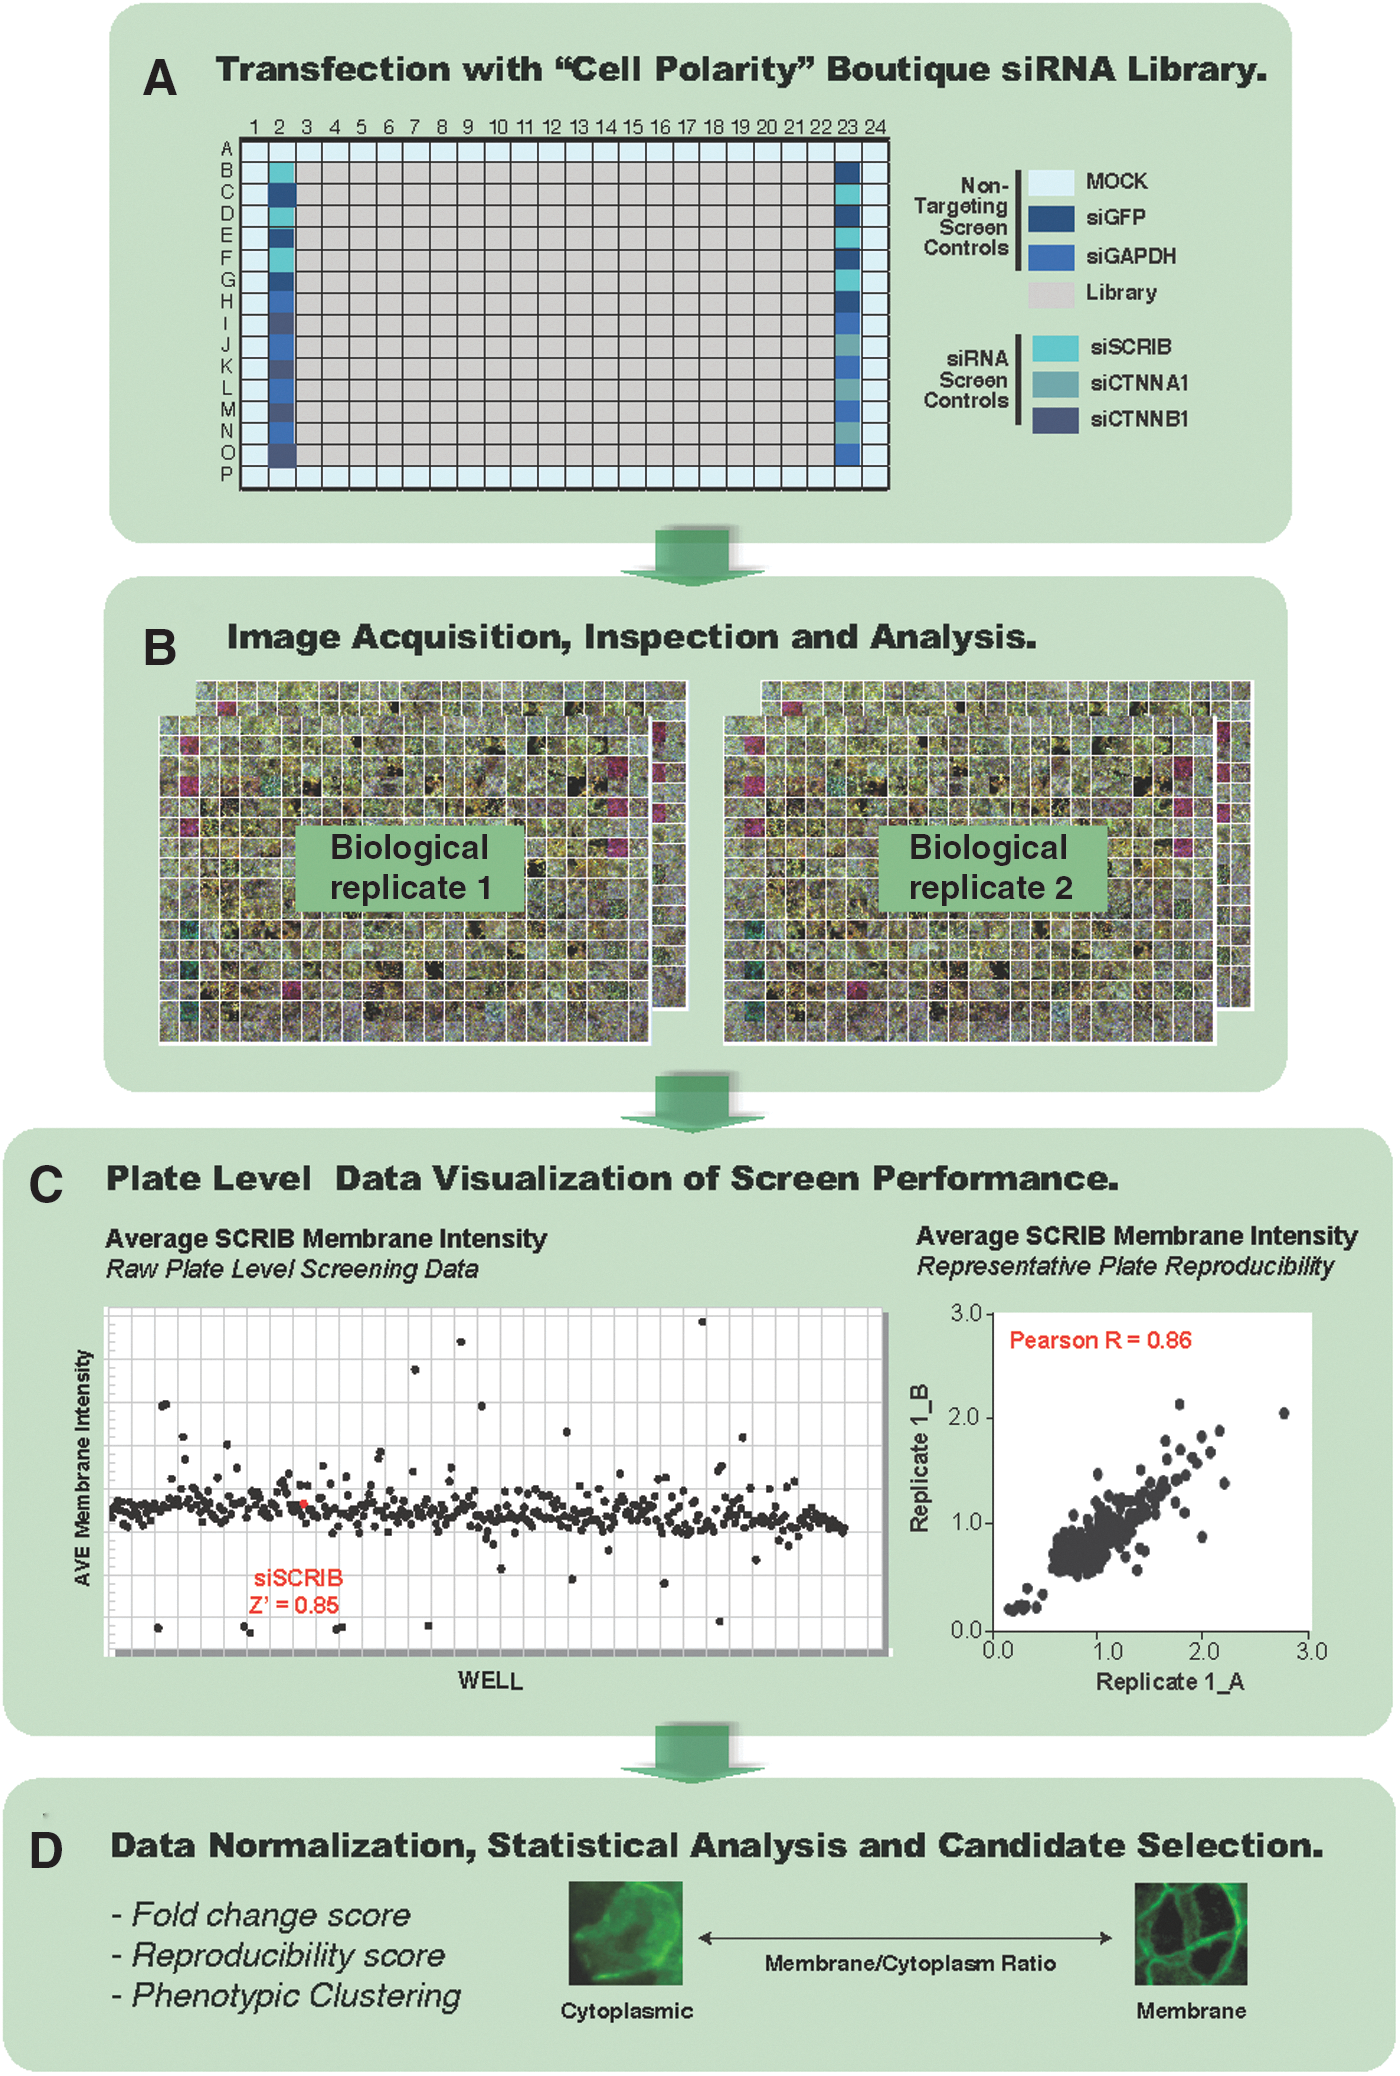
A phenotypic high-content screen to identify regulators of Scribble membrane levels and localization. MCF10A cells were reverse transfected with the “Cell Polarity” boutique siRNA library
To ensure good performance was maintained throughout the screen, imaging data and the associated numerical readout were examined while the screen was in progress. Visualization of plate-level data is one of the most effective techniques that is used to uncover any undesirable patterns that might indicate technical problems. Specific features utilized during this quality control process included visual inspection of (1) siCTNNA1 transfection control wells for morphological changes, (2) siSCRIB and siCTNNB1 wells for depletion of Scribble and CTNNB1 levels, respectively, (3) distribution of raw values generated from positive and negative control wells relative to mock-transfected and non-targeting controls (Fig. 3C, left panel, and Fig. 4), and finally, (4) correlation coefficients of ≥0.7 for raw values generated from biological and technical replicate plates (Table 2 and Fig. 4). Viewed collectively, these plate-level quality control metrics confirmed good bio-imaging quality, sensitivity, and strong reproducibility, indicating robust performance of the high-content bio-imaging assay throughout the pilot screen. Of note, the distribution of raw Scribble membrane/cytoplasm ratio data (Fig. 4B) suggests that the performance of this parameter is less robust than Scribble membrane intensity (Fig. 4A). However, given the targeted nature of the library, enriched for the epithelial polarity program and associated signaling pathways, a large number of genes may be expected to affect Scribble localization between the cytoplasm and the membrane. Despite this, good separation of positive controls was observed, indicating that this parameter is robust for identifying siRNA or compounds that decrease membrane localization, which is the primary objective of the Scribble localization screen.
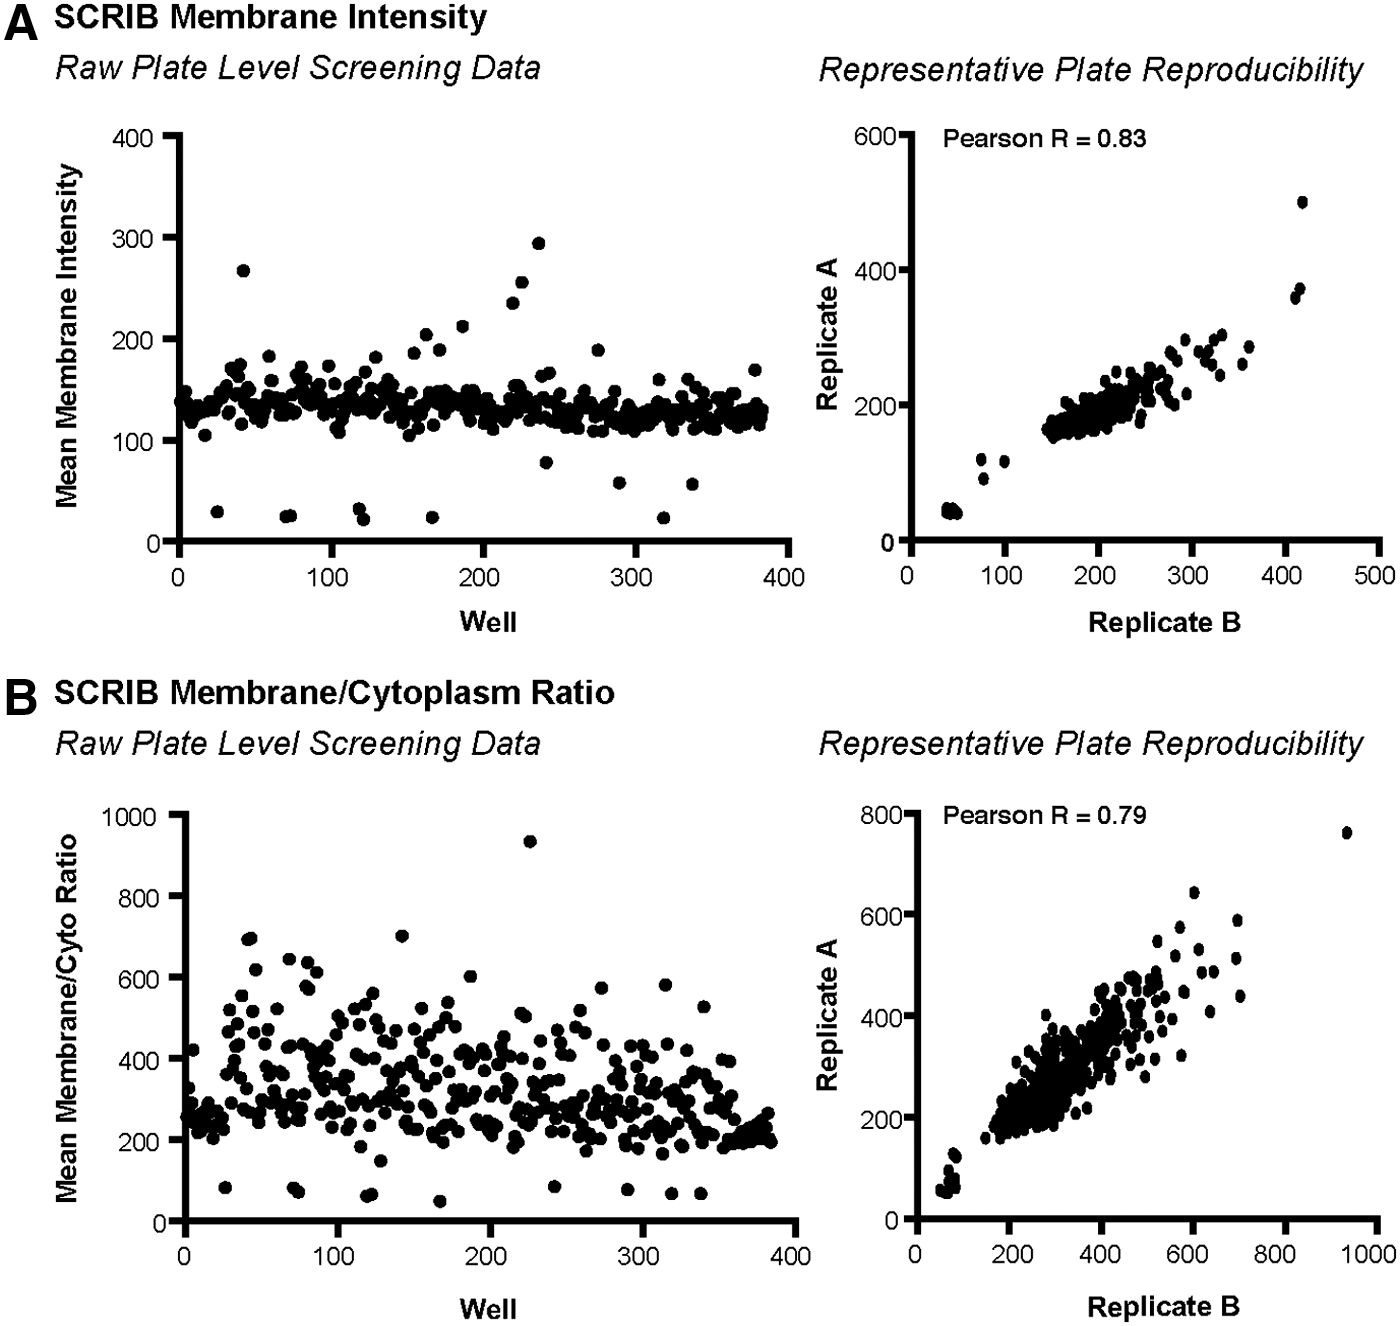
Screen performance. Representative plate level data for mean Scribble membrane intensity
Pilot Screen Results
All values listed for Pearson's R, %CV, and Z′ factors are means ± the standard deviation calculated from two technical replicate screening assay plates from two independent biological replicate screens.
CV, coefficient of variance.
Screen Analysis and Hit Identification
Given the targeted nature of the pilot screen, mean Scribble membrane intensities and membrane/cytoplasm ratios were normalized to the median of on-plate non-targeting controls (siGAPDH and siGFP) to generate fold change data. Given that this method is sensitive to outliers in the controls, 12 non-targeting control wells were monitored for outliers based on %CV calculations. Outliers were defined as any sample three standard deviations above or below the median of all on-plate non-targeting and mock transfection controls, and they were excluded from the analysis. After normalization of the screening data, additional well-level quality control metrics were applied. Importantly, robust Z′ values were achieved across all technical and biological screen replicates for both mean Scribble membrane intensity (siSCRIB Z′ = 0.85) and mean membrane/cytoplasm ratio (siSCRIB Z′ = 0.54), and %CVs ranged from 2.75% to 23.4% throughout the screen (Table 2). These well-level quality control metrics confirm strong performance, sensitivity, and reproducibility of the screen.
To identify hits from the screening dataset, we applied a K ± three standard deviation threshold relative to siGAPDH and siGFP non-targeting controls. Genes that satisfied these criteria in three out of four independent datasets were designated as hits. This strategy resulted in four gene lists corresponding to candidate genes whose depletion leads to a Scribble membrane low (5 hits) or Scribble membrane high (110 hits) phenotype, and candidate genes whose depletion leads to a Scribble membrane/cytoplasm ratio low (33 hits) or high (306 hits) phenotype (Table 2). Consistent with the distribution of raw data discussed earlier, the number of hits that increased Scribble membrane levels and the membrane/cytoplasm ratio was very high. Based on these data, we conclude that the assay is primarily suited for identifying genes that decrease Scribble membrane levels or induce mislocalization to the cytoplasm (low membrane/cytoplasm ratio). However, we also note that the performance of these assay parameters will likely vary for different membrane proteins; therefore, each parameter should be assessed for new target proteins. Because Scribble localization to the membrane occurs once cell–cell adhesions have become established, a central aim of the screening assay was to identify pathways that modulate Scribble membrane levels or localization independent of effects on cell–cell adhesion. Although filtering hits based on cell number can successfully remove some genes that merely affect Scribble due to loss of cell–cell adhesion, changes in Scribble membrane levels and localization do not correlate with changes in cell number (cells/field parameter) (Supplementary Fig. S3). Moreover, when depleted, some genes will reduce cell number but cell–cell adhesions remain intact (e.g., small confluent islets of cells scattered throughout the well). CTNNB1 is an integral component of the adherens junctions in epithelial cells, and loss of CTNNB1 membrane localization is associated with loss of cell–cell adhesion. Based on these characteristics, CTNNB1 membrane levels and localization can serve as a useful surrogate measure of cell–cell adhesion. Candidate genes identified in the Scribble screen were assessed for CTNNB1 membrane levels and localization, and candidates that decreased membrane levels or localization of Scribble independent of any change in CTNNB1 were selected as the primary hits of interest. Additional parameters such as distance between nuclei could also be employed to control for loss of cell–cell adhesion in different cellular contexts or larger screening datasets. Based on these criteria, only three candidate genes were identified as Scribble membrane low hits, due to decreased Scribble membrane levels and no change in CTNNB1. Biologically, this low hit rate is consistent with a strong selective pressure to maintain appropriate levels of Scribble at the plasma membrane, which is consistent with Scribble's highly conserved role in epithelial polarity, a function that requires membrane localization.
The two strongest Scribble membrane low hits were myosin heavy chain 9 (MYH9) and insulin-like growth factor receptor (IGF1R), and importantly, a review of the images for these genes confirmed a specific reduction of Scribble membrane levels and no change in CTNNB1 (Fig. 5A). Data mining revealed a previously documented functional interaction between IGF1R and myosin (Fig. 5B), and consistently SMARTpools targeting these genes strongly phenocopied each other, supporting the idea that they may function in a common pathway to control Scribble membrane levels. Because MHY9 also interacts with LGL polarity proteins from the Scribble polarity complex, 1,13 this further strengthens a potential role for these genes in the regulation of Scribble. Notably, depletion of other myosin isoforms included in the siRNA library did not affect Scribble membrane levels or localization, supporting a potential isoform-specific function for these components of the actomyosin cytoskeleton. This observation is consistent with different expression patterns and sets of interaction partners, indicating that these proteins can orchestrate distinct and context-specific functions. 1 Viewed together, these data support the capacity of this screening approach to identify specific and biologically relevant regulators of the Scribble membrane protein.

Candidate regulators of Scribble membrane levels identified by phenotypic high-content screening.
High-content RNAi screening has been successfully applied to systematically determine genes that contribute to a wide variety of cellular processes, identify new disease genes, and gain insights into the architecture of signaling networks. 14 –18 Here, we provide evidence that this approach can be successfully applied to uncover novel regulators of membrane protein localization in the context of confluent human epithelial cells. Indeed, using Scribble membrane localization as a model, we identified candidate regulators of Scribble membrane levels, and we potentially revealed isoform-specific functions for distinct components of the actomyosin cytoskeleton. Viewed collectively, this work provides a valuable platform for further analysis of how membrane localization is regulated in epithelial cells. Notably, the assay presented here was performed on a wide-field automated microscope. The ability to use this platform for analysis of membrane proteins allows screeners to take advantage of the speed and reduced cost of wide-field imaging over more expensive confocal instruments. Application of more advanced machine-based learning methods to this dataset will likely increase the power of the dataset and the number of hypotheses generated.
Footnotes
Acknowledgments
This study was supported by a project grant from the NHMRC of Australia (1103871). L.K.S. was supported by an Australian Postgraduate Award. P.O.H. was supported by a Senior Research Fellowship from the NHMRC of Australia (1079133). The Victorian Centre for Functional Genomics (K.J.S.) was funded by the Australian Cancer Research Foundation (ACRF), the Victorian Department of Industry, Innovation and Regional Development (DIIRD), and the Australian Phenomics Network (APN) and it was supported by funding from the Australian Government's Education Investment Fund through the Super Science Initiative and National Collaborative Research Infrastructure Scheme, the Australasian Genomics Technologies Association (AGTA), the Brockhoff Foundation, and the Peter MacCallum Cancer Centre Foundation.
Disclosure Statement
No competing financial interests exist.