
Abstract
The main purpose of this work was to develop an in vitro method for simulating the dissolution and absorption of inhaled dry powder drugs that also mimics systemic pharmacokinetic data. A second purpose was to evaluate this method. DissolvIt® was developed as a simulation of the air-blood barrier of the upper airways, constituting: “airborne” particles deposited on a glass cover slip, a mucus simulant, a polycarbonate (basal) membrane, and a pumped albumin buffer simulating the pulmonary blood flow. The PreciseInhale ® exposure system was used to aerosolize and deposit test formulations onto cover slips. The particle dissolution was observed by optical microscopy as particle disappearance, and it was started directly when the particles came into contact with the mucus simulant. Solute from the dissolving particles diffused through the barrier and was absorbed into the perfusate. The drug concentration in the perfusate over time and the remaining drug in the barrier at the end of the experiment were quantitated by using liquid chromatography–tandem mass spectrometry. Budesonide and fluticasone propionate generated different pharmacokinetic dissolution/absorption profiles in DissolvIt. This study indicates that DissolvIt simulates dissolution and absorption of drugs in the lung, and that DissolvIt also mimics pharmacokinetic profiles and parameters.
Introduction
The dissolution property of a drug is crucial for the effect it has when used in treatment. For example, slow dissolution can be used as a strategy to increase the retention of the drug in the lungs, thereby prolonging the duration of the effects. Dissolution is, thus, an important factor to consider in drug development. A number of methods have been devised to simulate drug dissolution in the gastro-intestinal tract, 1 whereas fewer methods have been proposed for drug dissolution in the lungs.
There are today four existing methods for in vitro dissolution testing in the lungs. First, there is the paddle apparatus (U.S. pharmacopeia 2). 2 Here, aerosols of fine particles are deposited on a filter placed in a membrane cassette, which is then suspended in a solution. A paddle stirs the solution, and the solution penetrates the membranes and dissolves the particles inside. Samples are repeatedly taken from the solution reservoir over time to measure drug release into the surrounding solution, reflecting the dissolution. Second is the flow-through cell (U.S. pharmacopeia 4), 3 where the drug particles are deposited on a glass fiber filter and then placed in a filter cassette. The filter is eluted in a flow-through configuration, and the recirculated eluate is repeatedly analyzed for the dissolved drug.
Third, there is the modified Franz diffusion cell 4 where the particles are deposited on a porous membrane on one side and then come into contact with a stirred batch of solution on the other side. Samples are repeatedly taken over time from the stirred solution. Finally, there is a Transwell system for dissolution testing of size-fractionated particles that are deposited onto filters placed on the donor side of the Transwell insert, using either an Anderson cascade impactor or a new-generation impactor. On the acceptor side, underneath the Transwell membrane (pore size 0.4 μm), samples are taken over time to measure dissolution rate. 5,6
Two different studies have compared these in vitro dissolution test methods. 7,8 In the Salama study, it was concluded that the modified Franz diffusion cell could best differentiate the dissolution of a series of controlled-release formulations. May et al., on the other hand, concluded that all three methods could discriminate between poor solubility and higher solubility substances, whereas only the paddle apparatus succeeded in differentiating drugs with smaller solubility differences. Previously referenced methods all give cumulative dissolution profiles that are often expressed as % of the deposited drug transferred to the dissolution medium.
There is a general desire among drug developers to have an in vitro lung dissolution method that can be used for more reliable in vitro–in vivo correlation (IVIVC) work. Currently, there is no stated recommendation on the method to use from regulatory agencies such as the FDA.
The primary purpose of this work was to develop an in vitro dissolution test method for inhaled particles, DissolvIt ®, which simulates the physiological conditions in the lung and mimics the in vivo pharmacokinetic data of such particles. The secondary purpose was to evaluate DissolvIt by testing two well-known inhalation drugs: budesonide (BD) and fluticasone propionate (FP).
Materials and Methods
Dry powder drugs were aerosolized with PreciseInhale®9 –11 aerosol generator and then deposited on circular microscope glass cover slips, called exposure cover slips. The exposure cover slips were then used for dissolution experiments in DissolvIt. The DissolvIt system consists of an air-blood barrier model, a precision-controlled pump for the blood simulant, and an inverted microscope with a high-resolution camera and a fraction collector. 12 At the start of the experiment, particles deposited on an exposure cover slip came into contact with the mucus simulant applied to the underside of a hydrophilic polycarbonate membrane. The blood simulant was pumped above the polycarbonate membrane (Fig. 1). The particle dissolution was studied both from the “luminal” side through optical microscopy and from the “vascular” side by chemical analysis of substances dissolved in the collected flow-past blood simulant.
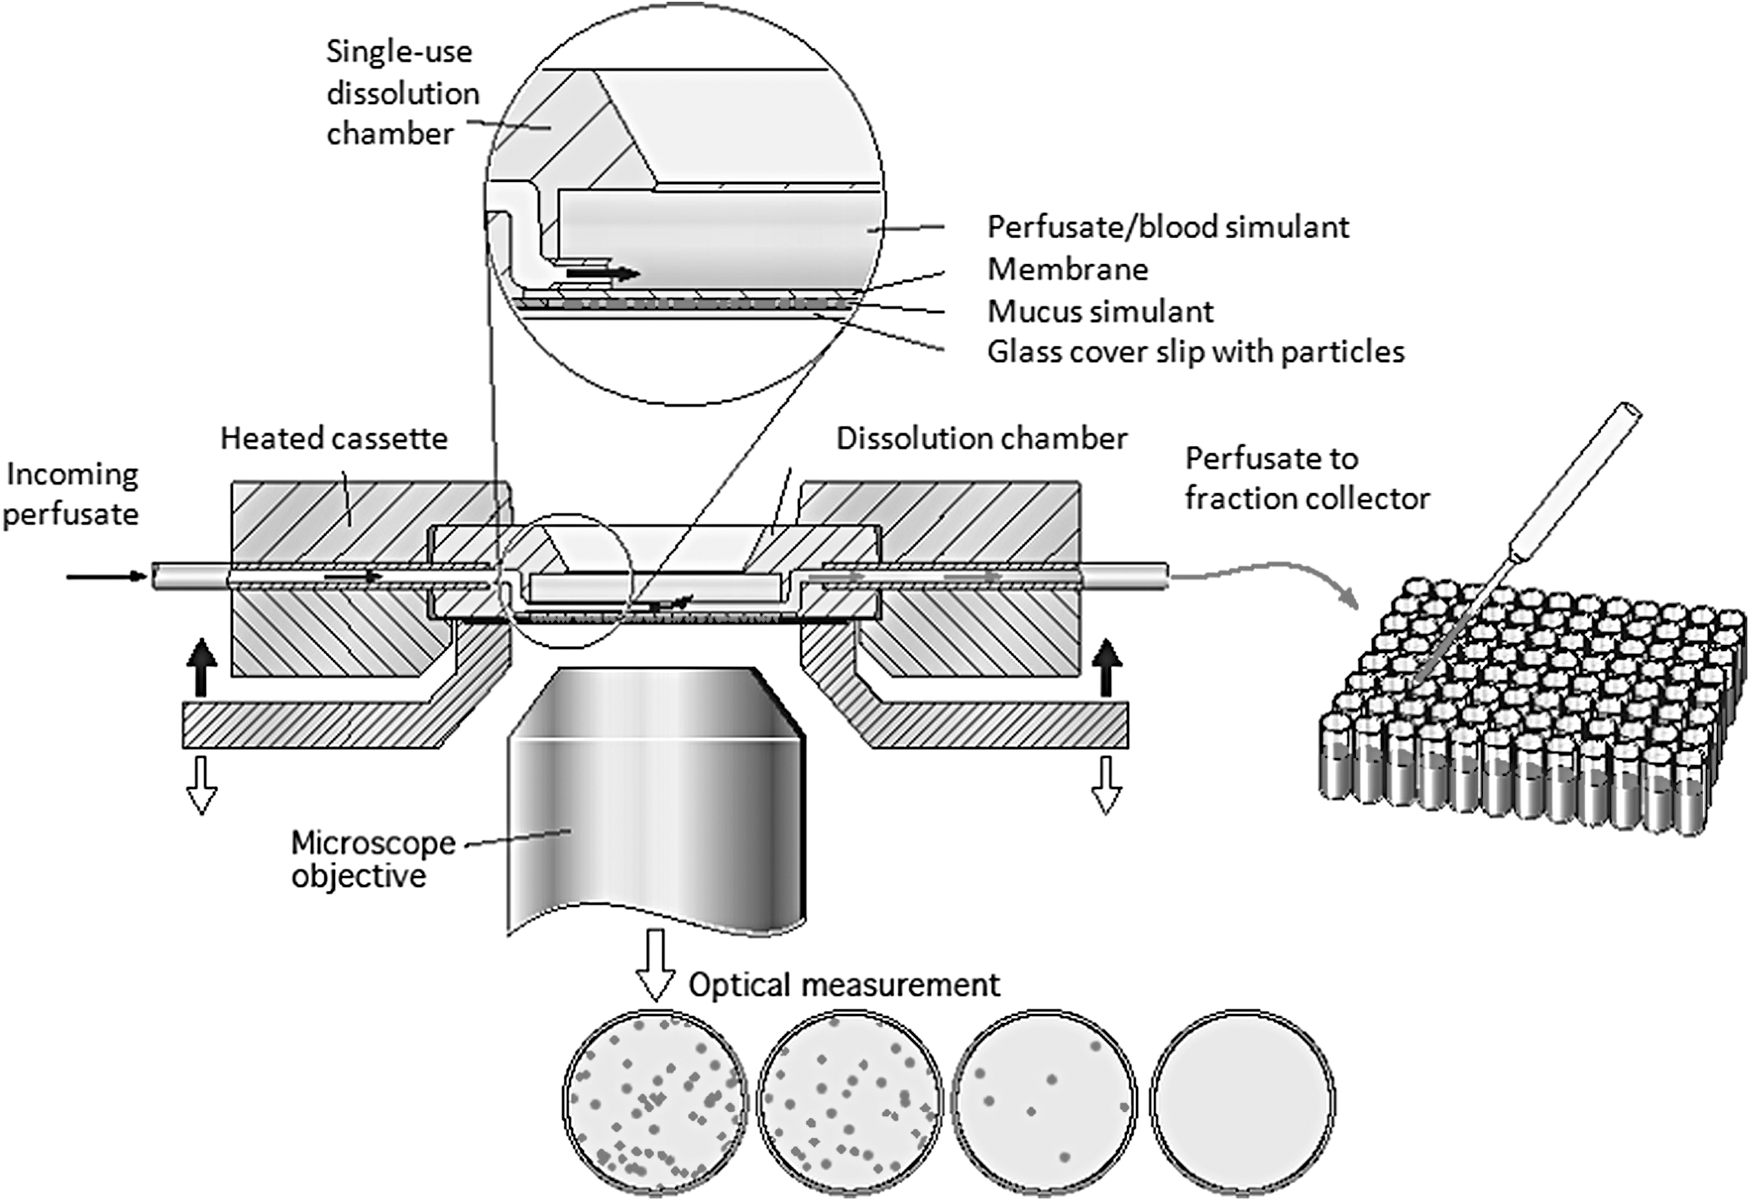
DissolvIt. A schematic drawing of the DissolvIt system. This figure is reproduced with permission from Respiratory Drug Delivery 2014, Virginia Commonwealth University and RDD Online.
The Exposure Coverslip Coating Chamber of PreciseInhale
The studied particles were deposited as dry powder aerosols on circular microscope cover slips that were 13 mm in diameter (No. 2 from MenzelGläser, Histolab) by using a special coating chamber connected to the batch-wise operating exposure system PreciseInhale (Fig. 2A). 13 The Dustgun aerosol generator of the PreciseInhale system uses portions of highly compressed air to deagglomerate batches of fine powders into highly concentrated respirable aerosols in small volumes. Nine exposure cover slips were placed in a ring-shaped cover slip holder (Fig. 2B). A thin steel passe-partout was fitted on top of the cover slip holder to limit the area of powder coating to only the surface that will be in contact with the model barrier.

Arrangement of coating chamber, cover slip holder, and a coated cover slip.
Placed at the bottom of the special aerosol coating chamber, the cover slip holder surrounds the inlet port from the PreciseInhale exposure system. The generated aerosol was injected vertically into the coating chamber through the inlet port. Immediately after generation, the aerosol exited through pair-wise exit holes that were located at each cover slip. Below the cover slip holder there was a ring-shaped paper filter to remove exiting aerosol, and to create an even flow distribution over the nine exposure cover slips. One of the cover slips can be replaced with a sampling filter for scanning electron microscopy (SEM) (JEOL, Tokyo, Japan). The volume of the coating chamber can be varied, in the range of 500–1,000 mL, giving a residence time of 20–60 s at a 1.2 L/min exposure flow rate. Drug particles deposited on an exposure cover slip are shown in Figure 2C.
In addition to the coating procedure, the particle-size distribution of generated aerosols was also measured, using a Marple 8-stage cascade impactor. 14 The aerosols were generated under the same conditions as during the coating procedure, although into the standard coating chamber of the PreciseInhale aerosol generator, then diluted, and finally drawn through the cascade impactor at the prescribed flow rate of 2 L/min.
Flow-Past Dissolution Chamber
The single-use dissolution chamber consisted of an injection-molded polycarbonate chamber with a porous (0.03 μm pores) polycarbonate membrane (Sterlitech) welded around the 0.25 mm deep perfusion chamber (Fig. 3A, to the left). The circular polycarbonate membrane had a likewise circular, 50 μm-thick, adhesive tape (3 M) covering its perimeter. This arrangement leaves a thin, 12 mm-diameter void opposing the blood simulant perfusion chamber on the other side of the polycarbonate membrane. When the circular void was filled with a mucus simulant to the level of the surrounding distance tape, the chamber was ready for use. The volume of the mucus simulant when flush with the distance tape is 5.7 μL.
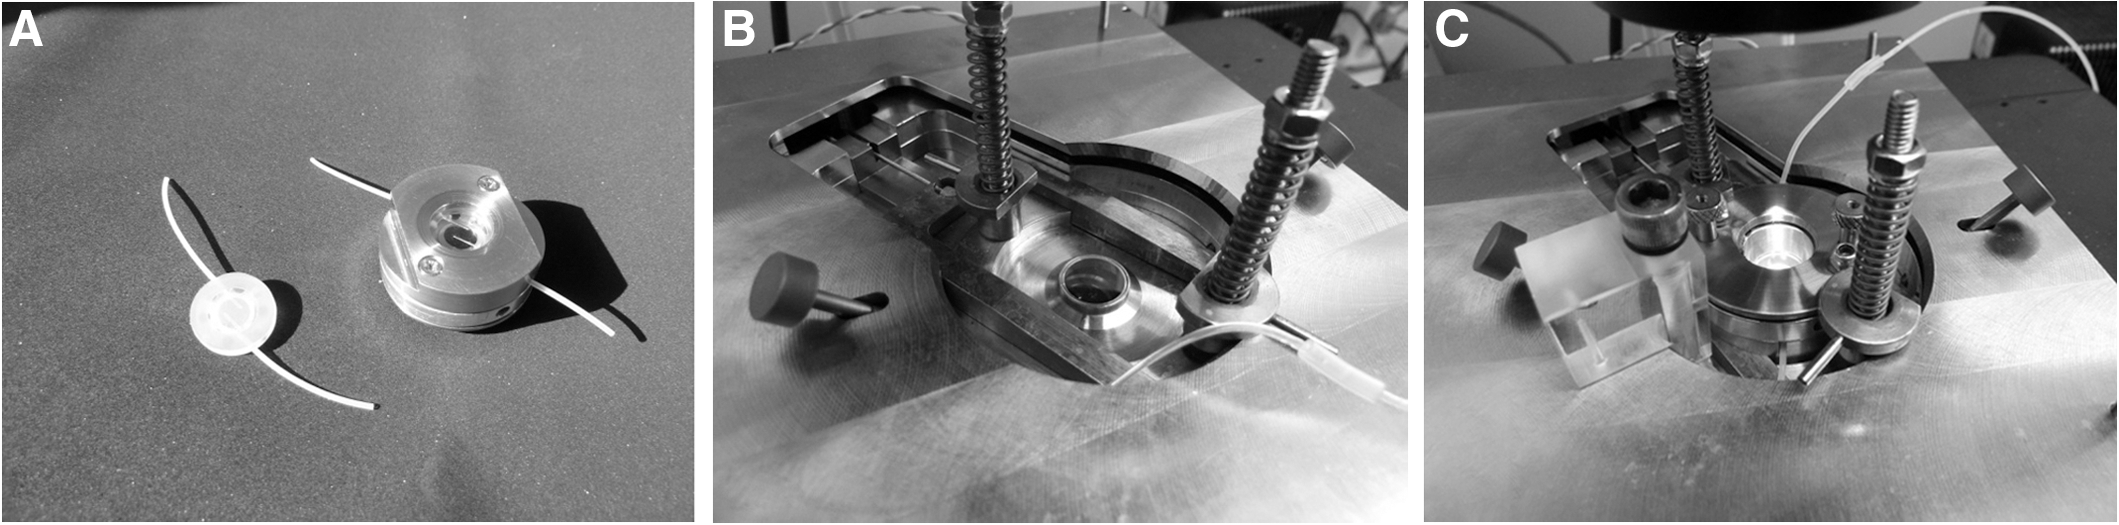
The single-use flow-past dissolution chamber and the bottom plate on top of the microscope.
Simulation of Physiological Conditions in the Lung
The drug-coated cover slip was opposed to, but did not come into contact with, the mucus the mucus simulant surface. At the start of the experiment, the drug particles were brought into contact with the 50 μm-thick mucus layer, mimicking the mucus lining layer of the tracheobronchial mucosa. The polycarbonate membrane mimics the basal membrane of the airway mucosa and separates the diffusion barrier of the mucus simulant from the streaming blood simulant on the other side.
The liquid flow of the perfusion chamber runs along the membrane from one side of the cell to the other in a flow-past configuration. The perfusate residence time in the chamber is only a few seconds. This is intended to mimic the short passage time of blood in the abundant capillary loops located immediately below the basal membrane in the airway mucosa. 15 The blood simulant composition can be varied widely but should be buffered and isotonic, with the chosen mucus simulant composition on the other side of the polycarbonate membrane.
Before coming into contact with the powder cover slip, the air-to-perfusate distance of the mucus simulant-coated dissolution chamber was ∼60 μm. In comparison, the thickness of the air-blood barrier in the human tracheobronchial epithelium of non-diseased individuals varies from 60 μm in the trachea to 8–10 μm in the bronchioles. In the gas exchange region, the air-blood barrier thickness is only some 0.2–1.5 μm. 16 The air-to-perfusate thickness of the DissolvIt system, thus, corresponded to the tracheal air-blood barrier. The total thickness of the well-perfused portion of the mucosa has been estimated to be some 200 μm in the upper airways. The total thickness of the mass transfer region in the DissolvIt chamber of 300 μm was, thus, within a reasonable physiological range.
DissolvIt
During the experiment, the dissolution chamber was encased in a movable cassette (Fig. 2A, right), with the downward-facing mucus simulant surface opposing the particle-coated cover slip resting in the cover slip socket (Fig. 3B), and the particles facing upward. The flow-past chamber was lowered onto the cover slip by using a motor-driven wedge mechanism. The entire frame, socket, and flow-past chamber were temperature controlled by using a PID regulator (Eurotherm) to 37°C with electric heating foils (ConFlux Heating AB, Kista, Sweden), coating the cassette and the heating rack, and resting on the microscope object table (Fig. 3C). The incoming blood simulant was equilibrated to the same temperature by looping the blood simulant tube within the temperature-controlled rack. The blood simulant exiting the dissolution cell was collected in a 96-hole deep-well plate by using a custom-made fraction collector.
Procedures
The DissolvIt dissolution method consisted of the following major steps: (1) preparation of mucus simulant layer and blood simulant; (2) the cover slip coating procedure; (3) the dissolution experiment and quantification of test substances; and (4) the microscopy recording. The methodology was tested and optimized with BD and FP as model compounds, to represent two prominent model substances of different solubilities and lipophilicities. The micronized powders used within this project were provided by AstraZeneca Ltd. During method development, the parameters were adjusted to resemble the physiological background as closely as possible.
Mucus simulant layer preparation and blood simulant composition
Polyethylene oxide (PEO) with a molecular weight of 5,000 kDa has earlier been used to simulate lung mucus. 17 It was found to be optimal in performance and quality for simulating the extracellular lining layer of the tracheobronchial airways. PEO (Sigma-Aldrich, St Louis, MO) was dissolved in phosphate buffer (0.1 M) to a concentration of 1.5% by weight.
To mimic the lipid content of cell membranes and surfactant layers of the airway mucosa, a certain fraction of
To mimic the physiological conditions, phosphate buffer (0.1 M, pH 7.4) with 4% (w/v) albumin was used as perfusate. The flow rate of the perfusate was chosen to reasonably mimic the perfusion flow rate of the airway mucosa. 19 A flow rate of 0.4 mL/min was chosen since it gave absorption profiles that were the most similar to the profiles generated in other models.
Cover slip coating procedure
Aerosols for coating the cover slips were generated by using the PreciseInhale exposure system. The goal was to simultaneously deposit a controlled amount of substance on the nine cover slips, with an acceptable standard deviation between the cover slips. The dose levels were chosen to be high enough to avoid problems with the limit of quantification, but low enough to avoid problems with interference between dissolving particles. A suitable level of aerosol coating per cover slip was found to be in the range of 1–5 μg. The aerosol coating procedure is all automatic and controlled by the PreciseInhale software system, which was developed in collaboration with Flexura AB (Upplands Väsby, Sweden) and is based on the LabVIEW software platform (National Instruments, Austin, TX).
After the generation cycle, the aerosol was passed over the cover slip holder and into the ring-shaped total filter (Whatman, GF/A). Various powders behaved differently during the cover slip coating procedure, so it was not possible to find one parameter setting that always worked. Therefore, a procedure was used during which both the amount of substance loaded per generation cycle and the number of generation cycles were varied for different substances. Less substance loaded per cycle combined with repeated generation cycles decreased the proportion of agglomerated particles on the cover slips. For the two test substances, the coating pattern obtained for the presented dissolution experiments was chosen from a single generation cycle with 2.5 mg substance loaded, and an air flow rate of 1.2 L/min out of the coating chamber.
The generated aerosols were also characterized by performing an SEM investigation of the generated aerosols. One sample per substance was taken from freshly generated aerosol onto a sample filter for SEM. The sample was coated with gold before the microscopic investigation.
The initial amount of drug on the cover slips was determined by using two different methods: (1) To determine the average amount of drug on the cover slips before the dissolution experiment, three randomly chosen cover slips (out of nine) were extracted in methanol, and the drug was quantitated by using HPLC. (2) For each cover slip used in the dissolution experiment, the actual amount of drug on that particular cover slip was calculated through a mass balance over the amount of drug clearing with the perfusate and the amount of drug retained in the dissolution chamber at the end of the experiment. The mass balance method was tested for accuracy, as described later.
Dissolution experiment and substance quantification
The perfusion chamber was prepared and inserted into its holding cassette (Fig. 3A). After the perfusion flow was connected and the temperature was allowed to stabilize to 37°C, the mucus simulant layer was applied. The cover slip with particles was placed in the cover slip socket (Fig. 3B) and the perfusion cell was positioned opposite the particle surface with a separating air gap (Fig. 3C), controlled by a wedge mechanism. At the start of the experiment, the barrier module was lowered onto the particle cover slip by removing the wedge using a motorized mechanism. Meanwhile, both the perfusate pump and the fraction collector were started. The experiments were run for a maximum of 8 h. The duration of the experiments was chosen based on the known solubility of the tested substances.
To monitor most of the critical dissolution phenomena, more than half of the original amount of a higher-solubility substance on the cover slip should have eluted into the blood simulant, or the dissolution of a low-solubility substance should be followed for a number of hours, to allow extrapolation of the retention time to indicate a likely effect duration of this inhaled drug in the lungs. In the current study, the BD experiments were run for 1 h and the FP experiments were run for 8 h.
After the dissolution experiments, the collected blood simulant fractions were stored frozen until analysis by mass spectroscopy. After the perfusion period, the dissolution unit, including cover slip, was collected in a 50 mL Falcon tube. The polycarbonate membrane was cut open, 10 mL methanol was added, and the pieces were thoroughly agitated in this volume and then sampled in triplicate aliquots for chemical analysis. The Teflon tubes connecting the dissolution cell with the fraction collector were rinsed with methanol and quantitated by mass spectrometry for wall-adsorbed substances. The amount in the tubes was found to be negligible in comparison with the amount cleared with the perfusate. The samples were analyzed at AstraZeneca Ltd, Lund, Sweden, and Pharm-Analyt Labor GmbH, Baden, Austria, using LC/MS/MS.
Microscopy recording
The DissolvIt setup includes a camera coupled to an inverse microscope. Photos are repeatedly taken of the particles while being dissolved during the experiment. The particle dissolution is thereby visualized as disappearance of particles over time. The time between the photos taken can be freely adjusted. The photographic series serves as an important complement to the absorption curves generated by the blood simulant analysis.
Mass balance experiment
One important aspect of the DissolvIt system was a good control of the mass balance. The entire amount of test drug originally present on the cover slip must be either recovered in the collected blood simulant or retained in the dissolution chamber after the experiment. Through this procedure, the fractional retention can be calculated. The mass balance was tested by pipetting an exact amount of the study substances, dissolved in ethanol, onto multiple cover slips and evaporated to dryness, giving a dried precipitate within the limits of the aerosol deposition mask. The cover slips were then taken through the dissolution experiments according to the standard protocol, with the exception that no pictures were taken and the entire perfusate output from the experiments was collected in one single container.
After the experiment, the amount of material retained in the dissolution chamber was recovered by agitation and dissolution in 10 mL methanol. The collected blood simulant, tube rinse, and triplicate samples of the dissolution chamber extract were quantitated for test substances. The sum of substances retained in the dissolution chamber and cleared with the corresponding blood simulant was compared with the original amount of substances pipetted onto the cover slips.
Data evaluation
The DissolvIt system generated dissolution/absorption curves and microscopic photos of the dissolution process. From the dissolution/absorption curves, pharmacokinetic parameters such as the maximum concentration in the perfusate (Cmax), the time to reach the maximum concentration in the perfusate (tmax), and fractional retention of drug in the dissolution chamber were assessed. Fractional retention in the dissolution chamber was calculated from a mass balance by subtracting the cumulative appearance of drug in the perfusate from the original amount present on the cover slip. Cmax and tmax were taken from the data of the concentration-time curves. The half-life of retention (t1/2) was determined as the time at which either 50% of the originally administered amount on the cover slip or 50% of some intermediary fraction had appeared in the perfusate.
Results
Using the PreciseInhale exposure platform, the test formulations were deagglomerated into respirable aerosols, with a mass median aerodynamic diameter (MMAD) of 1.7 μm for BD and of 3.4 μm for FP (Fig. 4). The SEM pictures indicated coarser primary particles and a less deagglomerated state of the FP aerosol, compared with BD (Fig. 5). The amount of drug administered to three randomly chosen cover slips ranged from 0.99 to 1.20 μg, and the relative standard deviation of administration ranged from ±2% to ±13% for all experiments with BD and FP. The mass balance experiment demonstrated a more or less complete recovery of the original amount pipetted onto the cover slips for both tested drugs (Table 1). Only negligible amounts of substance were recovered from the Teflon tubes connecting the dissolution chamber and the fraction collector.

Particle-size distribution. The particle-size distribution of the tested aerosols.
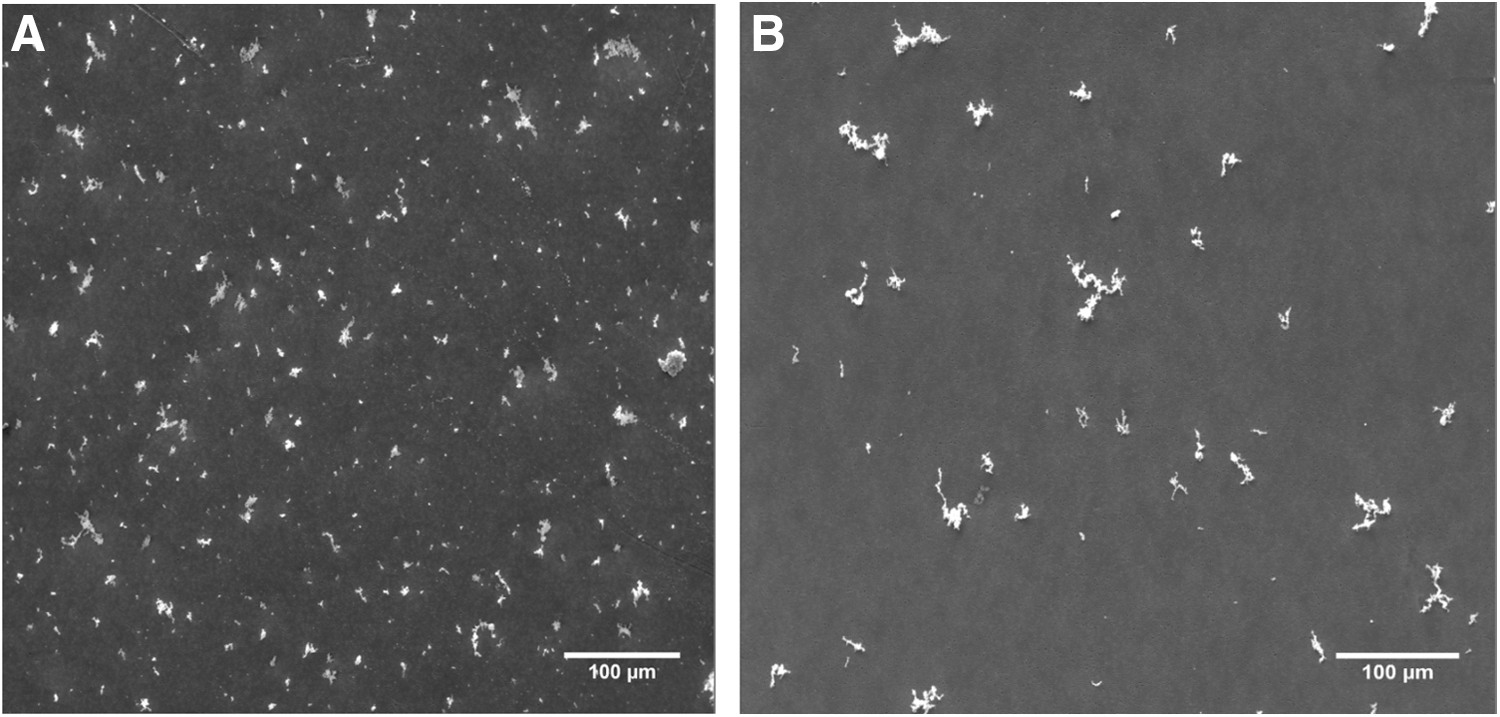
SEM images. SEM images of the deposited aerosols at magnifications × 200.
Summary of the Mass Balance Test with Budesonide and Fluticasone Propionate
Total perfusion time 20 min.
Total perfusion time 4 h.
Two major results are available from the DissolvIt experiments: chemical results and image results. For each substance tested, the chemical results provide two important data sets: (1) an in vitro absorption curve determined from the concentration of solutes in the eluted blood simulant as a function of time and (2) the fraction of the original amount of substance retained in the dissolution chamber at the end of the perfusate collection period. The general appearance of BD in the dissolution chamber was that a substantial fraction was absorbed within the 1 h test period; whereas for FP, the vast majority of the mass remained in the cell throughout the duration of the 8 h experiment (Figs. 6 and 7). For BD, Cmax and tmax were derived directly from the perfusate concentration data. For BD with 0.02% lipid in the mucus simulant, t1/2 was interpolated from the existing measuring points and, with 0.4% lipid in the mucus simulant, t1/2 was extrapolated from the existing measuring points (bi-exponential decay) (Table 2).
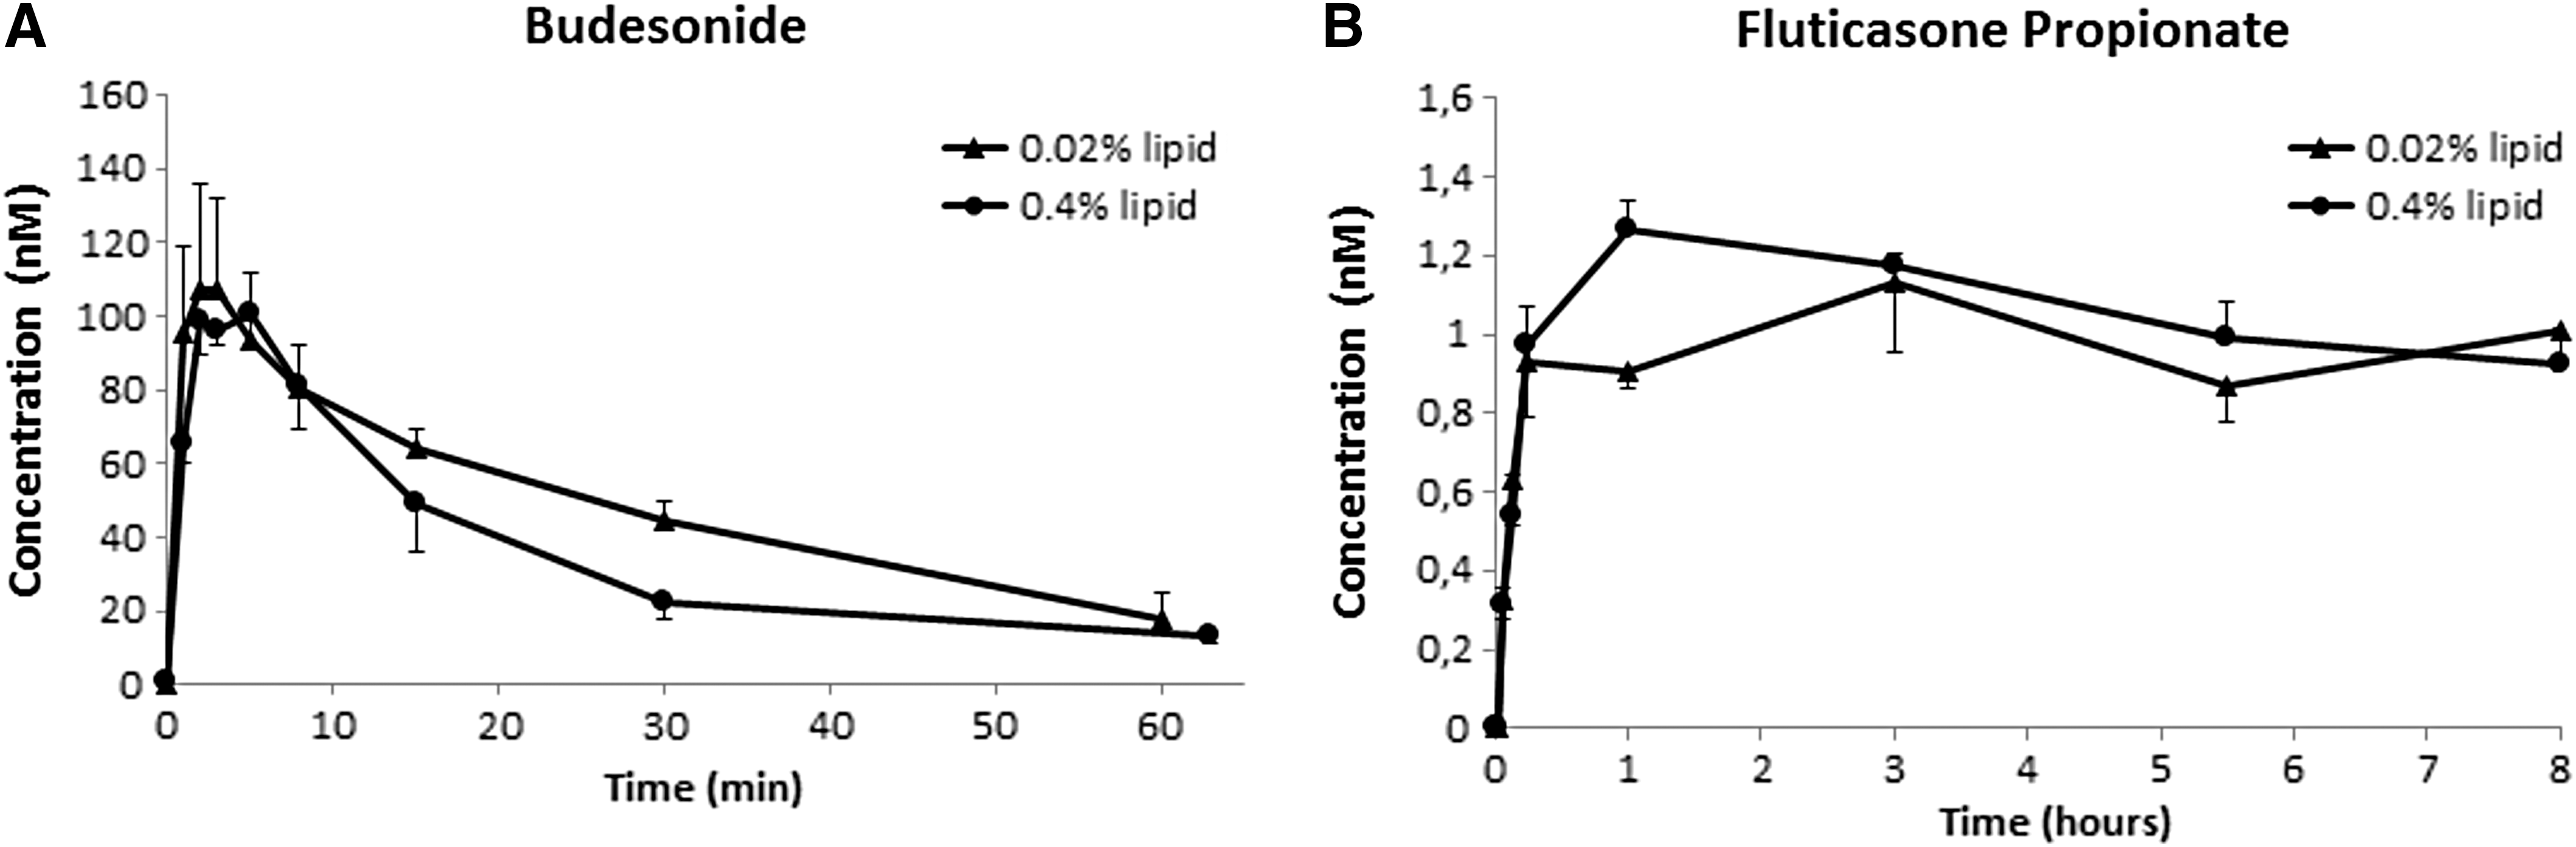
Perfusate concentration curves. The concentration of the tested drugs in the perfusate as a function of time. Two different phospholipid concentrations in the gel were compared: 0.02% and 0.4%.
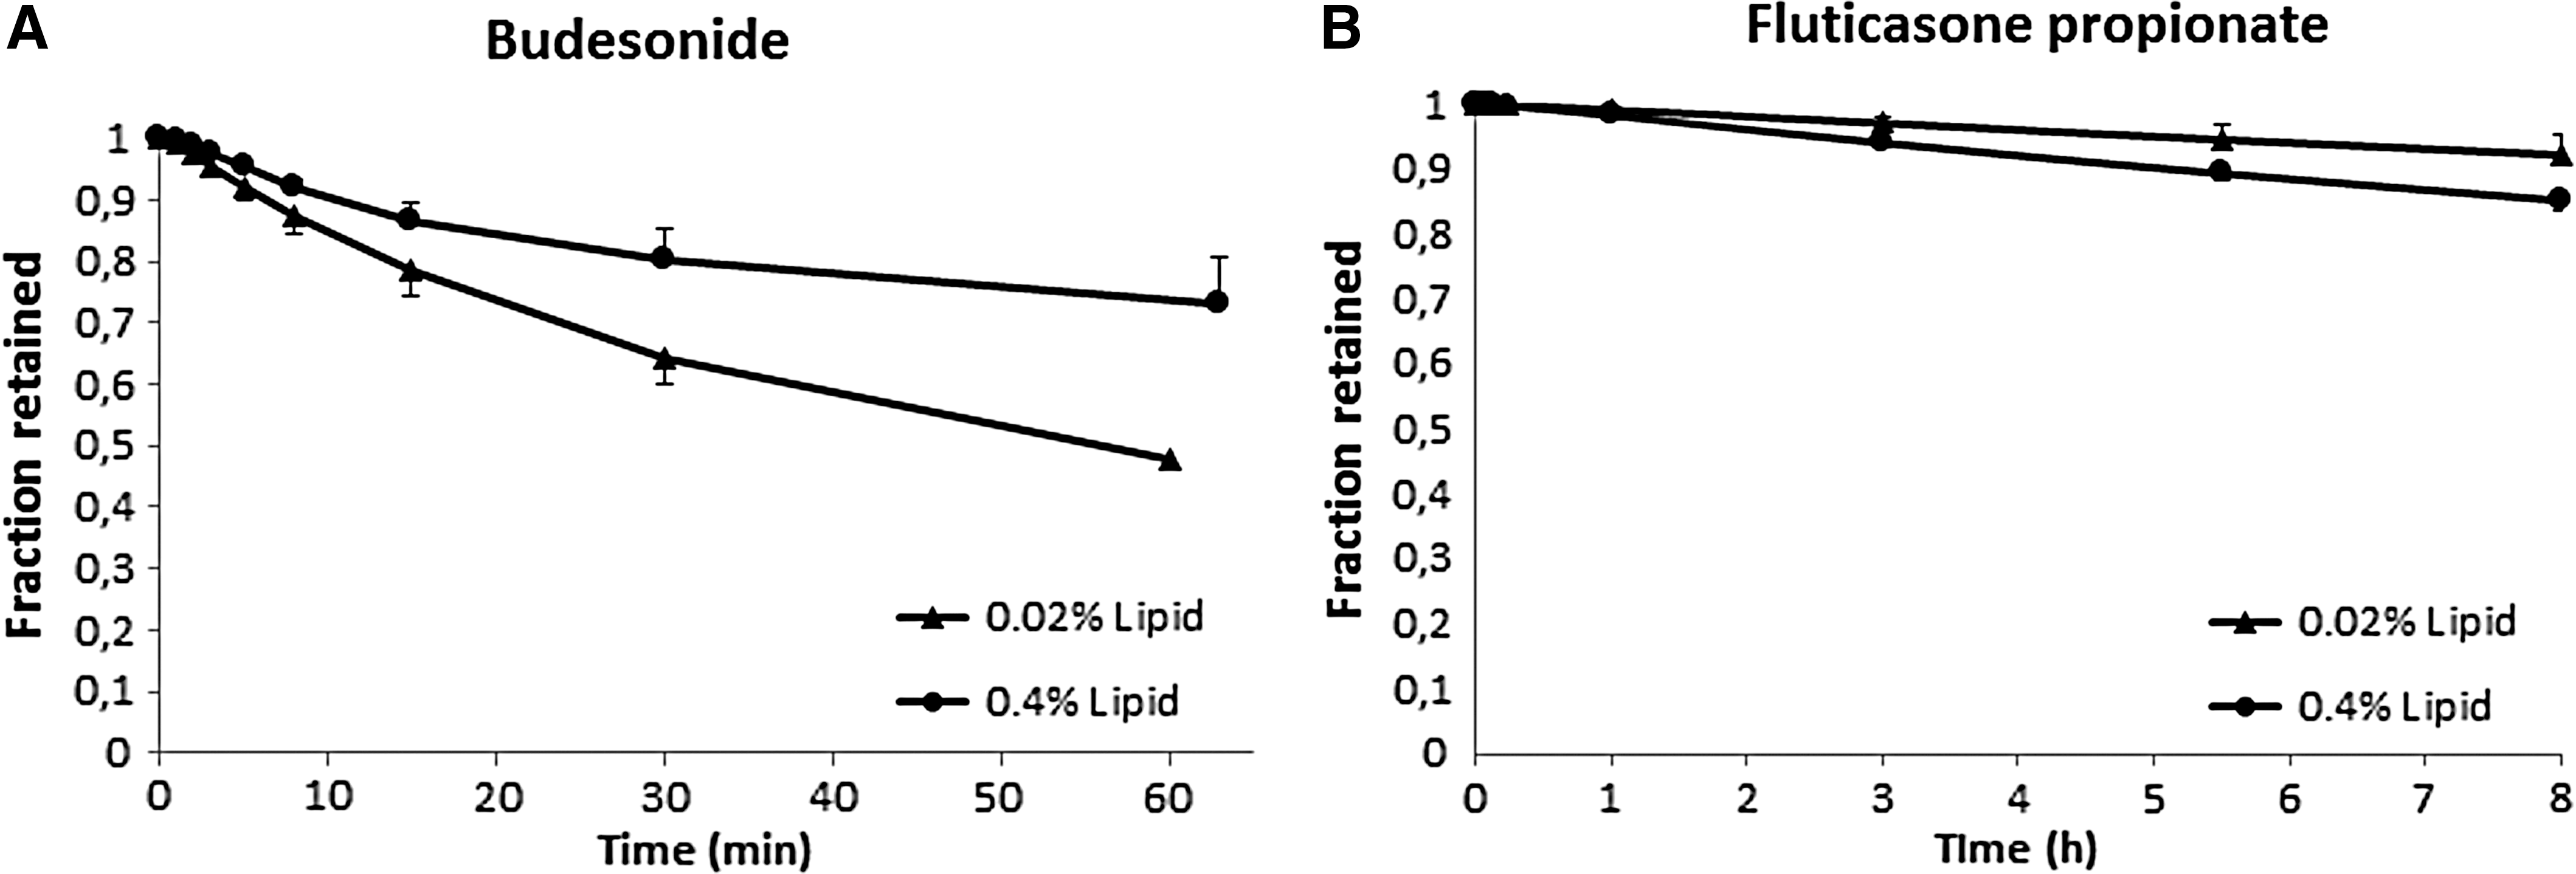
Fractional retention curves. The fractional retention of drug in the dissolution chamber as a function of time. Two different phospholipid concentrations in the gel were compared: 0.02%, and 0.4%.
Pharmacokinetic Results of Dissolution Testing in DissolvIt
Determination of initial coating on cover slips from extraction of representative cover slips.
Determination of initial coating on cover slips from post-dissolution mass balance.
BD, budesonide; e, extrapolated; FP, fluticasone propionate; m, measured; n.a., not applicable.
For FP with 0.4% lipid in the gel, Cmax and tmax were taken directly from the concentration curves. For the 0.02% lipid in the mucus simulant, the concentration curves of FP did not exhibit a distinctive peak, so tmax could not be determined (Fig. 6). The t1/2 of the fraction retained was extrapolated from the existing measuring points (mono-exponential decay) (Fig. 7). For both BD and FP, there was a statistically significant difference in the fraction of substance retained in barriers containing mucus simulant of different lipid content (P < 0.05, one-sided Student t-test). For BD, absorption was slower for the higher lipid content of 0.4%; whereas for FP, absorption was slightly faster for the higher lipid content.
The disappearance of the drug particles under the microscope is shown in Figure 8. With BD, virtually all particles were completely dissolved within 30 min. FP dissolved much more slowly, and numerous larger agglomerates remained undissolved at 8 h.
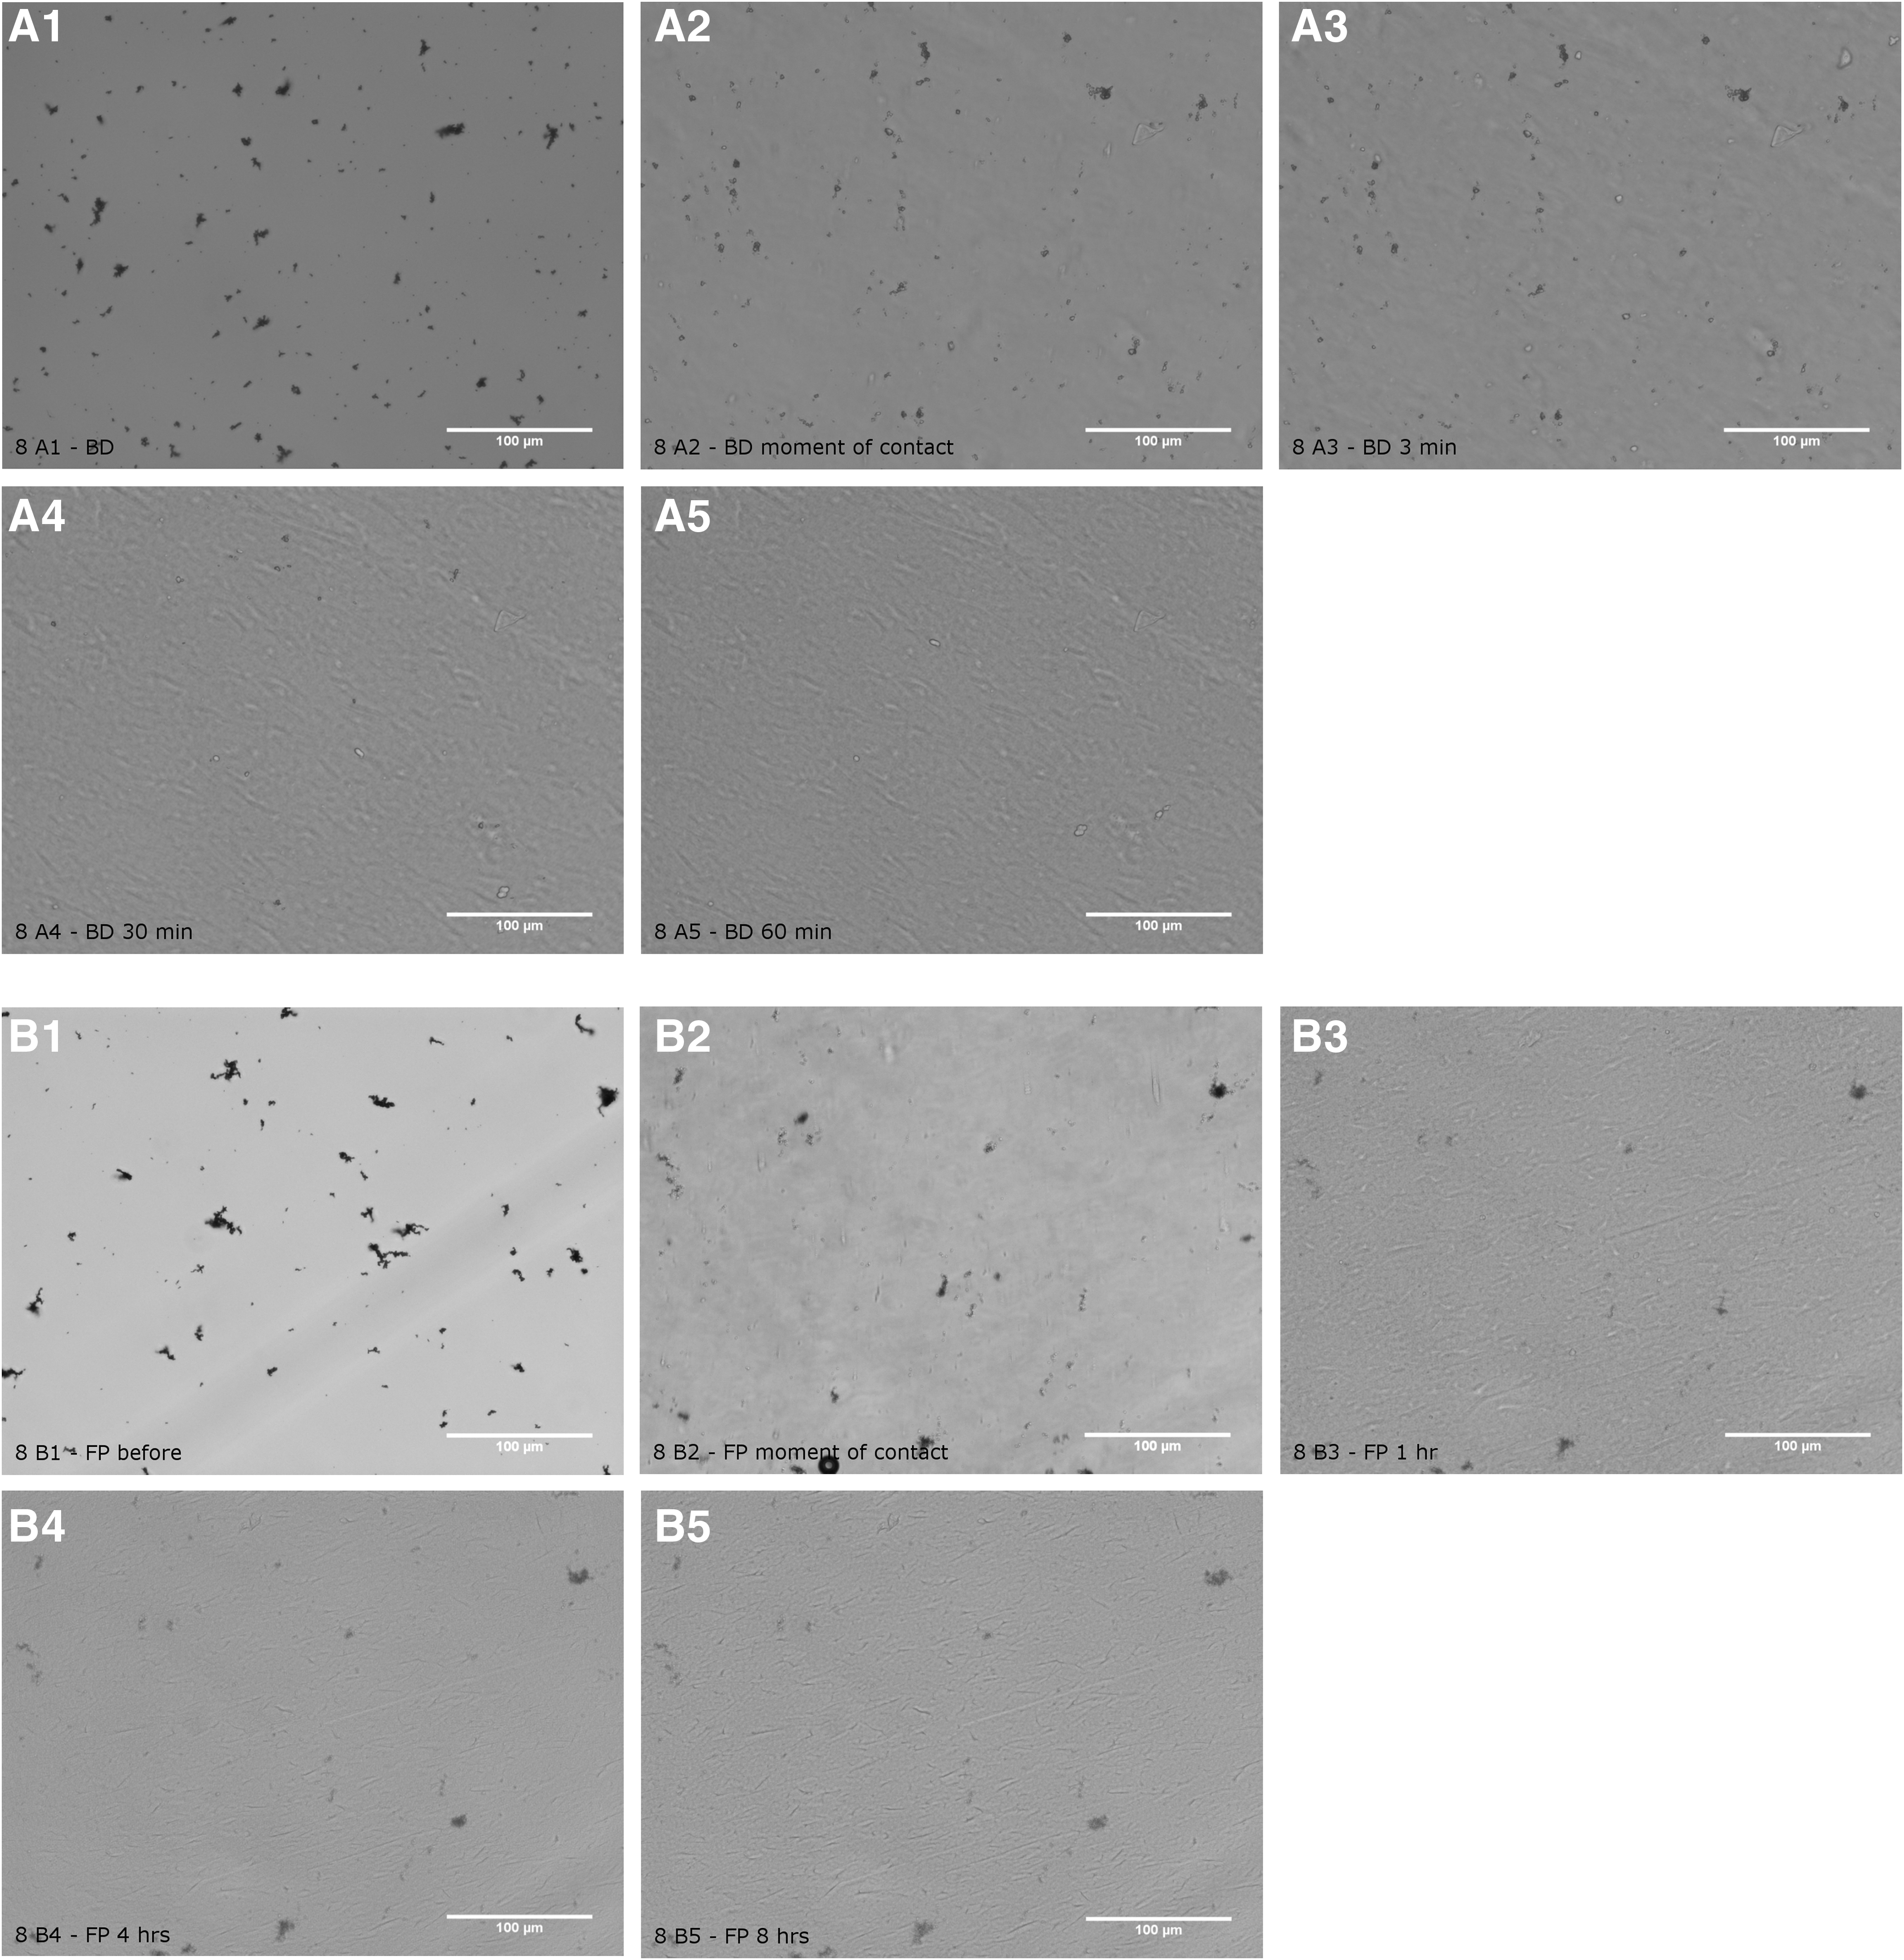
Optical results. Optical microscopy pictures from the ×20 objective taken during the DissolvIt experiment with 0.02% lipid.
Discussion
The DissolvIt method can be used to simulate the coupled dissolution and absorption of inhaled dry powder drugs in the lungs. The different shapes of the BD and FP dissolution profiles generated show that the method can be used to rank test formulations based on dissolution rate. The dissolution data of the tested substances have general appearances that resemble corresponding drug absorption curves from the lungs to the circulation, both in clinical trials 20 and in data from the isolated and perfused rat lung (IPRL). 21 Despite the general resemblance of the DissolvIt diffusion-absorption barrier with the biological original, it cannot simulate the full complexity and variability of the pulmonary air-blood barrier. However, it may provide an instrument for ranking different drug formulations based on their dissolution profiles and associated pharmacokinetic parameters such as Cmax and tmax, and for gaining greater insights into the critical coupling between dissolution and absorption of sparingly soluble drugs in the lungs.
Compared with the physiology of the lungs, it is evident that the 60 μm DissolvIt air-blood barrier simulates the absorption kinetics in the trachea and larger bronchi rather than the thinner barriers in the rest of the bronchi and alveoli. Therefore, when used as a general tool for lung dissolution, DissolvIt is likely to overestimate the half-life of retention of most test formulations. Sparse in vivo data exist, but the highly lipophilic hydrocarbon benzo(a)pyrene has a rapid 2.4 min half-life of absorption in the alveolar region of the dog, 22 whereas absorption in the bronchi proceeds with a half-life of 73 min 23 at sub-saturation exposures. For BD, the data in this study can be compared with dry powder exposures of the IPRL. 24 The air-blood barriers of the rat lung are considerably thinner than the DissolvIt barrier. This may be one factor contributing to the slower 1–4 h half-time of retention in the DissolvIt compared with the corresponding half-life of absorption of BD in the IPRL of 40 min. The corresponding figure for tmax was 2.2 min for IPRL and an average of 3 min for DissolvIt. However, when compared as surface density of particle deposition, the dose to DissolvIt is generally much higher than the dose delivered to real lungs. A much higher surface dose means that the dissolution plumes surrounding the deposited particles may begin to merge and interfere, which, in turn, will prolong the absorption process. In the future, we plan to further investigate to what extent the density of particles affects dissolution, for formulations of different lipophilicity.
When interpreting the results, it is important to understand how lipophilic drugs are transported in lipid-aqueous media. It is likely that the observed differences in transport rates between barriers of different lipid contents are linked to the transport of lipophilic diffusants in a lipid-aqueous heterogeneous medium. The addition of lipids to an aqueous barrier greatly affects the transport of a highly lipophilic solute in that barrier. 18,25 When comparing the absorption rates of the two barriers with different lipid content, it is important to note that the absorption of rapidly dissolved BD is an essentially non-stationary process, whereas the absorption of largely undissolved FP particles proceeds as a quasi-steady-state process. This may explain the reversed order of the absorption rates observed for the two substances in barriers with different lipid content (Fig. 7).
The dissolution and absorption of an inhaled dry powder drug from the lungs after bolus exposures can be simulated in vitro by using several different methods (Table 3). The kinetics of the dissolution-absorption process can be characterized by some key parameters: (1) the Cmax and tmax of the dissolved solute appearing in either the DissolvIt perfusate or the systemic circulation, (2) the corresponding retention of undissolved drug particles in the DissolvIt dissolution chamber or in lung tissue, and (3) the characteristic overall retention half-time of substance in the lungs after exposure (t1/2). It is with increasing complexity that the entire array of parameters can be simulated in vitro. The retention half-time can be simulated with all methods, but there may be differences in how the method is able to differentiate quantitatively between widely varying solubilities. A Cmax and tmax reasonably mimicking clinical data seem to require a stagnant diffusion barrier between particles and the streaming perfusate liquid that is of physiological dimensions and properties. The particle disappearance measurement requires microscopic methods that do not disturb the physiology of the dissolution method. To summarize, it seems that only the DissolvIt method has the potential to measure all three key parameters, however, at the expense of a more complicated method.
Comparison of DissolvIt with Some Published Methods for Measuring Pulmonary Dissolution of Drugs
USP 2 (Salama et al. 7 ).
Davies and Feddah. 3
Franz Cell (Salama et al. 7 ).
Transwell (Rohrschneider et al. 6 ).
Freiwald et al. 26
DP, disappearance of particles; t1/2, retention half-life.
The single-pass mode of the DissolvIt flow-past cell produces data that resemble the absorption curve of a particle-associated solute that is passively absorbed in the lungs: The concentration of a high-solubility substance in the perfusate peaks within minutes of deposition, after which the concentration decreases toward zero over a period of time. The concentration of a low-solubility substance in the perfusate increases gradually toward a plateau level and then remains there.
For low-solubility drugs, the DissolvIt may have a difficulty in establishing a ranking based on tmaxvalues only. However, the general curve appearance may also have further potential to discriminate between formulations of similar properties. Table 3 shows a comparison between DissolvIt and some of the most important published methods for measuring the dissolution of particulate drugs intended for inhalation.
The aerosol coating method gives a standard deviation between drug loads on the cover slips in the same batch of, typically, some ±20% (Table 2). For calculating overall retention in the dissolution chamber, it is important that a complete mass balance be achieved within an SD of ±10%. This reliability may allow for the use of simpler light dispersion methods when quantitating initial drug coating, rather than using more time-consuming and sample-wasting chemical analytical methods.
Light microscopy was chosen as the method of dissolution measurement, primarily because of its flexibility. One obvious drawback with the method is the theoretical limit of resolution around 0.2 μm. However, for most inhaled aerosols of drugs, the vast majority of their mass resides in disperse particles, or agglomerates much larger than 0.2 μm. The SEM method is one alternative. However, to improve substantially on the limit of resolution over the optical microscope, the SEM sample needs to be dry and observed under vacuum. 26 Compared with dissolution tests on aerosols of distinct size classes that have been separated by a cascade impactor, where dissolution is studied on one size class at a time, 2 the DissolvIt dissolution test allows tests on polydisperse aerosols that are more typically found on the airway mucosa.
The quality of DissolvIt as a predictable dissolution ranking tool has been validated in parallel non-publishable studies. We will work on performing such studies with no restraint of publication. DissolvIt is under further investigation regarding the correlation with ex vivo–in vivo data.
The main idea of DissolvIt is to mimic the physiology of drug dissolution in the lungs and to separate the dissolution from the coupled absorption step. The dynamic structure of the system, with the blood simulant buffer pumped in single-pass mode through the dissolution cell, enables the generation of dissolution/absorption curves simulating the systemic pharmacokinetics of an inhaled substance. Therefore, DissolvIt may become a candidate method for investigating the IVIVC of inhaled pharmaceuticals. Such a method is in demand within inhalation drug development, and it may help to reduce, replace, and refine the use of animals in the field.
In conclusion, DissolvIt is a new in vitro dissolution test method for inhalation drugs with features that are not available in alternative in vitro dissolution methods today.
Footnotes
Acknowledgment
The authors are grateful to Rolf Nybom at the Department of Neurosciences, Karolinska Institutet for SEM pictures.
Disclosure Statement
P.G. is the founder of Inhalation Sciences and the inventor of DissolvIt and PreciseInhale. P.G., M.M., and C.-O.S. have stocks in Inhalation Sciences. The authors acknowledge AstraZeneca Ltd as well as Inhalation Sciences for financially supporting this project.