Collot M, Ashokkumar P, Anton H, Boutant E, Faklaris O, Galli T, Mély Y, Danglot L, Klymchenko AS. MemBright: a family of fluorescent membrane probes for advanced cellular imaging and neuroscience. Cell Chem Biol 2019 Feb 6 [Epub ahead of print]; DOI: 10.1016/j.chembiol.2019.01.009.
Abstract: The proper staining of the plasma membrane (PM) is critical in bioimaging as it delimits the cell. Herein, we developed MemBright, a family of six cyanine-based fluorescent turn-on PM probes that emit from orange to near infrared when reaching the PM, and enable homogeneous and selective PM staining with excellent contrast in mono and two-photon microscopy. These probes are compatible with long-term live-cell imaging and immunostaining. Moreover, MemBright label neurons in a brighter manner than surrounding cells, allowing identification of neurons in acute brain tissue sections and neuromuscular junctions without any use of transfection or transgenic animals. In addition, MemBright probes were used in super-resolution imaging to unravel the neck of dendritic spines. 3D multicolor dSTORM in combination with immunostaining revealed en-passant synapse displaying endogenous glutamate receptors clustered at the axonal-dendritic contact site. MemBright probes thus constitute a universal toolkit for cell biology and neuroscience biomembrane imaging with a variety of microscopy techniques.
Commentary:The research described involves the synthesis and characterization of a new family of plasma membrane (PM) fluorescent probes. Imaging of the PM is achievable with a variety of commercial stains, including the fluorescently labeled lectins such as wheat germ agglutinin (WGA), hydrophobic probes, and “Cell Mask” stains (Thermo Fisher Scientific). However, the family of cyanine-based compounds described here (so-called MemBright probes) have several advantages over these commercial stains. The MemBright probes are based on two amphiphilic zwitterionic tails that anchor the probe to the PM. The MemBright probes form soluble quenched nanoparticles that disassemble and propagate across the PM and become highly fluorescent (see figure). Unlike currently available commercial stains, which typically require concentrations in the 1–5 μM range for use, the MemBright probes are active at nanomolar concentrations and are not rapidly internalized. The authors show applications of the MemBright probes in both live and fixed cells with excellent delineation of the PM, including cells that are near confluent, which is difficult to achieve with protein stains such as WGA. Furthermore, the MemBright probes are shown to have several applications in neuroscience, including imaging of primary neurons and astrocytes, as well as brain slices using two-photon microscopy. Certain MemBright probes can be applied to super-resolution imaging, as the fluorescence will blink after photobleaching, which supports techniques such as stochastic optical reconstruction microscopy. These new PM probes, available in six colors, ranging from orange to far red, should provide improved cell delimitation in standard cell lines as well as complex cell models and tissues. Contributed by Doug Auld.
MemBright probes and their properties. (A) Synthesis of the MemBright markers. (B and C) Absorption (B) and emission spectra (C) of MemBright probes (200 nM) in the absence (dashed lines) or presence of DOPC vesicles. (D) Turn-on mechanism of the MemBright probes.
Fragments Take a CellFy
Schulze J, Baukmann H, Wawrzinek R, Fuchsberger FF, Specker E, Aretz J, Nazaré M, Rademacher C. CellFy: a cell-based fragment screen against C-type lectins. ACS Chem Biol 2018;13:3229–3235.
Abstract: Fragment-based drug discovery is a powerful complement to conventional high-throughput screening, especially for difficult targets. Screening low-molecular-weight fragments usually requires highly sensitive biophysical methods, because of the generally low affinity of the identified ligands. Here, we developed a cell-based fragment screening assay (cellFy) that allows sensitive identification of fragment hits in a physiologically more relevant environment, in contrast to isolated target screenings in solution. For this, a fluorescently labeled multivalent reporter was employed, enabling direct measurement of displacement by low molecular- weight fragments without requiring enzymatic reactions or receptor activation. We applied this technique to identify hits against two challenging targets of the C-type lectin receptor (CLR) family: Dendritic Cell-Specific Intercellular adhesion molecule-3-Grabbing Non-integrin (DC-SIGN) and Langerin. Both receptors are involved in pathogen recognition and initiation of an immune response, which renders them attractive targets for immune modulation. Because of their shallow and hydrophilic primary binding site, hit identification for CLRs is challenging and drug-like ligands for CLRs are sparse. Screening of a fragment library followed by hit validation identified several promising candidates for further fragment evolution for DC-SIGN. In addition, a multiplexed assay format was developed for simultaneous screening against multiple CLRs, allowing a selectivity counter screening. Overall, this sensitive cell based fragment screening assay provides a powerful tool for rapid identification of bioactive fragments, even for difficult targets.
Commentary:This paper describes a cell-based assay for C-type lectin receptors (CLRs) and applies this to a fragment-based library screen. The CLRs are an important class of cell surface receptors involved with pathogen recognition and immune functions. Natural ligands bind with weak affinity, which has made construction of cell-based assays difficult. This paper focuses on Dendritic Cell-Specific Intercellular adhesion molecule-3-Grabbing Non-integrin (DC-SIGN) and Langerin, which are well characterized CLRs involved with pathogen detection and antigen presentation. In this work, a series of reporter ligands were paneled to find one suitable for construction of a fluorescent competitive displacement assay. A FITC labeled dextran (500 kDa) was selected, as this could be used at concentrations <0.025 mg/mL. The assay was established using a flow-cytometry readout, and competition with Langerin, a natural ligand of CLRs, showed a Z′ of 0.72. The assay was used to screen a 985-membered fragment library, which showed hits rates for Langerin and DC-SIGN of 5.6% and 12.3%, respectively (see figure). Validation of these hits identified 29 compounds for Langerin and 49 compounds for DC-SIGN, a rate for which the authors claim was higher than screens that applied biophysical methods. To confirm binding, a number of orthogonal assays were applied, which included a 19F R2-filtered NMR reporter displacement assay and 1H−15N HSQC NMR. In total, 43% of the Langerin hits and 68% of the DC-SIGN hits were validated by the 19F NMR method, while 72% of Langerin hits and 32% of DC-SIGN hits were validated by HSQC-NMR. However, the potency correlation between the cell and biophysical assays was poor, which may be due to the use of a multivalent dextran ligand in the cell assay leading to some avidity effects. Multiplexing different CLRs screens with fluorescently labeled ligands with flow cytometry is also demonstrated. This work provides a robust assay for CLRs and suggests a method to apply fragment-based drug discovery to cell surface receptors using competitive displacement assays with a flow-cytometry readout. Contributed by Doug Auld.
Cell-based fragment screen against DC-SIGN- and Langerin-expressing Raji cells. (A) Schematic representation of the cellFy shows a typical 96-well plate containing 8 negative controls (FITC-dextran + DMSO), 8 positive controls (FITC-dextran +10 mM mannose), and 8 wells with only DMSO for background measurements. Principle of the cell-based fragment screen: multivalent FITC-dextran binds to viable CLR-expressing cells, fragments compete the reporter binding. (B, C) IC50 evaluation of mannose competing FITC-dextran with human Langerin (IC50 = 7.6 ± 0.03 mM, Z′-factor = 0.77) or DC-SIGN-expressing Raji cells (IC50 = 1.5 ± 0.02 mM, Z′-factor = 0.88). (D, E) Cell-based fragment screen of human Langerin and DC-SIGN with 985 compounds measured at a concentration of 2 mM, identified 55 and 121 hits, respectively (green line represents the mean of the positive signal, red line represents the mean of the inhibitor control, and orange line represents the mean of the background signal). (F) The followup is exemplified with primary Langerin hit hL1: After determination of the IC50 value in cellFy, the KI value is measured in our 19F T2-filtered NMR assay. In addition, to confirm binding, CSP means were investigated in HSQC-NMR experiments. Finally, structurally similar compounds were identified as hits and clustered, further validating the compounds (vide infra).
Protein Sequencing, Almost the Way It's Done with DNA
Swaminathan J, Boulgakov AA, Hernandez ET, Bardo AM, Bachman JL, Marotta J, Johnson AM, Anslyn EV, Marcotte EM. Highly parallel single-molecule identification of proteins in zeptomole-scale mixtures. Nat Biotechnol 2018;36:1076–1082.
Abstract: The identification and quantification of proteins lags behind DNA-sequencing methods in scale, sensitivity, and dynamic range. Here, we show that sparse amino acid–sequence information can be obtained for individual protein molecules for thousands to millions of molecules in parallel. We demonstrate selective fluorescence labeling of cysteine and lysine residues in peptide samples, immobilization of labeled peptides on a glass surface, and imaging by total internal reflection microscopy to monitor decreases in each molecule's fluorescence after consecutive rounds of Edman degradation. The obtained sparse fluorescent sequence of each molecule was then assigned to its parent protein in a reference database. We tested the method on synthetic and naturally derived peptide molecules in zeptomole-scale quantities. We also fluorescently labeled phosphoserines and achieved single-molecule positional readout of the phosphorylated sites. We measured >93% efficiencies for dye labeling, survival, and cleavage; further improvements should enable studies of increasingly complex proteomic mixtures, with the high sensitivity and digital quantification offered by single-molecule sequencing.
Commentary: Detection and quantification of low-abundance nucleic acids (DNA or RNA transcripts) has become a reality thanks to tremendous advances in deep sequencing through the generation of multiple parallel reads to enable digitization/counting of unique sequences. The same has not been applied to proteins where, despite huge advances in mass spectrometry, the detection of low-abundance proteins in complex proteome samples numbering tens of thousands of species has remained a challenge. The present work aims to bring the power of nucleic acid sequencing to the world of proteins. The team applied a clever combination of Edman's N-terminal degradation, surface capture, fluorescent tag incorporation, and high-resolution imaging to enable the monitoring of step-wise cleavage of amino acids from peptides/proteins, which in turn enabled the discernment of the identity of the components. Careful selection of fluorophores to ensure stability during the harsh conditions of Edman chemistry and fluorophore coupling strategies to ensure attachment of fluorophores at select amino acids within the proteome (e.g., thiol coupling to tag cysteines) were performed by the team. Additional technology development was required in order to combine the Edman chemistry and the instrumentation to process glass slides (see figure). After site-specific labeling of the sample with fluorophores, the peptides/proteins were attached to a glass surface, and the Edman degradation sequence was applied, while the fluorescent single-molecule spots were monitored. The reduction in fluorescence associated with the cleavage of a fluorescently labeled amino acid was noted and compared to reference patterns. Through successive rounds of experiments with increasing stringency, the authors demonstrated the overall concept, as well as the identification of a specific protein in a mixture and the single-molecule sequencing of serine phosphorylation sites on RNA polymerase II. The approach presented carries a lot of promise, and further optimization of the fluorophores and coupling strategies might make single-molecule protein sequencing a reality. Contributed by Anton Simeonov.
Overview of single-molecule fluorosequencing. (a) Summary of the approach for protein and peptide analyses. (b) Peptides are covalently labeled with amino acid–specific fluorescent dyes and immobilized in a TIRF single-molecule-microscope stage perfusion chamber. Through TIRF, each peptide is imaged, and its N-terminal amino acid is chemically removed via Edman degradation, thus leaving each peptide one amino acid shorter and regenerating its free N terminus. Repeated cycles of chemistry (each removing one amino acid) and imaging reveal the positions of fluorescent dyes within each molecule. Millions of individual peptide molecules can be analyzed in parallel at reasonable attachment densities, shown for approximately 3 million peptides in an approximately 1.3 × 5 mm area of the coverslip. Bullet indicates TMR conjugated to cysteine; diamond indicates Atto647N conjugated to cysteine; gold nanowires serve as fiducial markers. (c) Even a relatively modest amino acid–labeling scheme can be sufficiently information rich to identify proteins, as illustrated by a calculation of the proportions of human proteins in specific subcellular compartments (defined by Gene Ontology Cellular Component annotations; numbers indicate protein counts) that are uniquely identifiable with a two-color code. Each curve plots coverage of uniquely identifiable proteins as a function of read length (Edman cycles performed), considering the scenario of labeling only cysteines and lysines on peptides formed by GluC proteolysis, which cleaves after glutamate or aspartate. ER, endoplasmic reticulum.
Improved Oncolytic Virus
Xu B, Ma R, Russell L, Yoo JY, Han J, Cui H, Yi P, Zhang J, Nakashima H, Dai H, Chiocca EA, Kaur B, Caligiuri MA, Yu J. An oncolytic herpesvirus expressing E-cadherin improves survival in mouse models of glioblastoma. Nat Biotechnol 2019;37:45–54.
Abstract: The efficacy of oncolytic herpes simplex virus (oHSV) is limited by rapid viral clearance by innate immune effector cells and poor intratumoral viral spread. We combine two approaches to overcome these barriers: inhibition of natural killer (NK) cells and enhancement of intratumoral viral spread. We engineered an oHSV to express CDH1, encoding E-cadherin, an adherent molecule and a ligand for KLRG1, an inhibitory receptor expressed on NK cells. In vitro, infection with this engineered virus, named OV-CDH1, induced high surface E-cadherin expression on infected glioblastoma (GBM) cells, which typically lack endogenous E-cadherin. Ectopically expressed E-cadherin enhanced the spread of OV-CDH1 by facilitating cell-to-cell infection and viral entry and reduced viral clearance by selectively protecting OV-CDH1-infected cells from KLRG1+ NK cell killing. In vivo, OV-CDH1 treatment substantially prolonged the survival in GBM-bearing mouse models, primarily because of improved viral spread rather than inhibition of NK cell activity. Thus, virus-induced overexpression of E-cadherin may be a generalizable strategy for improving cancer virotherapy.
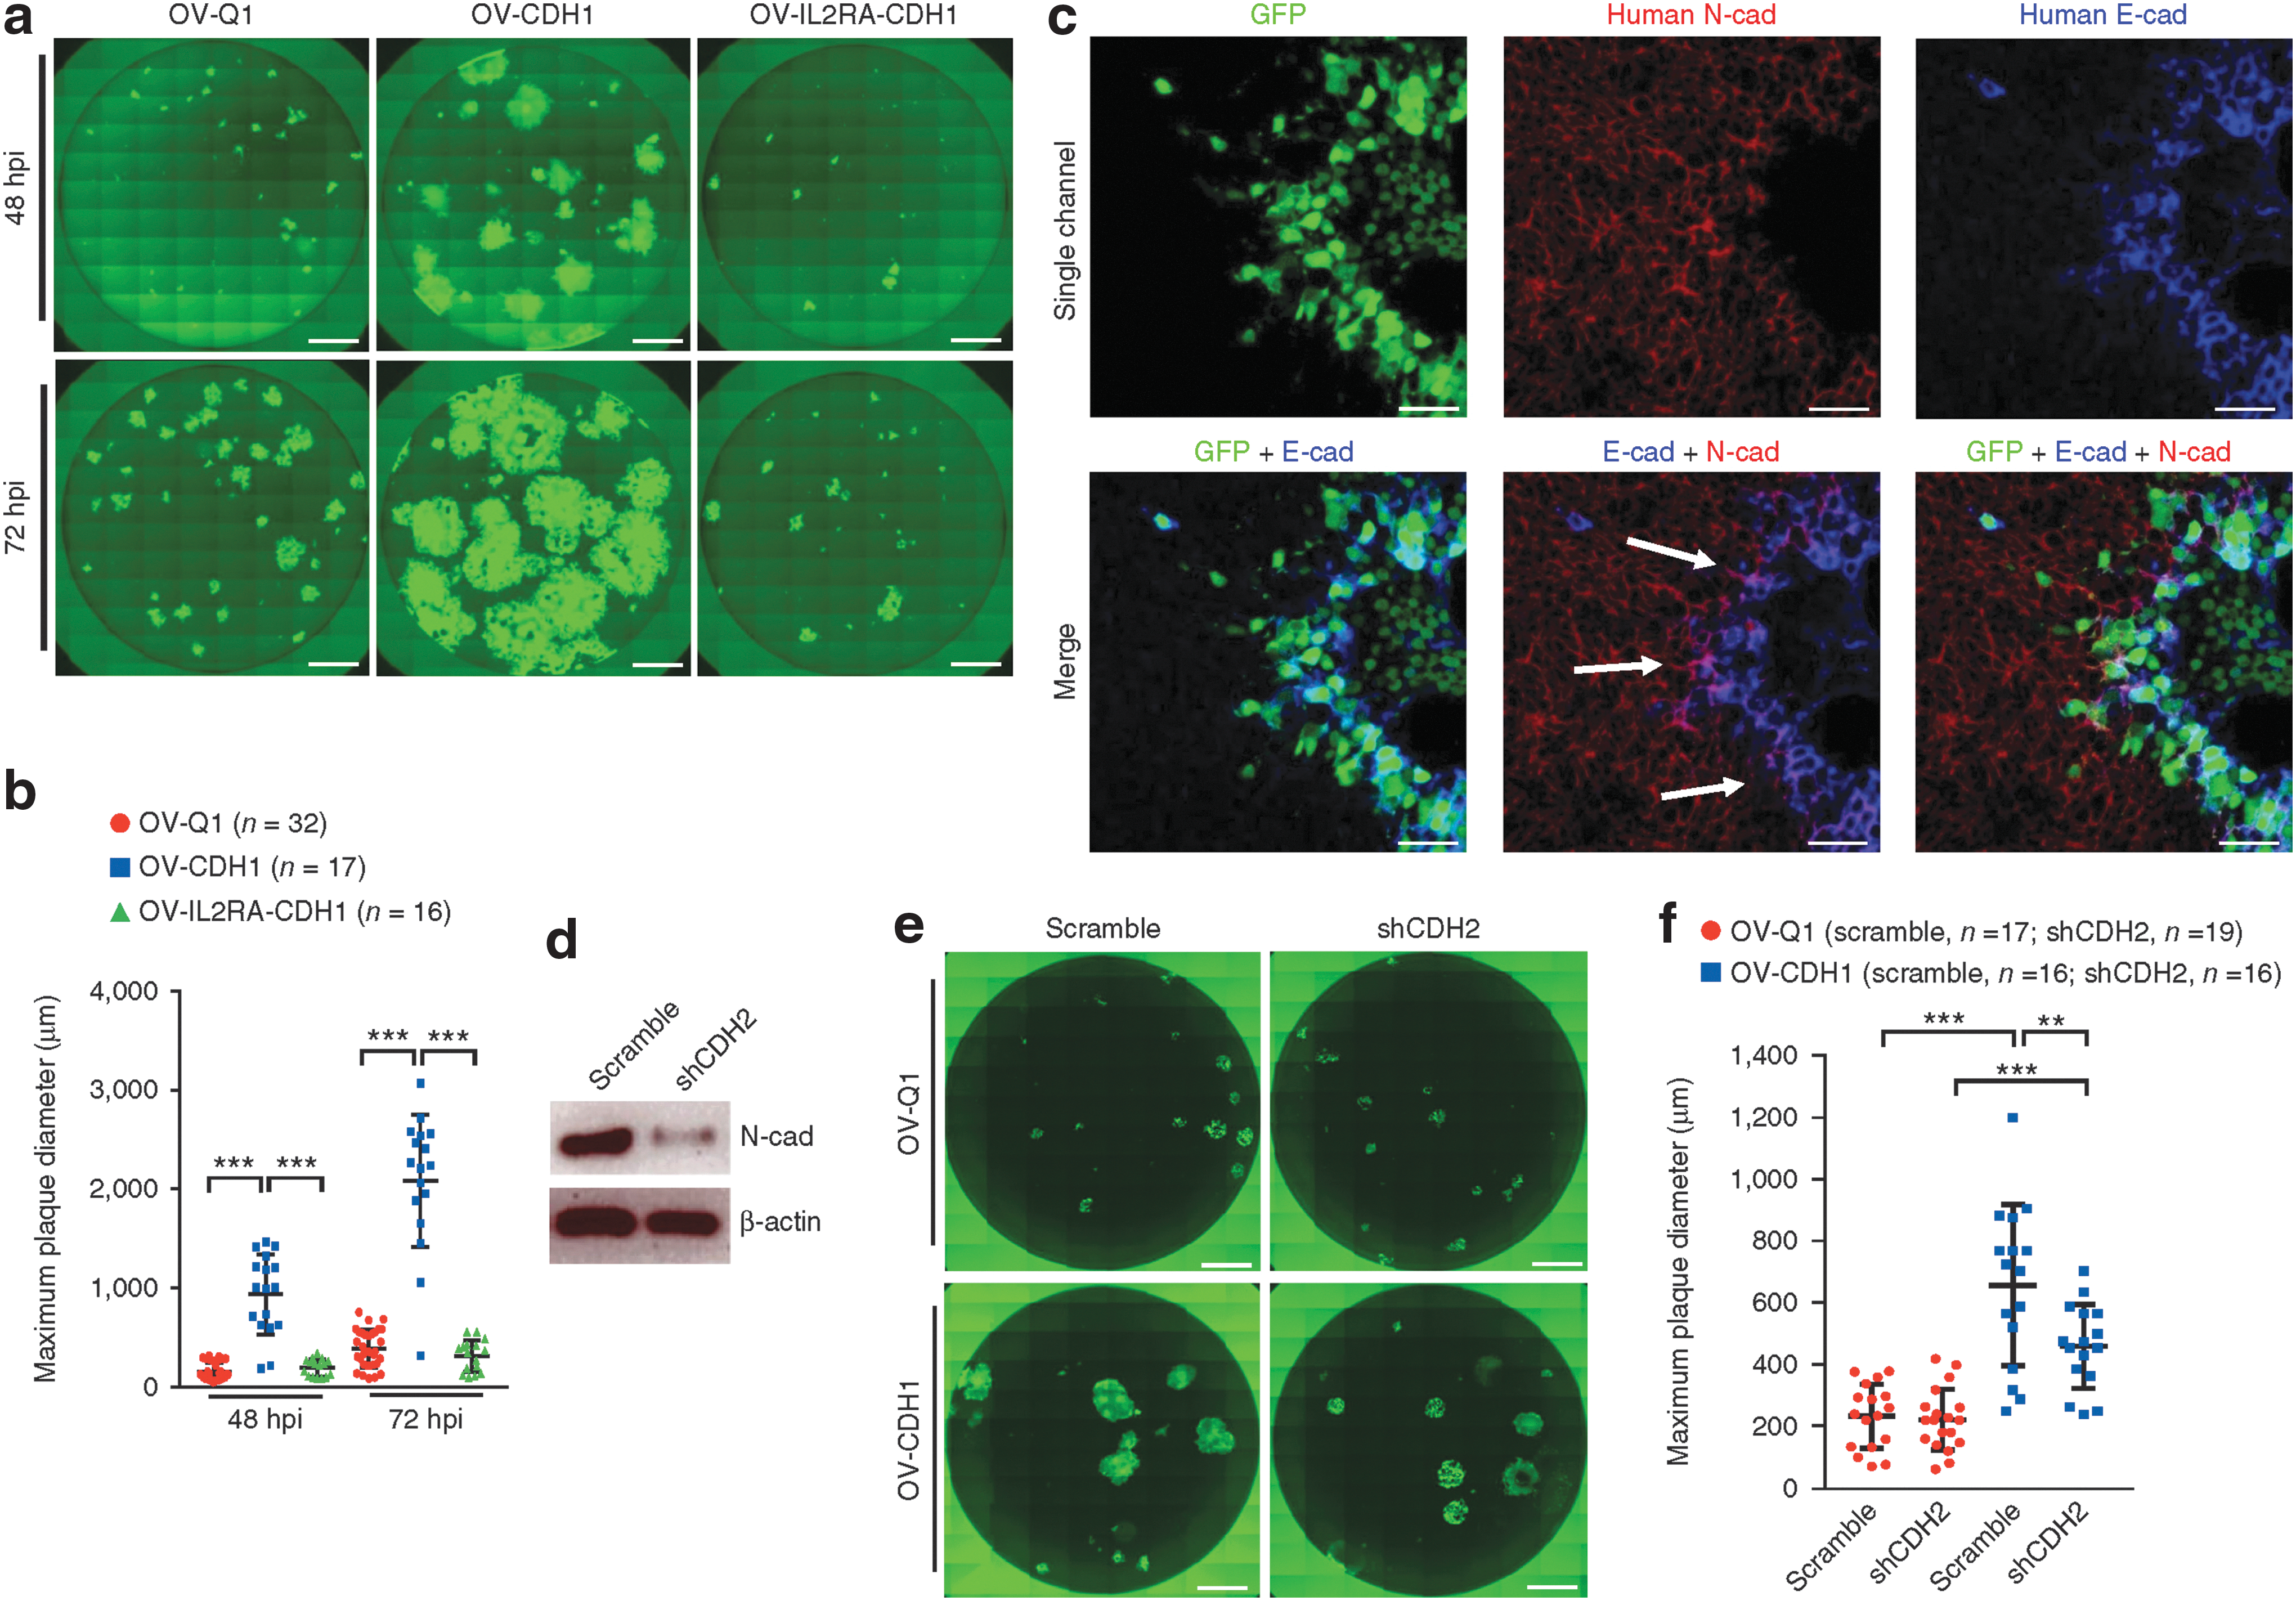
Commentary: Oncolytic viruses are designed to infect cancer cells and destroy them in a highly selective manner. Even though the first such therapeutic product, based on human herpes simplex virus, was approved several years ago, the noted limitations of the approach, namely, rapid clearing of the virus and its limited spreading through the tumor, have dampened the enthusiasm in this field. The report by Xu et al. addresses some of the deficiencies by demonstrating that the engineering of an E-cadherin expression endows the oncolytic virus with two beneficial traits. First, E-cadherin, through its calcium-dependent promotion of cell–cell contacts, acted to enhance virus infectivity. Second, E-cadherin binding to killer cell lectin-like receptor G1 (KLRG1) acted on an inhibitory axis to suppress attack by natural killer (NK) cells, thus reducing the rate of elimination. After incorporating the E-cadherin gene into the viral genome, the authors performed extensive studies to demonstrate that the new virus expresses E-cadherin as part of its membrane and exhibits enhanced spreading through cell–cell contact, reduced clearance (see figure) and, ultimately, an improved efficacy in three different glioblastoma mouse models (figure 5 of the paper). After limited safety evaluation in a murine model was presented as part of the present report, this improved oncolytic virus is poised for further safety profiling in multiple species and, hopefully, a demonstration of superiority in human. Contributed by Anton Simeonov.
Cadherin interaction facilitates cell-to-cell infection by OV-CDH1. (a) Monolayer U251 cells in 96-well plates were infected with OV-Q1, OVCDH1 and OV-IL2RA-CDH1. Infection media were replaced with semi-solid media containing 1.2% methylcellulose at 2 hpi. Cells were then imaged at 48 and 72 hpi with a fluorescence microscope. Scale bar, 1,000 μm. (b) Quantification of plaque diameter in a. Data are presented as mean ± s.d., ***P < 0.001 by one-way ANOVA with Holm's multiple comparisons test. Sample sizes are indicated in the figure. (c) U251 cells were infected with OV-CDH1. At 48 hpi, cells were blocked and incubated with anti-E-cadherin (E-cad) and anti-N-cadherin (N-cad) antibodies, followed by fluorescent secondary antibody staining. Cells were observed under a confocal microscope. Scale bar, 50 μm. The experiments in a–c were repeated 5 times with similar results. (d) Expression of N-cadherin in Gli36 cells was knocked down with shRNA (shCDH2). N-cadherin protein was measured by immunoblotting. (e) Monolayer Gli36 cells with or without N-cadherin knockdown were seeded in 96-well plates and infected with OV-Q1 or OV-CDH1 at a MOI of 0.005. Cells were imaged using a fluorescence microscope 48 hpi. Scale bar, 1,000 μm. (f) Quantification of plaque diameter in e. Data are presented as mean ± s.d. Scramble-OV-Q1 vs. scramble-OV-CDH1 ***P < 0.001; shCDH2-OV-Q1 vs. shCDH2-OV-CDH1 ***P < 0.001; scramble-OV-CDH1 vs. shCDH2-OV-CDH1 **P = 0.002. One-way ANOVA with Holm's multiple comparisons test. Sample sizes are indicated in the figure. Experiments in d–f were repeated 3 times with similar results. All images in a and e are stitched images.