




Abstract
Present communication deals with the stabilization of etoricoxib nanosuspension using Acacia chundra gum and its acrylamide-grafted and carboxymethylated copolymers. Acrylamide grafting and carboxymethylation of A. chundra gum were carried out and synthesized copolymers were characterized. Ultrasound-assisted solvent—antisolvent method was utilized to co-precipitate the stabilizers over etoricoxib nanoprecipitates. A 32 full factorial design was used to evaluate the effect of independent variables, that is, the concentration of drug and stabilizer over the dependent variables, that is, particle size (PS), and entrapment efficiency (EE%) of nanoparticles. The effect of process parameters over super saturation, nucleation, and PS were studied and the role of mixing and ultrasound radiation was correlated. FTIR, DSC, and 1H NMR analysis showed a significant difference between the copolymers. The application of stabilizers leads to the synthesis of small, spherical, no aggregated, and composite nanoparticles. PS growth analysis after 45 days showed no sign of “Ostwald repining” and aggregation. Optimized formulations prepared using A. chundra gum (formulation K9), acrylamide-grafted (formulation A8), and carboxymethylated (formulation C1) copolymers showed t 80% in 190, 270, and 170 min, respectively. Cytotoxic studies showed that the formulation A8 had better control over cell growth than the pure drug against MCF-7 cell line. The results indicated that the A. chundra gum and its acrylamide and carboxymethylated copolymers can be easily synthesized and utilized for the fabrication of stabilized nanosuspension.
Introduction
Nonsteroidal anti-inflammatory drugs (NSAIDs) are used for antipyretic and analgesic effects. NSAIDs have significant anticancer activity and reduce mortality of various cancers. Overexpression of cyclooxygenase-2 (COX-2) promotes carcinogenesis and tumor proliferation. 1 COX-2 inhibitors have better anticancer activity than COX-1 inhibitors. 2 Selective COX-2 inhibitors control tumor growth by antiangiogenic and proapoptotic effects. However, the anticancer effect of COX-2 inhibitors is less than the conventional anticancer agents. Anticancer efficacy of NSAIDs can be improved by the enhancement of solubility due to the increased bioavailability.
For effective therapy, a higher dose of NSAIDs is required, which can cause gastric irritation. 3 The melting point of etoricoxib is 126°C, indicating its high crystal energy leading to its low aqueous solubility. Oral delivery of poorly water-soluble drugs is a major hurdle for formulation scientists. The micronization approach is used to enhance solubility of poorly aqueous soluble drug. 4,5
Solvent-antisolvent method (SAM) is an important top-down approach for the synthesis of nanoparticles. Selection of an appropriate solvent to solubilize the drug and antisolvent to precipitate the drug is a key challenge of bottom-up method. An ideal antisolvent should have good miscibility with the solvent. SAM is a simple and effective approach to produce nanoparticles with small size, narrow size distribution, and unimodal dimension. 6 This technique is a simple, cost-effective, potential to scale-up and does not require specific equipment to synthesize nanoparticles. This technology is used by pharmaceutical manufacturers such as Novartis and Abbott to develop Sucker and NanoMorph®, respectively. 7 Maintaining nanoprecipitate size and prevention of crystal growth are key challenges of this method. Water-soluble polymers such as polyvinylpyrrolidone and hydroxypropyl methylcellulose are recommended to prevent crystal growth. 8 Nanoparticle size depends on mixing rate, drug and stabilizer concentration, solvent to antisolvent ratio, and rate of evaporation of antisolvent.
In the EASAI technique, the precipitate formation is controlled by controlling rate of solvent evaporation. Organic solvents having a low boiling point are selected to dissolve the drug, which is further injected into the antisolvent maintained above the boiling point of the solvent. The bottom-up process requires energy less than the top-down process 8 and the nanoparticles are formed in a single step. The drug is entrapped in polymer precipitate. Quintanar-Guerrero et al. reported nanoparticle formation due to the interfacial turbulence initiated at the solvent-antisolvent interface. This is known as Marangoni effect caused by the combined effect of flow, diffusion, and surface tension. 9
Several polymers have been investigated to stabilize the nanoprecipitates formed by SAM. Natural gums possess various useful properties, such as readily obtainable, hydrophilicity, biodegradable, biocompatibility, cost-effective production, nontoxic, and stable into broad range of pH, and thus are ideal for the use in biomedical and health care applications. To impart the enviable properties, these naturally occurring polysaccharides can be easily modified chemically or biochemically. Kheri gum (Acacia chundra, family: Mimosaceae) is a water-soluble polymer. It is also known as hydrocolloids. 10 Kheri plant is widely found in the Gujarat and Rajasthan regions of India. It is used as a substitute for Acacia gum. Carbohydrate is the major component of Kheri gum, while volatile oil and fats are absent. 11
In this study, Kheri gum polysaccharide (KGP), acrylamide graft copolymer of Kheri gum (KGP-g-Am), and carboxymethyl derivative of Kheri gum (CMKGP) were synthesized and further used to stabilize etoricoxib-loaded nanoformulation. Modified supramolecular polysaccharide biomaterials may improve the solubility of drug and open a new area in pharmaceutical and biomedical science.
The purpose of this investigation was to stabilize etoricoxib nanosuspension using A. chundra gum, and its acrylamide-grafted and carboxymethylated copolymers. To achieve this objective, etoricoxib-loaded nanosuspensions were synthesized using ultrasound-assisted solvent/antisolvent method (UASSM). The effect of drug and stabilizer concentration on particle size (PS) and entrapment efficiency (EE%) was examined. The synthesized nanosuspensions were subsequently characterized for FTIR, DSC, 1 H NMR, morphology, and in vitro drug release profile. In vitro cytotoxic study was carried out to examine control over cell growth against MCF-7 cell line.
Materials and Methods
Materials
Etoricoxib was received as a gift sample from Cipla Ltd. (Mumbai, India). Acrylamide (Am) and ceric ammonium nitrate (CAN) were procured from Merck Specialties Pvt. Ltd. (Mumbai, India). Ethyl alcohol and acetone were supplied by S.D. Fine Chemicals (Mumbai, India). Double distilled water was used throughout the study. Purification of crude KGP was done using a water-based extraction process as reported earlier. 10
Methods
Synthesis of KGP-g-Am
Microwave-assisted free radical polymerization was carried out to synthesize KGP-g-Am. 10 –13 Briefly, the polysaccharide and acrylamide solutions were prepared by dissolving KGP (1 g) and acrylamide (6 g) in 30 and 25 mL of water, respectively. Acrylamide solution was poured into the polysaccharide and stirred at 200 rpm for 1 h. CAN solution was prepared in water (Table 1). Free radical generation was initiated by the addition of freshly prepared CAN solution into the acrylamide solutions-polysaccharide. The solution was stirred for 30 min at 150 rpm, kept overnight, and microwaved (100 W) for required time intervals at 30 s heating and 30 s cooling cycles (Table 1). The microwaved mixture was allowed to attain room temperature (25°C), precipitated using acetone, washed with alcoholic solution (ethanol: water in the ratio of 20:80), and dried at 40°C. The product was powdered, sieved (20# sieve), and stored at 25°C ± 2°C till further use.
Synthesis of Acrylamide Graft Copolymers of Kheri Gum Polysaccharide and Carboxymethylated Kheri Gum Polysaccharide
CAN, ceric ammonium nitrate.
Synthesis of CMKGP
An accurately weighed amount of KGP was dissolved in 4 mL water (Table 1). The solution was stirred for 15 min using a magnetic stirrer at 70°C ± 1°C. The solution was cooled to 25°C ± 1°C. Twenty-five milliliters of sodium hydroxide solution (56% w/v ice cooled) was poured into previously prepared polymer solution and kept at 15°C for 1 h. Ten-milliliter monochloroacetic acid solution (50% w/v) was added drop wise into KGP-sodium hydroxide solution and stirred for 1 h. The temperature was increased slowly up to 65°C. The obtained wet mass was microwaved (100 W, 30 s heating and 30 s cooling) for different time intervals (Table 1). Furthermore, it was washed with methanol and the pH was adjusted to 7 using glacial acetic acid. The product was dried, powdered, sieved (60# sieve), and stored at 25°C ± 2°C till further use. 14,15
Characterization of KGP, KGP-g-Am, and CMKGP
From the group of synthesized acrylamide graft copolymers of KGP, formulation AKG1 had maximum grafting, grafting efficiency, conversion, and grafting ratio. Based on these results, formulation AKG1 and formulation CKG1 were further used in nanoparticle preparation.
Infrared spectroscopy
The modification was proved using FTIR spectral analysis of KGP and its derivatives. The FTIR spectral analysis was carried out using Bruker ATR equipment (Alpha, ECD-ATR; Bruker Peoria, IL). Dried powdered samples were placed in the analyzer plate of ATR. The spectrums were recorded in the transmittance mode from 4,000 to 600 cm−1 with 66 scans and 2 cm−1 resolution. 16
Thermal analysis
Thermal analysis of KGP, KGP-g-Am (AKG1), and CMKGP (CKG1) was carried out using DSC-60, Shimadzu (Kyoto, Japan). The analysis was carried out from 0°C to 300°C under nitrogen atmosphere (heating rate 10°C/min and nitrogen purging rate 50 mL/min). 17
1 H NMR study
NMR spectra of KGP, KGP-g-Am (K1), and CMKGP (CKG1) were obtained by a Bruker 800 MHz NMR spectrometer ( 1 H 800 MHz) (Bruker, Rheinstetten, Germany) using dimethyl sulfoxide (DMSO) as a solvent. 18
Morphological characterization
Morphological analysis of gold-coated KGP, KGP-g-Am (AKG1), and CMKGP (CKG1) samples was carried out under argon atmosphere using a scanning electron microscope (SEM), EVO-18, ZEISS (Birmingham, United Kingdom). The sample coating was carried out using a JFC 1600 auto fine coater. 19
Solubility study
The spectrometry technique (1800; Shimadzu) was used to determine the solubility of KGP, AKG1, and CKG1. Calibration plot method was utilized for the determination of solubility. The KGP, AKG1, and CKG1 samples (50 mg each) were dissolved in distilled water (20 mL). The solutions were stirred using a magnetic stirrer for 15 min at 100 rpm, centrifuged, and filtered to determine solubility.
Preparation and Characterization of Nanoparticles
Preparation of nanoparticles
Etoricoxib-loaded nanoparticles were synthesized using novel UASSM. KGP, KGP-g-Am (AKG1), and CMKGP (CKG1) were used as stabilizers. The solution of polymer (250 mL) and drug (5 mL) was prepared in water (antisolvent) and acetone (solvent), respectively. The solutions were filtered, transferred into a conical flask, and heated up to 70°C. One milliliter drug solution was transferred to the polymer solution and stirred for 15 min at 300 rpm. The mixture was sonicated for 25 s to prevent particle aggregation and to synthesize nanoparticles. 20
Optimization studies
A full 32 factorial design was used to synthesize and optimize nanoparticles. The drug and polymer concentrations were selected as independent variables. The PS and EE% were selected as dependent variables. Three levels were selected for each independent variable (Table 2). Results of response (dependent variables) were analyzed using NCSS software (trail version 12.0). The reduced equation to measure the response (PS and EE%) having statistical significance for 32 factorial design is shown as Equation (1):
Various Formulations with the Levels of Independent Variables Used in 32 Full Factorial Design Layout in the Preparation of Nanoparticles
K, A, and C denote formulations prepared using KGP, KGP-g-Am (AKG1), and CMKGP (CKG1), respectively.
CMKGP, carboxymethyl derivative of Kheri gum; KGP, Kheri gum polysaccharide; KGP-g-Am, acrylamide graft copolymer of Kheri gum.
where Y is the response of variables (dependent variable), b 0 is the arithmetic mean response of nine batches, and b 1 is the estimated coefficient for factor X 1. The coefficients corresponding linear effects (b 1 and b 2), interaction (b 12), and the quadratic effects (b 11 and b 22) were determined from experimental results. X 1 and X 2 are the concentration of polymer and drug, respectively.
Characterization of nanoparticles
Determination of PS and morphological characterization
The prepared nanoparticles were diluted to make a 1%v/v suspension and analyzed using zeta seizer (ZEN 3500; Malvern Instruments Ltd., Worcester, United Kingdom). Morphological analysis of gold-coated nanoparticle sample was carried out under argon atmosphere using an SEM, EVO-18 (ZEISS). The sample coating was carried out using a JFC 1600 auto fine coater. 19
Determination of percentage EE
For the determination of percentage EE, the nanoparticle suspension was centrifuged and filtered using 0.2 μm syringe tip filter. Etoricoxib in nanoparticles was estimated spectrophotometrically using UV-visible spectrophotometer (1800; Shimadzu) (n = 3). The following equation was used to calculate EE%
21
:
In vitro drug release
Etoricoxib release from the synthesized nanoparticles was determined using basket type dissolution apparatus. The nanosuspension was enclosed in a capsule shell, which acts as a biological membrane. The drug release study was carried out in 0.1 N HCl (pH 1.2) for 120 min followed by 6 h in phosphate buffer (pH 7.4). The temperature of medium was maintained at 37°C ± 0.5°C and the basket rotation was controlled at 50 rpm. Aliquots were withdrawn in triplicate at predetermined time intervals and filtered using Whatman filter paper (20 nm), and percentage drug release was calculated. 20
Kinetics of drug release
Different mathematical methods such as statistical methods (multivariate analysis of variance), model-dependent methods (zero order, first order, Higuchi's and Korsmeyer-Peppas' model), and model-independent methods (difference factor and similarity factor) are used to characterize drug release profile. 22 –24
Model-dependent approach
In this study, the model-dependent approach was applied to characterize the drug release profile of optimized formulations. To determine the release kinetics of etoricoxib, the release data were fitted according to zero-order (a plot of cumulative percentage of drug release vs. time) and first-order (a plot of log cumulative percentage of drug remaining against time) equations. Furthermore, to analyze the exact etoricoxib release mechanism from the nanoparticles, the dissolution data were plotted according to Higuchi's (a plot of the cumulative percentage of drug released vs. square root of time) and Korsmeyer-Peppas' (a plot of log cumulative percentage of drug release vs. log time) equations.
Zero-order drug release kinetics can be presented by Equation (2).
where Qt is the amount of drug dissolved at time t, Q o is the initial amount of drug in solution, and K o is zero-order release constant.
First-order release kinetics is expressed by Equation (3), where C
o is the initial concentration of drug in solution, C is the drug concentration at time t, and K is first-order rate constant.
Higuchi's equation gives steady-state drug release [Eq. (4)]. Thus, for a diffusion-controlled release mechanism, a plot of the cumulative percentage of drug released versus square root of time should be linear. The linearity of the plots can be confirmed by the calculation of correlation coefficient.
where K
H is Higuchi's dissolution constant and Q is the amount of drug diffusion to the solution at time t. Equation (5) is used to present Korsemeyer-Peppas' model of drug release.
where,
Model-independent approach using similarity factor
US-FDA suggests that if the value of similarity factor (f
2) of two different formulations lies within 50–100, the formulations have a similar dissolution profile. If the dissimilarity factor (f
1) is 0 [Eq. (6)] and similarity factor is 100 [(Eq. (7)], the dissolution profiles of two formulations are identical.
25
–27
where n is the number of time points, Rt is the dissolution value of native polymer at time t, and Tt is the dissolution value of modified polymer at same time t.
Similarity factor (f
2) is the log reciprocal square root transmission of the sum of square error.
PS growth analysis
PS growth in presence of solvent is an undesirable phenomenon. Formulations were withdrawn at regular intervals viz. 7, 14, 30, and 45 days and the effect of “Ostwald ripening” was analyzed using a zeta seizer.
Cytotoxicity study
In vitro cytotoxic effect of pure etoricoxib and formulations (formulation A8, C1, and K9) was studied using breast cancer cell line (MCF 7) (Tata Memorial Centre for Treatment, Research and Education in Cancer [ACTREC], Mumbai, India). Sulforhodamine B (SRB) assay was employed for the determination of activity.
28
SRB is a water-soluble dye used to stain cellular proteins. SRB imparts good stain intensity and linearity with cells, but reduces the signal to noise ratio. SRB is an anionic bright pink dye that binds electrostatically with basic amino acids in the presence of dilute acetic acid. The cell lines were grown in RPMI 1640 medium containing 10% fetal bovine serum and 2 mM
MCF-7 cells were incubated into 96-well microtiter plates at 37°C for 24 h. The inoculated microtiter plates were maintained under 95% air, 5% CO2, and 100% relative humidity, and incubated at 37°C for 24 h before the addition of experimental samples. Samples were solubilized in dimethyl sulfoxide to make a 100 mg/mL solution and diluted to 1 mg/mL using water. The samples were frozen before use. The frozen concentrate (1 mg/mL) was thawed and diluted to prepare 2, 4, 8, and 10 μg/mL solutions of the test samples. The drug was added to these dilutions.
The plates were incubated under standard conditions for 48 h. Cold trichloroacetic acid (TCA) was added to terminate the assay. Cells were fixed in situ by gentle addition of 50 μL of cold 30% (w/v) TCA (final concentration, 10% TCA) and incubated for 60 min at 4°C. The supernatant was discarded and the plates were washed five times with tap water and air dried. Fifty microliters of SRB (0.4% w/v solution) in 1% acetic acid was added to each of the wells and the plates were incubated for 20 min at room temperature (25°C). The plates were washed with 1% acetic acid solution to remove unbound dye and air dried. The bound stain was subsequently eluted with 10 mM Trizma base and the absorbance was read on a plate reader at 540 nm (690 nm reference wavelength).
Results and Discussion
Characterization of Stabilizers
FTIR spectral analysis
The FTIR spectral analysis was carried out to identify the functional groups present in KGP, KGP-g-Am (AKG1), and CMKGP (CKG1). The FTIR spectrum of KGP presented major characteristic peaks of C-O-C and C-O-H of glycosidic linkage, carboxylate group of galactoronic acid residue, symmetric stretching of carboxylic group of uronic acid, stretching of sugar (galactose, arabinose etc.), intramolecular hydrogen-bonded O-H group, and carbonyl absorption bands due to the free (COO−) and esterified (COO-R) carboxyl groups. The FTIR spectrum of KGP-g-Am showed characteristic peak of C-N stretching, peak of primary amide due to the N-H stretching, and C = O stretching of amide group. These peaks were absent in the spectra of native polymer indicating incorporation of amide group into KGP (data reported in our previous communication). 18 FTIR spectra of CMKGP (CKG1) showed characteristic peaks at 1,056 cm−1 (stretching vibrations of C-O), 1,329 cm−1 (C-O stretching), 1,412 cm−1 (blending vibrations of C-O-H), and 1,640 cm−1 (stretching vibrations of C = O). The peak at 3,412 cm−1 was assigned to the intramolecular hydrogen bonding (Supplementary Fig. S1).
Thermal analysis
DSC thermogram of KGP showed an initial endothermic peak at 90°C due to the heat absorption from the system, resulting in heat flow within the polymer and evolution of polymer-linked water molecules. The appearance of endothermic peak may be due to the change in conformation of the polymer. The change in 3D configuration of natural polymer with heat treatment shows endothermic peak. An endothermic peak during cooling cycle at 25°C represented the decomposition of polysaccharide. A broad endothermic peak in the thermogram of KGP was due to the random breakdown of glycosidic bonds. This kind of thermal behavior of polysaccharides has been reported earlier. 29,30 KGP-g-Am showed a broad endothermic peak at 40°C corresponding to the loss of associated crystallization water molecules 31 or due to the melting of acrylamide graft copolymer. The endothermic peak at 240°C in the thermogram of AKG1 was due to the re-crystallization or degradation of AKG1. Giri et al. reported degradation of acrylamide graft copolymer between 175°C and 300°C due to the release of ammonia. 32 The endothermic peak at 350°C indicated degradation of acrylamide graft copolymer of KGP. Similar results have been reported earlier. 33,34 The thermogram of CMKGP (CKG1) showed a sharp endothermic peak at 100°C due to the loss of intermolecular and intramolecular hydrogen bonding that further leads to conformational movement of chain and destabilization of the system, hence requiring lesser energy for decomposition. An endothermic broad peak between 280°C and 340°C indicated degradation of CKG1. CKG1 showed a lower decomposition temperature than the native form (KGP). These results are supported by Kaity and Ghosh. 35 The lower decomposition temperature of CKG1 could be due to loss of intramolecular and intermolecular hydrogen bonding. Loss of hydrogen bonding accelerates the conformational movement of the chain and destabilization of the system, hence requiring less energy for decomposition/melting (Supplementary Fig. S2).
1 H NMR spectral analysis
1 H NMR spectrum of KGP showed the presence of tetrahydropyran (1 alpha –O from methane and 1 beta –O from methine), tetrahydropyran [1 alpha –C( = O)O from methane and 1-beta –O from methine], and tetrahydropyran (1 alpha –O from methine, 1 beta –C from methine, and 1-beta –O from methine). Crowded signals in the 1 H NMR spectra of KGP are characteristic of polysaccharides and proved the presence of sugar residues. The spectrum for KGP-g-Am (AKG1) revealed the presence of new proton peaks of methylene [1 alpha –O-C, 1 beta –C ( = O) N], methylene [1 alpha –C ( = O) N, 1 beta –O-C], and primary amide. The presence of these characteristic peaks assigned to the amide groups in 1 H NMR spectra confirmed acrylamide grafting (data reported in our previous communication). 18 Carboxymethylation of KGP by the Williamson ether synthesis with a strong base such as sodium hydroxide (that deprotonates the free hydroxyl groups of –CH2OH in KGP to form alkoxides) increases its nucleophilicity. Alkoxides and chloroacetic acid reacted and produced carboxymethyl groups. The spectrum of CMKGP (CKG1) revealed the presence of new proton peaks at δ = 3.45, 3.22 ppm methylene (1 alpha –O-C, 2 beta –C), and δ = 3.57 methylene [1 alpha –O-C, 1 alpha –C( = O)O] attributed to methylene protons in carboxymethoxy substituents. The presence of characteristic peaks assigned to the carboxyl groups in 1 H NMR spectra confirmed carboxymethylation reaction in the polysaccharide (Supplementary Fig. S3).
Surface morphology
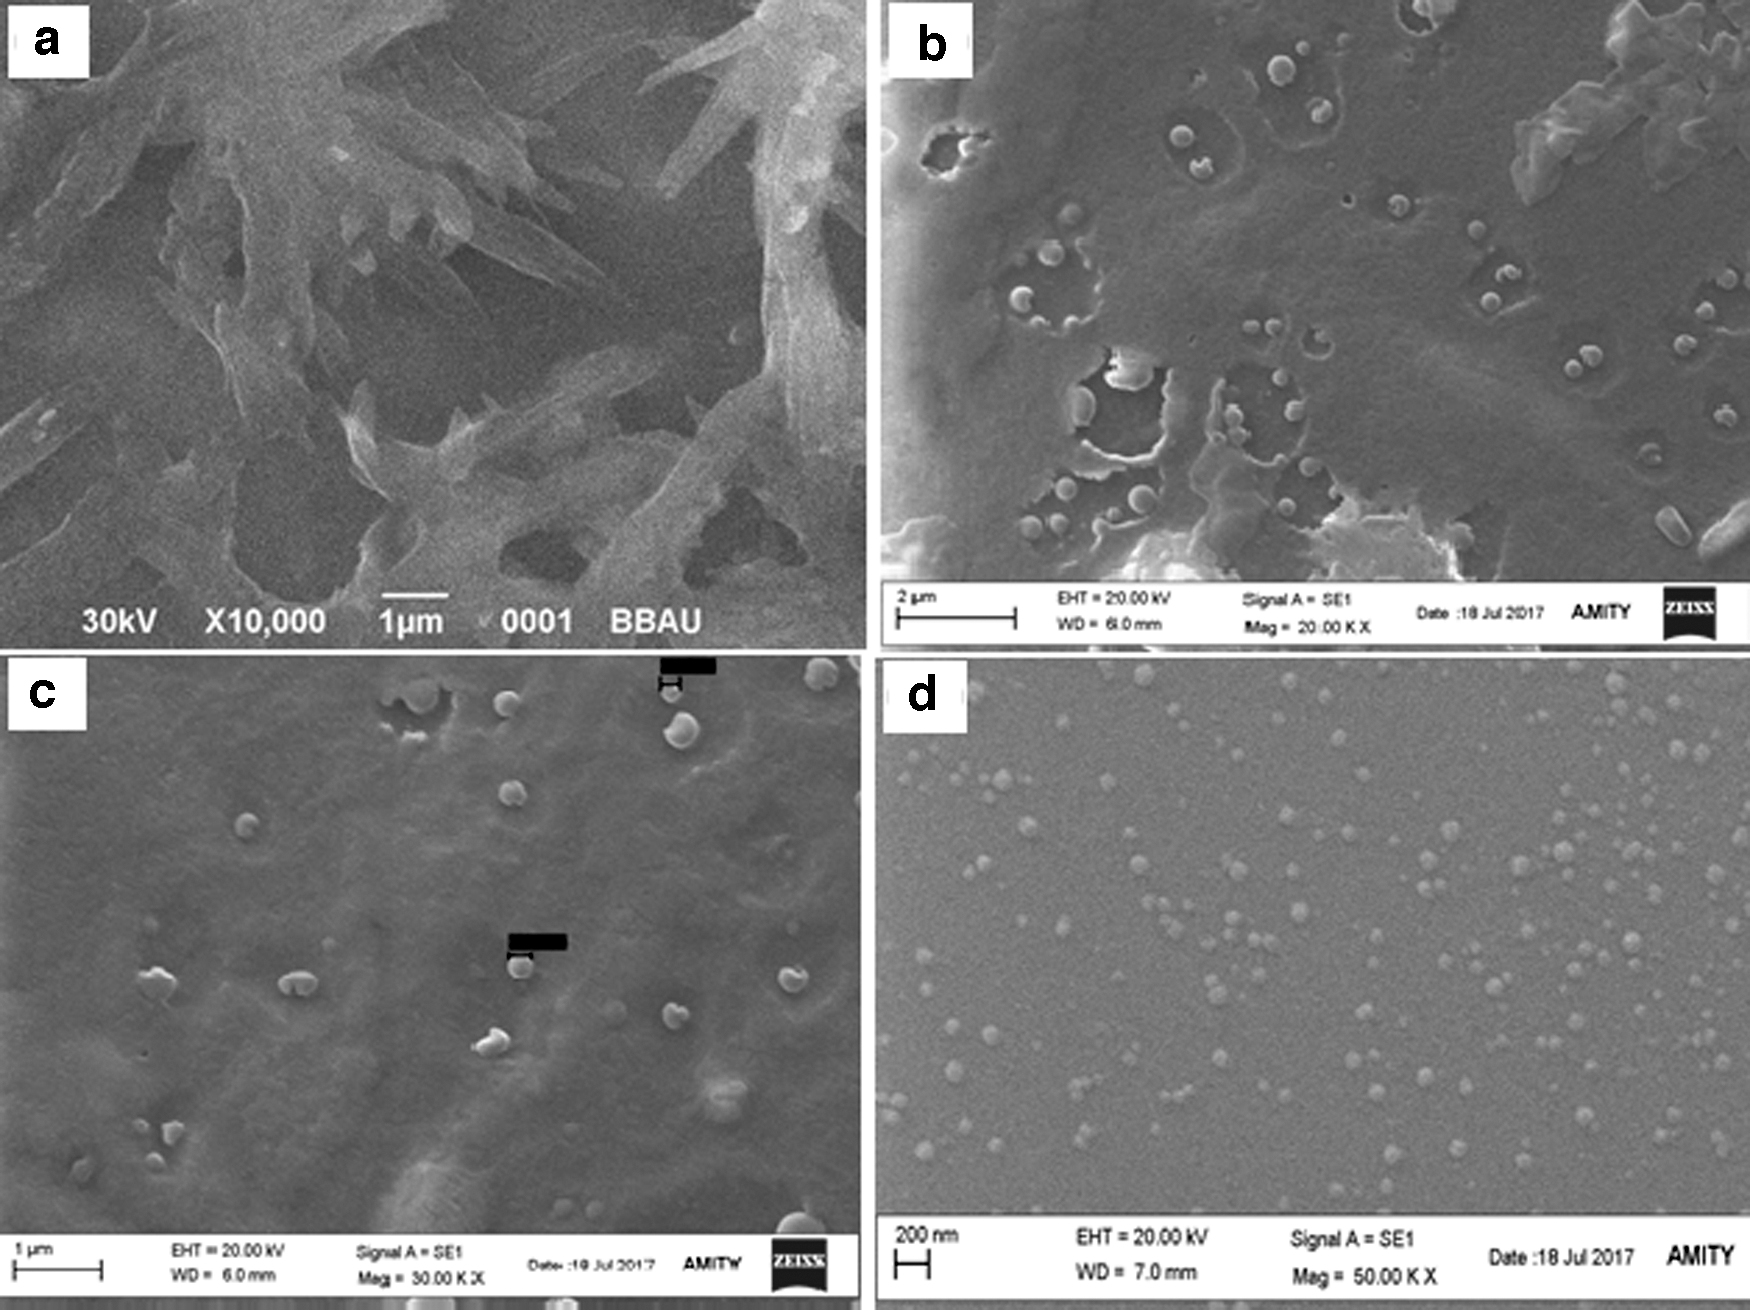
SEM images indicated significant differences in the morphology of KGP-, KGP-g-Am (AKG1)-, and CMKGP (CKG1)-based polymer. KGP had a rough and irregular surface (Fig. 1a). Pores were observed in the AKG1 surface with fissures (Fig. 1b). Surface pores in grafted KGP could be due to the grafting. CKG1 had a globular heterogeneous structure of the polymer (Fig. 1c).

Scanning electron microscopic images of
Solubility of stabilizer
The solubility of KGP, KGP-g-Am (AKG1), and CMKGP (CKG1) was 81.31% ± 4.28%, 62.35% ± 3.43%, and 97.67% ± 2.33%, respectively. The highest solubility of CMKGP could be due to the introduction of –COOH group during carboxymethylation. The presence of –OH and –CH2OH groups in KGP leads to decreased solubility than CMKGP (CKG1). KGP-g-Am (AKG1) had minimum solubility due to the presence of –CONH2 group.
Characterization of Nanoparticles
Low polymer concentration and small PS lead to the formation of a clear nanosuspension. Ratio of solvent: antisolvent is recommended as 1:25 at 70°C. 6,36 The boiling point of acetone is 56°C, which gets quickly evaporated at 70°C and allows precipitation of drug molecules. In this study, we used a similar solvent system (i.e., 1:25 ratio) and the solvent evaporation was carried at 70°C.
Optimization
Polynomial quadratic models were generated for each response parameter to access the outcome of formulation parameters (concentration of drug and polymer) on dependent or response variables (PS and EE%). The fitted quadratic equations relating the responses such as PS and EE% to their transformed factor are given in Equations (8)–(13), respectively. Equations (8) and (9) show the effect of KGP and etoricoxib concentration on PS and EE%.
Equations (10) and (11) present the effect of KGP-g-Am (AKG1) and etoricoxib concentration on PS and EE%.
Equations (12) and (13) present the effect of CMKGP (CKG1) and etoricoxib on PS and EE% of nanoparticles.
Surface plots indicating effect of the independent variables on size and EE% of nanoparticles prepared using three stabilizers, that is, KGP, KGP-g-Am (AKG1), and CMKGP (CKG1), are presented in Figures 2 and 3 .
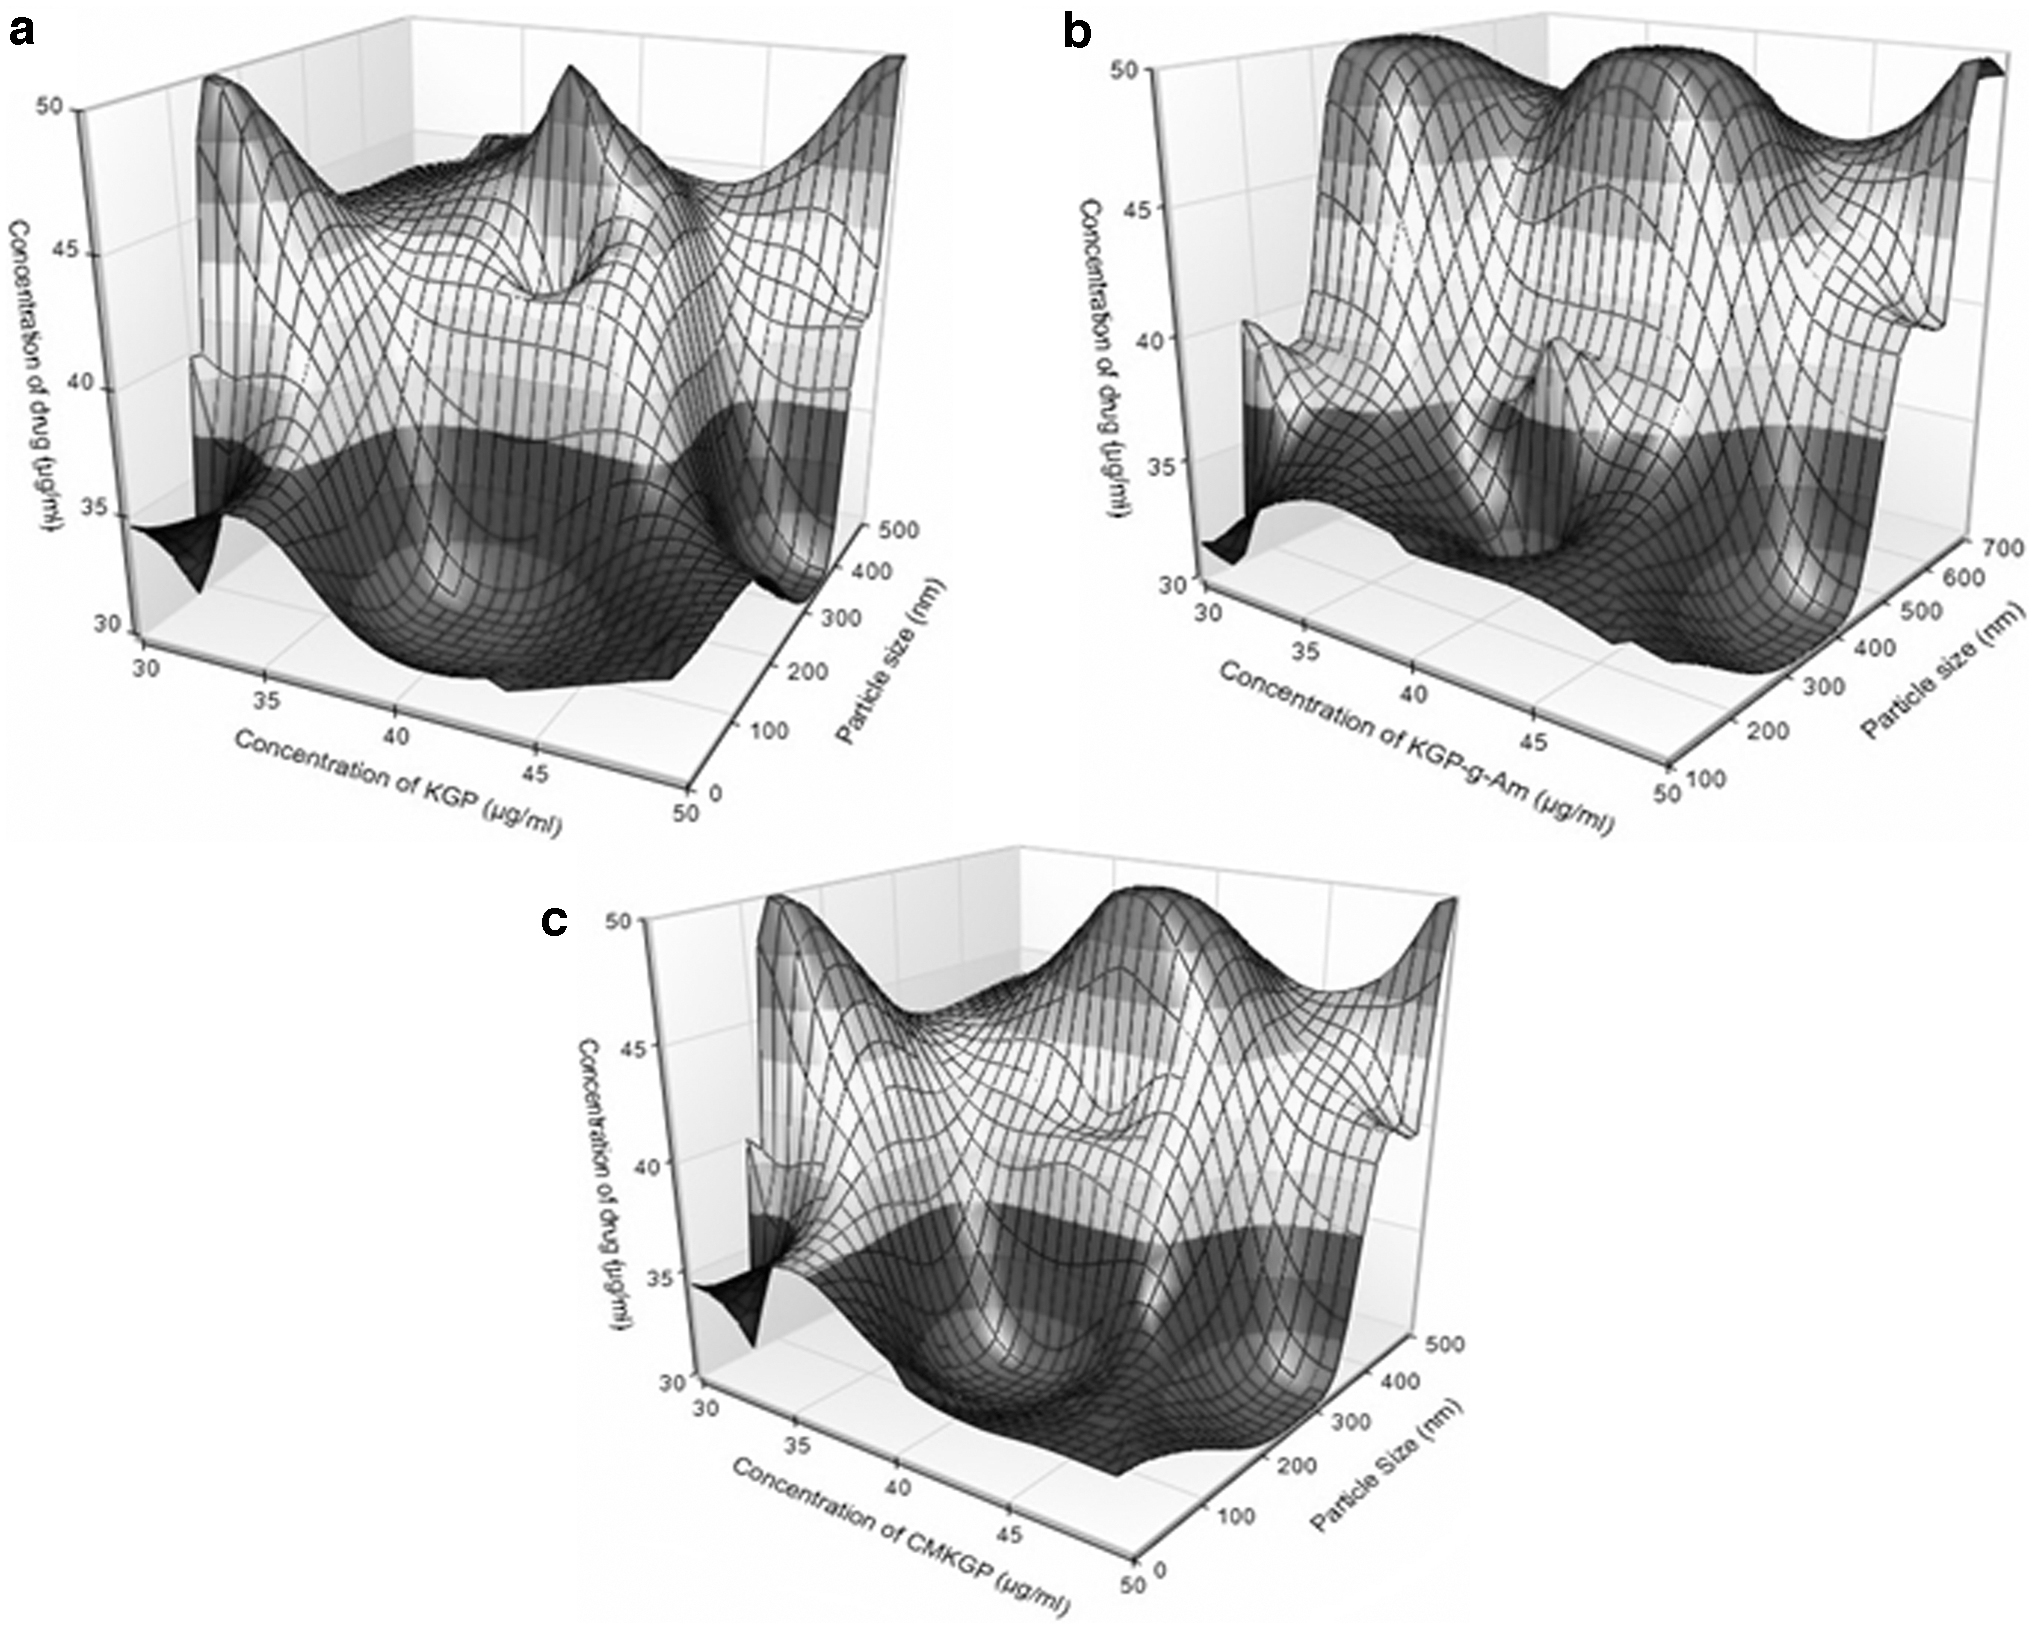
Surface plot for effect of independent variables on size of nanoparticles prepared by
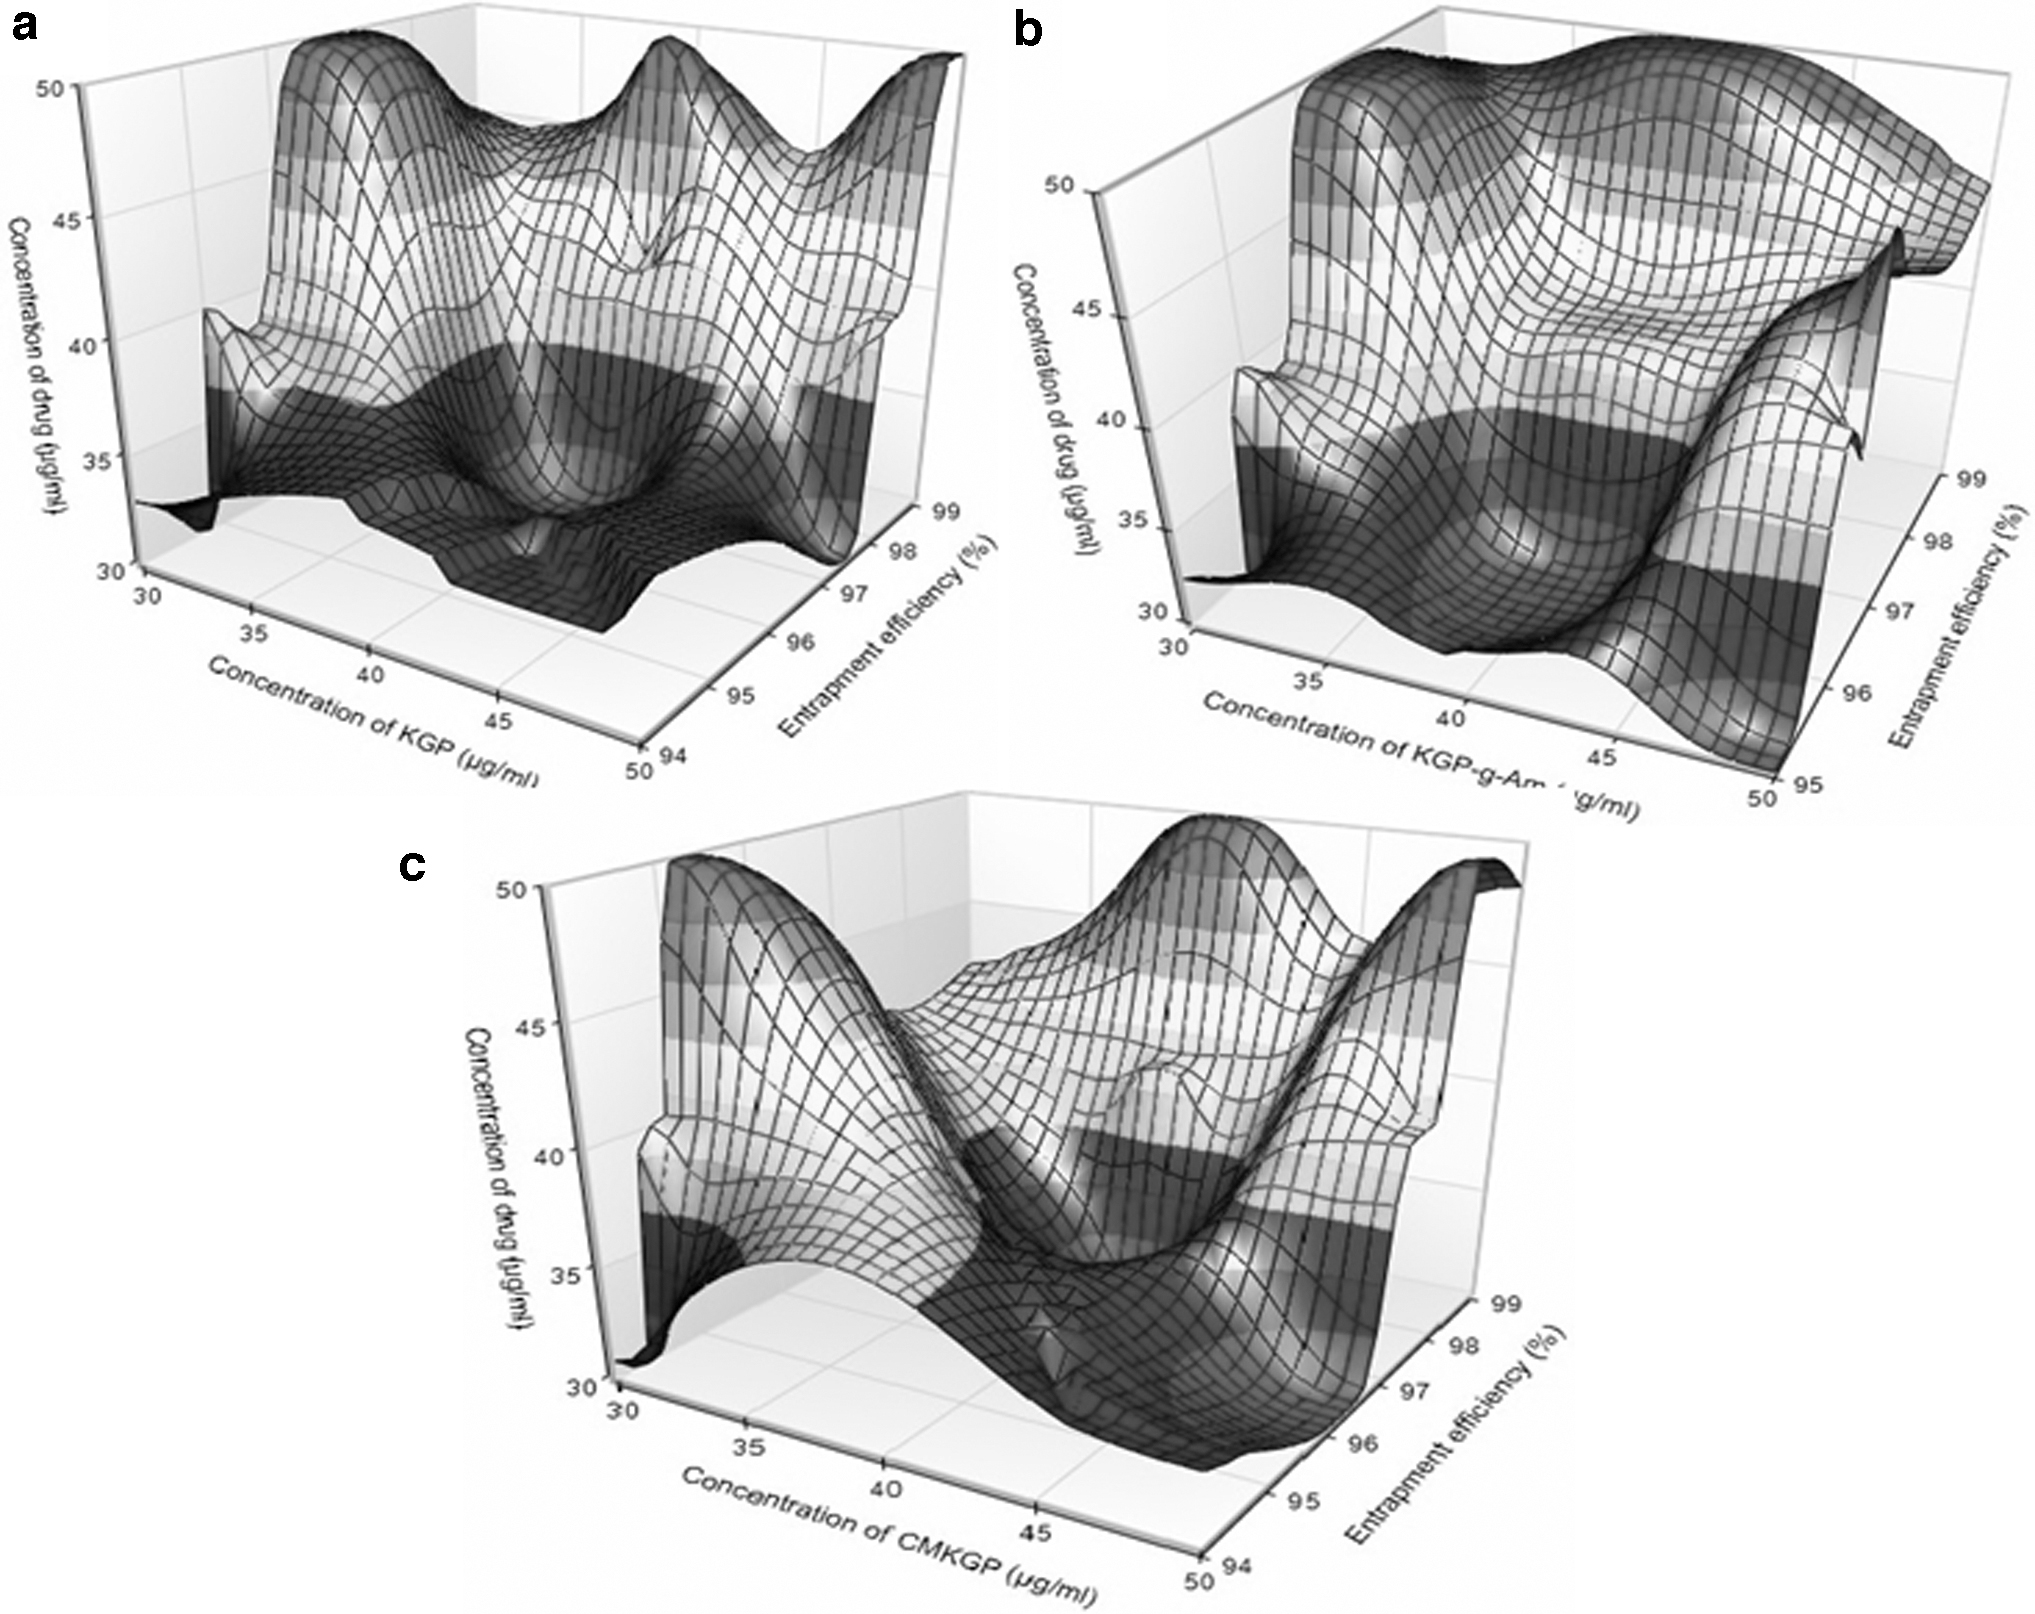
Surface plot for effect of independent variables on entrapment efficiency of nanoparticles prepared by
Effect of stabilizer concentration
The effect of stabilizer concentration on PS was examined. Antisolvent without stabilizer produced nanoparticles of 3.7, 3.6, and 3.6 μm size at 30, 40, and 50 μg/mL drug concentration, respectively. In a stabilized nanosuspension system, the van der Waals force of attraction should be less than the electrostatic repulsion. KGP reduces the interfacial tension and hence promotes polymer deposition over the drug precipitate. This forms small particles and improves their interaction with the dissolution medium. 11 Electrostatic repulsion plays an important role in crystal growth. Stabilizer molecules prevent drug diffusion in precipitated nanocarriers. For better coating, a stabilizer should have poor solubility in the solvent and good solubility in the antisolvent. A higher concentration of stabilizer elevates the osmotic pressure of solvent-antisolvent system and induces colloidal attraction. At higher concentrations, a stabilizer may form multilayer coating of precipitated drug particles. The stabilizer reduces PS and modifies morphology of precipitated particles. 8 A stabilizer provides stearic stabilization (polymer) and electrostatic stabilization (surfactant) or a combination of both. Both the stabilization approaches retain nano-size dimension of particles. In this study, the KGP and its derivatives induced both stearic and electrostatic stabilization (electrostatic repulsion among particles) effects. However, van der Waals force of attraction was responsible for the re-agglomeration of particles.
In polysaccharides, long, branched aromatic ring creates a hydrophobic region, while small groups like –CH2OH, –OH, and –COOH create a hydrophilic region. Hydrophobic region of a stabilizer precipitates with the drug in antisolvent (generally water) and arrests particle growth. The hydrophilic region modifies its orientation and comes toward the outer region of nanoparticles. Ionic interaction and hydrogen bonding between hydrophilic region of polysaccharide and antisolvent stabilize the system by reducing free surface energy.
Particle recrystallization converts amorphous particles into crystalline forms. An amorphous phase has a higher solubility than the crystalline phase. Recrystallization minimizes surface energy. Solvent molecules imbibe into solute and solubilize up to a certain extent. Solubilization of solute molecules provides space for the relaxation of solute molecules that result in recrystallization. Recrystallization can be inhibited if the drug has solubility approaching zero in antisolvent. Recrystallization can be reduced by reducing surface free energy. In this study, the precipitation of polysaccharide over drug nuclei reduced free energy and prevented recrystallization. Colombo et al. reported that the stabilizer coating over drug significantly affected the solubility as a function of the precipitate size that resulted in Ostwald ripening. Ostwald ripening also leads to mechanochemical activation of drug crystals into the amorphous form that leads to the improved dissolution rate. 37
Effect of drug concentration
The precipitate size increases with an increased drug concentration. Similar results have been reported earlier. 8,36 At higher drug concentration, the stabilizer concentration was not sufficient, and hence promoted crystal growth. Zeta seizer measures the hydrostatic diameter of particles, whole distribution, and shows average size of all the particles. SEM images examine the size and morphological characteristics of individual dried particles. Due to this reason, the zeta average PS is always greater than the PS measured by SEM. Stabilizers not only reduced the PS but also modified the particle morphology (Fig. 4). Similar results have been reported earlier. 8 Figure 4 elicited that the stabilizer formed well-dispersed nanoparticles without agglomeration. The stabilizers modified morphology of the drug precipitate from nonspherical to spherical structure.
SEM images of etoricoxib nanocrystal without stabilizer
Effect of process parameters
Supersaturation and nucleation
The addition of etoricoxib solution in antisolvent decreased solvent power of acetone. According to the Ostwald-Mier theory, a fixed solute concentration in a solvent-antisolvent system lead to the supersaturation and initiation of nucleation. 38 Rapid evaporation of solvent leads to the supersaturation and formation of ultrafine particles with reduced re-agglomeration. A narrow metastable zone (a range of solvent-antisolvent composition in which no nuclei form) and short induction time (time gap between supersaturation and nuclei formation) assisted the homogeneous nucleation process. 39
The rate of nuclei formation increases with the system temperature and is inversely proportional to medium viscosity. Higher viscosity prevents solvent evaporation and retards rate of nuclei formation. Up to a certain drug concentration, supersaturation decreases the PS. Beyond this limit, the solute concentration increases the frequency of collision and subsequently agglomerates particles. The solubilized solute molecules should cross minimum energy barrier (ΔG) to initiate nuclei formation. At higher temperature and polymer concentration, a decrease in ΔG leads to more nuclei formation and hence better drug EE%.
Mixing
Mixing also affected the size of nanoparticles. Proper mixing resulted in uniform distribution of supersaturation zone in bulk medium. Injection of drug solution through a syringe (higher velocity) generated turbulent mixing. Beck et al. suggested that the duration of mixing should be less than the induction time. Mixing promotes the diffusion of solute molecules into antisolvent. 40 Homogeneous supersaturation resulted in rapid nucleation and formation of small particles.
Ultrasonication
High-intensity ultrasound radiation initiates cavitation and bubble formation due to the negative pressure. These bubbles collapse and create high temperature and pressure gradient across the solvent-antisolvent system, which can break up particles. Turbulence ensures rapid nucleation and breakdown of agglomerates and larger particles. Ultrasonication reduces induction time and narrows the metastable zone. It improves the diffusion of solute molecules. Ultrasonication increases the frequency of collision between precipitated nuclei and causes PS reduction by abrasion. 41 The outcomes of this study showed that the mild sonication for 8 min was adequate to re-disperse agglomerate, yet later than 45 days.
PS reduction and dissolvable dose
Low solubility leads to the suboptimal efficacy of orally administered drugs. Small particles have a high effective surface area, which improves the drug-medium contact resulting in higher Gibbs free energy of the system. Increased Gibbs free energy makes the nanosuspension thermodynamically unstable. Surfactants decrease Gibbs free energy and improve system stability. KGP can be used as a surfactant that reduces free surface energy at the surface of two phases. 6
Nanoparticle structure
Nanoparticles prepared by SAM can be (1) compound nanoparticles—formed by the drug itself and (2) composite nanoparticles—prepared by the drug and stabilizer both. In this investigation, nanoparticles (composite) were prepared using API (etoricoxib) and KGP/KGP-g-Am/CMKGP (stabilizers). Composite nanoparticles were prepared by the precipitation of drug and simultaneous stabilizer coating. SEM images show that the compound nanoparticles (drug nanoprecipitates) are crystalline (Fig. 4). Crystalline drugs have low solubility due to the higher lattice energy of stabilization. In the presence of stabilizers, spherical nanoparticles were formed with high surface area, and hence have a better dissolution rate.
The results of KGP-, KGP-g-Am (A8)-, and CMKGP (C1)-stabilized nanoparticles are presented in Table 3. The CMKGP-stabilized nanoparticles had smaller PS compared to KGP, followed by the KGP-g-Am. CMKGP had superior adsorption potential over precipitated drug nuclei.
Characterization Parameters of Etoricoxib Nanoparticles
SEM, scanning electron microscope.
Percentage EE
EE% was found in the range of 94.32% ± 0.19% to 98.93% ± 0.50% (Table 3). A higher percentage of EE suggested the validity of the model. Similar results have been discussed by Fessi et al. 42 and Barichello et al. 43 They demonstrated that SAM could produce nanoparticles with up to 100% EE. They observed that the prepared nanoparticles had no drug leakage.
Drug release
The drug release from nanoparticles depends on the hydrophilicity of polymer. Contact angle measurement showed that the carboxymethylated derivatives are more hydrophilic than their native form, followed by acrylamide graft copolymer. 20 The cumulative drug release from nanoparticles is presented in Figures 5 –8. Crosslinking of grafted acrylamide decreased water mobility and controlled drug release. Upon contact with the surrounding medium, a hydrodynamic layer forms around the nanoparticles, which act as a barrier for drug release. Mathematically, thickness (hH) can be expressed as Prandtal equation [Eq. (14)]:

In vitro drug release profiles of different batches of KGP-stabilized nanoparticles containing etoricoxib in 0.1 N HCl (pH 1.2) for 120 min followed by 6 h in phosphate buffer (pH 7.4) at 37°C ± 0.5°C (data present mean ± SD, n = 3).
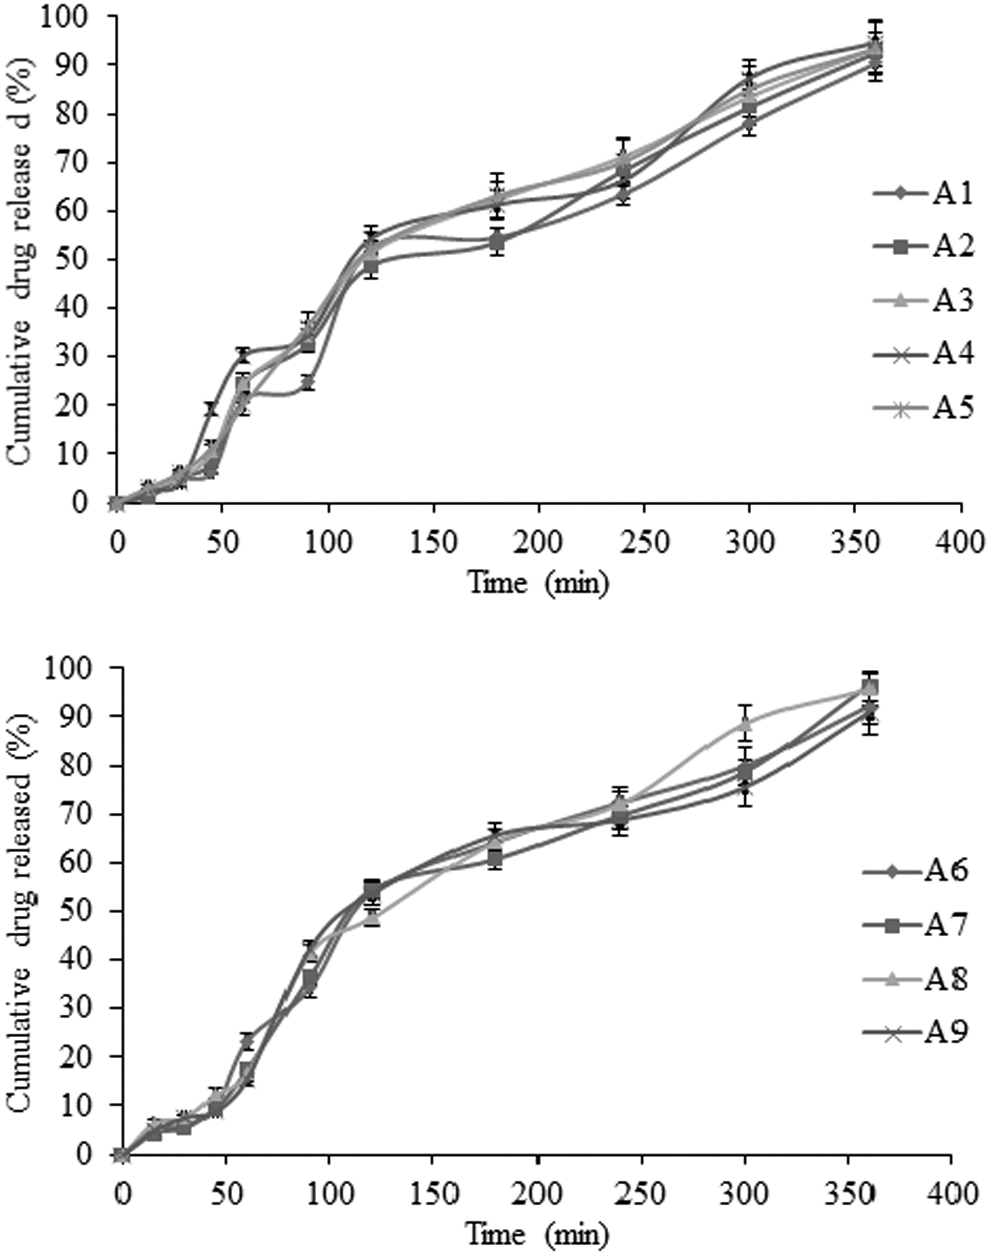
In vitro drug release profiles of different batches of KGP-g-Am (AKG1)-stabilized nanoparticles containing etoricoxib in 0.1 N HCl (pH 1.2) for 120 min followed by 6 h in phosphate buffer (pH 7.4) at 37°C ± 0.5°C (data present mean ± SD, n = 3).
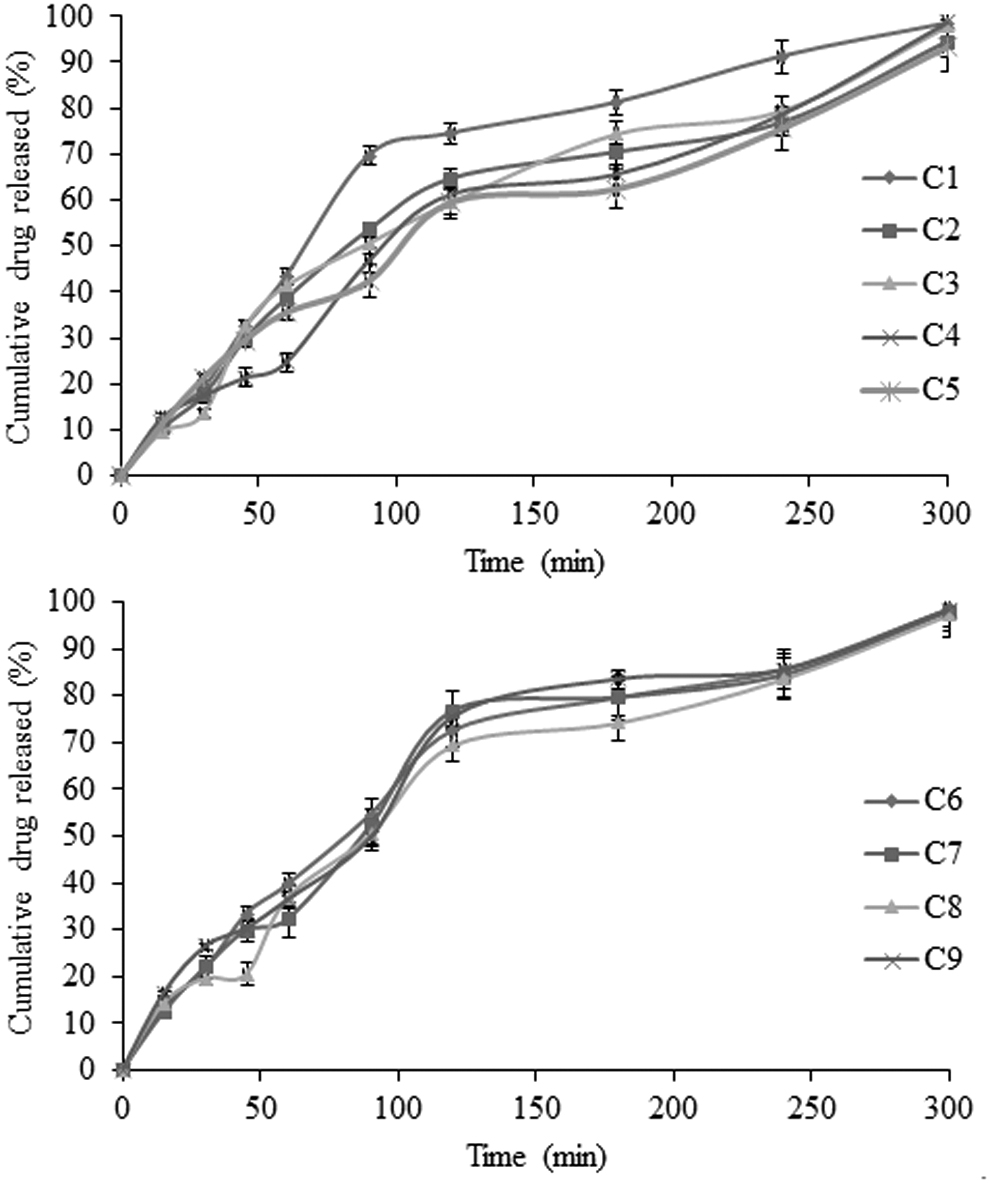
In vitro drug release profiles of different batches of CMKGP (CKG1) nanoparticles containing etoricoxib in 0.1 N HCl (pH 1.2) for 120 min followed by 6 h in phosphate buffer (pH 7.4) at 37°C ± 0.5°C (data present mean ± SD, n = 3).
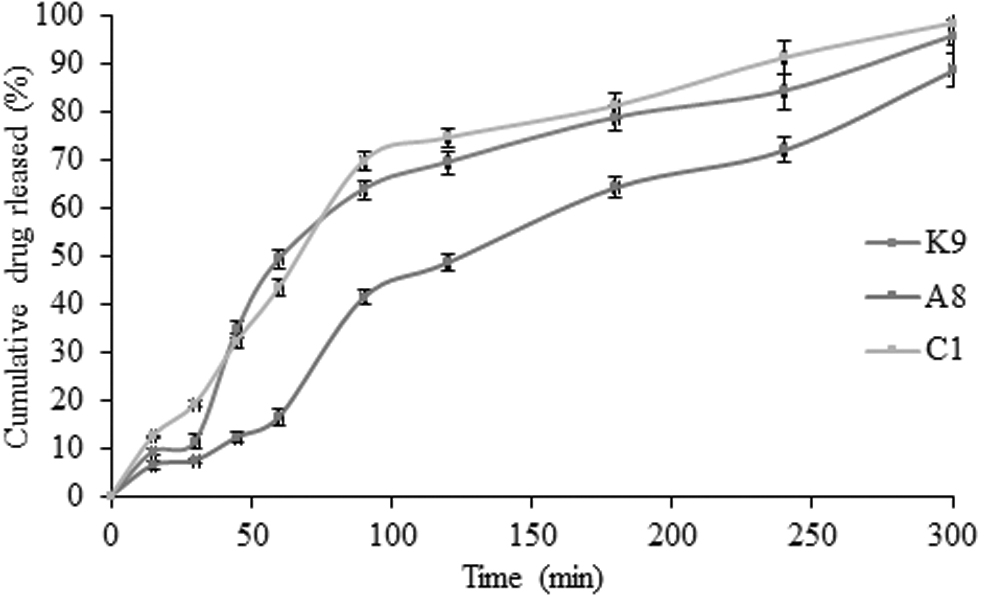
In vitro drug release profiles of optimized batches (KGP, KGP-g-Am, and CMKGP) of nanoparticles containing etoricoxib in 0.1 N HCl (pH 1.2) for 120 min followed by 6 h in phosphate buffer (pH 7.4) at 37°C ± 0.5°C (data present mean ± SD, n = 3).
where L is the surface length in way of flow and V is the relative velocity of liquid on a plane surface. Small particles have higher curvature and small length in the direction of flow. This results in the lower value of hydrodynamic thickness (hH) that further leads to better dissolution. In this study, small particles were obtained for CMKGP-stabilized nanoparticles. The dissolution profile of CMKGP nanoparticles is supported by Prandtl equation. 44
The hydrophilicity of stabilizer is a key factor to determine the release of drug from the formulation. Hydrophilic polymers promote solvent penetration into the solute particles and allow subsequent drug release. Acrylamide grafting over KGP backbone resulted in intensive crosslinking that further inhibited the imbibition of solvent system. Crosslinking reduced drug diffusion from the formulation. Incorporation of carboxymethyl group in KGP backbone induces hydrophilic properties within the stabilizer. Drug release is shown in terms of time of 80% drug release (T 80%) from the formulations. T 80% values were 190, 270, and 170 min for formulation K9, A8, and C1, respectively, and supported by the hydrophilic nature of stabilizers.
Kinetics of drug release
Acrylamide grafting and carboxymethylation altered the drug release kinetics of drug (Table 4). The in vitro dissolution profile of formulation K9 and formulation C1 followed first-order kinetic. However, in the case of formulation synthesized using amide derivative (formulation A8), zero-order release kinetics was recorded. This could be due to more swelling of the polymer for a long time. This could be due to more swelling of amide derivative of polymer. The correlation coefficient (r 2 ) was used to determine the linearity. The Higuchi's plots had 0.919, 0.979, and 0.938 r 2 value for formulation K9, A8, and C1, respectively (Table 4). Peppas' plots had correlation coefficients of 0.875, 0.955, and 0.912, respectively, for formulation K9, A8, and C1. The results suggested the formulations had diffusion-controlled release profile. Formulations K9, A8, and C1 had value of slope (n) >0.5 and <1, which confirmed that etoricoxib release from the synthesized nanoformulations was Fickian diffusion with swelling.
Kinetics Model Study of Drug Release from Optimized Formulations
D, diffusion coefficient; K 0, zero-order release rate constant; K 1, first-order release rate constant; n, release exponent; r 2, regression coefficient.
In the similarity factor (f 2) study, same time points were considered for both the dissolution profiles, and studies were carried out under the same set of conditions (medium, pH, temperature etc.). Similarity factor analysis becomes sensitive when the test batch/reference batch dissolved >85%. To consider this, in this study, only one time point was taken into consideration after 85% dissolution. US-FDA suggests that if the value of f 2 lies within 50–100, the two formulations have a similar dissolution profile. The value of f 2 for formulations K9-A8 and K9-C1 was found to be 31.92% and 65.54%, respectively. Formulation A8 showed dissimilar etoricoxib release profile compared to the native polymer-stabilized nanoparticles (K9). However, carboxymethylated Kheri gum (C1)-stabilized nanoparticles showed similarity in the dissolution profile.
PS growth analysis
Time-dependent PS analysis of nanosuspensions was carried out to identify possible size growth if any. In this study, the formulations were kept in a plastic container at 37°C ± 2°C for 45 days. Samples were withdrawn on the 7th, 14th, 30th, and 45th days, sonicated for 15 s, and PS was determined using a zeta analyzer. No significant change in PS of synthesized nanoparticles (formulations N9, A8, and C1) was observed.
In vitro cytotoxic study
The effect of polymers (KGP, KGP-g-Am, and CMKGP) was evaluated in breast cancer cells (MCF-7 cells). The results of in vitro cytotoxicity study confirmed that all the tested formulations (formulations A8, C1, and K9) had better control over the growth of MCF-7 cells in comparison to pure etoricoxib because of large plane area and improved dissolution profile of drug (Fig. 9). Small PS facilitated the penetration of nanoparticles into cancer cells. At higher drug concentration (10 μg/mL), formulation A8 showed maximum inhibition in cell growth. It can be due to the superior control over cell growth by acrylamide graft copolymer itself. The order of cell growth control was KGP-g-Am>KGP>CMKGP. The results suggested that the KGP-g-Am can be used as an excipient with established anticancer agents for synergistic therapeutic effects. Figure 9 indicates a concentration-dependent control growth percentage (>100% in some treatments) profile in some of the treatments. This corroborates previous findings where a similar cytotoxic profile has been reported from various nanoformulations 45 –47 These results signify the enhanced cytotoxic potential of the loaded drug when encapsulated into A. chundra gum and copolymers stabilized nanosuspension.
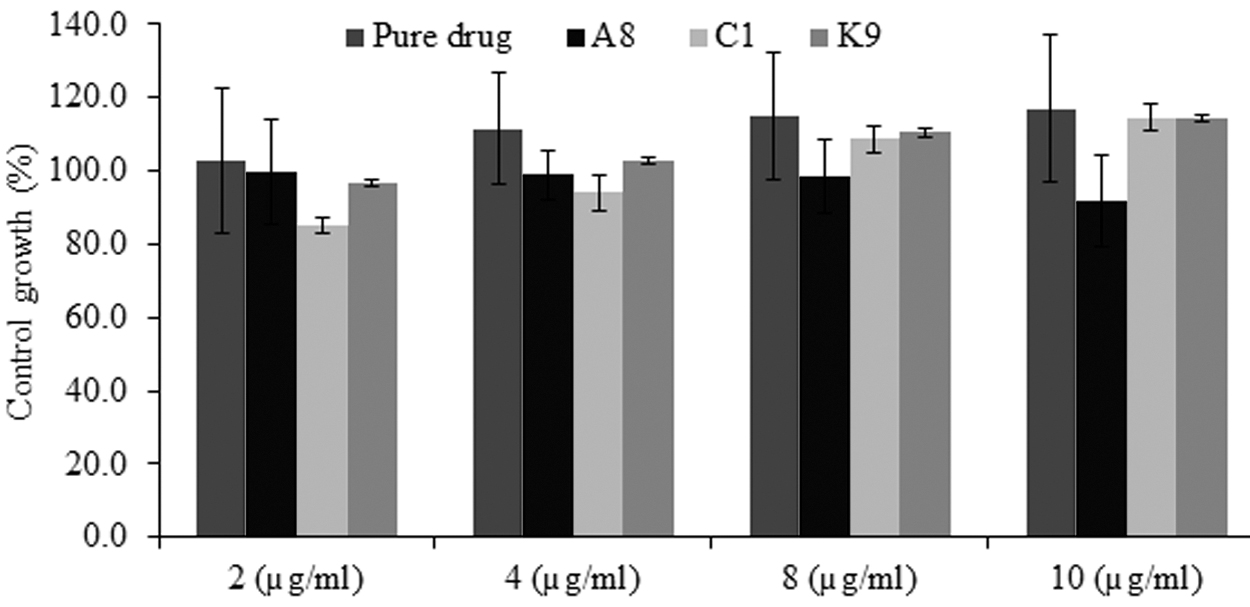
In vitro anticancer effect of pure etoricoxib and formulations (formulation A8, C1, and K9) against breast cancer cell line (MCF 7).
Bright-field images of MCF-7 cells incubated with 2 μg/mL solution of pure drug, and formulations (formulation K9, A8, and C1) are shown in Figure 10. Cytotoxicity of nanoencapsulated etoricoxib was found to be more than the pure etoricoxib. The results suggested that the developed etoricoxib nanoformulations can be an appropriate approach for the management of inflammation and pain associated with breast cancer.
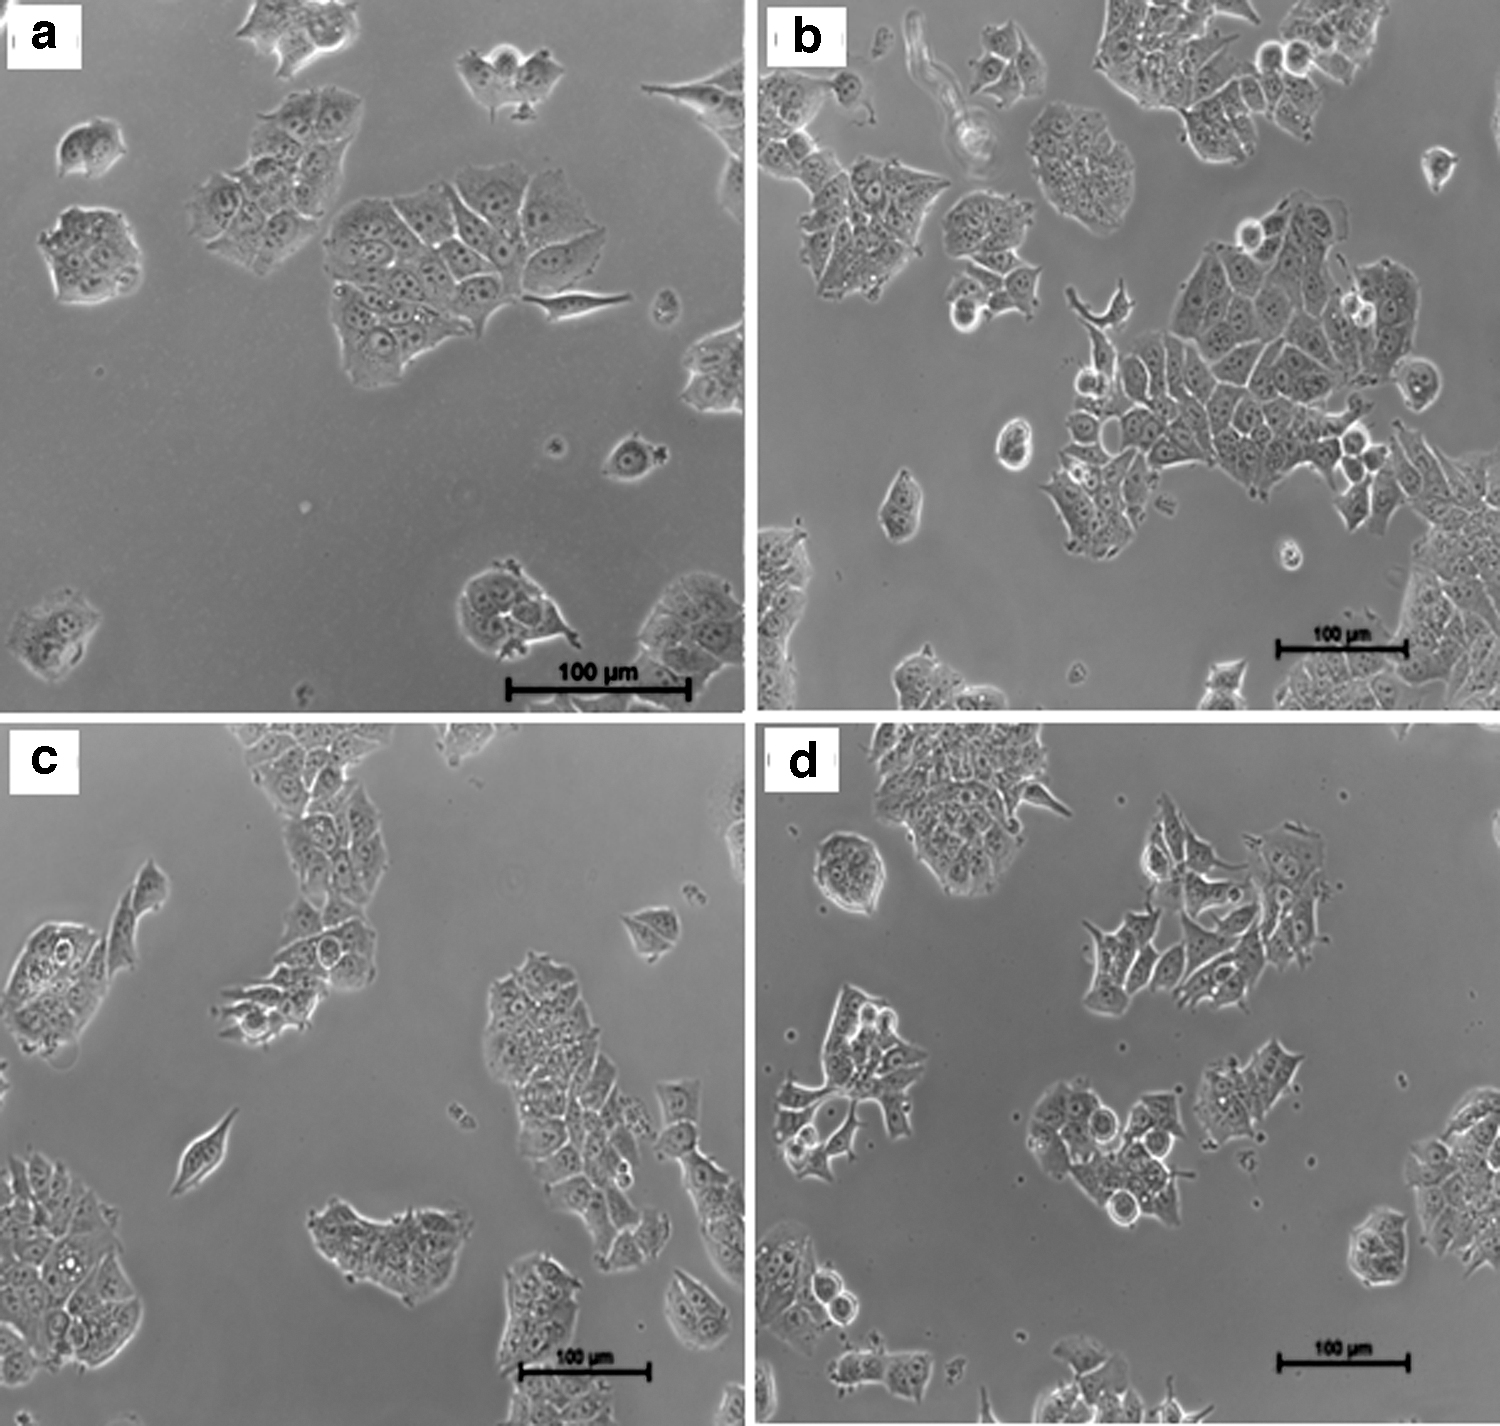
Bright-field images of MCF-7 cells incubated with 2 μg/mL solution of pure drug
Conclusions
Acrylamide-grafted and carboxymethylated A. chundra gum polysaccharide were synthesized and characterized. The improved dissolution profile of etoricoxib was recorded from the nanoparticles stabilized by ultrasonication-assisted SAM. Polymeric stabilizers (KGP, KGP-g-Am, and CMKGP) effectively controlled the size and morphological properties of nanoparticles. Ultrasonication-assisted SAM is continuous, inexpensive, rapid, reproducible, and simple. Uniformly distributed particles were obtained without any sign of agglomeration. The concentration of drug and stabilizers significantly affected the supersaturation and nucleation process. The model-independent approach predicted a significant difference in dissolution profiles of formulation A8 and K9. However, no difference in dissolution profile of formulation K9 and C1 was observed. Cytotoxicity study showed preferential control of MCF-7 cell growth by Formulation A8 followed by formulation C1 and K9.
Footnotes
Acknowledgments
Authors are thankful to Mr. Mukesh Roy, Amity University, Noida, India, for determination of contact angle and SEM analysis. Authors are thankful to Indian Institute of Technology, New Delhi, India, for providing facility to carry out nuclear magnetic resonance spectral analysis. Authors are thankful to Anti-Cancer Drug Screening Facility (ACDSF) at ACTREC, Tata Memorial Centre, Mumbai, India, for providing facility to carry out in vitro SRB assay for anticancer activity.
Disclosure Statement
No competing financial interests exist.
Funding Information
No funding was received for this article.
Supplementary Material
Supplementary Figure S1
Supplementary Figure S2
Supplementary Figure S3