




Abstract
The present research work was aimed to develop and optimize the nanostructured lipid carrier (NLCs) of the antihypertensive drug lacidipine (LAC) for the improvement of oral bioavailability and antihypertensive activity. LAC-NLCs were successfully developed by the preemulsion probe sonication technique. The formulations were optimized by Box-Behnken design and assessed for particle size (PS), polydispersity index (PDI), entrapment efficiency (EE), drug loading (DL), drug release, ex vivo permeation, and in vivo study. The optimized LAC-NLCs showed nanometric PS (191.0 ± 5.89 nm), high EE (90% ± 3.69%) and DL (9.26% ± 1.89%), negative zeta potential (−28.9 ± 0.99 mV), and narrow size distribution (PDI of 0.074 ± 0.013) with spherical morphology. The drug release study revealed that a significantly (p < 0.05) higher LAC release (88.49% ± 3.01%) was achieved from the optimized LAC-NLCs compared to LAC-dispersion (34.27% ± 3.01%). Moreover, the optimized LAC-NLCs showed significantly (p < 0.05) higher intestinal permeation (692.04 ± 19.76 μg) than LAC-dispersion (23.83 ± 5.08 μg). After oral administration of a single dose of LAC, the optimized LAC-NLCs exhibited 3.45-fold higher relative oral bioavailability as well as a more prominent antihypertensive effect than LAC-dispersion. This might be due to the high penetration and absorption of the drug. Hence, NLCs might provide an efficient nano delivery for the management of hypertension and promising drug delivery systems for the bioavailability enhancement of LAC.
Introduction
Hypertension, a Worldwide epidemic at present, is not a disease itself, rather it is the main risk factor that leads to other diseases such as myocardial infarction, heart failure, stroke, peripheral artery disease, and sometimes death. It is a serious cardiovascular event that refers to the rise in arterial blood pressure. The joint national committee VIII has declared that above one billion patients have been recorded with hypertension worldwide. According to World Health Organization (WHO 2019), around 1.13 billion people worldwide have hypertension, most (two-thirds) living in low- and middle-income countries.
The prevalence of hypertension varies across the WHO regions and country income groups. The WHO African Region has the highest prevalence of hypertension (27%) while the WHO Region of the Americas has the lowest prevalence of hypertension (18%). Hypertension is a major cause of premature death worldwide. Due to the chronic nature of the treatment and the prospect of side effects of the administered drugs, there may be a chance of suboptimal blood pressure control, damage of the organ's surface, and complications of the cardiovascular system. 1,2
Lacidipine (LAC) is a calcium channel blocker that comes in the class of dihydropyridine. It has been used for the treatment of hypertension, arteriosclerosis, and also exhibited antioxidant activity. It decreases blood pressure by dilating the peripheral arterioles and lowering peripheral vascular resistance. 3 LAC is a lipophilic drug (log p = 5) and undergoes extensive hepatic first-pass metabolism by cytochrome P450 3A4 (CYP3A4) after oral administration which leads to a low oral bioavailability (10 %). 4,5 LAC also exhibited poor water solubility, which further affects its oral bioavailability, and hence dissolution and finally the dose of the drug. 6 According to the Biopharmaceutical Classification System (BCS), LAC is coming under the BCS-II drug, that is, low solubility and high permeability. 7 –9
Recently more focus has been given to nano-sized formulations to enhance the solubility and bioavailability of the poorly soluble drug. The lipid nanoparticles can improve the absorption of drugs by improving the solubility/dissolution in the intestinal environment, reduces the gastric emptying rate, and also enhances the drug permeability. 10 Numerous formulation approaches were made by researchers for the bioavailability enhancement of lipophilic drugs such as solid lipid nanoparticles, 6 micelle, 11 nanovesicular system, 12 and nanostructured lipid carriers (NLCs) 13 and reported satisfactory outcomes. The other approach for overcoming solubility and hence bioavailability problems associated with LAC is the development of a lipid-based drug carrier system. Among these systems, NLCs have shown one of the promising delivery systems for poorly soluble drugs to improve oral bioavailability.
NLCs consist blend of biocompatible solid and liquid lipid with a distinct chemical structure and reported particle size (PS) is 10–1,000 nm. 14 Due to the nanometric size of NLCs, they offer a higher surface area for the enzymatic attack via intestinal lipases. However, NLCs have other advantages like high drug load, entrapment efficiency (EE), biocompatibility and biodegradability, control drug release, and better patient compliances. Besides, NLCs can also attach to the gut wall, extending the residence time, hence enhances the drug absorption. 15 NLCs also pick up by the intestine in particulate form and transported to the different organs by forming the Peyer's patches. They are intercellularly/paracellularly taken up by the lymphatic system, avoids the first-pass metabolism, and hence improve the bioavailability. 13
Several attempts have been taken for the enhancement of solubility and hence bioavailability of LAC to get better therapeutic efficacy. The formulations like nanoemulsion, 16 nanosuspension, 17 polymeric micelles, 3 SNEDDS, 7 nanoparticles, 18 SLNs, 19 liposomes, 20 gastroretentive system, 21 microspheres, 22 cyclodextrin inclusion complexes, 8 solid dispersion, 23 and transdermal systems. 9 To date, no literature report is available on the LAC-based NLCs formulation. Therefore, NLCs could be a good strategy for the improvement of oral efficacy of LAC by the enhancement of solubility and bioavailability.
Hence, the objective of the present research was to design and optimize the LAC-loaded NLCs formulation. Optimization was done by the Design of Experiment software (DoE, version 9.0.1; State-Ease, Inc., Minneapolis) using Box-Behnken design to observe the effect of different formulation factors on physicochemical properties such as PS, polydispersity index (PDI), and EE of the developed formulation. Further, the optimized formulation was also evaluated for solid-state characterization, drug release, ex vivo permeation study, and pharmacokinetic and pharmacodynamic activities.
Materials and Methods
Materials
LAC was provided by Unichem Pharma, Ahmedabad (India) as a gift sample. Glyceryl monostearate (GMS), Precirol ATO 5, Compritol 888 ATO, Labrafil, and Maisine HS 15 were procured from Gattefosse India Pvt. Ltd., Mumbai (India). Stearic acid, oleic acid, Tween 20, Solutol HS 15, and Tween 80 were provided by SD Fine-Chem Limited, Mumbai (India). All other chemicals and reagents used were of analytical grade.
Animals
The in vivo study was performed on albino Wistar rats. In vivo study was conducted as per the standard protocol. The study protocol was approved by the Institutional Animal Ethics Committee (IAEC), Jamia Hamdard, New Delhi, India with approval number 1077. The rats of either sex (200–250 g) were selected for experiments and procured from the Animal House at the Jamia Hamdard, New Delhi, India. The rats were housed in a light and dark clean room at 25 C ± 0.5°C and 60% relative humidity with free access to food and water ad libitum. The rats fasted overnight before the experiment. After completion of the experiment, the animals were preserved and a standard diet was given to the experimental animals for recovery. Died animals were deep buried after packing.
Methods
High performance liquid chromatographic for sample analysis
High-performance liquid chromatographic (HPLC) (binary system, Shimadzu LC 20AD; Japan) was used to evaluate the concentration of LAC in vivo as well as in vitro samples. The instrument was equipped with a reverse phase C-18 column (250 × 4 mm, 5 μm PS) and UV-detector. For the extraction of LAC, acetonitrile (2 mM) and ammonium acetate in the ratio of 80:20 (v/v) were used as a mobile phase and felodipine as an internal standard. The flow rate was 1 mL/min with a run time of 15 min. The sample (20 μL) was injected with a manual injector into the HPLC system and detection was made with UV-detector at 235 nm.
Selection of solid lipids
The selection of solid lipid was based on the maximum solubility of LAC in the different lipids. Previously reported method, that is, supersaturation method, was used to detect the solubility of the drug in each lipid. 24 Each solid lipid, that is, glycerol monostearate (GMS), stearic acid, Compritol 888 ATO, and Precirol AT05 (1 g), was taken in separate glass vials and melted separately at 5°C above the melting point of lipid in a water bath. LAC was added in increments of 1 mg until the supersaturation condition was achieved. Each sample was centrifuged (REMI, model-mLab's-R-23, Mumbai, India) at 10,000 rpm for 15 min to get the supernatant. The supernatant was diluted suitably with ethanol and concentration was measured by UV-Vis spectrophotometer (Shimadzu-1800; Tokyo, Japan) at 240 nm. The application of ethanol for such purposes is already reported in literature. 24
Selection of liquid lipid
The supersaturation method was used for the detection of solubility of LAC in liquid lipids. The selection criterion was the maximum solubility of LAC in the tested liquid lipid. The excess amount of LAC was added in 2 mL of each liquid lipid (Oleic acid, Labrafil, Maisine HS 15, Labrafil+Maisine HS 15) in Eppendorf tubes. The tubes were tightly closed and shaken for 72 h at 25°C ± 2°C in a mechanical shaker. The mixture was centrifuged (REMI, model-mLab's-R-23, Mumbai, India) at 10,000 rpm for 10 min to separate the supernatant. 24 The concentration of the drug in the supernatant was estimated by UV-Vis spectrophotometer (Shimadzu-1800) at 240 nm after suitable dilution by ethanol.
Selection of binary mixture of solid and liquid lipid
Both solid and liquid lipid should be mixed properly for the development of NLCs with the best imperfections in the internal structures. The selected solid and liquid lipids were subjected to miscibility studies. Both lipids in various ratios (9:1, 8:2, 7:3, 6:4) were mixed and vortexed for 5 min. The mixture was kept at room temp for 24 h for complete crystallization. The best miscibility between solid and liquid lipid was determined by visual inspection and further assessed by spreading a small amount of mixture onto the filter paper and verify the presence of oil droplets on the filter paper, which would be indicative of immiscibility between lipids. 25 The ratio showing a single-phase system was selected as the best binary phase and this ratio was used for future study.
Selection of surfactants for NLC formulation
The selection of surfactant was based on its capability to solubilize the drug and lipid. The excess amount of LAC was added in 2 mL of different surfactants (tween 20, poloxamer 188, polyethylene glycol 400, and solutol HS 15) in a glass vial and the mixture was shaken continuously for 72 h. After that mixture was centrifuged (Universal 320R; Hettich Centrifuge, Germany) at 10,000 rpm for 10 min and the supernatant was collected. The concentration was quantified by UV-Vis spectrophotometer (Shimadzu-1800) at 240 nm in triplicate.
Optimization of LAC-NLCs by design expert software
In this study, a three-factor, three-level Box-Behnken design (DoE, version 9.0.1; State-Ease, Inc., Minneapolis) was used for the optimization of LAC-NLCs. The concentration of lipid (% w/v) (X1), surfactant (% w/v) (X2), and sonication amplitude (Hz) (X3) were used as independent variables. Their effects were observed on the PS (nm) (Y1), PDI (Y2), and EE (%) (Y3) (Table 1). Total 17 batches with different compositions of the independent variables with five center points (same composition) were obtained from DoE (Table 2). These formulations were prepared and the data of responses were fitted to the software to get the predicted response. Analysis of variance (ANOVA) and regression coefficient (R 2 ) of all models, that is, linear, second-order, and quadratic, were analyzed for obtaining the best-fitted model. 6 The 3D response surface plot and the polynomial equation were used to depict the effect of independent variables on a response.
Formulation Variables and Responses for Nanostructured Lipid Carrier
EE, entrapment efficiency; PDI, polydispersity index; PS, particle size.
Formulation Compositions and the Observed Particle Size (Y1), Polydispersity Index (Y2), and Entrapment Efficiency (Y3)
Centre point.
Preparation of LAC-loaded NLCs
The preemulsion probe sonication technique was used for the development of LAC-NLCs. 26 An appropriate quantity of selected solid lipid was melted at 5°C above its melting point followed by the addition of liquid lipid under continuous stirring. LAC was dissolved in the above lipid mixture and then a hot aqueous surfactant solution was added dropwise into the oil phase (lipid) under constant stirring (Magnetic stirrer; VELP, Scientifica, Europe) at 600-650 rpm to form the primary emulsion. The preemulsion was sonicated for 10 min using a probe sonicator (Qsonica, CL-18, Q125, New Town, CT) to get the NLCs dispersion. The dispersion was cooled at room temperature and stored for further study.
Physiochemical Characterization of LAC-NLCs
PS, PDI, and zeta potential
PS, PDI, and zeta potential of all prepared NLCs were measured by dynamic light scattering method using zeta-sizer (Nano-ZS, Malvern Instruments, Malvern, UK). All samples were diluted 10 times with deionized water and placed in the quartz cuvette for the measurement of the PS. The migration velocity, that is, zeta potential, was also measured with the same procedure and the same instrument to evaluate the surface charge.
Morphological examination
The internal structure, as well as surface texture of optimized LAC-NLCs-opt dispersion, was observed by using a transmission electron microscope (TEM; Morgagni 268D TEM Fei) at 70 kV. Phosphotungstic acid (1% w/v) was used to stain the sample and the image was visualized by the Si-viewer software to capture the image.
Scanning electron microscopy
Scanning electron microscopy (SEM) photomicrograph of LAC-NLC-opt was captured by SEM-Instrument (Carl Zeiss EVO 40, Germany) for surface morphology examination. The lyophilized NLCs were placed on an aluminum stub and coated with gold and examine at 10 kV voltage under an argon atmosphere.
EE and drug loading
The EE and drug loading (DL) capacity of LAC-NLCs were determined by the ultrafiltration centrifugation method.
27
The definite volume (10 mL) of NLCs dispersion was placed in the centrifugation tube, and it was centrifuged (REMI, model-mLab's-R-23, Mumbai, India) at 15,000 rpm for 10 min. The free drug concentration in the supernatant was measured by UV-Vis spectrophotometer at 240 nm. The EE and DL were calculated by the following equation.
Thermal Analysis
For thermal analysis, ∼3 mg of sample was kept in the aluminum pan (DSC pan) and kept in the DSC instrument (DSC6 instrument Perkin Elmer, MA). The sample was scanned at 20°C–300°C with a heating rate of 10°C min under a nitrogen environment (20 mL/min).
X-Ray Diffraction Analysis
Solid-state characterization, that is, crystallinity study of the different formulations, was done by the X-ray diffraction (XRD) method. Powder X-ray diffraction of each sample was performed by XRD instrument (PAN analytical X'pert PRO) at two modes from 5° to 60° with a speed of 2°/min.
Drug Release and Kinetic Study
Dialysis membrane (molecular weight 12,000–14,000 KDa) was used for the study of LAC release from LAC-NLC-opt and LAC-dispersion using phosphate buffer (pH 6.8; 200 mL) as release medium. LAC-NLC-opt dispersion (equivalent to 2 mg of LAC) was filled in the dialysis bag and it was tightly bound on both ends. The dialysis bag was immersed into the release medium (200 mL) present in a beaker. The study was performed at 37°C ± 0.5°C with continuous stirring (100 rpm). Released content (5 mL) was withdrawn at fixed time intervals from the beaker and the same volume of fresh medium was added to maintain constant volume as well as sink condition. Finally, LAC concentration was analyzed by UV-Vis spectrophotometer at 240 nm. The release data of LAC-NLCs-opt was fitted into various kinetic release models like zero order, first order, Higuchi, Korsmeyer Peppas, and Hixon-Crowell for finding the best fit model. 6
Ex Vivo Intestinal Permeation Study
The albino Wistar rat intestine was used for the permeation study. The rats were procured from the animal house and the study was conducted as per approved protocol. The rats (200–250 g) were sacrificed and the long ilium (5 cm) was collected immediately and flushed with normal saline. The LAC-dispersion and LAC-NLCs-opt (equivalent to 2 mg of LAC) were filled in the separate segment of the intestine from the mucosal side and tightly ligated. The filled intestine was immersed in a beaker containing 100 mL Kerbs solution (7.0 g NaCl, 0.35 g KCl, 0.28 g CaCl2, 0.28 g MgSO4, 2.1 g NaHCO3, 0.16 g KH2PO4, 1.0 g glucose).
The study was performed at 37°C ± 0.5°C with continuous stirring (100 rpm) and aeration (95% oxygen). At a definite time interval, permeated content (2 mL) was collected and replaced with the same volume of fresh Kerbs solution. The amount of LAC permeated through the intestine was analyzed by the validated HPLC method as explained earlier
Biological Evaluation of LAC-NLCs
Pharmacokinetic study
The study was conducted on albino Wistar rats as per approved protocol. The rats were divided into two groups (group 1 and group 2), and each group contained six rats. The animals were kept under fasting conditions for 12 h before the conduction of the study. A single dose of LAC-dispersion and LAC-NLCs-opt (0.35 mg/kg body weight) were administered orally by using 18-gauge oral feeder. The rats were anesthetized using diethyl ether and blood samples were withdrawn from the tail vein of each rat at 0 (pre-dose), 0.5, 1, 2, 4, 8, 12, and 24 h and collected in ethylenediamine tetraacetic acid tubes.
The samples were centrifuged (REMI, model-mLab's-R-23, Mumbai, India) at 5,000 rpm for 10 min to separate the plasma. LAC was extracted by adding 500 μL of formic acid (5% w/v) and 1.5 mL of ethyl acetate, followed by centrifugation (REMI, model-mLab's-R-23, Mumbai, India) at 6,000 rpm for 5 min at 20°C. The supernatant was withdrawn and dried using a nitrogen evaporator. The residue was reconstituted with methanol (500 μL) and injected into the HPLC system. Various pharmacokinetic parameters like maximum concentration of drug (Cmax), Time to reach at Cmax (Tmax), and so on were determined by fitting the plasma concentration-time data to the noncompartment model using PK Functions for Microsoft Excel (Pharsight Corporation, Mountain View, CA). The relative bioavailability (%) of LAC-NLCs-opt was determined by the following equation:
After completion of the experiments, the animals were preserved and a standard diet was given to the experimental animals for recovery. Died animals were suitably packed and deeply buried.
Pharmacodynamic studies
The study was conducted on albino Wistar rats. The rats were trained three to four times for 30–60 min into a restrainer before the start of the experiment to acclimatize the condition. The animal was divided into four groups (group A–D). Group A as normal control, group B as hypertension control; group C as LAC-dispersion treatment, and group D as LAC-NLCs-opt. The hypertension was created by subcutaneous administration of 20 mg/kg of methylprednisolone (MP) (DEPO-MEDROL-40 mg/mL) for 1 week. 25
The blood pressure of all animals was tested before and after induction of hypertension by a BP instrument (LE 5002 Storage Pressure Meter). LAC-dispersion and LAC-NLC-opt (1 mL equivalent to 0.07 mg, 0.35 mg/kg LAC) were administered in the animals of groups C and D, respectively. The blood pressure was measured for 1 week. The rats were placed into a restrainer and the tail was stricken with a sensor and pressed the pulse key of the instrument (thermosensitive). The systolic and diastolic BP was displayed on the screen and noted the reading.
Statistical Analysis
All outcomes are expressed as mean ± SD. A one-way ANOVA was done followed by Tukey's multiple comparison test using GraphPad (Graph Prism Stat). The comparison was made at p < 0.05.
Results and Discussions
High-Performance Liquid Chromatographic
This method was used for the estimation of LAC concentration in the blood plasma
Selection of Solid and Liquid Lipids
The selection of lipids was done on basis of the maximum solubility of LAC in the examined lipids. The order of drug solubility in various solid lipids was found to be as GMS > stearic acid > precirol AT05 > compritol 888 ATO (Fig. 1A). The maximum solubility of LAC was found to be in GMS (75.29 ± 4.73 mg/g).
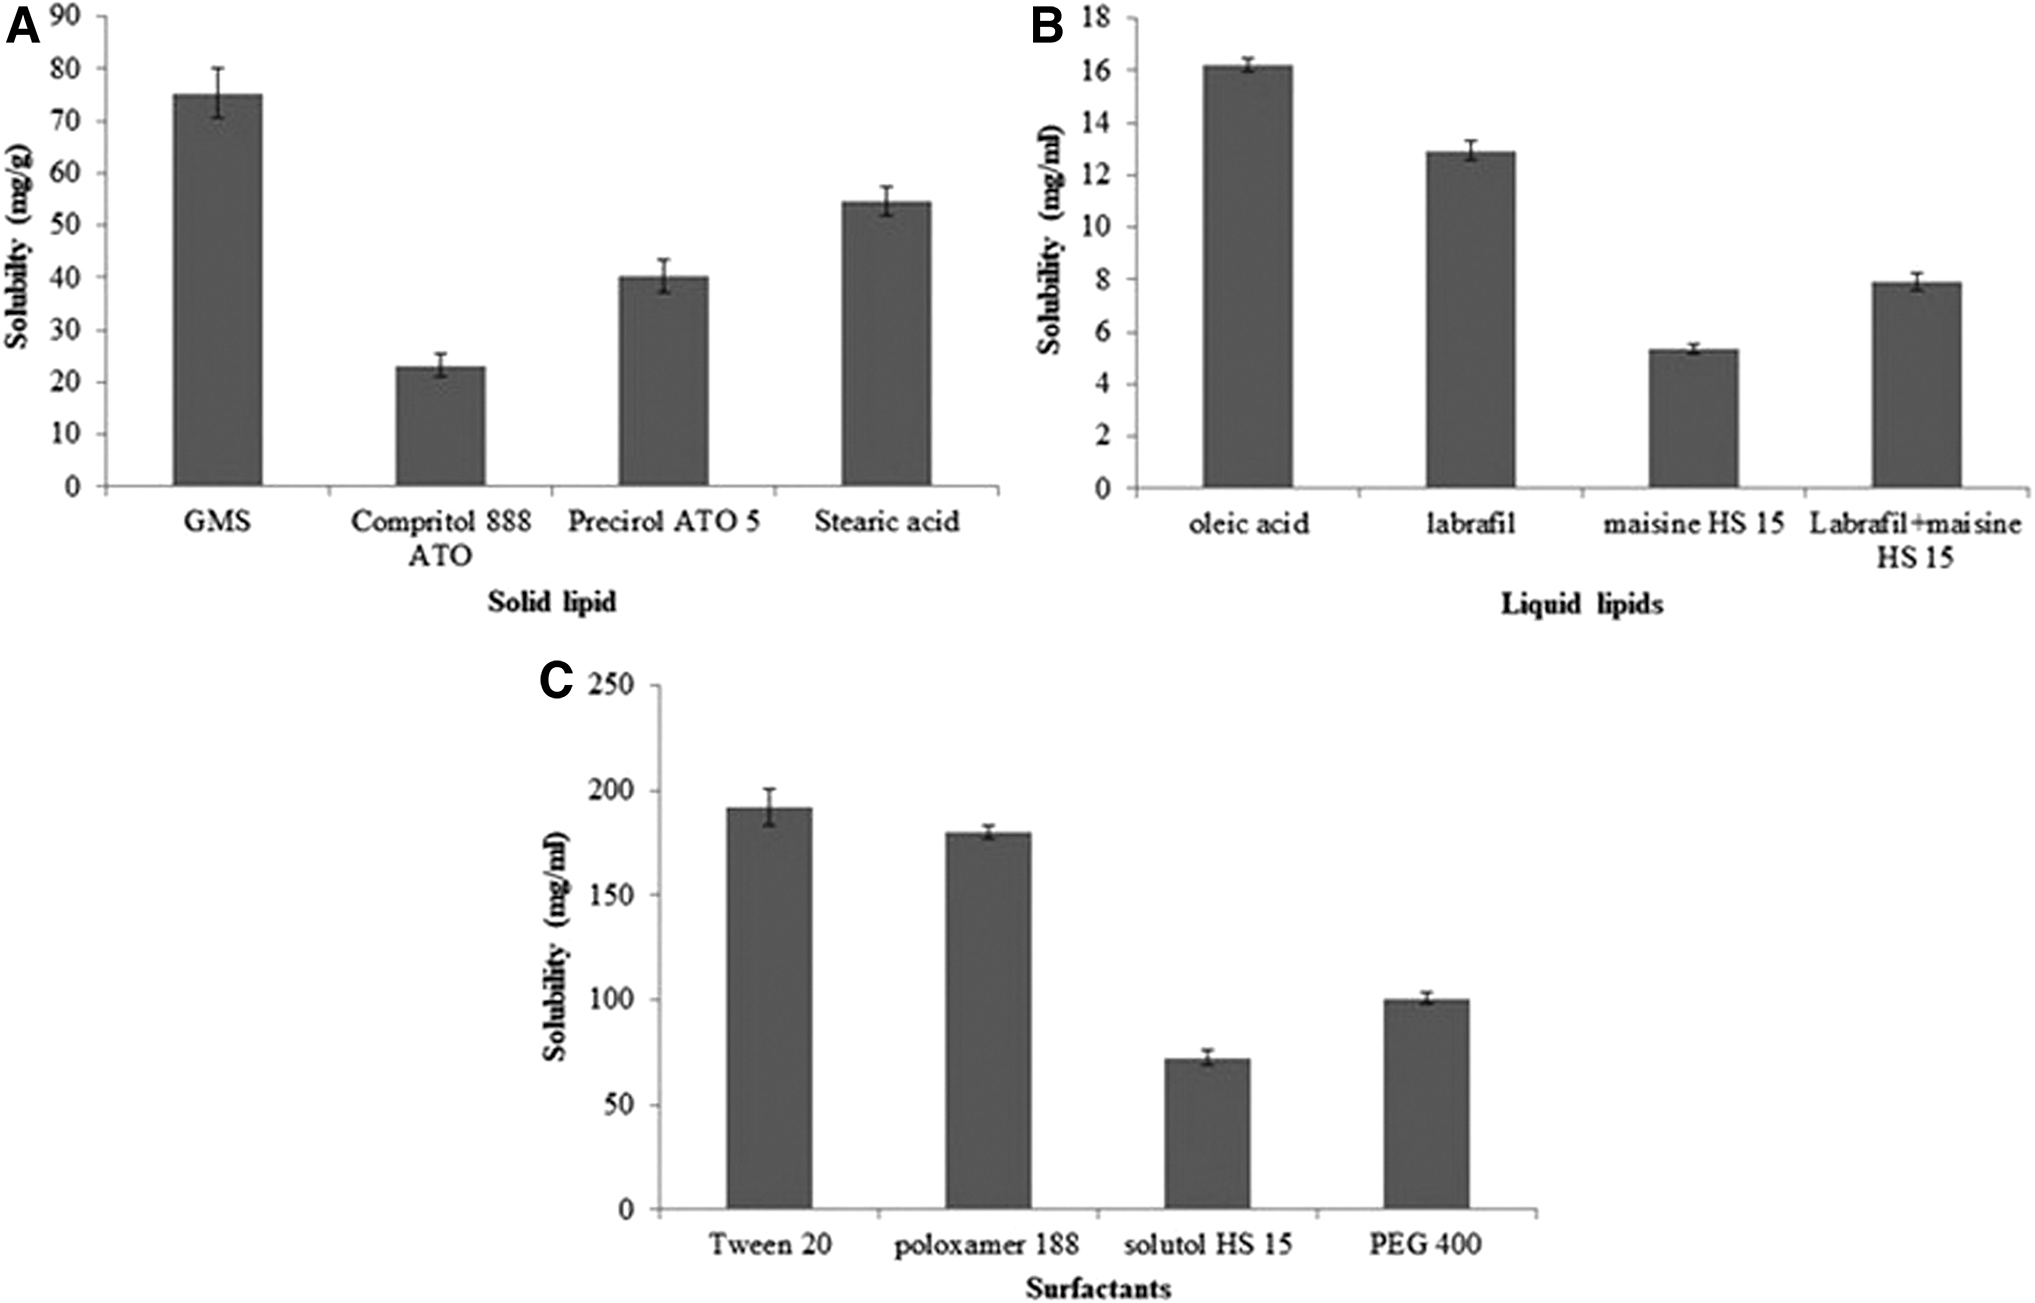
Solubility of LAC in solid lipid
Moreover, GMS exhibits a less-ordered structure compared to other lipids, that is why it accommodates more amount of drugs. Another reason, GMS exhibits a surfactant property that further enhances the drug solubility. The order of drug solubility in liquid lipids was found to be as oleic acid > labrafil > maisine HS 15 > labrafil+maisine HS 15 (Fig. 1B). The highest LAC solubility was found in oleic acid (16.20 ± 0.24 mg/mL). So, the GMS and Oleic acid were selected as solid and liquid lipid, respectively, for the preparation of NLCs. The applicability of GMC and oleic acid for oral delivery has been already justified and reported in the literature. 28,29
Selection of Surfactant
The type and concentration of the surfactant have a direct impact on the quality of SLN dispersion, including the PS and EE. Surfactant reduces the interfacial/surface tension and facilitates the particle partition during homogenization (27). The selection of surfactants was based on the maximum solubility of the drug in the tested surfactants. The order of LAC solubility in different surfactants was found as tween 20 > poloxamer 188 > PEG 400 > solutol HS 15 (Fig. 1C). The highest solubility of LAC was found to be in tween 20 and so it was selected for the formulation of NLCs. Tween 20 is a biocompatible, nonionic, nontoxic surfactant and approved for human use. The applicability of tween 20 was already evaluated and reported. 30
Selection of Binary Mixture of Solid and Liquid Lipid
The miscibility study of selected solid and liquid lipid was done to determine the maximum solubility of LAC in the blend ratio and used for formulation development. 24 The miscibility was done in the different ratios of selected solid and liquid lipid that is, 7:3, 6:4, 8:2, and 9:1. Among them, the combination 9:1 showed good miscibility with LAC and showed complete solubility.
Preparation and Optimization of LAC-NLCs
LAC-NLCs formulations were developed by the preemulsion probe sonication method. 31 The formulation was optimized by Box-Behnken statistical design. The different NLCs formulation composition and responses (PS, PDI, and EE) of each formulation were determined and presented in Table 2. The PS, PDI, and EE of all the prepared formulations were in the range of 177.55–211.15 nm, 0.074 ± 0.01–0.42 ± 0.04, and 77.5% ± 2.23%–91.76% ± 2.89% respectively. The data of each response were fitted into various models (linear, second-order, quadratic, and cubic) and the quadratic model was found to be the best fit model for all responses (Table 3).
Statistical Regression Analysis of All Used Model Obtained from Software
CV, coefficient of variance; SD, standard deviation.
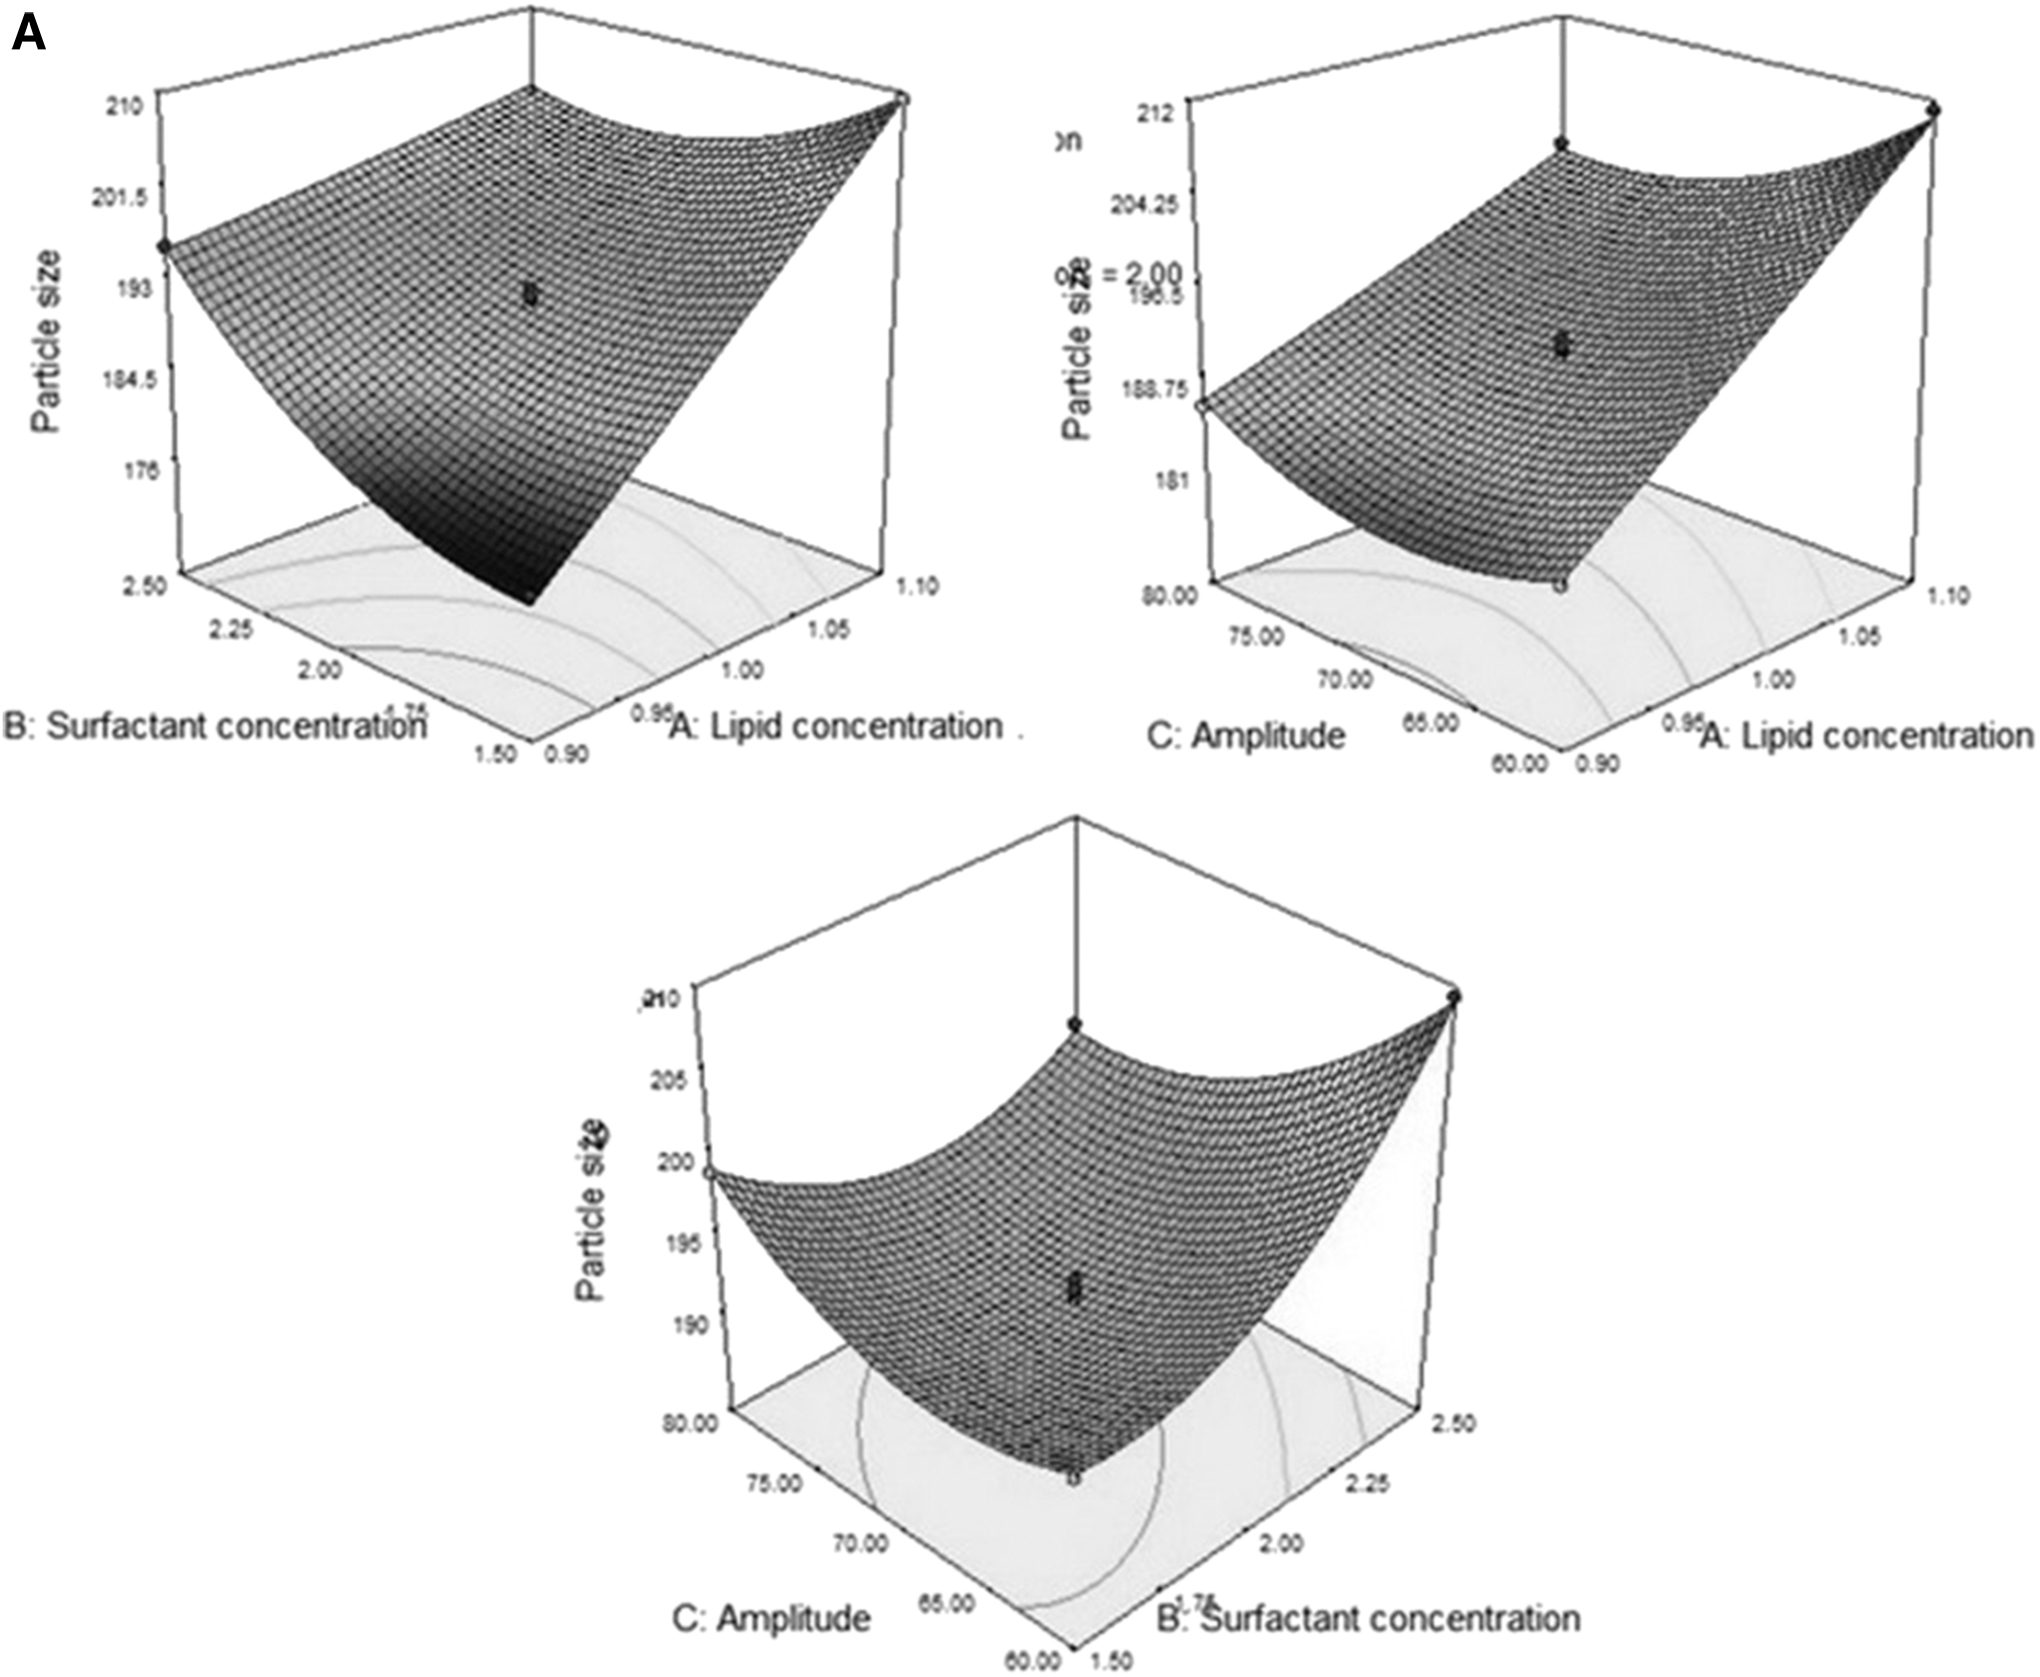
The polynomial equation and 3D plot ( Fig. 2A–C ) of each response were analyzed and defined the effect of independent variables on the response. The lack of fit of each response was nonsignificant (p > 0.05) indicating that the model was well fitted. The statistical regression analysis of each model for each response was analyzed and depicted in Table 3. ANOVA of each response was calculated for the best fitted quadratic model and showed the p < 0.0001, which represents that the model was well-fitted (Table 4).


Analysis of Variance of the Best Fitted Quadratic Model of Each Response
ANOVA, analysis of variance.
Effect of Formulation Variables on PS
Following second-order polynomial equation was obtained from software indicating the effect of the independent variables on PS (Y1):
The positive and negative signs of the polynomial equation represent the synergistic and antagonistic effect of the variables on PS, respectively. The model F-value was found to be 250, which implied that the model was significantly fitted. The value of p < 0.05 indicated that the model terms were significant. In this case, X1, X2, X1X2, X1X3, X2X3, X1 2 , X2 2 , and X3 2 were found to be significant model terms; that is, these terms exhibited a significant effect on PS. The F-value of lack of fit was 2.16 and the p-value was 0.24 (p > 0.05) indicating nonsignificant. The predicted R 2 (0.8250) was in reasonable agreement with the adjusted R 2 (0.9692), which indicated that the model was well fitted. The 3D surface plot of PS was generated and depicted in Figure 2A. It expressed the effect of different factors on one response at one time.
The polynomial equation showed that the PS (Y1) of NLCs was increased with increasing the lipid concentration (X1). This might be due to the increased viscosity of formulation that creates difficulty in the mixing of formulation components, that is, surfactant. Moreover, increased viscosity is responsible for the reduction of emulsification power of surfactant, hence, the interfacial tension was increased comparatively and particles coagulate to each other and become big size.
This result is in line with previously reported research work. 26 The surfactant (X2) showed a negative effect on the PS of NLCs. The increased surfactant concentration decreased the PS of NLCs. This might be due to the reduction of surface tension between two segments resulting in the increased emulsification power, thereby reducing the PS. The obtained results of PS are in good agreement with the previously reported findings. 32,33 Moreover, an increase in the probe sonicator amplitude (X3) results in a slight decrease in PS due to the breakdown of NLCs particles.
Effect of the Formulation Variables on PDI
Following, second-order polynomial equation was obtained from software indicating the effect of the independent variables on PDI (Y2):
The main index of X1, X2, and X3 are the model terms. The model F-value was 131.03 and indicated that the model was significant (p < 0.05) and well fitted. The polynomial equation showed that the terms X1, X3, X1X3, X1 2 , X2 2 , and X3 2 were significant model terms (p < 0.05), while X2 and X1X3, were insignificant model terms (p > 0.05). The regression coefficient was closed to unity (R 2 = 0.9941), indicating that the actual and predicted values of PDI were not significantly different from each other (Table 3). The PDI of all NLCs formulations was found to be in the range of 0.089 -0.36 (Table 2). On increasing the lipid concentration (X1), the PDI was improved significantly due to the increased viscosity of the formulation.
Also, on increasing the sonication amplitude (Hz), the PDI of NLCs was increased due to the breakdown of NLCs particles, resulting in the formation of particles of unequal size. 34 Furthermore, the surfactant concentration did not affect the PDI significantly (p > 0.05). The individual and interaction effect of formulation factors over the response is expressed by 3D plots (Fig. 2B).
Effect of Formulation Variables on EE
Following second-order polynomial equation was obtained from software indicating the effect of the independent variables on EE (Y3):
The F-value of the quadratic model for EE was 758.85, indicating that the model was significant (p < 0.05) and well fitted. In this case, X1, X2, X3, X1X2, X1X3, X2X3, X2 2 , and X3 2 were significant model terms. The lack of fit was nonsignificant and adequate precision was 98.347 (>4), which specified that the model was accurate and well fitted. The R 2 for the quadratic model was 0.9999, which indicates the closeness between the actual and predicted values of EE. From the polynomial equation, it was stated that lipid exhibited a positive effect on EE. It increased with increasing the lipid concentration (X1). It was due to the availability of a higher amount of lipid for the solubilization of the drug.
A similar effect was observed with surfactant concentration. On increasing the surfactant concentration, the EE was increased. This might be due to the formation of the rigid layer of surfactant around the drug-lipid particles that restricted the drug in the lipid core. Further, it prevents the leaching of the drug from the NLCs matrix and is also responsible for the protection of the drug. 31,35 On the contrary, on increasing the probe amplitude (Hz), the EE (%) was decreased due to the leaching of LAC from the NLCs matrix. 34 The individual and interaction effect of formulation factors over the response is depicted in Figure 2C.
The optimized formulation (LAC-NLCs-opt) was selected from the point prediction method and the best composition consisted of (GMS: OA, 6:4; 1% w/v), surfactant concentration (tween 20; 2.0% w/v), and 70 Hz amplitude of probe sonicator. The predicted value of the responses was 194.9 nm for the PS, 0.095 for PDI, and 87.56% for EE, whereas the actual value of PS, PDI, and EE was 191 ± 5.89 nm, 0.074 ± 0.013, and 87.92%, respectively. There was very little difference between actual and predicted values; so, this formulation was used for further study.
PS, Distribution, and Zeta Potential
The PS and PDI of LAC-NLCs were measured and depicted in Table 2. LAC-NLCs-opt has shown the PS 191 ± 5.89 nm and PDI 0.074 ± 0.013 (Supplementary Fig. S1A). The low value (<0.3) of PDI indicated a higher uniformity between the particles. The zeta potential was found to be −28.9 ± 0.99 mV, demonstrated higher stability of NLCs formulation (Supplementary Fig. S1B). A higher value of zeta potential is required for proper stability. Here, the value is far from zero and hence will provide desired stability to the nanoformulation and prevent the aggregation of particles. 36
EE and DL
The % EE and % DL were determined by centrifugation method and analyzed by UV-Vis spectrophotometry. The % EE and % DL of LAC-NLCs-opt were found to be 90% ± 3.69% and 9.26% ± 1.89%, respectively.
Morphological Examination
The morphology and internal structure of LAC-NLCs-opt were determined by SEM and TEM technique, respectively, and images are depicted in Figure 3. TEM and SEM images confirmed that the NLCs were uniform in size, spherical in shape, with smooth surfaces without any visible aggregation (Fig. 3A, B).
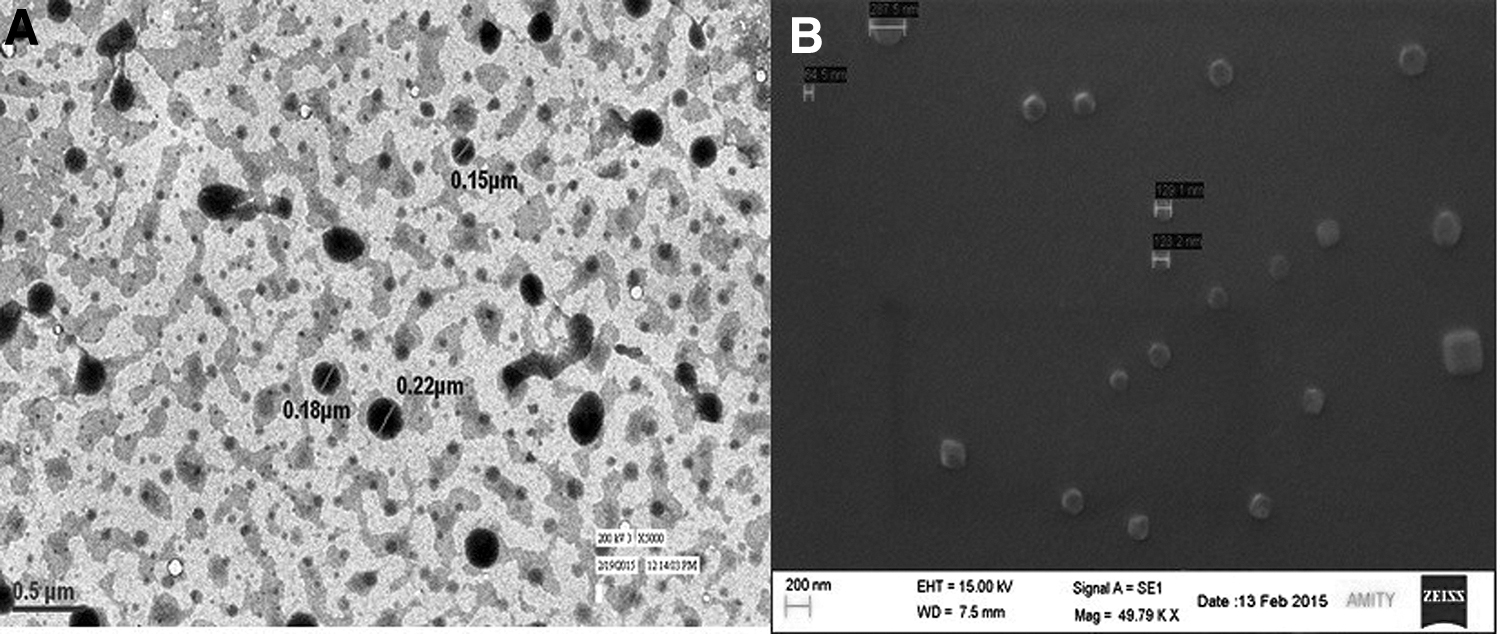
Image of TEM
Thermal Analysis
The thermal analysis of LAC, physical mixture (LAC + lipid), and LAC-NLCs-opt was carried out by DSC (Fig. 4). The pure LAC exhibited a sharp single endothermic peak at 183.49°C, corresponding to the melting point of the crystalline drug (Fig. 4A). The physical mixture showed two peaks corresponding to 61.586°C and 176.382°C, indicating the peak of lipid and drug, respectively (Fig. 4B). The thermogram of LAC-NLCs-opt showed a slightly broad peak with a reduced melting point (60.908°C) of the used lipid while the drug peak was absent (Fig. 4C). This may be due to the incorporation or solubilization of LAC in the lipid matrix in an amorphous and/or molecularly dispersed form. Amorphous form exhibiting better solubility than crystalline form due to less ordered structure as molecules are randomly oriented in a variety of conformational states. 37
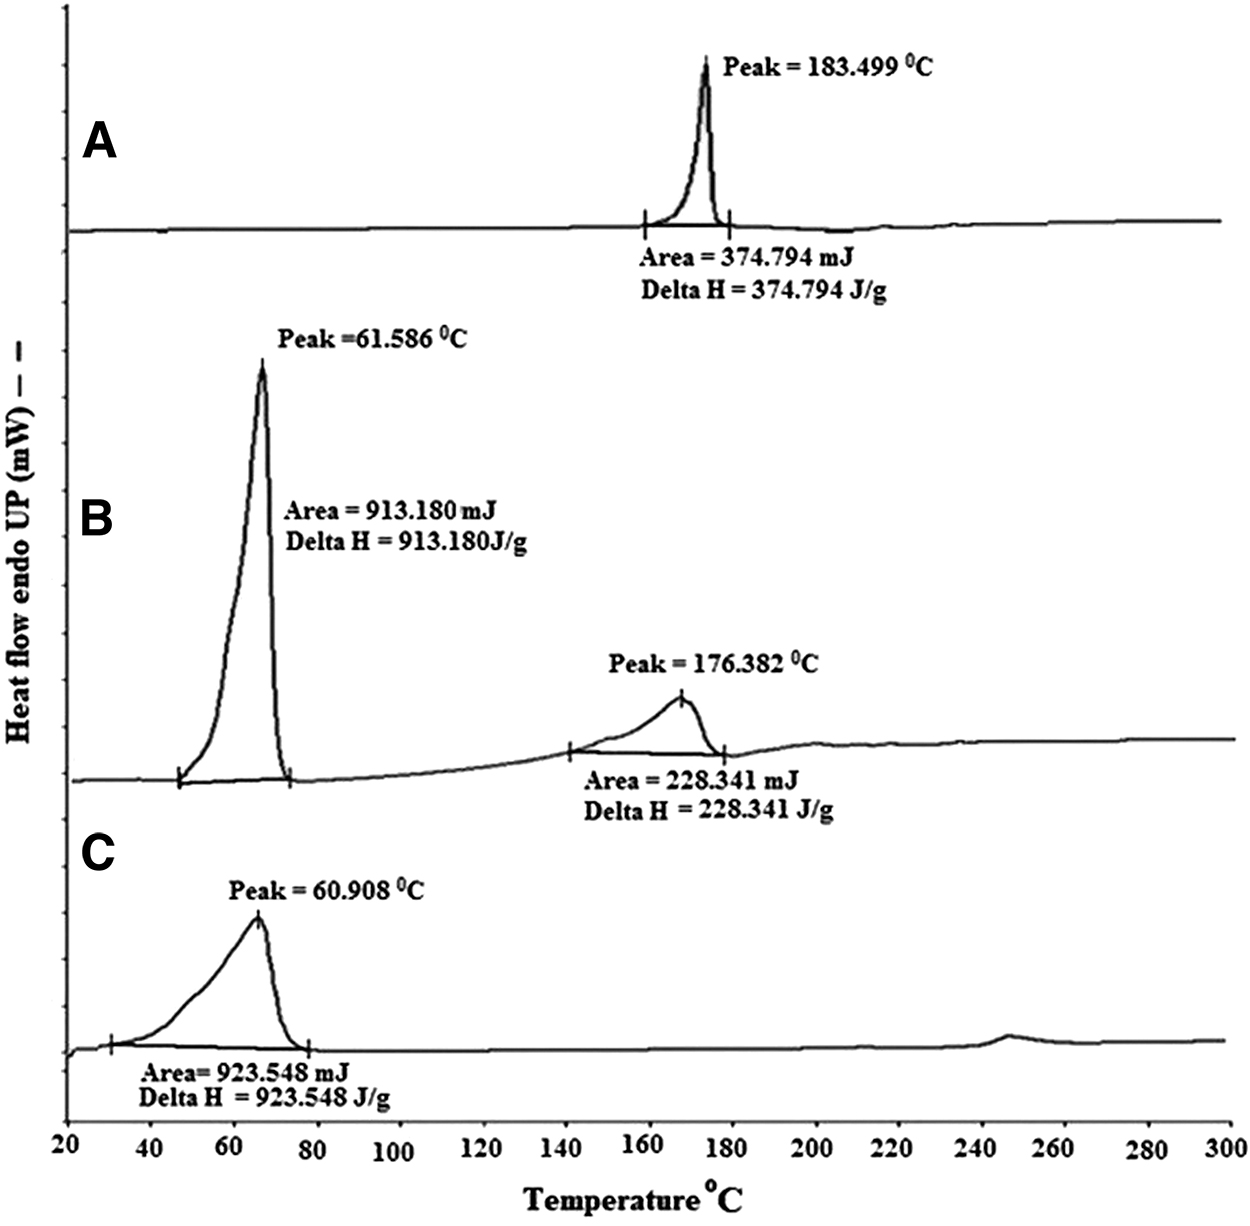
Thermogram of LAC
XRD Analysis
X-ray diffractogram (Fig. 5A) of LAC showed the characteristic peaks at 7.61°, 13.31°, 14.71°, 17.22°, 23.54°, 25.32°, 26.35°, and 27.95°, while physical mixture (Fig. 5B) exhibited characteristic peak of lipids in the range of 5°–60°, that is, 9.6, 13.6, 17.28, 20.98, 21.19, and 36.10 along with some drug peaks. However, LAC peaks are completely disappeared in the diffractogram of LAC-NLC-opt. Here, only lipid peaks are appeared (Fig. 5C), which confirm that SIM did not crystallize in the lipid matrix. Further, LAC lost its crystallinity and converted into an amorphous state. 37,38
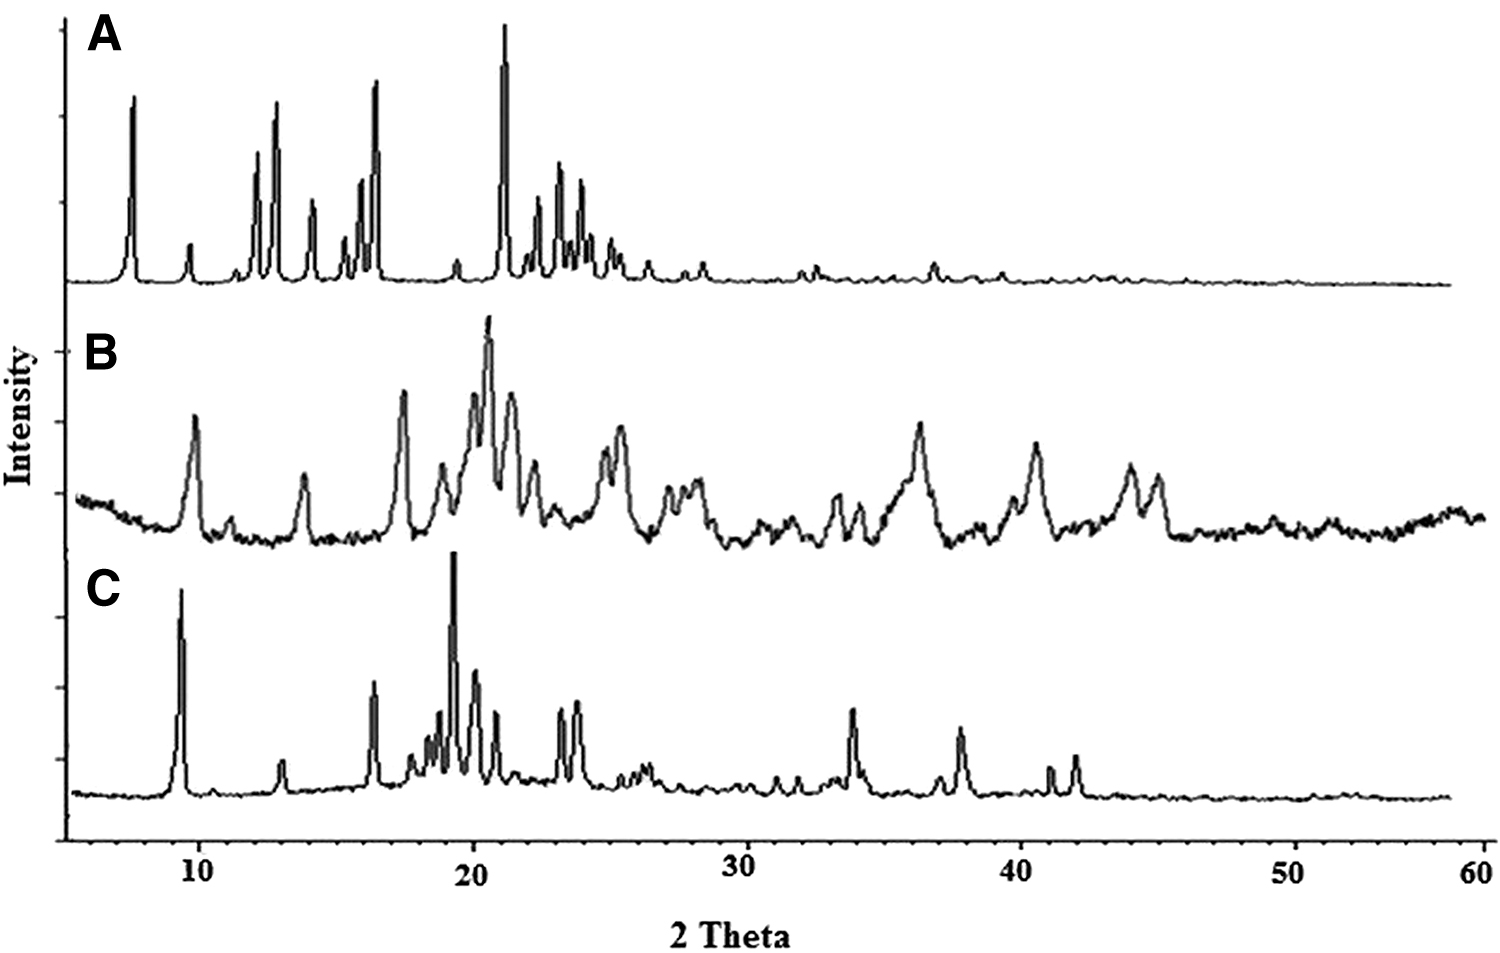
XRD spectral of LAC
In Vitro Drug Release Study
The drug release study was performed for LAC-NLCs-opt and LAC dispersion using phosphate buffer (pH 6.8) as a dissolution medium (Fig. 6). LAC-NLCs-opt formulation exhibited a biphasic drug release pattern that is, initial fast release (27.97% ± 2.96% in first 2 h) followed by slow and sustained release (88.49% ± 3.01%) up to 24 h. The initial quick drug release might be due to the presence of the LAC on the surface of NLCs (provides instantaneous action and increased the permeation) and slow/prolonged drug release might be due to entrapped drugs in the lipid matrix. The prolonged drug release of LAC can maintain the therapeutic concentration at the site of action. 38

The release profile of LAC from LAC-NLCs-opt and LAC-dispersion.
However, LAC dispersion has shown lesser release, that is, 34.27% ± 3.01% in 24 h. It might be due to the poor aqueous solubility of LAC. Various kinetic models were fitted to the release profile of LAC-opt formulation to obtain the best release model. The regression coefficient (R 2 ) for each model was determined, and it was found to be 0.7742 for zero-order, 0.9173 for first-order, 0.9198 for Higuchi model, 0.9198 for the Korsmeyer-Peppas model, and 0.8943 for Hixon–Crowell model. The Korsmeyer-Peppas model was found to be the best-fitted model with the highest value of regression coefficient (R 2 = 0.9198). The release exponent was found to be 0.557, representing the non-Fickian type of release mechanism, that is, drug release from the LAC-NLC-opt was regulated by diffusion and swelling mechanism. 39,40
Permeation Study
As shown in Figure 7A, B, LAC-NLC-opt exhibited significantly (p < 0.05) higher drug permeation (692.04 ± 19.76 μg) and transport (88.157 ± 4.85 μg/cm2 in 2 h) as that of LAC-dispersion (23.83 ± 5.08 μg, 25.415 ± 2.63 μg/cm2 in 2 h). This might be due to the presence of surfactants in NLCs, which enhanced the permeability of drug molecules through the mucosal membrane. The APC of the NLCs and dispersion was found to be 7.39 × 10⁻² cm/min and 1.83 × 10⁻² cm/min, respectively, indicating that optimized formulation exhibited better permeation than that of LAC-dispersion.

Graph showing the cumulative amount of drug permeated
The higher APC of LAC-NLCs-opt might be due to the composition of NLCs, that is, lipids and surfactants. The presence of lipid and surfactant expectedly enhanced the solubility and permeability of the drug as well as decreased the Pgp efflux. Another reason for better solubility and permeability was the nanosize of NLCs, which offered high effective surface area and hence better dissolution. 41,42 The value of ER was found to be 3.47 indicating more than 3 times enhancement of drug permeation through NLCs compared to the pure drug dispersion.
In Vivo Study
Pharmacokinetic study
The pharmacokinetic study of LAC-Dispersion and LAC-NLCs-opt was conducted on albino Wistar rats and compared to each other. The plasma concentration-time profile graph is depicted in Figure 8A. Cmax value (56.51 ± 10.63 ng/mL) obtained from plasma concentration-time profile of LAC-NLCs-opt was found to be significantly (p < 0.05) higher than that of LAC-dispersion (20.36 ± 4.32 ng/mL) while Tmax (4 h) was similar in both cases. LAC-NLCs-opt exhibited significantly (p < 0.05) higher area under the curve (AUC)0–t (902.43 ± 12.65 μg. h/mL) and AUC0–∞ (1,440.90 ± 14.76 μg. h2/mL) than LAC-dispersion (AUC0–t 261.64 ± 11.75 μg. h/mL and AUC0–∞ 350.38 ± 12.65 μg.h 2 /mL). This might be due to slow elimination as well as the prolonged release of the drug from the formulation. The elimination rate constant of LAC-NLCs-opt was found to be 0.04 h−1, which was significantly less than LAC-dispersion (0.06 h−1).

Graph showing LAC plasma concentration-time profile
The half-life of LAC-NLCs-opt (16.12 ± 0.3 h) was found to be higher than LAC-dispersion (11.13 ± 0.15 h) indicating the prolonged effect of LAC from the lipid matrix. However, LAC-NLCs-opt showed 3.45-folds higher bioavailability than that of LAC-dispersion. The significant enhancement of LAC bioavailability might be due to the nanosize and higher surface area of developed NLCs. The lipids and surfactant were expectedly responsible for the enhancement of luminal solubility and permeability of the drug. 43,44
Pharmacodynamic study
Figure 8B and C represent the systolic blood pressure (SBP) and diastolic blood pressure (DBP) of all the tested animal groups. The antihypertensive effect of LAC-dispersion and LAC-NLCs-opt was evaluated in methylprednisolone-induced rats. A significant (p < 0.001) increment in SBP was observed in the disease control (138.5 ± 2.95 mmHg) group B compared to the normal control group A (99.32 ± 3.22 mmHg). LAC-NLCs-opt significantly (p < 0.001) reduced (101.3 ± 4.3) in SBP in MP+NLCs group (group C) than MP-treated group B, in 1 week of treatment.
Moreover, LAC-dispersion also exhibited a significant (p < 0.001) reduction in SBP (110 ± 4.0 mmHg, Group D) compared to MP-treated group (138.5 ± 2.95 mmHg, Group B), but it showed a less significant effect than LAC-NLCs-opt. On the contrary, the DBP was significantly risen (10 mmHg) in MP-treated rats (97 ± 2.65, group B) compared to normal control rats (87 ± 3.0, group A). LAC-NLCs-opt and LAC-dispersion exhibited a significant reduction in DBP that is, 89 ± 3.0 and 93.67 ± 3.0 mmHg, respectively (group C and group D), than diseases control (group B). The result revealed that LAC-NLCs-opt exhibited a more prominent effect than LAC dispersion due to the presence of lipid and surfactant as well as the nanosize range of NLCs. 45,46
Conclusion
In the present research, LAC-NLCs were successfully developed and optimized by the Box-Behnken design. Several in vitro characterizations of LAC-NLCs like PS, PDI, EE, DL, and so on were carried out and found to be in the acceptable range. LAC-NLCs-opt exhibited the uniform size distribution of particles with a spherical shape, smooth texture. Loss of crystallinity of LAC was detected after its incorporation in NLCs as observed by DSC and XRD study. The release study of LAC-NLCs-opt showed a sustained drug release to 24 h, which might be responsible for the maintenance of adequate drug concentration at the site of action.
The permeation study showed high drug permeation across the intestine than pure LAC-dispersion. In vivo study exhibited 3.45-folds higher oral relative bioavailability than LAC-dispersion. The in vivo pharmacodynamic study of the LAC-NLCs demonstrated a significant control in both systolic and DBP in comparison to LAC-dispersion. Conclusively, the outcomes of the present research showed that the developed NLCs could be an efficient nanodevice for the commercially available conventional formulation to overcome the oral bioavailability-related issue and prolong the therapeutic effect of LAC.
Footnotes
Acknowledgment
The authors are very thankful to Jamia Hamdard, New Delhi, India for providing the facilities.
Disclosure Statement
No competing financial interests exist.
Funding Information
No funding was received for this article.
Supplementary Material
Supplementary Figure S1