




Abstract
Autophagy is a process leading to the degradation of cellular material, in organelles called lysosomes, to supply energy or generate building blocks for the synthesis of new materials. Over the past decades, its role has been evidenced in several indications, notably in neurodegenerative disorders and orphan diseases called lysosomal storage disorders and its modulation is largely envisioned as a therapeutic avenue to alleviate the symptoms and reverse the clinical courses of these indications. Identifying new chemical classes and drugs is, hence, of huge importance. In this study, we developed automated assays to assess the potential efficacy of chemical compounds on different steps of autophagy, notably its induction through the localization of a largely involved transcription factor, transcription factor EB (TFEB). These assays were then used to screen a collection of 1,520 approved drugs. This study led to the identification of five candidate hits modulating autophagy and TFEB subcellular localization. Our results suggest the repurposing potential of already approved drugs in central nervous system disorders with lysosomal storage impairments.
Introduction
Autophagy (or macro-autophagy) is a highly conserved cellular pathway dedicated to the lysosome-based degradation of cytoplasmic material. Those debris, notably long-lived or aggregated proteins or organelles, are engulfed in vacuoles called autophagosomes, which further enter in fusion with lysosomes to form an autolysosome. Lysosomes are composed of continuously replenished hydrolases (glycosidases, proteases, lipases, nucleases, phosphatases, and sulfatases), as well as transmembrane and accessory proteins, involved in the degradation of the autolysosomal content. 1,2
One of the main roles of autophagy is to facilitate degradation of cellular material at the lysosome, which then supplies energy or generates new blocks—amino-acid, small sugars, fatty acids, etc.—for the synthesis of newly needed material. 3 The pathophysiological role of autophagy has been largely evidenced in bacterial and viral infection, neurodegeneration in Alzheimer's disease, Parkinson's disease, Huntington's disease, and Amyotrophic lateral sclerosis, auto-immune diseases, lysosomal storage disorders (LSDs), cancer, as in cardiovascular dysfunction, diabetes, and obesity. 1,4 Often, autophagy presents dual mechanisms, either protecting against a condition or aggravating it, as described for cancer for which both its induction and inhibition have been surprisingly proven as beneficial. 5 Identifying new therapies to target autophagy is hence of high importance for those indications.
To identify new chemical modulators of autophagy, three often-used markers have been used. LC3-II (membrane bound Microtubule-associated protein 1A/1B-light chain 3) is a standard marker of autophagosomes. 6 Transcription factor EB (TFEB) is a transcription factor that, when translocated to the nucleus, binds to the regulatory sequences of genes inducing autophagosome formation, autophagosome–lysosome fusion, hydrolase enzyme expression, and lysosomal exocytosis.
Modulating TFEB presence in the nucleus has been envisioned as a new therapeutic approach to clear toxic protein, notably in neurodegenerative disorders or in LSDs. 7 Finally, lysotracker has been included, as a widely used marker of lysosomes, which is able to monitor acidic subcellular compartments. 8
The identification of genetic or pharmacological regulators of mammalian autophagy has been achieved with different high-throughput and high-content screening (HCS) approaches, using genome-wide siRNA libraries, 9 GFP-LC3 constructs, 10,11 or to validate the efficacy of hits selected from a library of 50,729 compounds. 12 Specifically, TFEB subcellular localization has been used to screen active drugs in N2A 13 and AML12 cells, 14 and to select, among 15,000 compounds, Food and Drug Administration (FDA)-approved drugs, natural products, and small molecules that promote lysosomal maturation via TFEB activation. 15
Amid the active drugs, rapamycin and torin 1 are the most widely used to control autophagy, notably for their impact on TFEB translocation. 16 –19 Pharmacological modulation of autophagy is also achieved by using trehalose, 20 chloroquine, 21 or curcumin, 22 as well as several other compounds. 1
In the current study, we first validated assays to monitor TFEB translocation from the cytoplasm to the nucleus, LC3 spot and lysotracker; these assays were used to screen the Prestwick Chemical Library (PCL) of 1.520 FDA- and European Medicines Agency-approved drugs, to identify autophagy modulators.
Materials and Methods
Reagents, cells, chemical compounds
HEK-293T cells were kindly provided by Dr Jinu Lee (Yonsei University, Korea), and HeLa cells were purchased at ATCC (Manassas). Dulbecco's modified Eagle's medium (DMEM), fetal bovine serum (FBS), PrestoBlue, Lysotracker Far Red, Triton X100, and goat anti-rabbit Alexa Fluor 488 antibody were purchased from Thermofisher (Waltham). Accutase, paraformaldehyde (PFA), Dimethyl sulfoxide (DMSO), Poly-L-Ornithine (PLO), and Bafilomycin A1 (BAF) were purchased from Sigma-Aldrich (St. Louis).
TFEB antibody was purchased from Cell Signaling (Ref. 4240S; Danvers), Hoechst 33342 from Molecular Probes (Eugene), and torin 1—final 2 μM—from MedChemExpress (Monmouth Junction). The 1,520-compound library PCL was purchased from Prestwick Chemical Librairies (Illkirch, France).
Evaluation of TFEB translocation using immunofluorescence assay
A TEFB translocation assay was developed in 96-well plates. Briefly, HeLa cells were seeded at 15,000 cells/well in 96-well tissue culture microplates in DMEM, supplemented with 10% FBS, and allowed to grow for 24 h. Cells were then treated with either vehicle, chemical compounds, or torin 1 during 3 h before fixation with PFA 4%. After fixation, cells were permeabilized with 0.1% Triton X-100, saturated with 10% goat serum, incubated with anti-TFEB rabbit antibody, and revealed with Alexa Fluor 488 antibody and Hoechst 33342.
For each well, 10 fields were automatically imaged at 20 × with a Celllnsight CX7 HCS plateform (Thermofisher), with a minimum of 800 cells per well. With the NucTransV4 application, nuclei were segmented by using the Hoechst staining and a cytoplasm mask was created by the extension of the nucleus region. The average intensity of TFEB staining was then measured in both the nucleus region and the cytoplasm region, and the percentage of TFEB in the nucleus was calculated.
Evaluation of LC3-II spots in LC3-GFP transfected cells
HEK-293T cells were stably transfected with an LC3-GFP plasmid (Invivogen, psetz1 gfplc3) and cultivated under zeocin selection. HEK-293T-LC3-GFP cells were seeded at 20,000 cells/well in PLO-coated 96-well tissue culture microplates (PLO 0.0017% in PBS, 2 h at 37°C before seeding) in DMEM, and they were supplemented with 10% FBS. Cells were then treated with either vehicle, chemical compounds, or torin 1 during 3 h before fixation with PFA 4%; incubation was carried out with Hoechst 33342. As detailed earlier, a minimum of 800 cells were imaged and the number of spots of LC3-GFP per cell was automatically measured by using Celllnsight CX7 and the Spot Detector application.
Evaluation of autolysosomes and lysosomes using lysotracker far red
HeLa cells were treated with either vehicle, chemical compounds, or torin 1 during 24 h; 1 h before fixation, 50 nM Lysotracker 50 nM was added to the wells. Cells were fixed with PFA 4% and incubated with Hoechst 33342. The number of spots of Lysotracker per cell was then automatically measured in at least 800 cells per condition by using Celllnsight CX7 and the Spot Detector application.
High-content screening
The 1,520 compounds of the PCL were tested on the TFEB translocation assay, at three doses (2, 10, and 50 μM final concentration), as described earlier. DMSO (0.02%, 0.1%, and 0.5%) and torin 1 were used, respectively, as bioinactive and bioactive controls. For the secondary screening, the highly ranked 40 hits were tested in duplicate, at three low concentrations (0.4, 2, and 10 μM final concentration), in the TFEB translocation assay, the LC3-II evaluation assay, and the Lysotracker assay. DMSO (0.004%, 0.02%, or 0.1%) and torin 1 were used as controls, as presented earlier.
Dose-response evaluation of cellular viability and autophagic flux
HEK-293T cells were seeded at 20,000 cells/well in PLO-coated 96-well microplates and treated with compounds, with 4 replicates at 10 concentrations ranging from 0.19 to 100 μM. Cellular viability was assessed after a 24-h treatment, using the PrestoBlue reagent according to the manufacturer's protocol, using a multimode reader (Omega, BMG LabTech). For efficacy evaluation, BAF 20 nM or its vehicle was added to the cells, during a 3-h treatment with the compounds; cells were fixed and LC3-II spots were automatically quantified as detailed earlier.
Statistics
Statistical analyses were performed by using GraphPad Prism. Data were analyzed by using Mann-Whitney nonparametric test. In each experiment, a level of p < 0.05 was considered as evidence for a statistically significant effect (*p < 0.05; **p < 0.01; ***p < 0.001). Data are expressed as mean ± standard error of the mean. Z’ score is calculated as previously described. 23,24
Results
Evaluation of the robustness of the screening and orthogonal assays
The TFEB subcellular localization was quantified in a 96-well format, in HeLa cells, after 3 h treatment with either DMSO or torin 1. As expected, after low-dose DMSO treatment, TFEB is mainly localized in the cytoplasm (as in the non-treated group, data not shown) whereas it is highly translocated in the nucleus after torin 1 treatment ( Fig. 1A–C ), with a mean TFEB percentage in the nucleus of 53.0% ± 0.46% and 61.5% ± 0.34% for the DMSO and torin 1 conditions, respectively (Fig. 1C). The Z’ factor (0.71) and the signal over noise (S/N) ratio (18.1) showed a highly robust test, consistent with HCS criteria.

Cell-based assay to follow the subcellular localization of TFEB in HeLa cells by imaging.
The autophagic flux was monitored through LC3-II quantification, measured as the number of spots of LC3-II after 3 h of vehicle or torin 1 treatment in LC3-GFP stably transfected HEK-293T cells. 2A). The number of LC3 spots is significantly higher in the torin 1 condition versus DMSO (2.3 ± 0.23, 0.59 ± 0.07 spots per cell, respectively) ( Fig. 2A, B ). Similarly, the number of spots of lysotracker was evaluated after 3 h of vehicle or torin 1 treatment of HeLa cells, ( Fig. 2C, D ). Lysotracker spot labeling is significantly more intense after torin 1 treatment (33.8 ± 3.95 compared with 5.8 ± 1.62 spots per cell for the control condition). For both assays, Z’ factors (0.47 and 0.40) and S/N ratio (24.1 and 17.3) confirm their robustness as orthogonal assays.
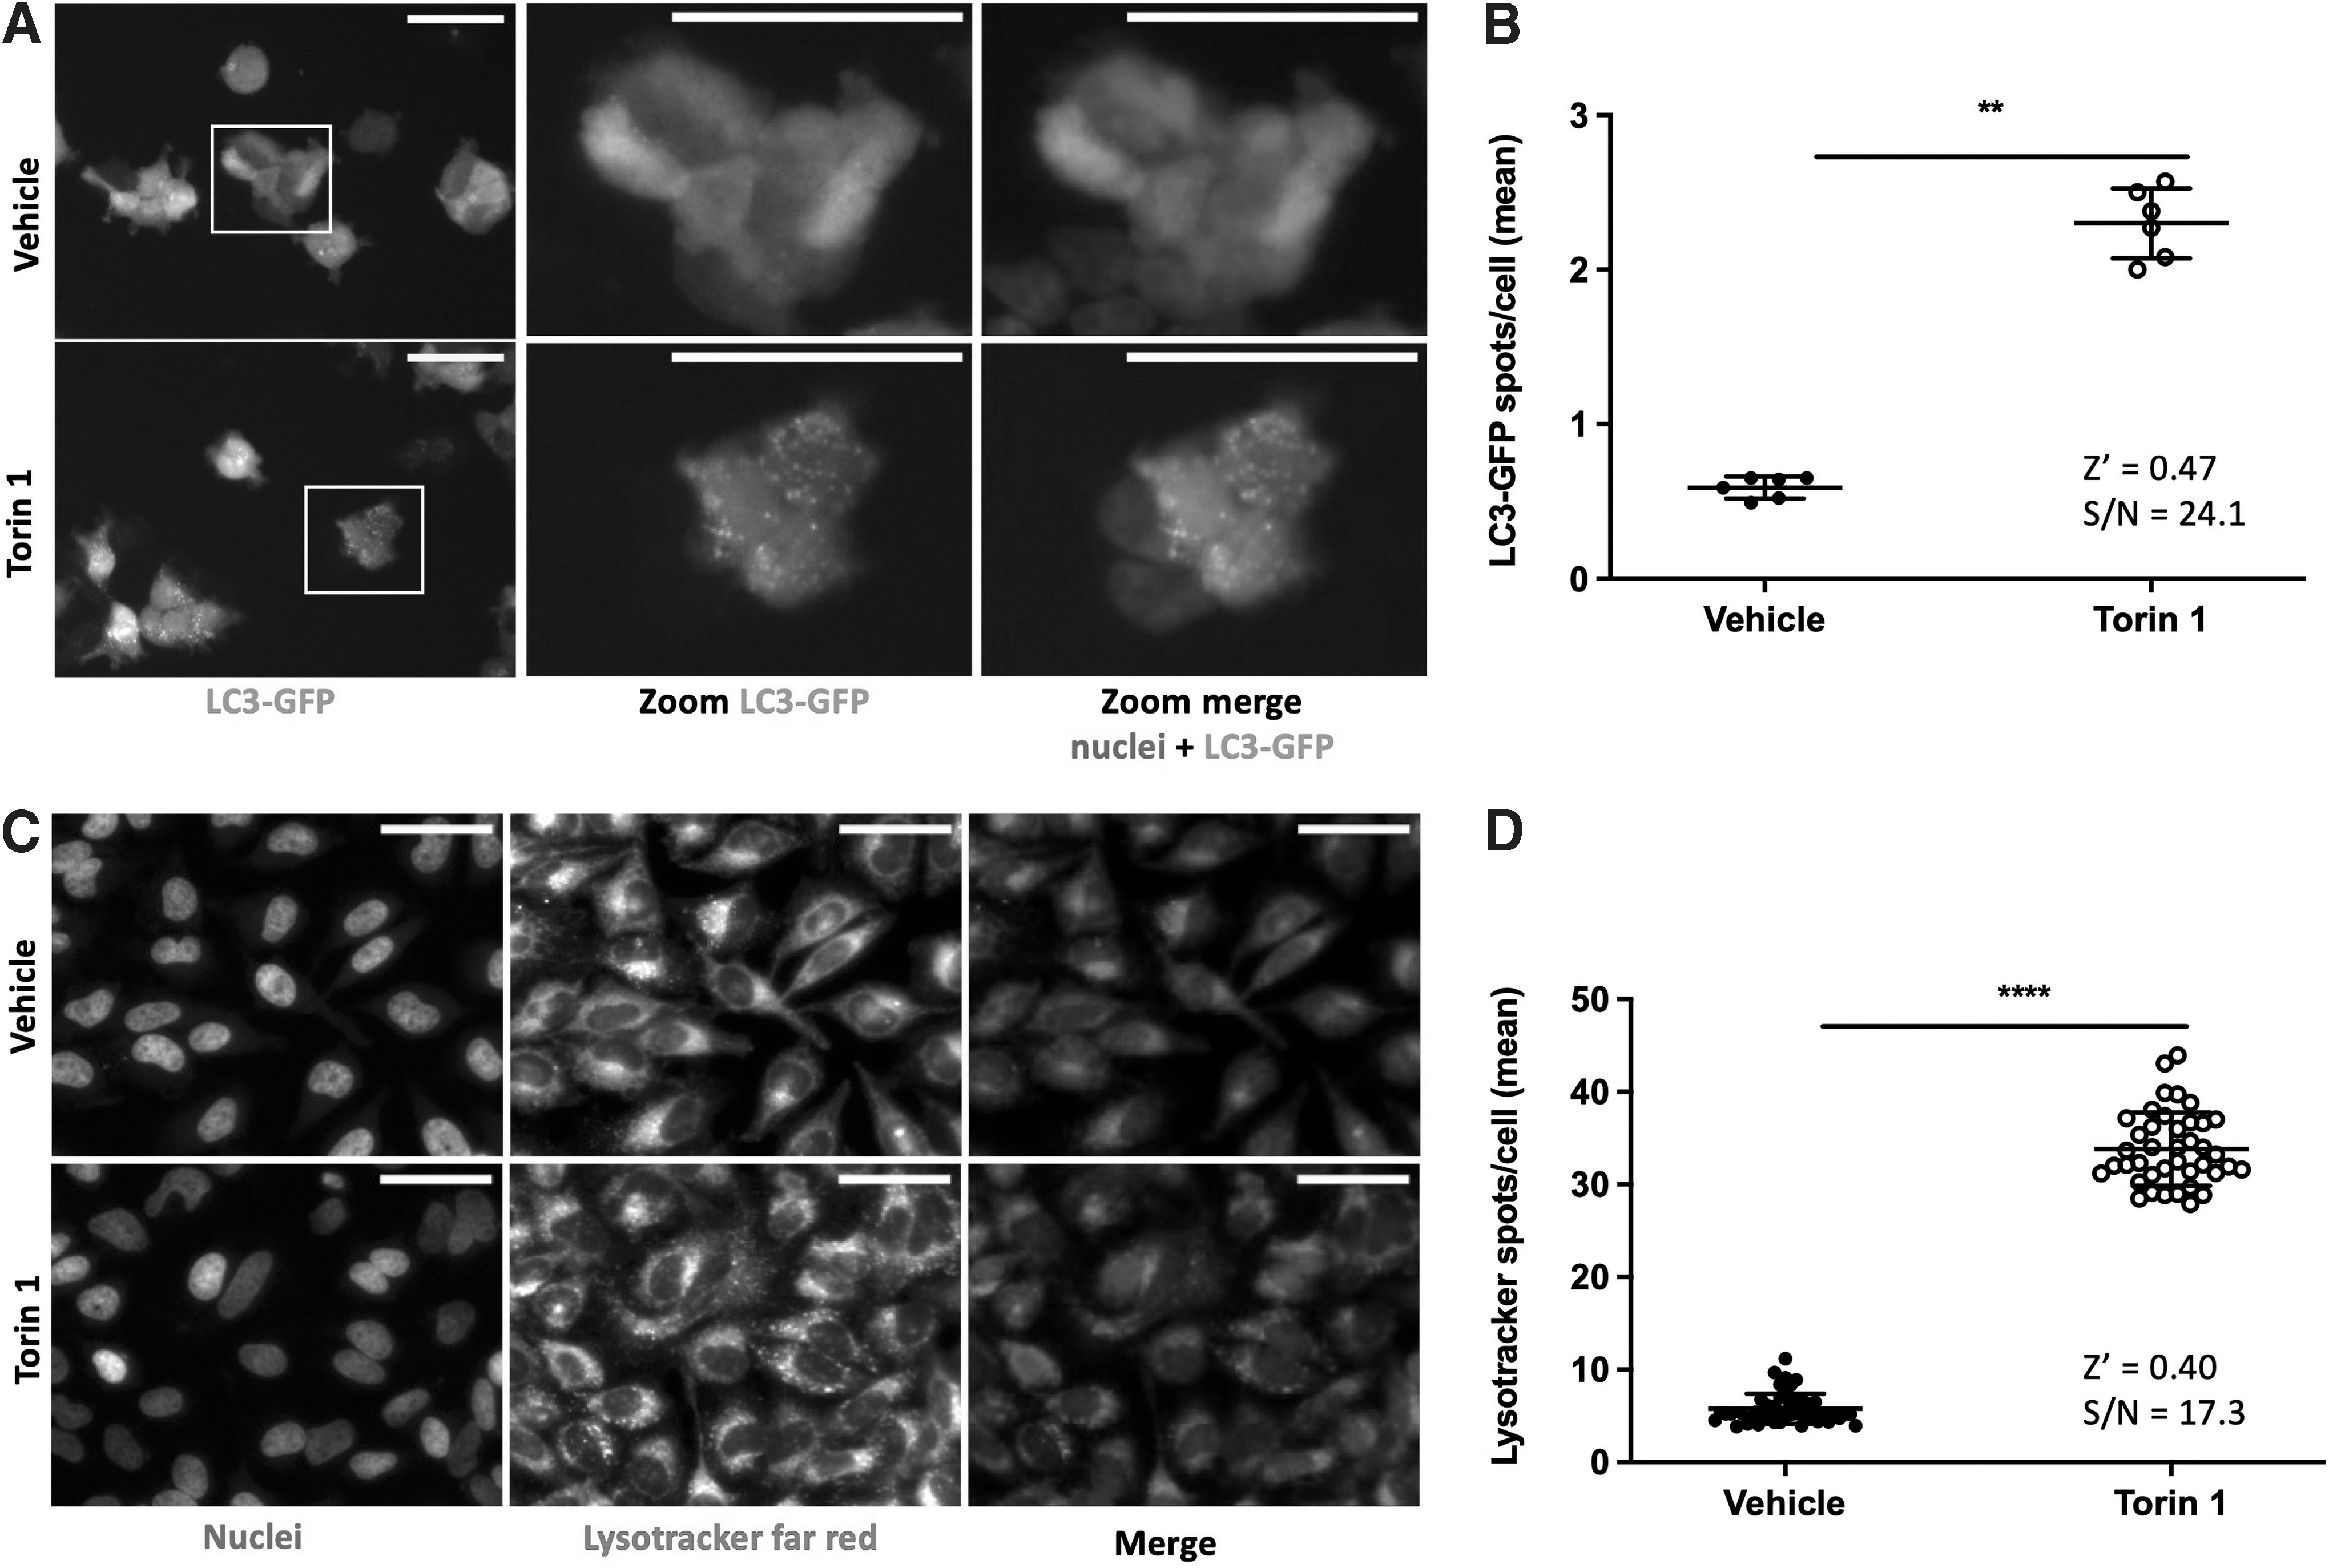
Cell-based assays to follow the amount of LC3-II in HEK-293T-LC3-GFP cells and the lysosomal compartments in HeLa cells by imaging.
Screening of 1,520 pharmacological compounds
To identify activators of autophagy, the 1,520 compounds of the PCL were screened at 2, 10, and 50 μM, using the previously described TFEB subcellular localization cell-based assay (Fig. 3A). In each plate, vehicle and torin 1 (n = 8/plate for each control) were included as internal controls (Fig. 3B). This selection of 40 approved drugs (representing a 2.6% hit rate) was, hence, further tested in an additional round, at 0.4, 2, and 10 μM on the TFEB subcellular localization assay (Fig. 3D) as well as on the LC3-II spot quantification assay (Fig. 3E) and on the lysotracker spot quantification assay (Fig. 3F).
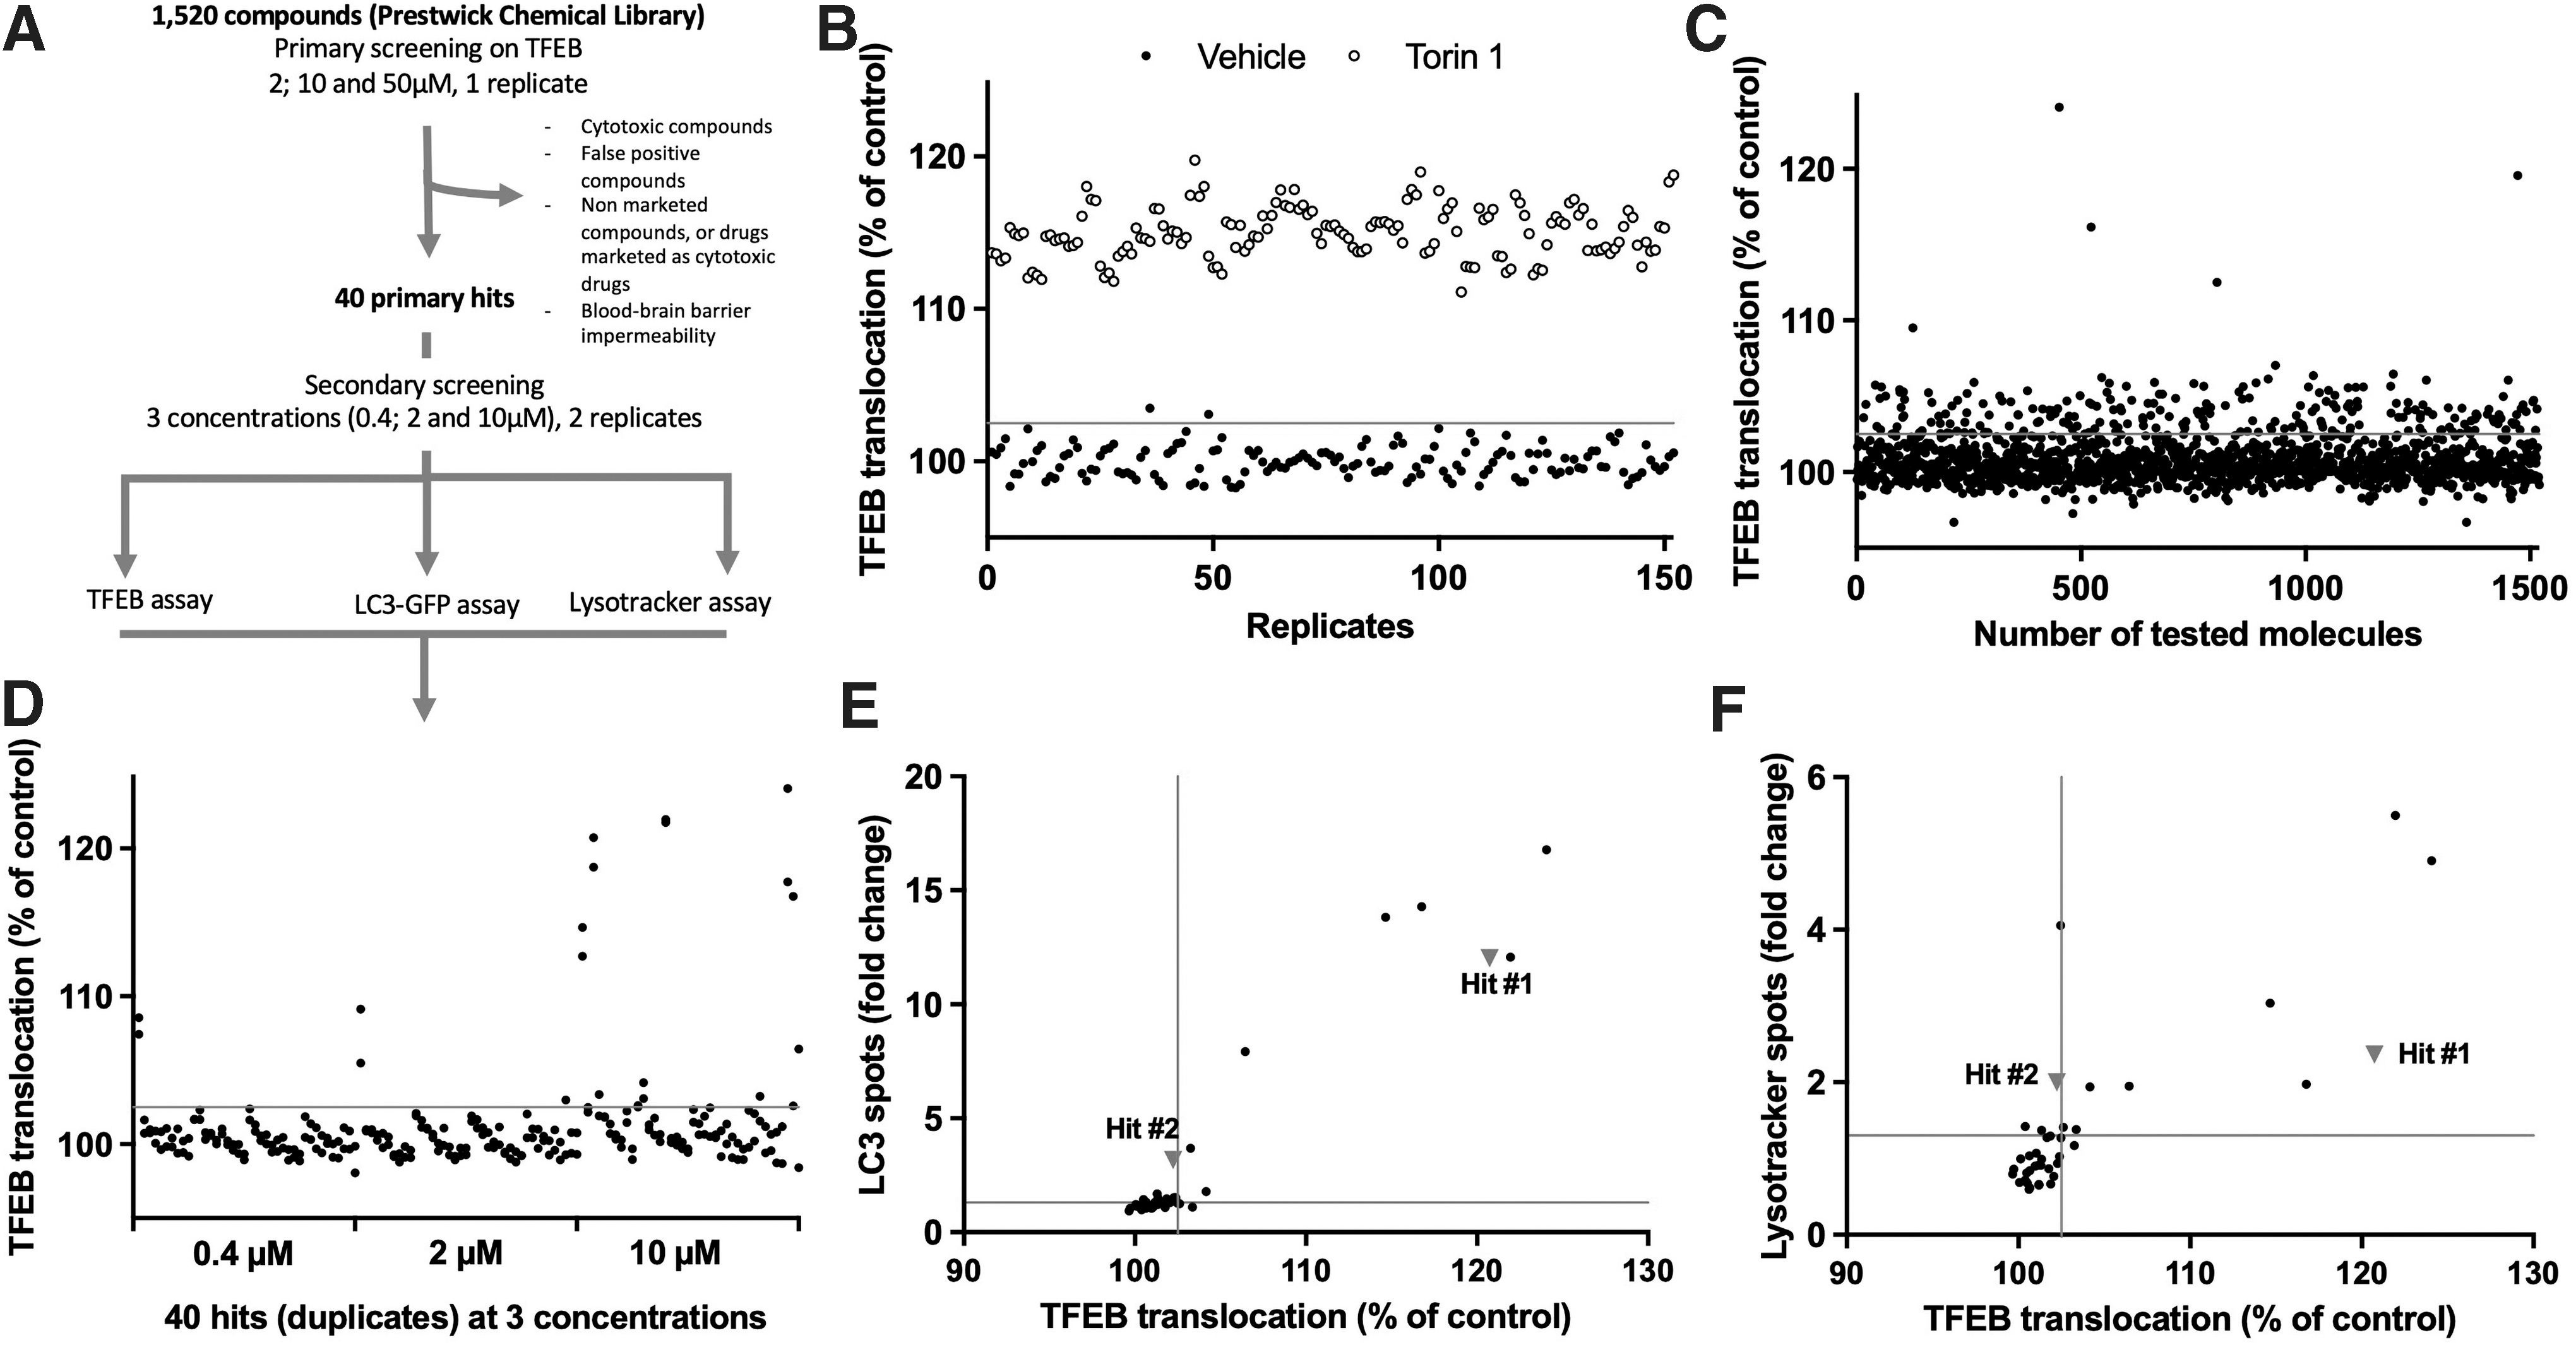
Screening workflow and results.
Finally, the most relevant hits were tested in a wider dose-response range in terms of viability in HEK-293T, using Prestoblue, and efficacy on LC3 spots with and without BAF to assess autophagic flux. First, we controlled the induction of autophagy by torin 1, as LC3 spots are significantly more numerous in torin 1-group after BAF treatment (11.6 ± 1.42 and 20.9 ± 0.92 spots per cell, Fig. 4A). The two selected hits featured different profiles, with Hit#1 showing no induction of autophagy at non-cytotoxic doses (Fig. 4B), whereas Hit#2 induced LC3 accumulation during BAF treatment (Fig. 4C).
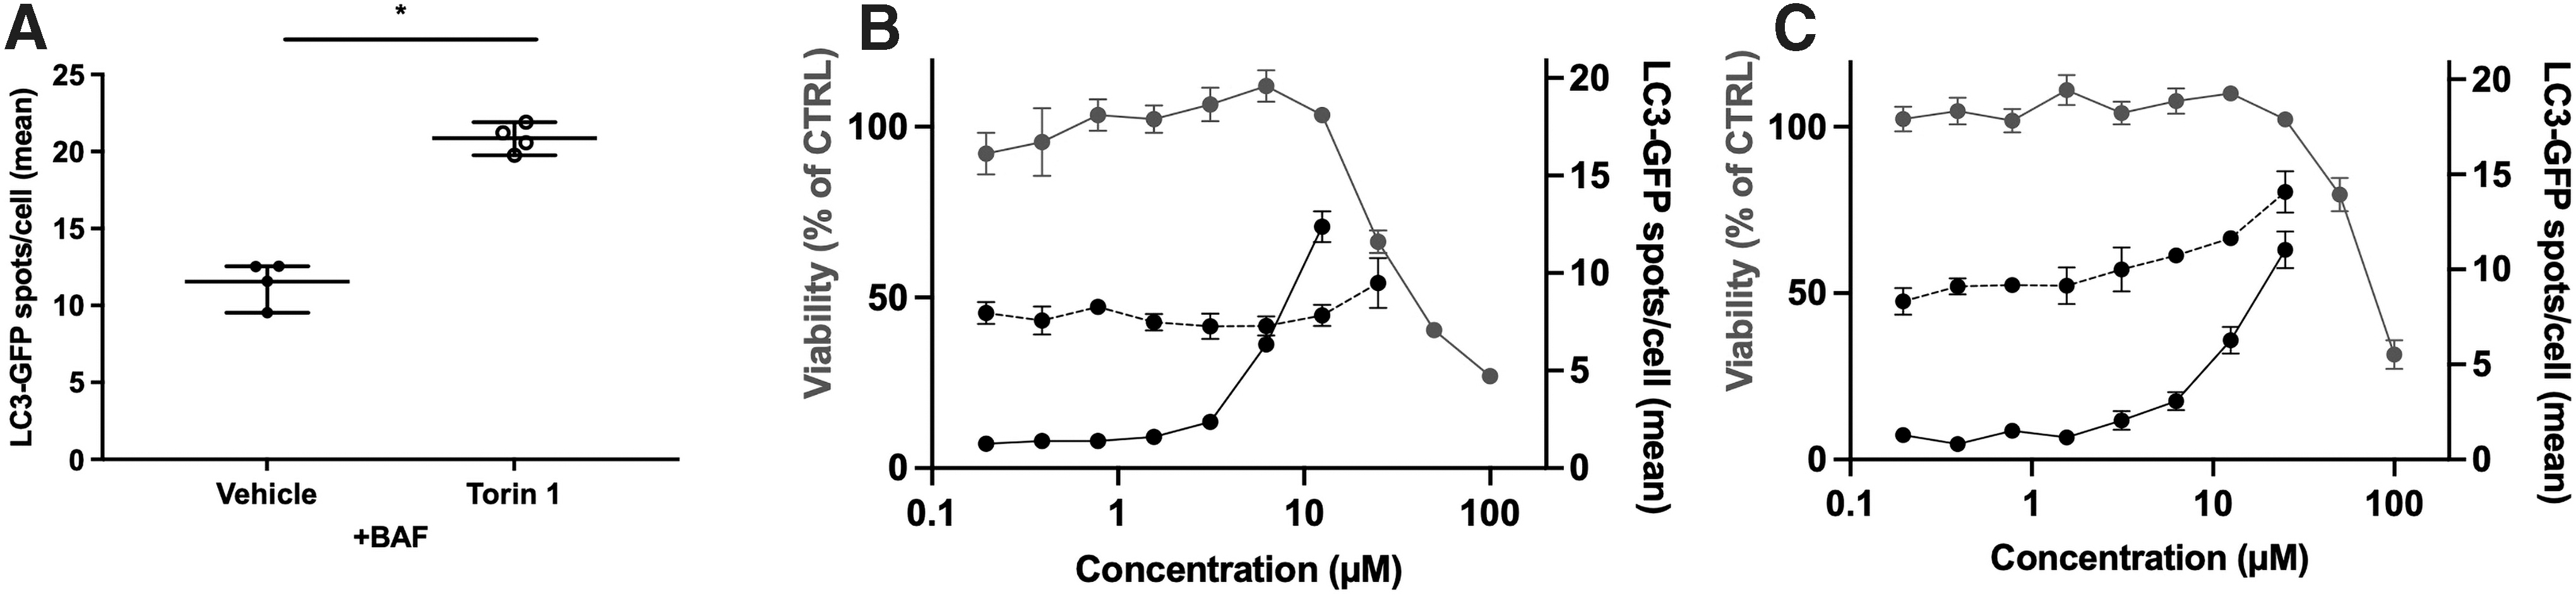
Validation of the hits using the LC3 assay with a concomitant BAF treatment.
Discussion
This study assembles different autophagy-related assays to identify new pharmacological modulators of this pathway.
The PCL is a library of already approved and marketed drugs, and it is often used to identity drugs that can be repurposed 23 –25 and further tested in additional non-clinical models as new therapeutics. 26 –32 This library, among others, has already been screened to identify modulators of autophagic flux; however, results cannot be compared with the current project, as previous screenings have been performed only at 10 μM and without published specific data, 13 or done in a selection of compounds from the PCL 33 or using an old and consequently limited version of the library. 34,35
HeLa and HEK-293T were included in the current study, as they are widely used in microscopy-based HCS and in studies on autophagy. 6,36 –38 Torin 1 was selected as the positive—bioactive—control, as a potent and selective inhibitor of mTOR, able to block the phosphorylation of both mTORC complexes leading to the dephosphorylation of TFEB. 17,19 Among all the available autophagy-related assays, 6 three tests have been selected, as they are able to monitor the potential effects of drugs on different steps of autophagy processes.
The first one is the evaluation of TFEB translocation from the cytoplasm to the nucleus. Indeed, in physiological condition, TFEB is mainly maintained sequestrated in the cytoplasm, in its inactivated form, by the mTOR pathway, whereas when activated, it is translocated in the nucleus where it promotes transcription of the CLEAR network genes. 39 It has been used in different screening assays, 13 –15 and per se can be considered as an index of autophagy induction steps.
The second assay is related to the LC3 protein. LC3 protein, in LC3-I configuration, is initially free in the cytoplasm; when autophagy is active, LC3 protein is recruited at the membrane of the autophagosome, in association with phosphatidylethanolamine ( = LC3-II configuration). The LC3-I appears diffuse in the cytoplasm, whereas LC3-II appears as spots when imaged. 6,40 Increase in LC3-II puncta number correlates with either an upregulation of autophagosome formation or a blockage of autophagic degradation; further use of a lysosomal protease inhibitor such as BAF usefully discriminates between the two situations. 40
Finally, during the autophagic flux, the autophagosomes mature as autolysosomes with their fusion with lysosomes. Autolysosomes and lysosomes are acidic compartments and are hence stained with lysotracker. 8 Lysotracker Far Red has been described as showing potential photoconversion 41 ; however, since it is not observed in the current study—in further studies, notably in disease models, this should be monitored.
The primary hits were selected as the compounds that were efficient at least at 2 and 10 μM (i.e., above the threshold of 102.5% of the controls). False positive drugs were excluded based on the fluorescence of the compounds, as well as drugs described as cytotoxic, used as antineoplastic drugs, or as not able to cross the blood–brain barrier. Based on these criteria, the screening of 1,520 compounds leads to a subset of 40 primary hits that have been further investigated in terms of cellular viability and cytotoxicity as well as efficacy to induce autophagy flux using LC3 quantification during BAF treatment.
As an example, Hit#1 (raloxifen) failed to induce autophagy, as opposed to effects described earlier, 42 potentially explained by difference in the cellular models. Interestingly, five hits have been selected as able to induce autophagy, as leading to LC3 spots increases after BAF treatment compared with BAF only, as exemplified for Hit#2.
Further characterizations, with additional autophagy-related markers such as p62, and evaluations in other cellular models, are warranted to explore more deeply the impact of the hits on lysosomal functions. Finally, this study suggests the new use of already approved drugs to treat indications with lysosomal impairments.
Footnotes
Disclosure Statement
A.D.C., C.P., F.M., and M.C. are full-time employees of Theranexus.
Funding Information
This work has been funded by Theranexus Company.