




Abstract
Nanoemulsion (NE), a lipid-based drug delivery system, plays an important role in delivering drugs and enhancing bioavailability. They are mainly taken up by the reticuloendothelial system, because of which their bioavailability is diminished, leading to poor therapeutic activity. It is important to protect this delivery system using a coating agent. Thus, we have coated o/w type NE using polyethylene glycol (PEG). The novelty in our study is use of dicarboxylic acid-linked PEG. Furthermore, the spontaneous emulsification method was used in preparation and peg coating, not mentioned previously. After the preparation of NE, various characterization and stability studies were carried out. We have also optimized the ratios for NE and PEG NE by using various concentrations of Smix, PEG, and water. Also, the same has also been plotted in a pseudoternary-phase diagram. As a conclusion, the PEGylation of NE was carried out successfully and may also be used for linking with other ligands because of the presence of COOH group.
INTRODUCTION
In today's world, the implementation of nanotechnology in research is in the prevailing stage. It is mainly because of the merits compared with the conventional remedies. Nanoformulations are being tested on various ongoing maladies, namely cancer, 1 cardiovascular diseases, 2 neurological disorders 3 and HIV. 4 In that manner, many researchers are also working on lipid-based formulations. This type of lipid-based formulations is especially useful in increasing the bioavailability of hydrophobic drugs. 5 Furthermore, they can also be given through various routes, namely oral, parenteral, ocular, dermal, and nasal. 6 This also helps in improving the patient compliance. 7
Especially, nanoemulsion (NE) has gained great attention among researchers because of the advantages such as controlled drug release, loading of hydrophobic drugs, great stability, and ease of scale-up. 8 As it is already known, the NEs are a biphasic system consisting of lipid/oil and an aqueous/water phase. 9 They are usually prepared with the aid of surfactants and cosurfactants that are helpful in reducing the interfacial tension between the two biphasic systems. 10,11 Their droplet size has a nanometric range between 20 and 200 nm. 12 Some literatures also state that it has a size range of 10–1,000 nm. 13 They can be prepared by two ways either by a bottom-up or top-down technology. 14 In this research work, we are focusing on the preparation of NE by a bottom-up technology, namely the spontaneous emulsification method. This method involves mixing of oil phase with Smix (surfactant: cosurfactant) and then titrating with the aqueous phase to get o/w NE. 15
However, most of the NEs fail to produce their therapeutic action because they are rapidly excreted from the body due to the reticuloendothelial system. 16 Coating the NEs with a suitable polymer or coating agent may enhance their residence time in the body and it may also be helpful in producing the therapeutic activity. 17 –19
Thus, to overcome the above challenges, we have decided to focus on the preparation of pegylated NE using the spontaneous emulsification method. The reason for choosing this particular method is that the PEGylation of NE using this method is not mentioned previously. The preparation of pegylated NE is done with various methods such as the dispersing-homogenized method, high-shear homogenization, and sonication. 20 –22 However, the spontaneous emulsification method is not used in previous literatures.
In this research work, we have used COOH-PEG-COOH, because previous researches were carried out using 1,2-distearoyl-sn-glycero-3-phosphoethanolamine-poly(ethylene glycol) (DSPE-PEG), 23 normal PEGs, and PEG derivatives such as pluronics, 24 –26 but not on dicarboxylic acid-linked PEG. Thus, keeping these points in consideration, we have selected COOH-PEG-COOH. The availability of the COOH functional group also helps in conjugating with other ligands and targeting agents easily.
Initially, we have optimized the NE concentration by using various ratios of oil, surfactant, and cosurfactant and compared the parameters such as particle size, polydispersibility index (PDI), and zeta potential. Later this optimized formulation's ratios were used for preparation of pegylated NE. After the preparation of pegylated NE, the impact of PEG on particle size, PDI, and zeta potential of NE was also determined.
MATERIALS AND METHODS
Materials
Capryol 90 was obtained from Gattefosse India Pvt. Ltd. (Mumbai). Kolliphor was obtained from Sigma life science and ethanol was purchased from Changshu Hongsheng Fine Chemicals Co., Ltd. COOH-PEG-COOH (Mol. Weight—4,090 g/mol) was purchased from Intelligent Materials Pvt Ltd. (Nanoshel).
Methods
Preparation of Smix (surfactant: cosurfactant)
Since, we have already prepared the NE in our previous research work, we have selected the same oil (Capryol 90), surfactant (Kolliphor), and cosurfactant (ethanol). 27 Moreover, these three compounds are also being used in many researches. 28 To prepare the Smix, a suitable quantity of Capryol 90 (100 μL) was taken and about 200 μL of Kolliphor was taken and further it was added to ethanol (200 μL) in an RIA vial and vortexed for 1–2 min. This is just to know the compatibility between the surfactant and cosurfactant with the oil.
Preparation of NE
NE was prepared by the spontaneous emulsification method. 29 –31 Suitable quantity of oil was taken in the RIA vial and vortexed with Smix. Then it was titrated with water until a transparent to translucent NE was obtained. The preparation of NE is given in Figure 1. All the ratios of oil, Smix, and water are given in Table 1.

Preparation of NE/pegylated NE. NE, nanoemulsion.
Different Ratios of Oil, Surfactant, Cosurfactant, and Water Used for Optimization of Nanoemulsion Ratio
The volume of the oil, Smix, and water was taken in microliters. Here 1 indicates 100 μL. In a similar manner, the ratio of 1:1 or 1:2 represents 100:100 μL or 100:200 μL, respectively. In case of water 1.4 or 1.5 represents 1,400 or 1,500 μL, respectively.
M, milky; NE, nanoemulsion; PS, phase separation.
As we can see from Table 1, the oil concentration was kept constant throughout the ratios, whereas we have varied the concentration of Smix. This is done so, because during the preparation of NE, the lesser quantity of oil will be capable of dissolving the maximum amount of drug, and moreover, we are preparing oil in water NE. Thus, we have kept the oil phase as constant.
Next, different ratios of Smix were mixed with oil. Example Smix 1:1 (Kolliphor: ethanol) was taken and mixed with oil in a 1:1 ratio (Smix:oil) and it was further titrated with 100 μL of water until the visual observation was clearly determined. Similarly, when it comes to a 1:2 ratio of oil: Smix, 1 part of oil mixed with 2 parts of Smix with a 1:1 ratio of surfactant and cosurfactant. Likewise, the concentration of cosurfactant was increased. Since, more amount of surfactant causes toxicity, we have not increased the quantity of surfactant.
Pseudoternary-phase diagram
Pseudoternary-phase diagram was constructed based on the aqueous titration method. In this method, the water was added in a gradual manner to the oil and Smix and then vortexed for 2 min. The NE region was identified in this ternary diagram and these ratios were transparent, clear, and easily flowable on visual observation. In this ternary diagram, one axis was representing the oil phase, the second axis was representing the aqueous phase, and the third axis was representing the Smix (surfactant: cosurfactant) phase.
Stability studies
This is necessary to determine the stability of the NE. It helps in identifying whether the NE has undergone any phase separation, coalescences, milky formation, and so on. After preparing various concentrations of NE, they were subjected to the following thermodynamic stability studies (TDSS). 32 –35
Heating and cooling cycle: At 4°C, the cooling phase was carried out using a refrigerator and then a hot air oven was used for heating phase for 48 h at 45°C. Furthermore, centrifugation was carried out for those samples that were stable during this test. 36
Centrifugation: In this study, the samples were centrifuged for 30 min at 3,500 rpm. Then the samples that were stable after this test were further considered for the freeze–thaw cycle. 37
Freeze–thaw cycle: The samples were kept in the deep freezer at every temperature for not <48 h. Temperature was ranging between −21°C and +25°C. The samples that passed all the TDSS were considered for further studies. 38,39
Characterization of NE
Particle size, PDI, and zeta potential for selected formulations were carried out to obtain the optimized NE. 40,41
About 0.1 mL of sample was taken and it was diluted with 10 mL of distilled water. These samples were observed for particle size, PDI, and zeta potential using zeta seizer (Anton paar-particle analyzer). 42,43 The ratios of optimized formulation were taken further for the preparation of pegylated NE.
Optimization of water concentration
Since, one optimized formulation was selected from the above test, it is important to note how much quantity of water exactly can make a clear transparent NE. For this purpose, we have used three ratios: one is below the total quantity of preconcentrate, one equal to the quantity of preconcentrate, and one above the total quantity of preconcentrate. NEs were prepared using three ratios of water and observed visually.
Preparation of pegylated NE
After the preparation of NE, the concentration of oil, surfactant, cosurfactant, and water was known and further PEGylation of NE was carried out. In this, different concentrations of peg starting with 1, 2, 3, 4, and 5 mg were dissolved in suitable quantity of water (optimized previously).
The preparation of preconcentrate (containing oil and Smix) was the same as mentioned previously. For further titration, we have used the water that was dissolved with peg.
Various concentrations of peg were taken, example 1, 2, 3, 4, and 5 mg. They were dissolved in water and used for preparation of NE.
Initially the Smix was prepared and then it was vortexed with oil and titrated against water to get an NE. In case of pegylated NE, the peg was dissolved in water and used for the preparation.
Characterization of pegylated NE
Samples were evaluated for particle size, PDI, and zeta potential using the zeta sizer.
Dye solubility test
To confirm that o/w nanaoemulsion has formed, we have performed the dye solubility test. 44 –47 Amaranth dye was chosen for this study. 48 Amaranth is a water soluble dye. 49,50 The addition of dye to different samples, namely oil alone, water alone, pure NE, and pegylated NE, was done. In this study, a little quantity of oil, water, pure NE, and pegylated NE were taken in RIA vials. To this, a small amount (∼ 0.1 mg) of amaranth was added. They were mixed with vortex mixer and the results were determined through visual observation. Furthermore, to determine that it has formed o/w NE, we have also observed the samples under an inverted microscope (Olympus IX70). 51,52
Stability of NE and pegylated NE in different buffers
To determine the fate of NE and pegylated NE in a different gastric environment, we have done determination of particle size, PDI, and zeta potential after diluting them with different pH buffers, namely pH 7.4 (phosphate buffer), 6.8 (phosphate buffer), and 5.6 (neutralized phthalate buffer). The initially prepared NE [1:8(1:4)] ratio and pegylated NE (using 5 mg PEG) were taken and diluted with buffers in the ratio of 1:100, which means 100 μL of NE or pegylated NE with 10 mL of buffers. The change in particle size, PDI, and zeta potential was observed.
Statistical analysis
All the readings were taken in triplicates and the values were loaded in GraphPad Prism 9. 53,54 We have selected multiple unpaired t-tests for the analysis, because we had two columns (particle size and PDI) and multiple rows.
Assumptions for the statistical tests are as follows: Experimental design: Unpaired Assume Gaussian distribution: Yes. Parametric test Unpaired two-sample t test: Assume that both samples in each row are from populations with the same standard deviation.
α value: 0.05
RESULTS AND DISCUSSION
Preparation of Smix
Suitable quantities of oil, Kolliphor, and ethanol were taken and vortexed. After observing for a few minutes, there was no phase separation or incompatibility observed. Thus, we have selected Capryol 90, Kolliphor, and ethanol as oil, surfactant, and cosurfactant, respectively.
Preparation of NE
Different ratios of oil, Smix, and water were mixed using a spontaneous emulsification method and it was visually observed. Some of the samples observed during the preparation of NE are given in Figure 2.

NEs with different observations including milky, opaque, phase separation, and transparent NE can be seen. As it can be seen from the image, different ratios of NE are given Preparation of NE (namely from left to right) 1:1 (1:1), 1:1 (1:2), 1:2 (1:2), 1:6 (1:4), 1:7 (1:4), 1:6 (1:6), 1:5 (1:1), 1:4 (1:7), and 1:9 (1:8).
Pseudoternary-Phase Diagram
To determine the NE region, the pseudoternary-phase diagram was plotted. The phase diagram was constructed using Capryol 90 as oil phase, and Kolliphor and ethanol as surfactant and cosurfactant phases, respectively, and finally, aqueous phase. The ternary diagram has been plotted for various stable formulations and the darker region indicated the NE region. The pseudoternary plots along with the ratios are given in Table 2.
Indicates the Pseudoternary-Phase Diagram Indicating Nanoemulsion Region Obtained from Using Various Ratios of Oil, Smix, and Water
Stability Studies
Samples that were translucent to transparent were taken and subjected to TDSS. At the end of the study, the stable NEs were taken and proceeded further.
Characterization of NE
NEs that were stable after TDSS were determined for particle size, PDI, and zeta, and the following data were interpreted using GraphPad Prism 9 to determine their significant value. Particle size and PDI responses of optimized ratios of NE are given in Figure 3.
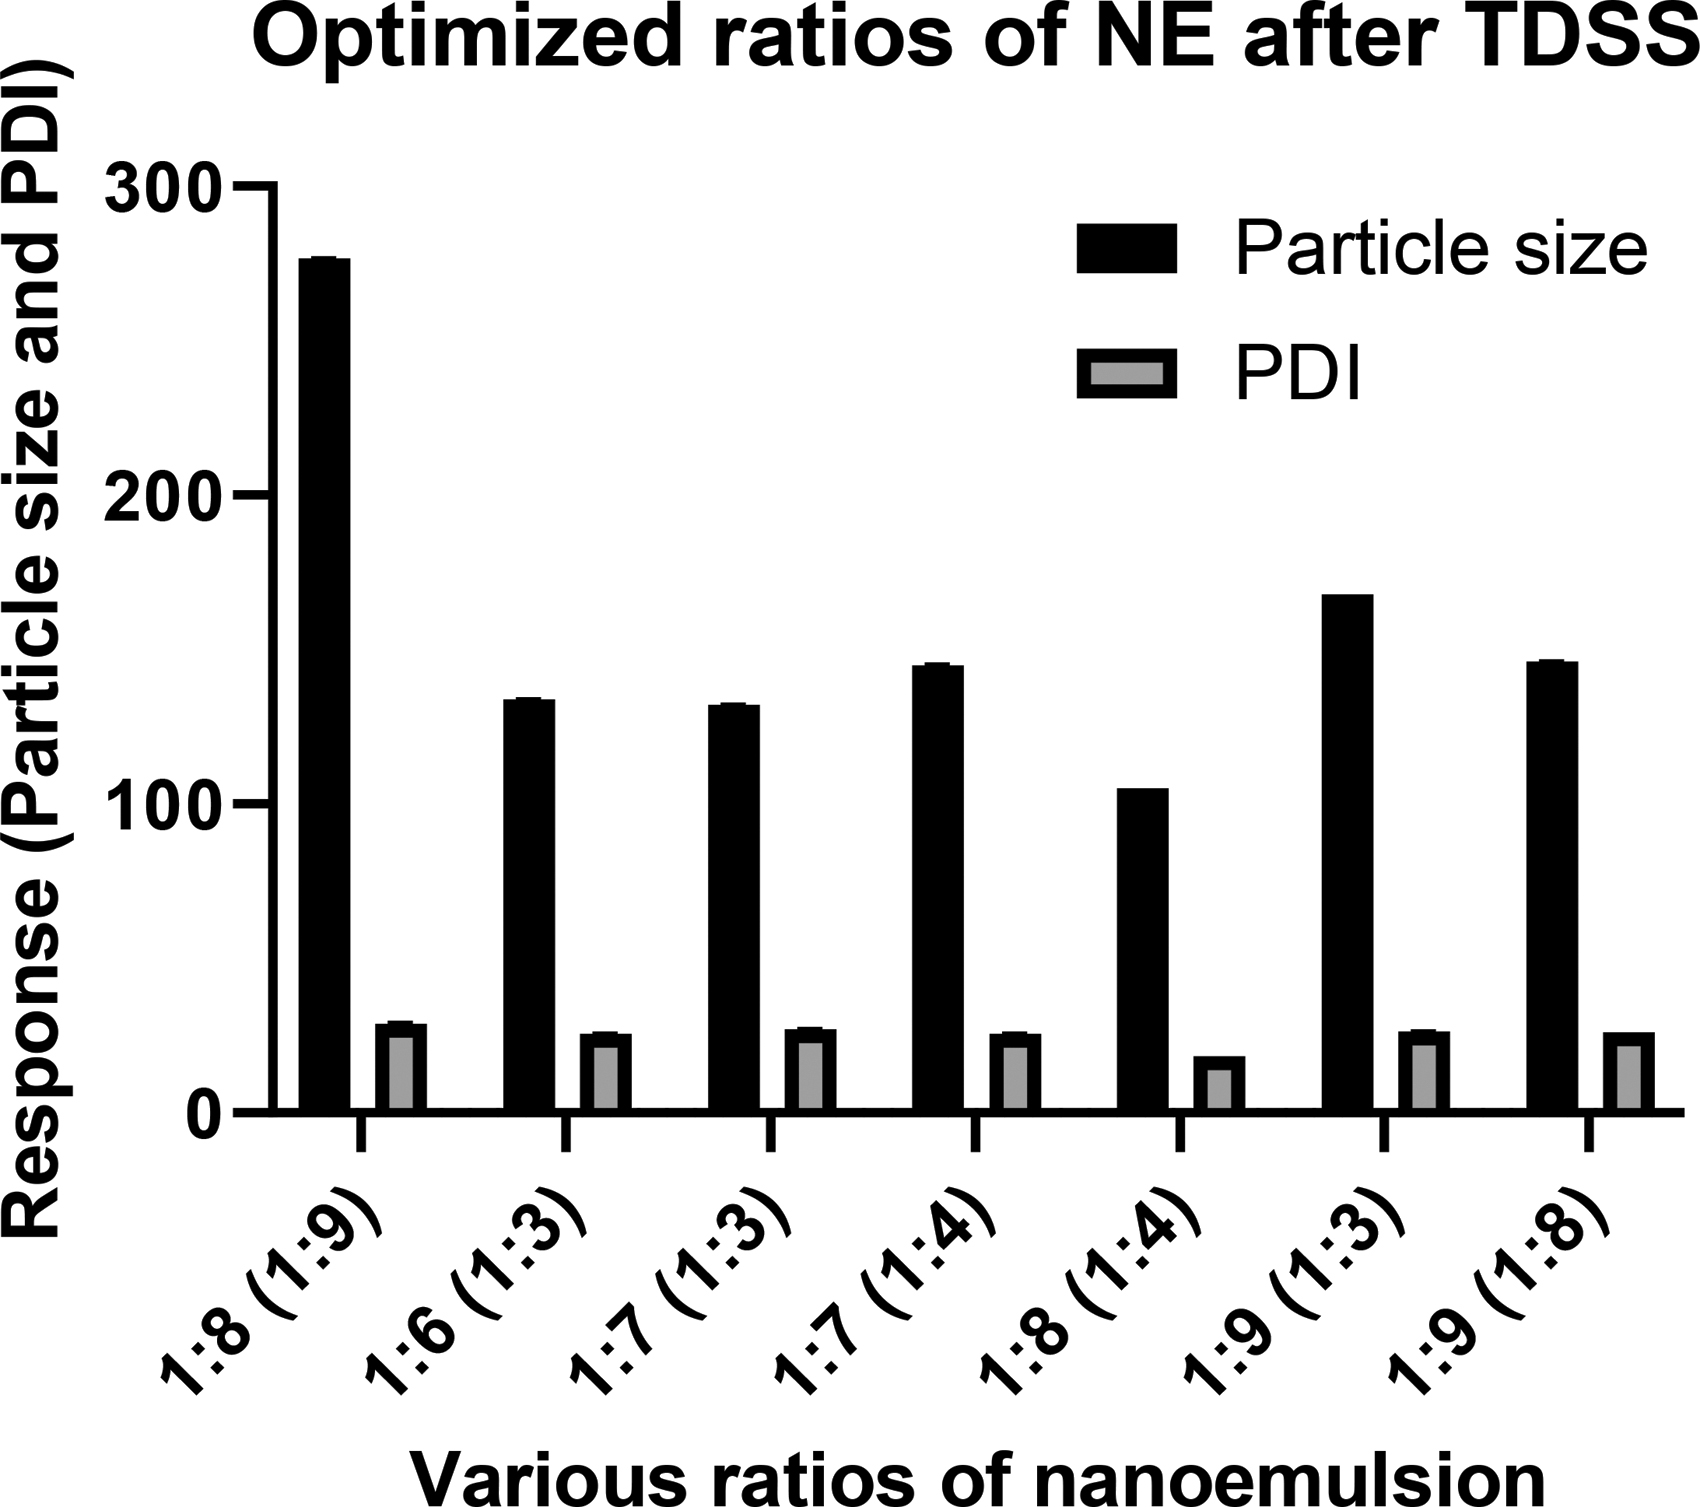
Graph representing the particle size and PDI of various concentrations of NE. Here in the image, 1:8 (1:9) represents the ratio of oil and Smix, where 1:9 means 1 part of Kolliphor and 9 parts of ethanol, followed by mixing 8 parts of this solution with 1 part of oil. In a similar manner, the calculation was done for other ratios as well. PDI, polydispersibility index; TDSS, thermodynamic stability studies.
From Table 3, we have taken 1:8 (1:4) as an optimized ratio. The reason for choosing this particular ratio is that the p-value for this formulation is <0.05 similar to that of other ratios. Moreover, the particle size and the PDI of the formulation are less compared with other ratios. Thus, we have taken 1:8 (1:4) (i.e.): 1 part of oil and 8 parts of Smix (containing 1 part of surfactant and 4 parts of cosurfactants) were used. These ratios were fixed for further PEGylation.
Consisting of the Particle Size, Polydispersibility Index of the Nanoemulsion
We have also determined the significant difference using the GraphPad Prism 9.
PDI, polydispersibility index.
We have also given the zeta potential of all the ratios. Since, the zeta potential for all the formulations were within the range (−30 to +30 mV), we did not consider that as a main parameter to obtain an optimized formulation.
Optimization of Water
Three different quantities of water were used for selecting a clear NE. The amount of water added is given in Table 4.
Amount of Water Added to Preconcentrate to Get a Transparent Nanoemulsion
As can be seen from Figure 4, 0.5:1 and 1:1 ratios have given a clear NE compared with 2:1. Thus, as a minimum quantity, we have selected 0.5:1 as the final concentration and proceeded further.
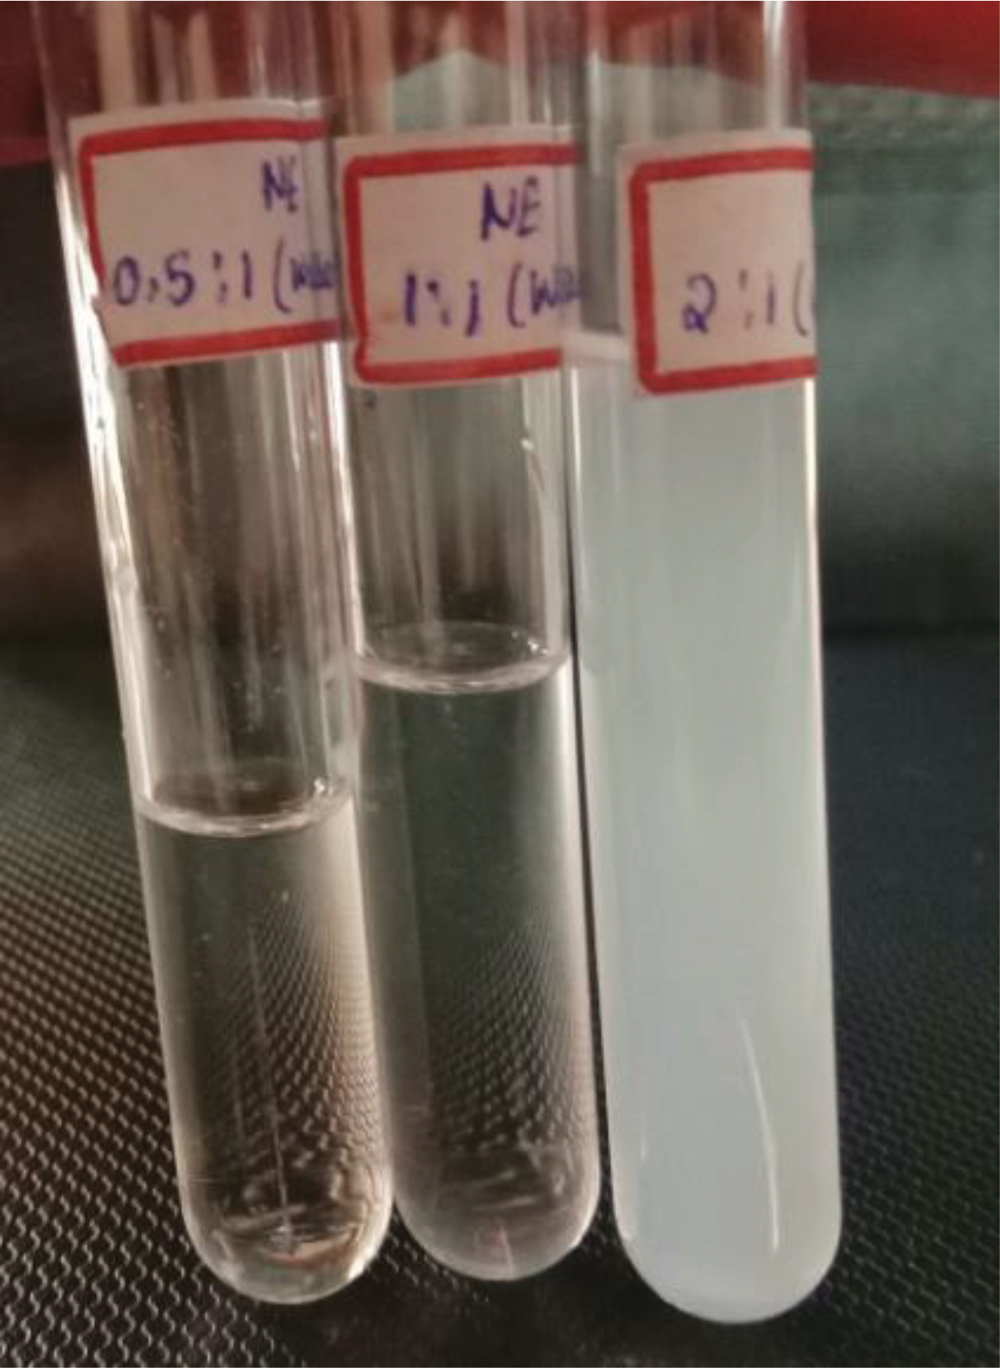
Visual observation after adding different quantities of water to preconcentrate. As it can be observed from the image, different ratios of water were added to same concentration of oil and Smix (preconcentrate). From left to right 0.5:1 (i.e.) 450 μL of water in 900 μL of preconcentrate, next is 1:1 (i.e.) 900 μL of water in 900 μL of preconcentrate and finally 2:1 (i.e.) 1,800 μL of water in 900 μL of preconcentrate.
Preparation and Characterization of Pegylated NE
Formation of pegylated o/w NE using COOH-PEG-COOH was obtained by the same procedure. Furthermore, there was no phase separation or coalescence observed in pegylated NE. The significant value, mean particle size, and mean PDI of the sample are given in Table 5 and Figure 5.
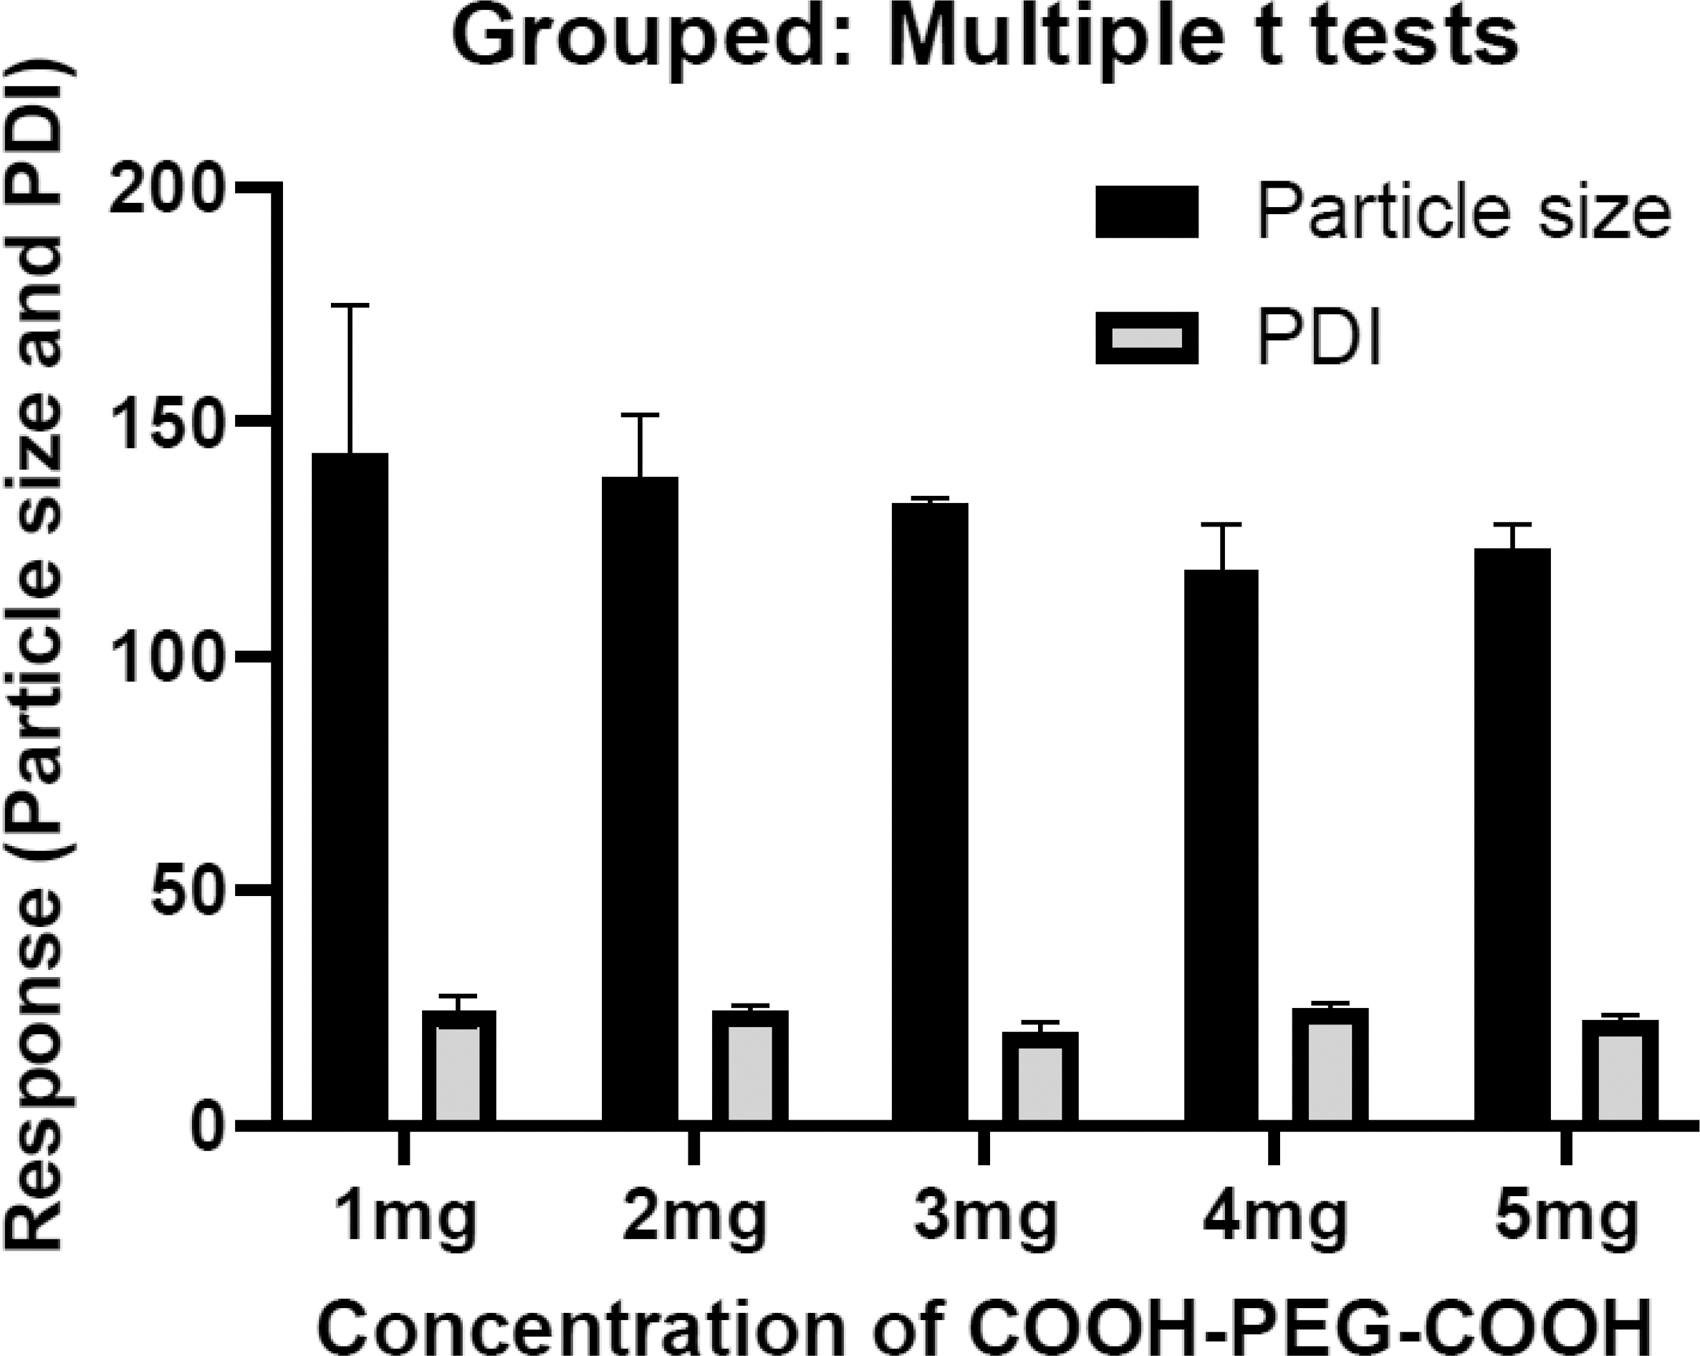
Graph representing the particle size and PDI of various concentrations of pegylated NE.
Significant Value, Mean Particle Size, Mean Polydispersibility Index, and Zeta Potential of Pegylated Nanoemulsions are Given
PEG, polyethylene glycol.
For all the concentrations, we have a p-value <0.05, which states that they are statistically significant. Moreover, the p-value for 3 mg is less compared with other concentrations, but while coming to the particle size, they have slightly greater particle size compared with 4 and 5 mg, because of which it was not taken into consideration.
While comparing the 4 and 5 mg, the particle size of 4 mg is less compared with 5 mg. However, the PDI was greater than 5 mg. Moreover, the p-value for 4 mg (p = 0.000086) was also slightly greater than 5 mg (p = 0.000006). Thus, we have selected 5 mg concentration for further studies. Furthermore, choosing the 5 mg concentration will also be helpful in conjugating with other ligands or targeting agents.
Dye Solubility Test
Water soluble dye amaranth was used and added to all the samples, likely oil, water, o/w nanoemulsion, pegylated o/w NE. Visual observation was made. Figure 6 shows the solubility of dye in samples. Further the observation of NE, pegylated NE was checked under an inverted microscope and observations are given in Figure 7.

Dye solubility test using water soluble dye.
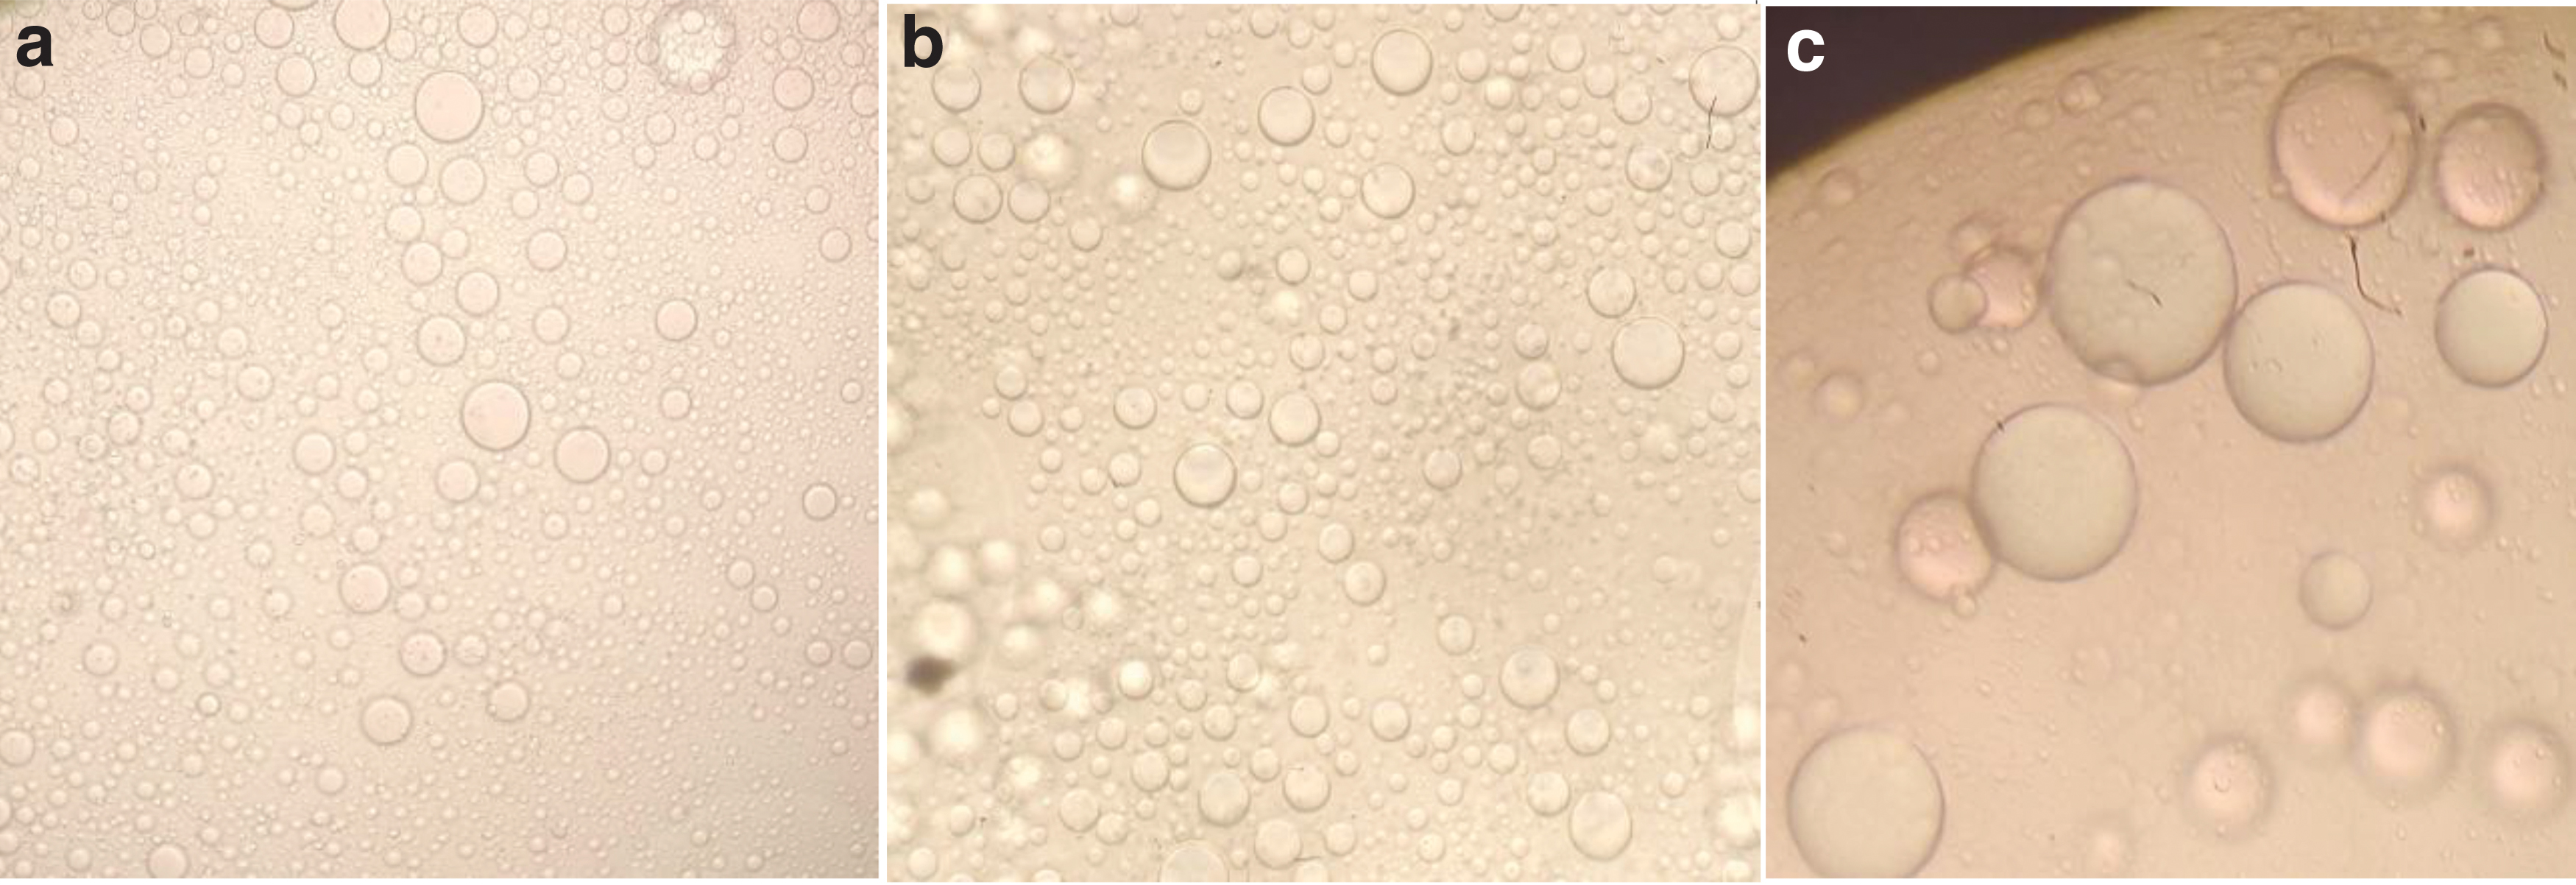
Observation of
It was noted from Figure 6 that the dye was not soluble in pure oil (no: 1). Whereas the dye was completely soluble in water, o/w NE, as well as in peg NE (no: 2, 3, and 4). This confirms that the NE formed was o/w NE.
Stability of NE and Pegylated NE in Different Buffers
The stability of the NE with different pH buffers was determined by diluting 100 μL of NE or pegylated NE with 10 mL of each buffer as well as with water.
The results are given in Table 6. It can be clearly seen that there is not much significant difference in particle size, PDI, or zeta potential when the NE and pegylated NEs are diluted with water, and 7.4 and 5.6 buffer. Also, the particle size has slightly increased when we are diluting the pegylated NE into the water and buffer, and this may be because of the coating effect of the PEG on the surface of the oil droplet (either because of mushroom confirmation or brush confirmation of PEG on the surface of the NE). 55 From this we can say that the NE or pegylated NE when subjected to pH 7.4 and 5.6 buffers is almost stable.
Mean Particle Size, Mean Polydispersibility Index, and Zeta Potential of Nanoemulsion and Pegylated Nanoemulsions Are Given
However, when it comes to 6.8 pH buffer, the particle size of the NE has increased drastically (around 6,246 nm), from which we can say that the NE is not stable in 6.8 pH. This may be because of the fusion of the tiny oil droplets when exposed to this particular pH 6.8. This is also supported by the increased PDI value, which is around 45.9%, this states that the particles are not monodispersed, and rather there is a huge chance of polydispersibility among the particles. However, this effect can be avoided by the PEGylation of the NE and the same has also been observed in the results.
As we can see from Table 6, the particle size of the pegylated NE, when diluted with 6.8 pH buffer, was found to be 138.03 nm, which is almost near to the water-diluted pegylated NE. Thus, it shows that the NE has been coated with PEG and has not allowed the oil droplets to get fused after getting exposed to the pH 6.8. However, further studies are required to prove the same.
CONCLUSION
NEs are a lipid-based drug delivery system and act as an effective carrier in delivering the hydrophobic drugs. However, their residence time gets reduced because of the reticuloendothelial system. To overcome that, coating of NE is very important. Most of the literatures mention the coating of NE by homogenization, sonication, and other methods. However, in this article, we aimed to develop a pegylated NE using the spontaneous emulsification method that was not mentioned previously. The optimized ratio for the NE preparation was carried out by performing various trials with different ratios of oil, surfactant, and cosurfactant. Furthermore, the optimized ratio obtained after TDSS was used for preparation of pegylated NE. After preparing the pegylated NE, various characterization studies were carried out including particle size, PDI, and zeta potential analysis to understand how the concentration affects all the abovementioned parameters.
The type of NE was also observed by performing a dye solubility test. When the water soluble dye was used, the outer phase or the dispersion medium (water) dissolved the dye, showing that the NE was o/w type. To determine the stability of the pegylated NE, the particle size, PDI, and zeta potential were determined for pure NE and pegylated NE after diluting with water, phosphate buffer 7.4 and 6.8, and neutralized phthalate buffer 5.6.
As an outcome of this study, it was observed that the particle size, PDI, and zeta potential remained almost the same for NE and pegylated NE when diluted with buffer 7.4 and 5.6. However, when it comes to pH 6.8, there was a significant effect observed in particle size and PDI for NE and pegylated NE, and this might be due to the inability of the NE to withstand the pH 6.8. However, the pegylated NE when exposed to 6.8 pH has withstood and was found to be stable. This may also be helpful in confirming the PEGylation of NE. Thus, to conclude, this spontaneous emulsification method may serve as an effective technique in coating the NE. Further studies are required to prove the same.
Footnotes
AUTHORs' CONTRIBUTIONS
S.K.J.: Conceptualization, methodology, and writing—review (lead). R.S.: Writing—review and editing (support). S.P.D.: Resources (lead). S.S.N.U.: Supervision (support).
ACKNOWLEDGMENT
The authors would like to thank the Department of Science and Technology—Fund for Improvement of Science and Technology Infrastructure in Universities and Higher Educational Institutions (DST-FIST), New Delhi, for the infrastructure support to their department.
DISCLOSURE STATEMENT
No competing financial interests exist.
FUNDING INFORMATION
This work was funded by the Indian Council of Medical Research (ICMR)-New Delhi by awarding Senior Research Fellowship (SRF)-“3/2/2/2/2020-NCD-III.”