
Abstract
The development and analysis of pharmaceutical formulations often involves the determination of multiple active ingredients in a dosage form. The aim of the present study is to develop a convenient method for simultaneous estimation of Exemestane (EXE) and Everolimus (EVE) in bulk and in systemically designed tablet dosage form. Methanol was used as a solvent for developing linear curves and validated in terms of various parameters, such as selectivity, sensitivity, linearity, precision, accuracy, and robustness. Method validation observed that the proposed method is reliable and reproducible, meeting the regulatory requirements for pharmaceutical analysis with a relative standard deviation of <2%. The developed method was found to be sensitive and selective in simultaneous equation method. The unknown concentrations of EVE and EXE were found to be 10.431 and 10.232, respectively. The next step is to systematically design a tablet formulation for EXE and EVE containing β-cyclodextrin as a polymer. Microcrystalline cellulose (X1), sodium starch glycolate (X2), and beta-cyclodextrin (X3) are the critical variables and hardness (Y2) and friability (Y3) were selected as prime responses. Analysis of variance provides significance of the model, and the predicted batch gives a high desirability value of 0.862. In vitro dissolution profiles of optimized batch (OB1) were signified by high drug release profile as 89.47% and 96.00% for EVE and EXE in tablet formulation, as compared with pure API, respectively. This study signifies enhancement in biopharmaceutical attributes of EXE and EVE in tablet formulation and robust simultaneous estimation by the UV method. In a nutshell, this study provides the simultaneous estimation method in tablet dosage form, and further research is crucial for the advancement of pharmaceutical analysis and the formulation of effective medicines.
INTRODUCTION
Breast cancer is a complex disease that can be difficult to treat and one in which cells in the breast grow at an expanded limit; the collective mass forms are called tumors. Breast cancer is the most common cancer among women, with over 2.3 million new cases diagnosed in 2020 and 685,000 deaths worldwide. 1 It is also the second leading cause of cancer death among women, after lung cancer. The most common type of breast cancer is hormone receptor-positive breast cancer, which means that the cancer cells have receptors for the hormones estrogen and progesterone. 2
Exemestane (EXE) is a steroidal aromatase inhibitor used to treat post-menopausal women with hormone receptor-positive breast cancer. It works by blocking the production of estrogen, a hormone that can fuel the growth of breast cancer cells. 3 Everolimus (EVE) is a mammalian target of rapamycin (mTOR) inhibitor used to treat various cancers, including breast cancer.
It works by blocking the growth of cancer cells. 4 In 2012, the Food and Drug Administration (FDA) approved the combination of EXE and EVE for the treatment of postmenopausal women with hormone receptor-positive, HER2-negative metastatic breast cancer who have progressed on prior endocrine therapy based on a BOLERO-2 study. 5 The combination therapy significantly improved progression-free survival compared with EXE alone.
For these active chemicals to be quantified accurately and effectively, simultaneous estimation methodologies are essential. The significance of simultaneous estimating techniques designed expressly for tablet dose forms is highlighted in this abstract. The simultaneous estimate method makes use of analytical methods that may measure many components simultaneously.
This method's incorporation into the study of tablet dosage forms has a number of benefits, including decreased time, expense, and sample requirement while retaining high accuracy and precision. For the development of safe and effective pharmaceutical products, it is compulsory to have an analytical method. 6 In this paper, the analytical method is developed for the simultaneous estimation of EVE and EXE in tablet dosage forms and validated as per International Conference on Harmonization (ICH) guidelines.
Formulation of tablet dosage forms by the direct compression method is done by using the Factorial design (32). The selection of variables is based on an extensive literature survey because they can be used to identify main effects and interactions and to reduce the number of batches needed for an experiment.
MATERIALS AND METHODS
Materials
EVE and EXE were obtained from Everon Life Sciences Pvt Ltd., India. Microcrystalline cellulose (Loba Chemie), Lactose monohydrate (CDH Chemicals), Sodium starch glycolate (SRL Chemicals), Beta cyclodextrin (HiMedia Laboratories), Magnesium stearate (CDH Chemicals), and Talc (CDH Chemicals) were used as direct compressible excipients. Methanol (RANKEM), Acetonitrile (RANKEM), Hydrochloric acid (Loba Chemie), di-Sodium hydrogen phosphate (RANKEM), and Potassium dihydrogen phosphate (RANKEM) were used for the method development and analysis of the developed tablet formulation.
Analytical Method Development
Sample preparation of EVE and EXE
A 10 mg sample of EVE was accurately weighed, transferred into the 100 mL volumetric flask and volume makeup with methanol, further sonicated for 2 min, and filtered with a 0.45 μm membrane filter. Then, the absorbance of EVE was determined in the wavelength range of 200 to 400 nm (UV-Visible Spectrophotometer, UV-1900i; Shimadzu).
The maximum absorbance was found at 264 nm for EVE. Further dilutions ranging from 5 to 35 μg/mL were prepared and scanned in triplicate for accurate absorbance. Moreover, the corresponding absorbance of EXE (100 μg/mL) was determined in the wavelength range of 200 to 400 nm, and the maximum absorbance was found at 282 nm. Further dilutions ranging from 5 to 30 μg/mL were prepared and scanned in triplicate for accurate absorbance.
Simultaneous estimation method
The simultaneous equation analysis method is based on the absorption of the drugs at their wavelength maxims.
7
The wavelength selected for the simultaneous equation development is 264 and 282 nm. The values of absorptivity determined for EVE were 0.0273 (ax1), 0.0131 (ax2), and for EXE, 0.0181(ay1), 0.0333(ay2) at 264 and 282 nm, respectively, as given in Supplementary Table S1. The earlier cited values are substituted in simultaneous equations to get final equations (1) and (2).
where Cx : Concentration of EVE in a sample; Cy : Concentration of EXE in a sample; ax 1, ax 2: Absorptivities of X (EVE) at A 1 and A 2 respectively; and ay 1, ay 2: Absorptivity of Y (EXE) at A 1 and A 2 respectively. A 1 and A 2 are the absorbance of sample solutions (containing both drugs) at 264 and 282 nm, respectively. After substituting values in the equation cited earlier, the concentration of Cx (EVE) and Cy (EXE) in μg/mL in the sample solution was determined.
Validation of analytical method
The developed analytical method was validated for linearity, accuracy, precision, robustness, ruggedness, and detail methodology as per ICH Q2 guidelines. 8 The nominal concentration was set at 20 μg/mL for precision and accuracy, and for robustness and ruggedness, it was set at 10, 15, and 20 μg/mL.
Development of Tablet Formulation of EVE and EXE
The FDA has approved EVE and EXE as combinational drug regimens for breast cancer. 9 Hence, the tablet matrix system was developed to improve biopharmaceutical properties and patient compliance. An extensive literature survey selected tablet excipients, and their acceptable limits were based on FDA's Inactive Ingredient Guide limits. All tablet excipients were weighted (Analytical Balance, XB220A; Precisa) accurately and passed through sieve no. 22 to get a uniform size. The amount of excipients used in the tablet was taken based on factorial design (32). To improve the solubility and in vitro dissolution, beta-cyclodextrin in a set concentration was added to the tablet mixture.
Optimization of tablet formulation
To get the best-optimized tablet formulation by the direct compression method, a total of eight formulation batches (F1–F8) was generated by factorial design (32). The key factors influencing the tablet formulation were identified, such as excipients (e.g., binders, disintegrants, lubricants), drug concentration, compression force, and processing parameters.
Based on critical attributes and analysis of variables, microcrystalline cellulose (X1), sodium starch glycolate (X2), and beta-cyclodextrin (X3) were taken as independent variables, and hardness (Y1), friability (Y2), and disintegration time (Y3) were taken as dependent variables. These variables were screened based on a high-risk assessment and vulnerability approach.
The high and low levels of variables and composition of all batches (F1–F8) are given in Table 1. Analysis of variance (ANOVA) was performed to check the significance analysis of the proposed mathematical model. Response surface analysis checked the inherent interaction between independent and dependent variables. The optimization was done as per Derringer's Desirability approach.
Optimization of Variables and Composition of Tablet Formulations
EVE, Everolimus.
Evaluation of tablet formulation
Before compression, precompression parameters of all batches (F1–F8) were performed to get a fair idea about the flow property of the powders. The final data of precompression parameters are given in Supplementary Table S2. After the final compression (Tablet Punching Machine, Mini press-II, Rimek) of the tablet formulation of all eight batches, several pharmacopoeial and non-pharmacopoeial tests were performed to find the best-optimized formulation, which confers the guidelines of weight variation test, hardness test, friability test, disintegration time, dissolution test, and drug assay.
Disintegration time (Y1)
The disintegration test demonstrates how rapidly a tablet disintegrates into smaller fragments, increasing the surface area and drug availability for dissolution and absorption from the gut. 10 Disintegration time was measured by placing six tablets in the disintegration apparatus (Physilab) filled with purified water at 37°C ± 2°C.
Hardness test (Y2)
Randomly, three tablets were selected from each formulation batch, and hardness was measured using a hardness tester (Monsanto hardness tester, VMT 1; Vinsyst). The data of each formulation are given in Table 7.
Friability test (Y3)
A total of 6.5 g of tablets were weighed from each formulation and placed in the sieve, and loose dust was removed with the help of a soft brush. The sample was weighed and placed in the friability test apparatus (Roches Friabilator) for rotations (100 rotations/4 min). Before weighing, loose dust was removed, and the weight loss percentage was calculated using the formula given next.
Weight variation test
A weight variation test was done to assess the variation of weight among the batches of tablets. Twenty uncoated tablets from each batch were weighed individually using an analytical balance. Their average weight was compared with the individual weights. The mean ± standard deviation of each formulation is given in Table 9.
Optimization by Derringer Desirability Approach
After identifying and analyzing responses, the target values for each response were done, and goals were assigned. After providing the necessary inputs, the optimized tablet formulation containing microcrystalline cellulose (X1), sodium starch glycolate (X2), and beta-cyclodextrin (X3) provided the predicted response of disintegration time (Y1), hardness (Y2), and friability (Y3), respectively, with an overall desirability value of 0.865.
A checkpoint batch of the predicted batch has been prepared, and % Bias for the observed and predicted batch was done to check the reproducibility of the final optimized formulation. Overlay plot and design space have been done as per the graphical optimization approach.
In vitro dissolution studies
The in vitro release profile of the optimized batch of the tablet formulation is carried out in USP dissolution test apparatus II (Dissolution Test Apparatus, DS 8000; Labindia) at 37°C ± 0.5°C with a rotation speed of 50 rpm in 900 mL phosphate buffer having pH 6.8. 11 Aliquots of 5 mL each were withdrawn at predetermined time intervals.
The withdrawn volume was replenished immediately with the same volume of fresh medium to keep the total volume constant and maintain sink conditions. The amount of EVE and EXE released in the dissolution medium was determined by the developed spectrophotometric method at 264 and 282 nm.
Drug assay
Twenty tablets were taken, weighed, and crushed to make a fine powder. The equivalent weight of 10 mg of EVE and 25 mg of EXE was taken and dissolved into a 100 mL volumetric flask, sonicated for 30 min, and filtered with a Whatman filter paper no. 1; the filtrate was collected. Further dilutions were made from this aliquot to form desirable concentrations with methanol, and their spectra were recorded in the UV-Visible Spectrophotometer at 264 and 282 nm. The result was calculated using the simultaneous equation method.
RESULT AND DISCUSSION
Development of Analytical Method
The wavelength scan of standard EVE and EXE dilution in methanol shows their maximum absorbance at 264 and 282 nm, respectively, as shown in Figure 1a and b. The specificity of the standard samples was measured by comparing the absorption of solvent (vehicle) with and without the sample. Methanol was used as the solvent for EVE and EXE. The solvent system adopted for each drug component was suitable for the study.
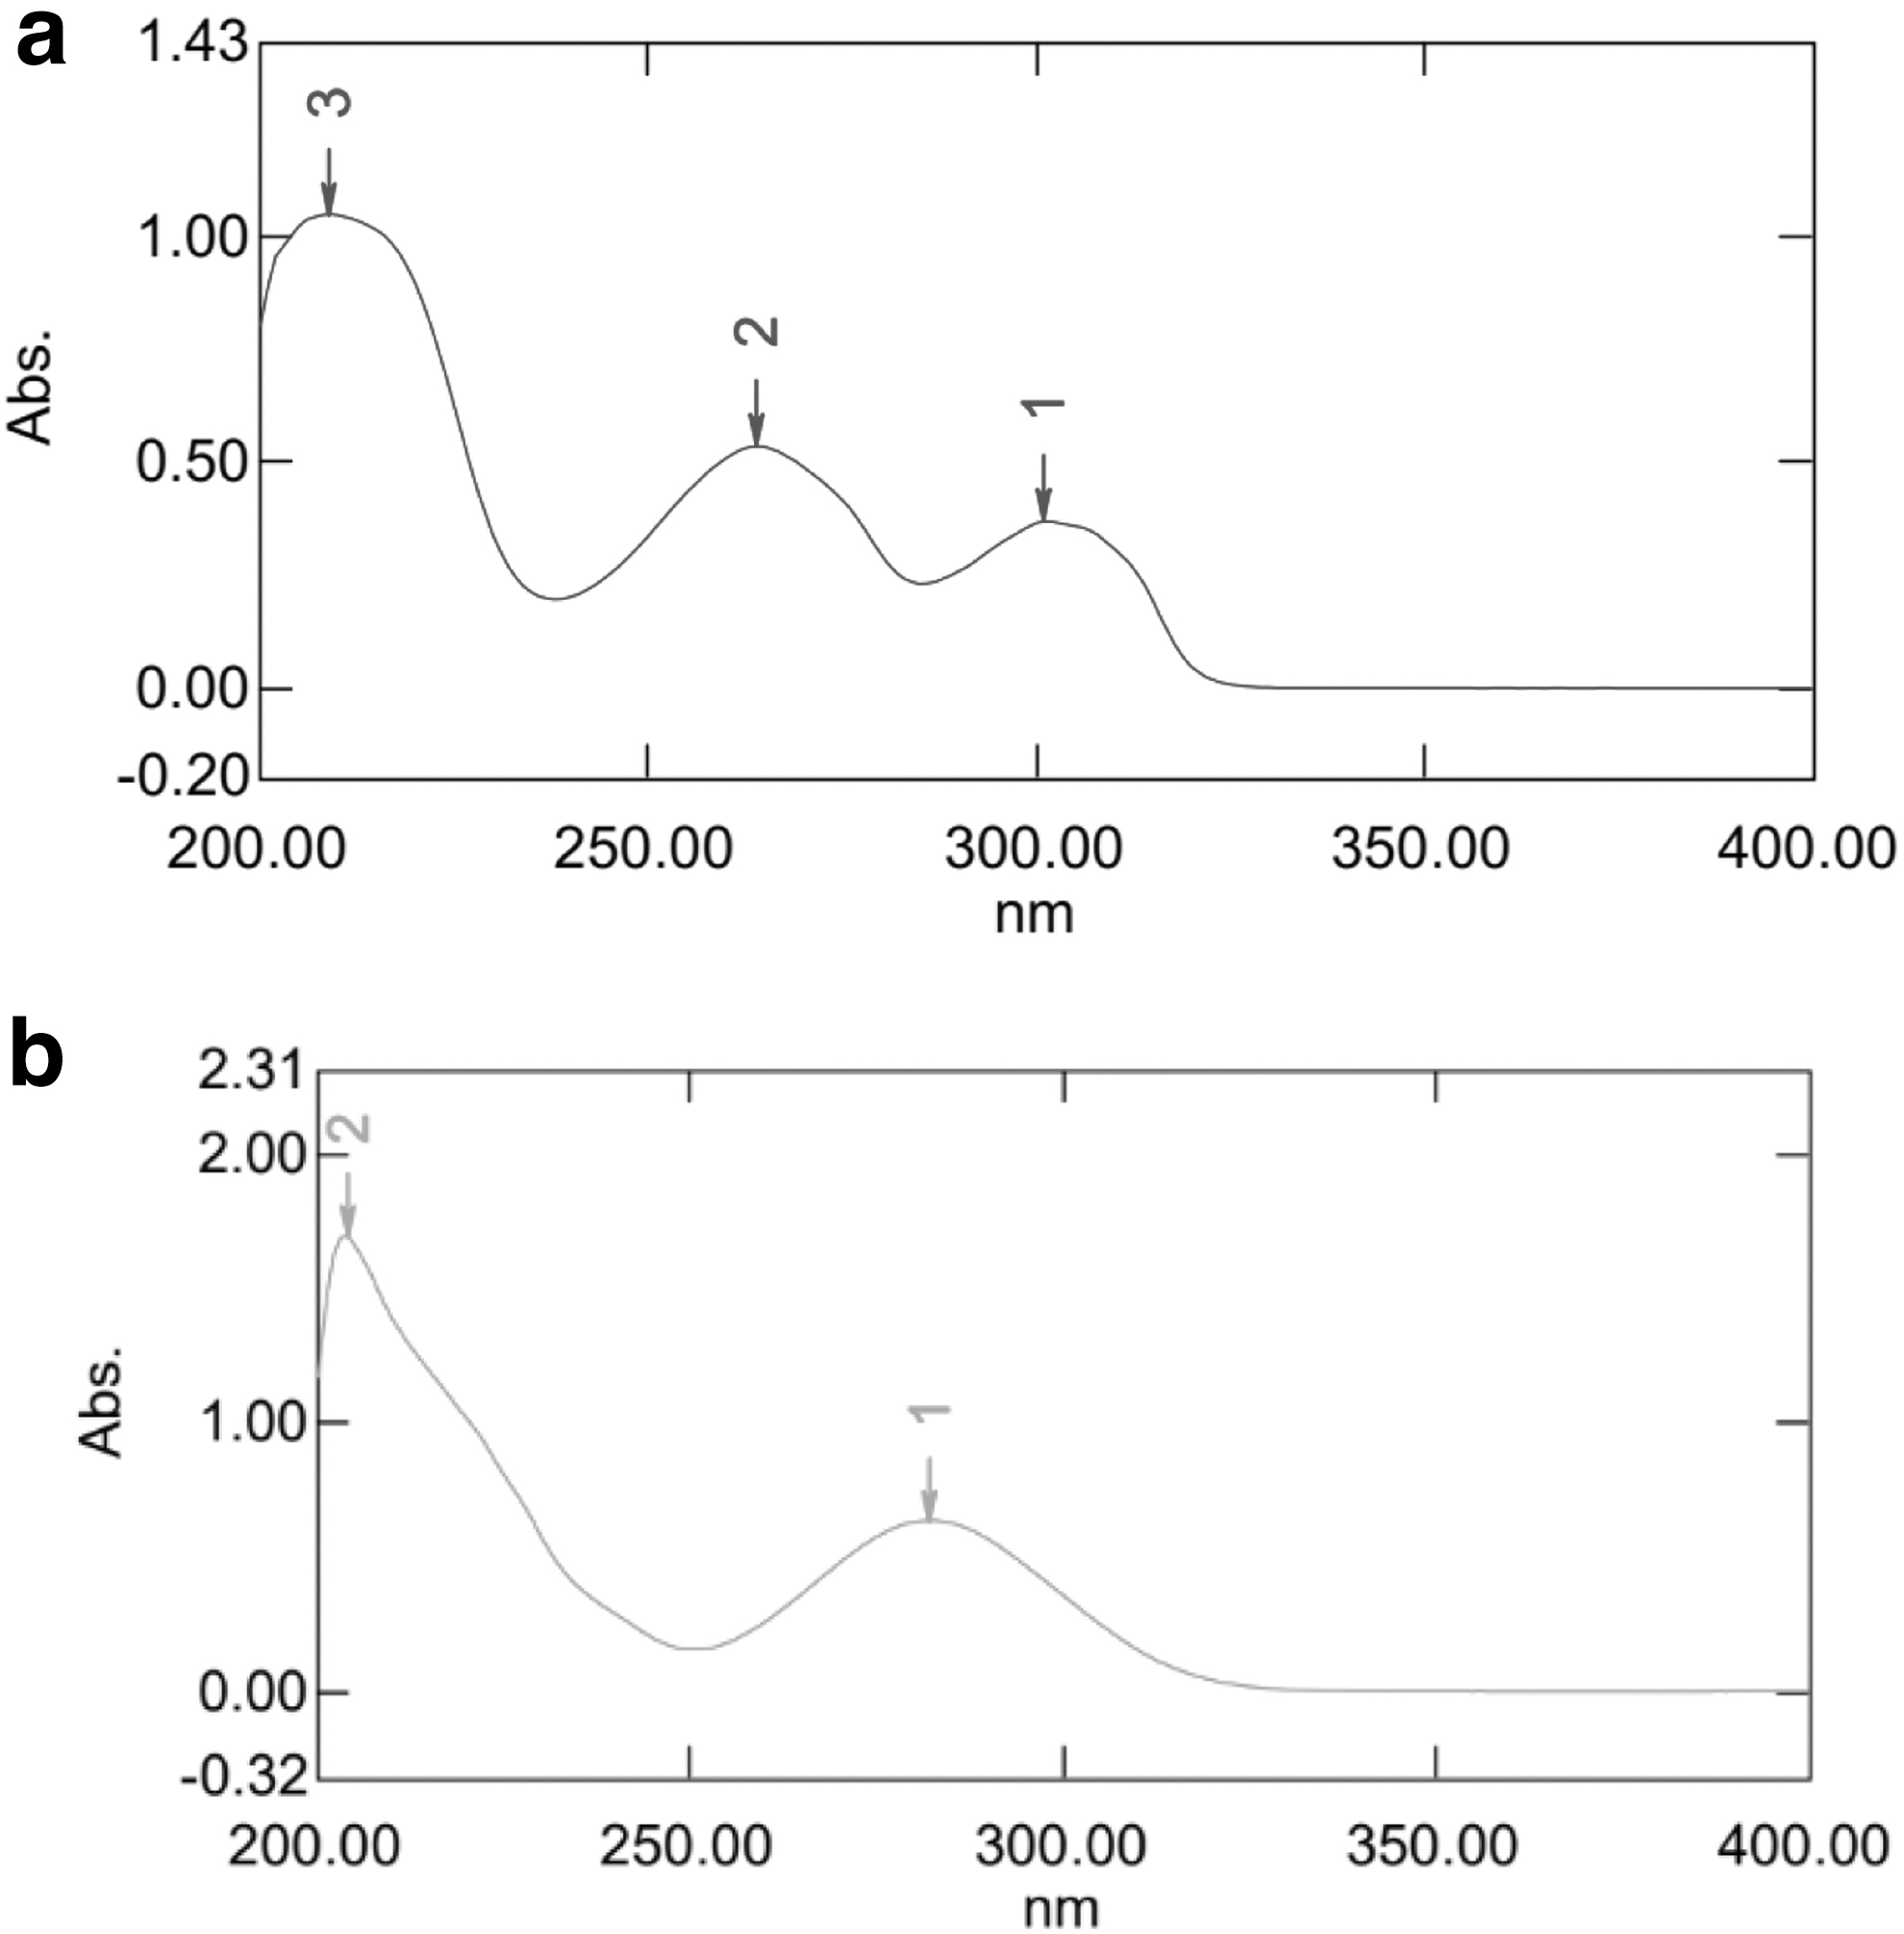
UV-Spectrum of:
Validation of Developed Method of EVE and EXE
Linearity
Appropriate dilution was prepared from stock solutions and scanned in triplicates for each drug. The concentration range, which follows Lambert's beer law, was found to be 5–30 μg/mL for EVE and 5–35 μg/mL for EXE. The responses of both drugs were found to be linear, and their linear regression equation and correlation coefficient were determined, as shown in Figure 2a and b.
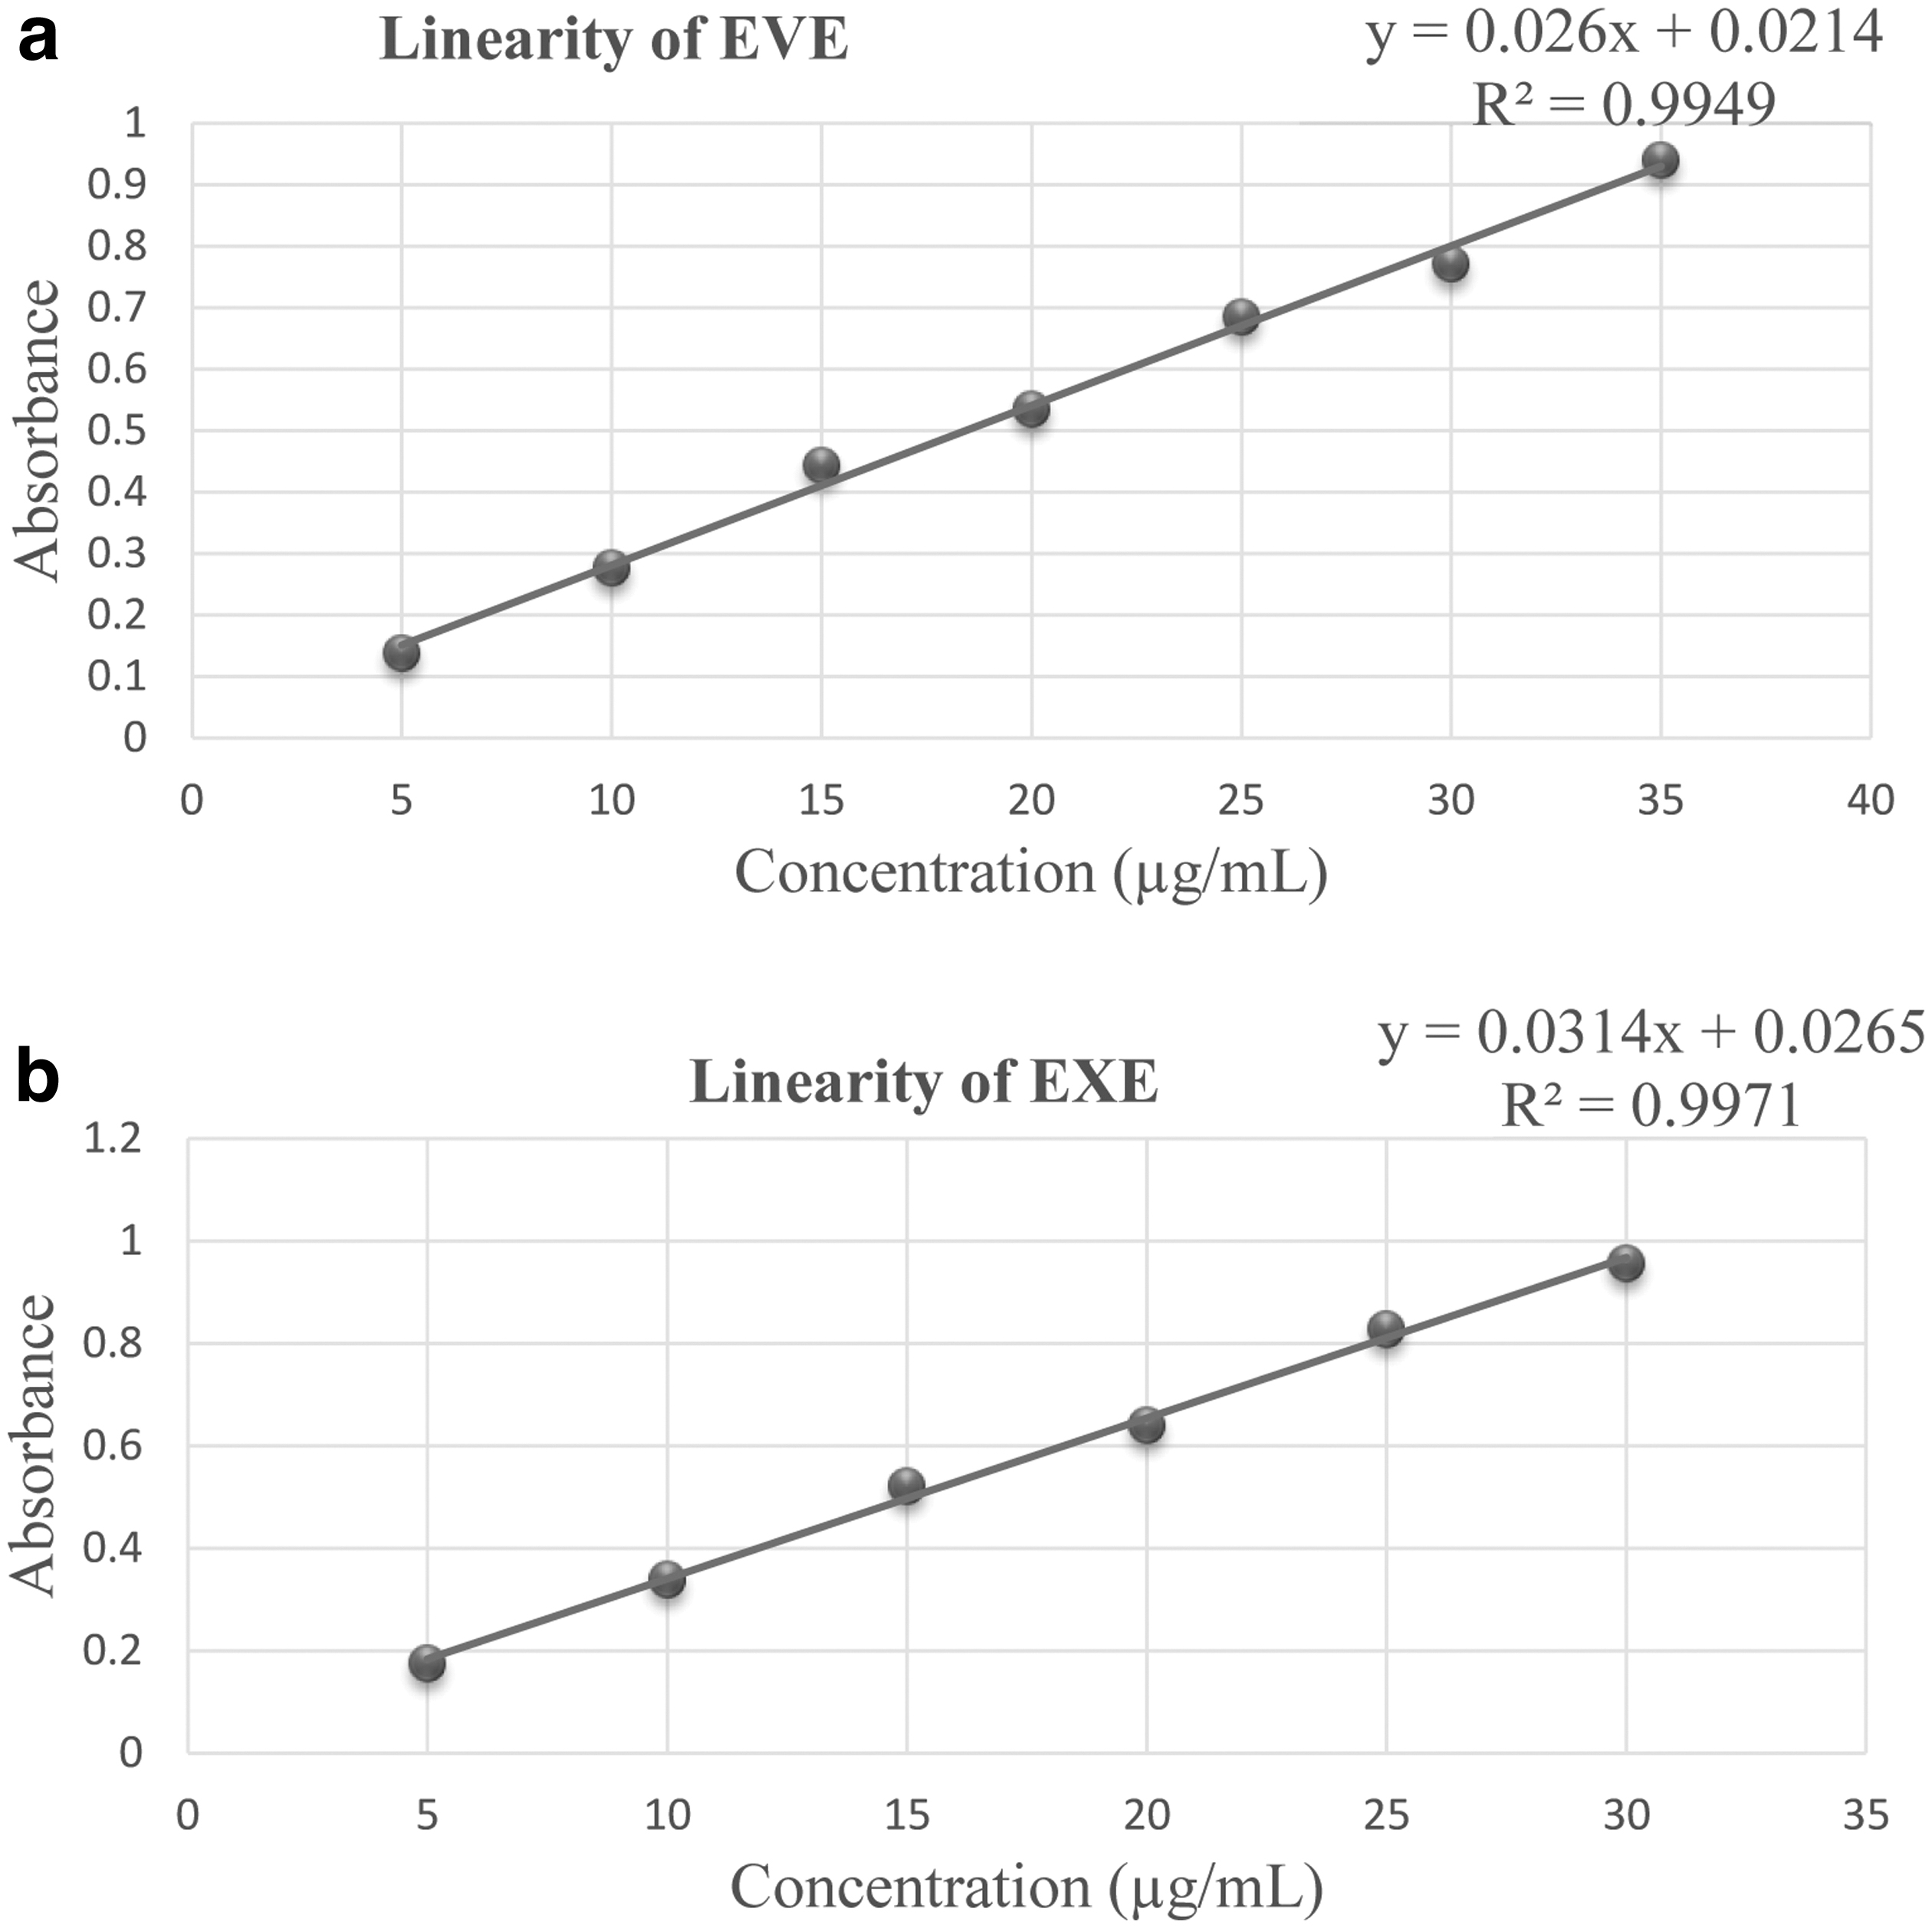
Linearity curve of:
Precision
Precision data were analyzed for intra-day and inter-day precision. It was determined by analyzing the sample solution on the same day and different days at different time intervals, respectively. The % relative standard deviation (RSD) for intra-day and inter-day precision was <2%, which complies with the ICH guidelines, 8 as shown in Table 2.
Validation Parameters
EXE, Exemestane; RSD, relative standard deviation.
Limit of detection and limit of quantitation
The limit of detection (LOD) and the limit of quantitation (LOQ) were determined for EVE and EXE for the proposed methods. LOD and LOQ were calculated using the formula 3.3
Accuracy
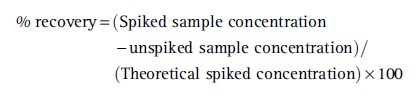
Accuracy studies were performed at three different recovery levels (80%, 100%, and 120%) of the test concentration as per ICH guidelines. The recoveries were performed in triplicates at each level, and the recovery was calculated, as shown in Table 3, using the formula. 12
Accuracy of Everolimus and Exemestane (n = 3)
SD, standard deviation.
Robustness
Robustness is the capacity of a method to remain unaffected by minor, deliberate variations in method parameters. 13 To ensure method robustness, ±2 nm variation in the λ max of both drugs, cuvette volume was reduced to 50% to ensure and verify its method reproducibility. The combined data analysis is given in Tables 4 –6 .
±2 nm Variation of λ ma x of Exemestane
±2 nm Variation of λ ma x of Exemestane
Fifty Percent Cell Volume of Cuvette
Ruggedness
Ruggedness indicates the lack of influence on the test results of operational and environmental variables of the analytical method. 14 The data given next show how much variation in terms of mean and RSD is due to different analysts performing the same dilution and instrument handling, as shown in Table 7.
Ruggedness Data of Different Analyst
Tablet development using factorial design
A 32 complete factorial design with two center points was selected, considering the number of variables, that is, 3 to be researched. An 8-experiment design grid was generated on considering three continuous factors, namely microcrystalline cellulose (X1), sodium starch glycolate (X2), and beta-cyclodextrin (X3). These critical variables are essential for a stable tablet formulation for oral delivery.
Considering the loading of two drugs, these variables' importance and optimization were selected as high matter; hence an optimal design space will be produced. 15 Different batches were developed by each of the experiment executed, and the disintegration time (Y1) and hardness (Y2), and friability (Y3) were selected as prime responses, as given in Table 8. Different mathematical models were validated and screened, and it was found that two-factor interaction (2FI) was observed in the validated mathematical model.
Overall Design Summary of Independent and Dependent Variables
F. Code, formulation code.
Analysis of variance
The variables' fit summary analysis and significance were performed through one-way discriminated ANOVA. After analyzing the significance, the entire mathematical model for a particular response was analyzed for p-value with a fixed significance interval of <0.0001. 16 The results found that values of “Prob > F”, <0.05 indicate that model terms are significant.
In this model, it is found that the main components have significant effects. The Lack of Fit is not significant relative to pure error. For direct compression, the “Lack of Fit F-value” of 0.70 implies that the Lack of Fit is not significant relative to the pure error. There is a 73.01% chance that a “Lack of Fit F-value” this large could occur due to noise. Non-significant lack of fit is good. The entire response analysis is given in Table 9.
Response surface analysis
A 3D response plot was obtained from design expert software and is presented. Y1 increases significantly with an increase in X1 and X2, whereas increasing X3 has no significant effect on Y1 (Fig. 3a–c). The corresponding polynomial equation supports the same: the positive sign yields synergism, and the negative sign indicates antagonism.
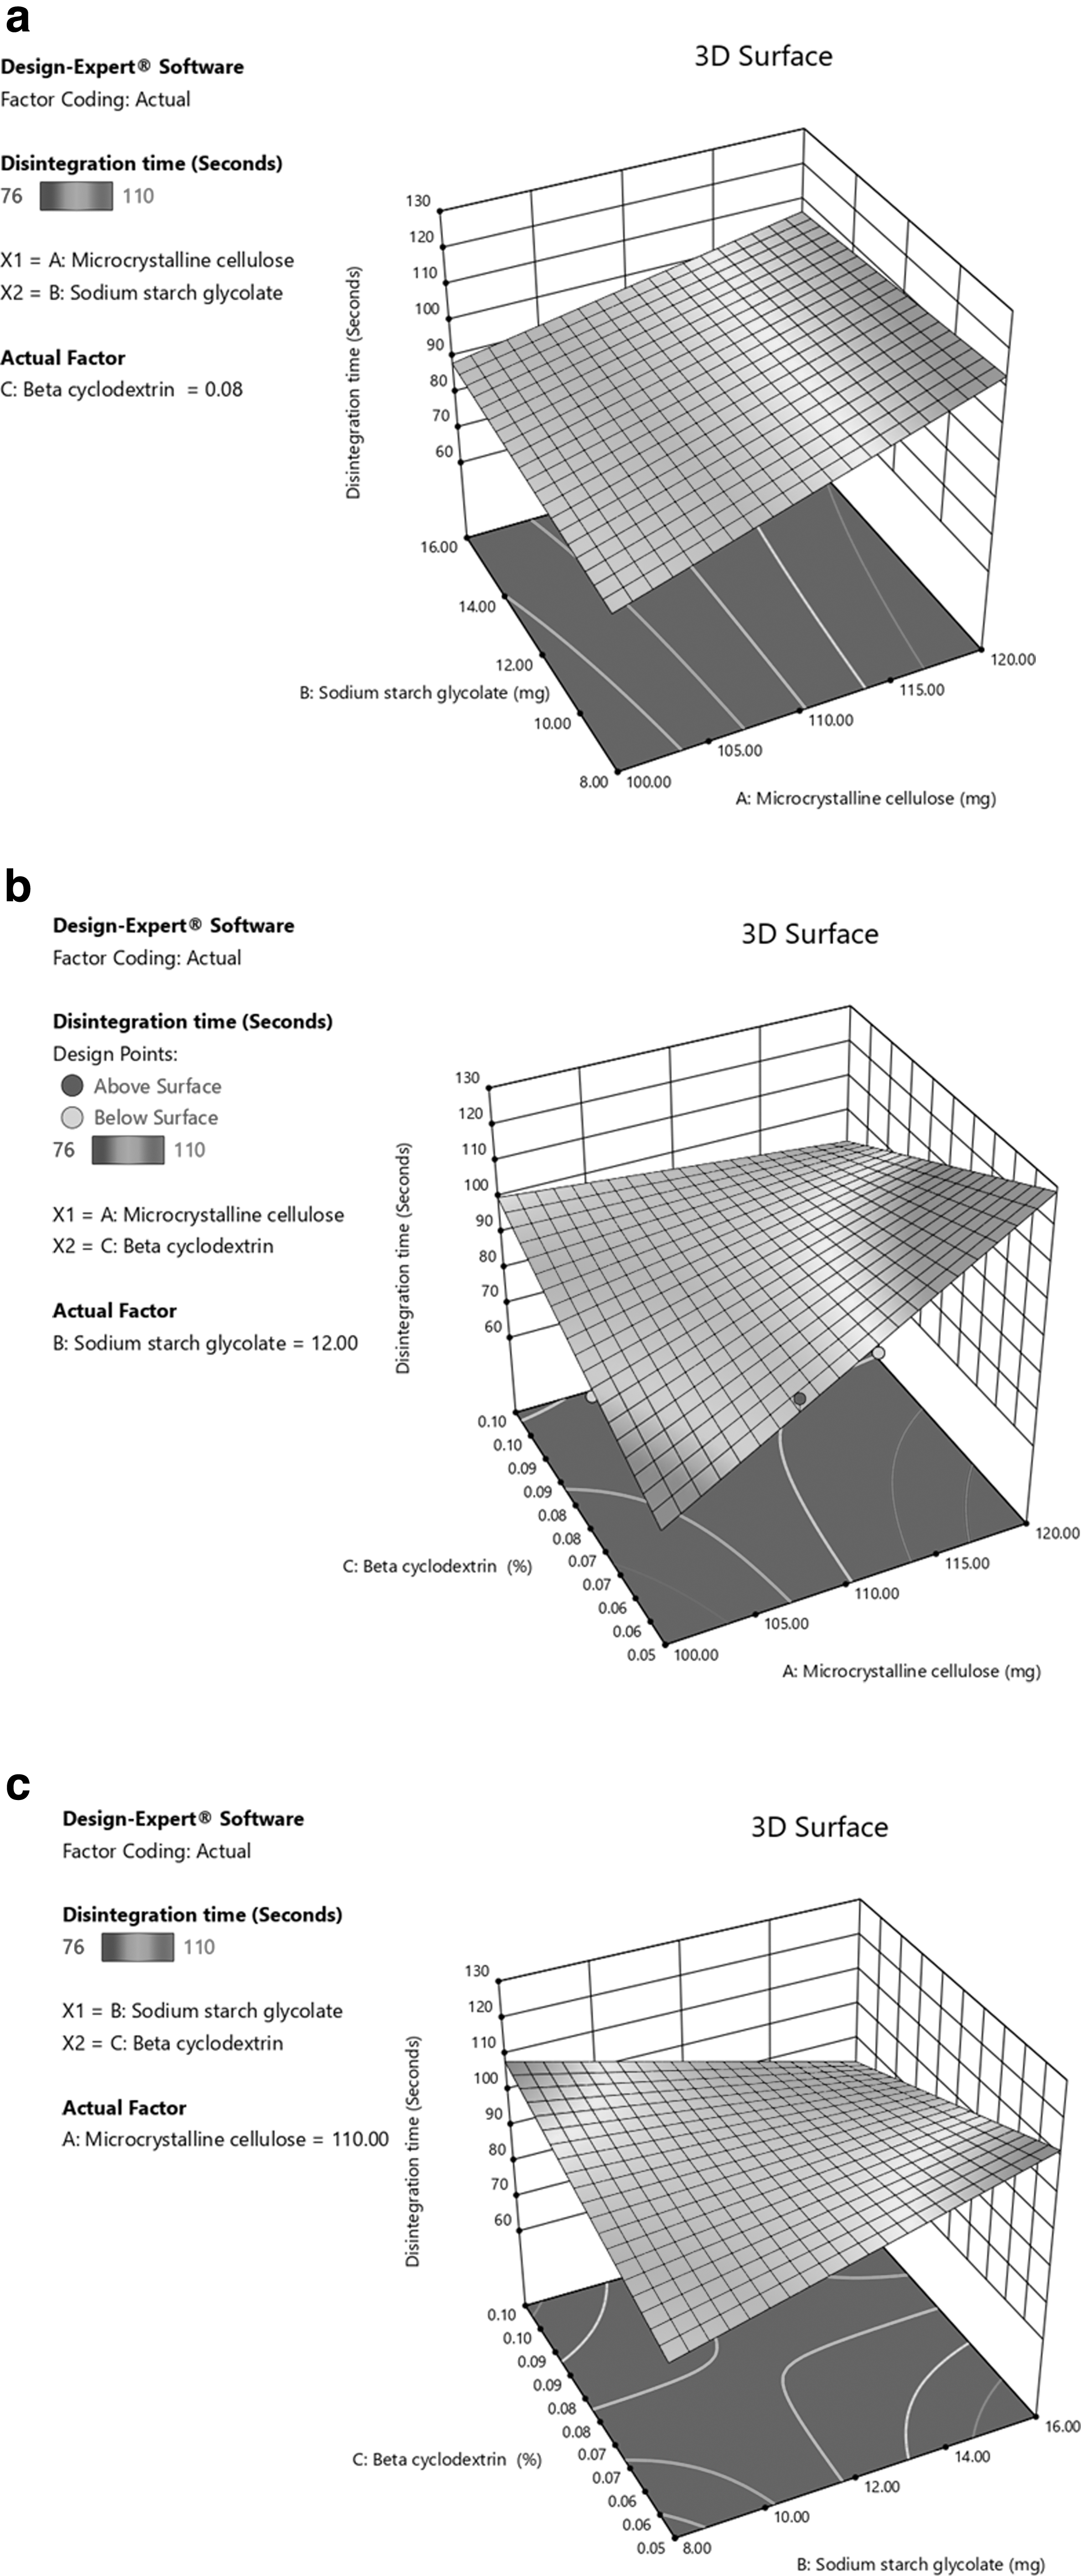
3D response curve of Y1:
Moreover, for Y2, the results indicated that the Y1 of the tablets was significantly influenced by the 2FI models of X1, X2, and X3 (Fig. 4a). In addition to the interactive model of X2 and X3, the combined interactions produced excellent linearity and synergism to stabilize Y1 (Fig. 4b). When X3 increased from −1 level to +1 level, Y1 was found to be increased.
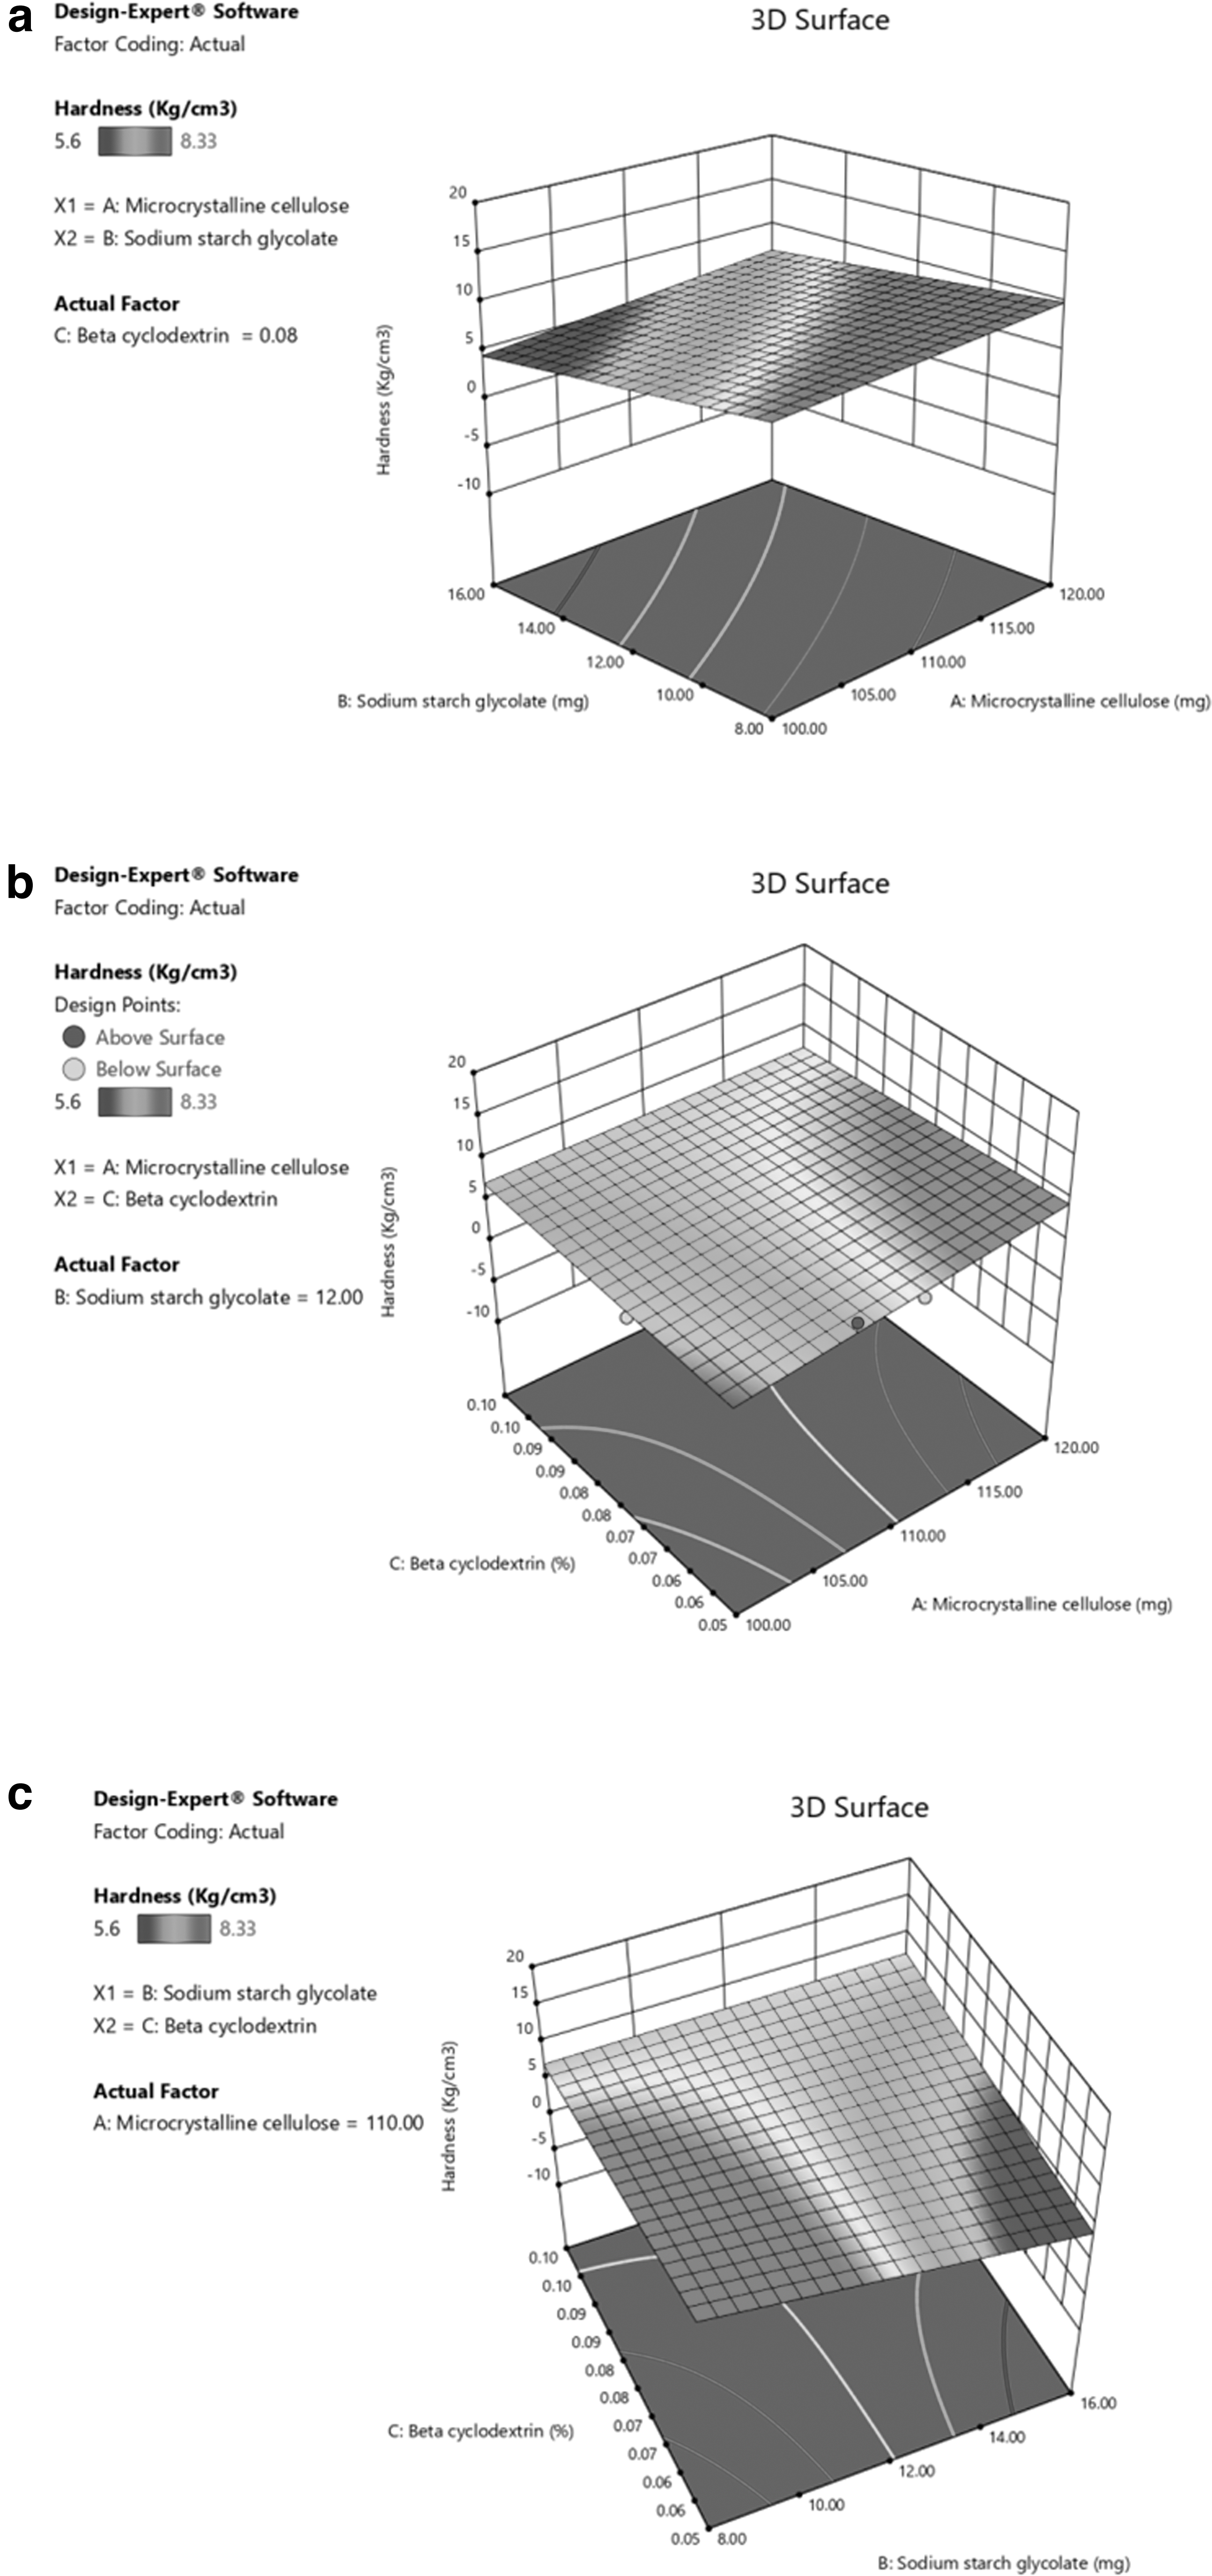
3D response curve of Y2:
The sizeable positive coefficient (+3.75) of X3 and negative coefficient (−2.75) of X2 suggested that the percentage of disintegration was observed to be increased (Fig. 4c). For Y3, the primary effects were significantly influenced by the 2FI models of the quantity of X2 and X3. A three-dimensional surface plot (Fig. 5a, b) indicated that when X2 increased from −1 level to +1 level, Y2 was found to stabilize linearly and this could be due to positive cumulative interaction and best-fit ratios of independent variables.
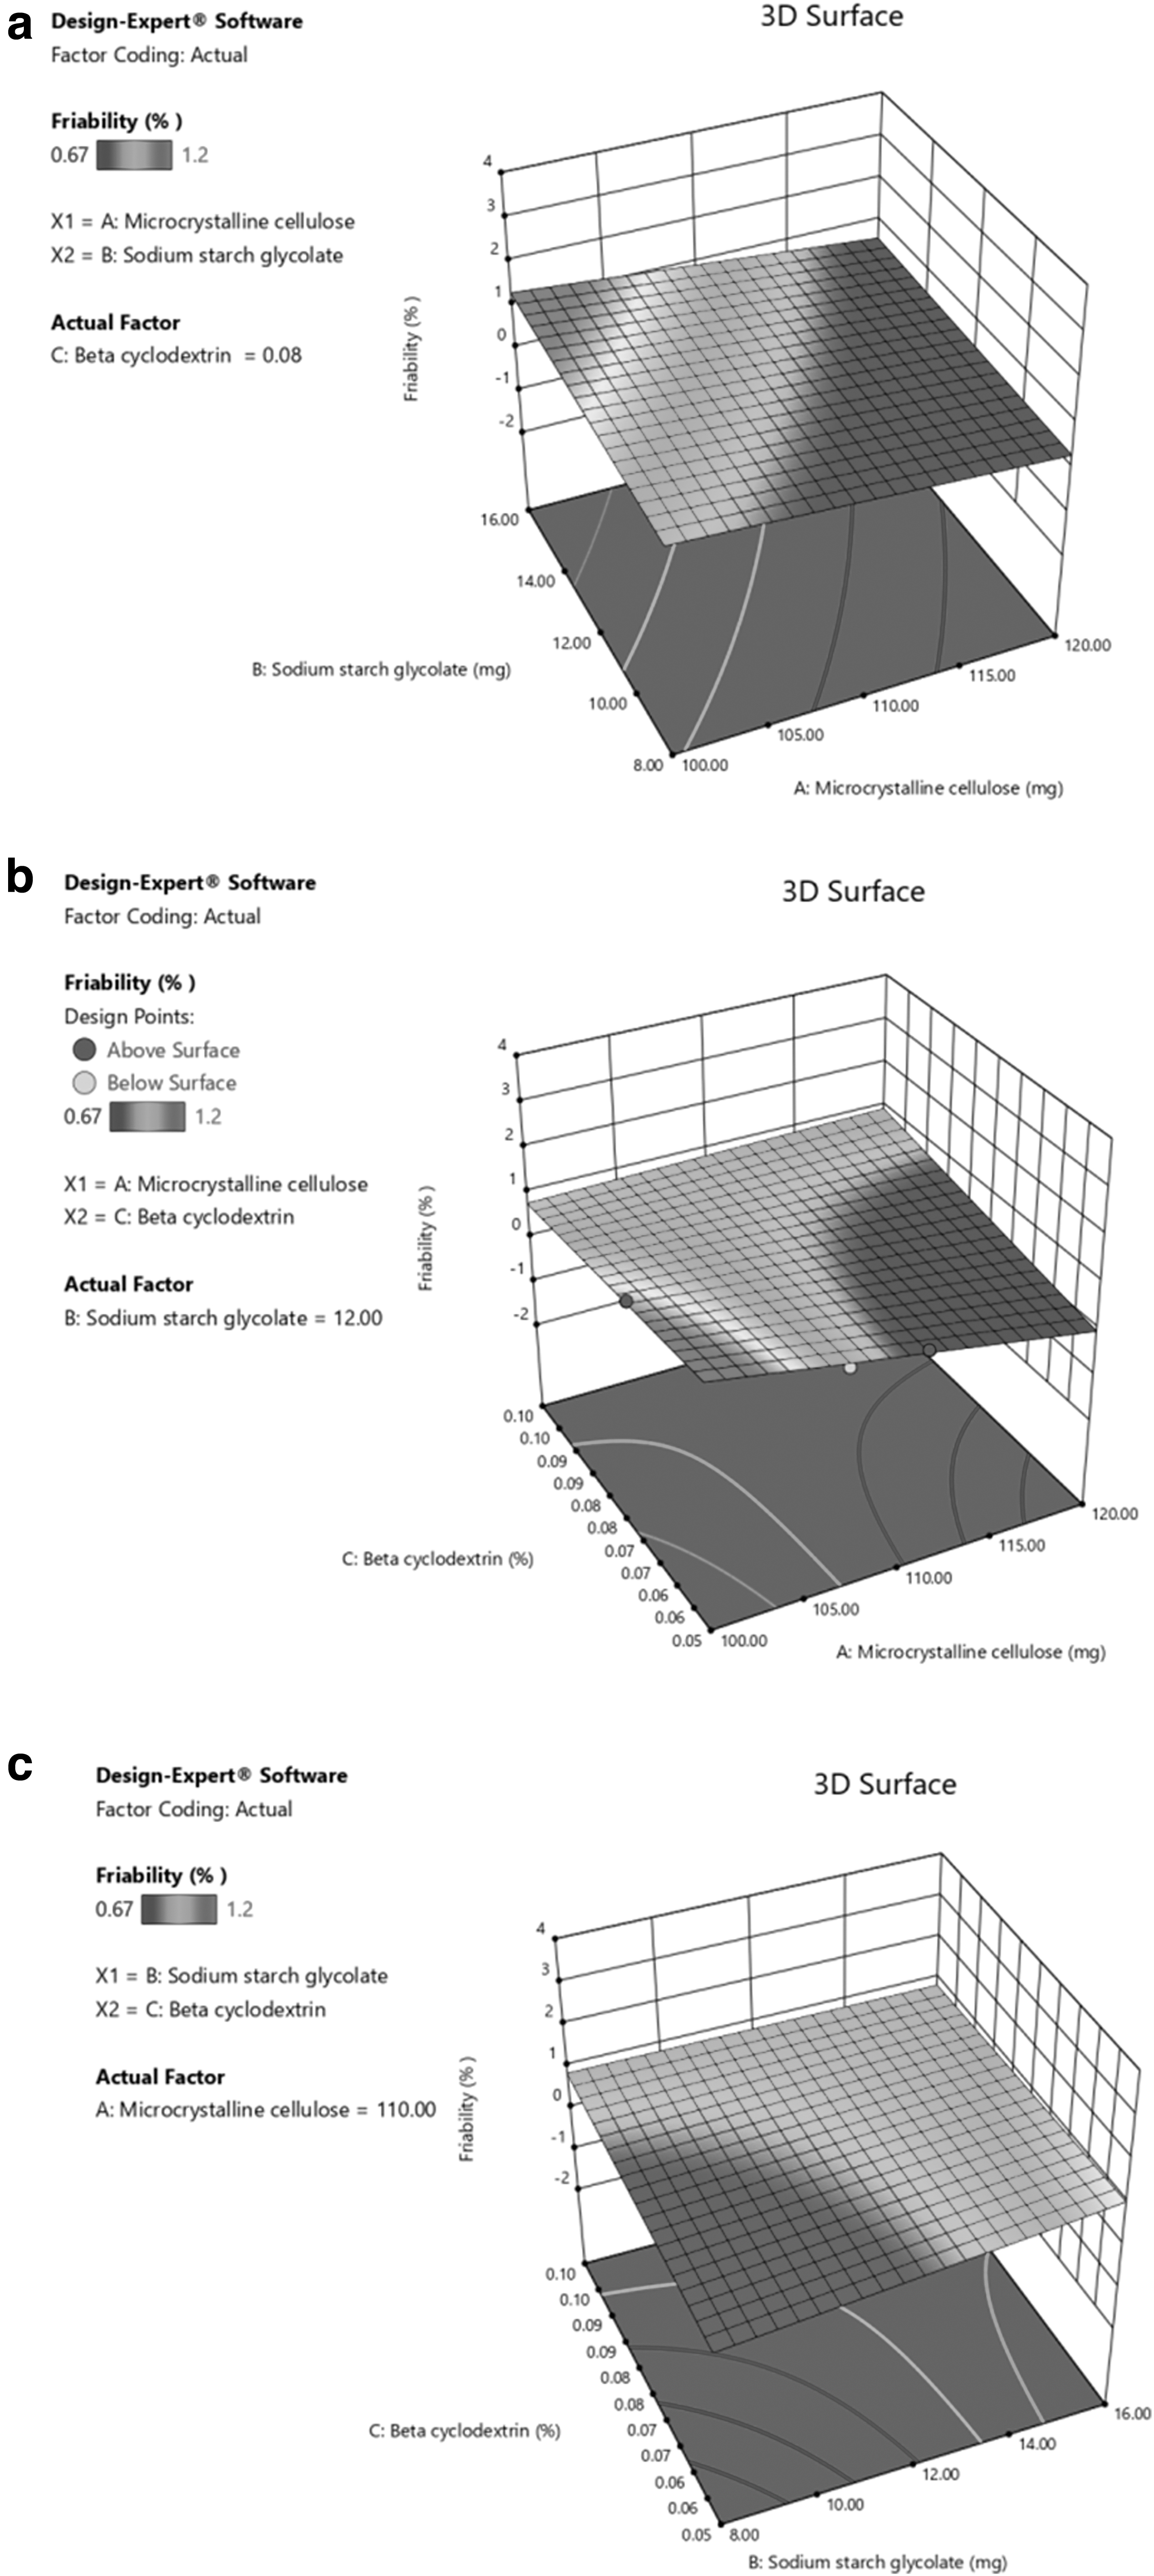
3D response curve of Y3:
The corresponding polynomial equation was also united with the observation just cited. When X2 increased from −1 level to +1 level, Y1 decreased linearly due to the increased porosity of the tablet's reduced strength (Fig. 5c). The positive coefficient (+1.50) of X2 had a significant effect, followed by the negative coefficient (−1.00) of X3 on Y2 as per the polynomial equation.
Response 1: Disintegration time
Response 2: Hardness
Response 3: Friability
Evaluation of tablet formulation
The batch of all eight tablet formulations was blended well before compression by direct compression. In the direct compression method, selecting excipients is crucial because it directly influences the flow of the powder (formulation blend). Various measures are taken to ensure flow, including talc and magnesium stearate.
Flow parameters of all powders were evaluated before compression, as shown in Supplementary Table S2. After compression, response variables were analyzed, the % drug content was calculated using a developed simultaneous equation, and the result is within the range, that is, 98%–102%, as shown in Table 9.
Analysis of Variance for Y1, Y2, and Y3
ANOVA, analysis of variance.
Optimization using Derringer Desirability Approach
Using the software, optimum formulation variables to produce OP-EV-EX-TAB formulation with desired characteristics were studied. The goals have been set accordingly to get design space. After the grid search approach, formulation (selected as optimal formulation) contained an optimum percentage of X1, X2, and X3. Optimization using the desirability approach is presented in Table 10, and the observed response is given in Table 11.
Evaluation Parameters of Batch F1–F8
Optimization Using Desirability Approach
OB1, optimized batch.
The linear correlation plots drawn between the predicted and the observed values demonstrated a higher desirability value of 0.865. Thus, the model's validity was established, and the formulation variables were robust within the control space. Figure 6 provided optimum design space for the best-fit region for the optimized tablet batch for EXE and EVE.
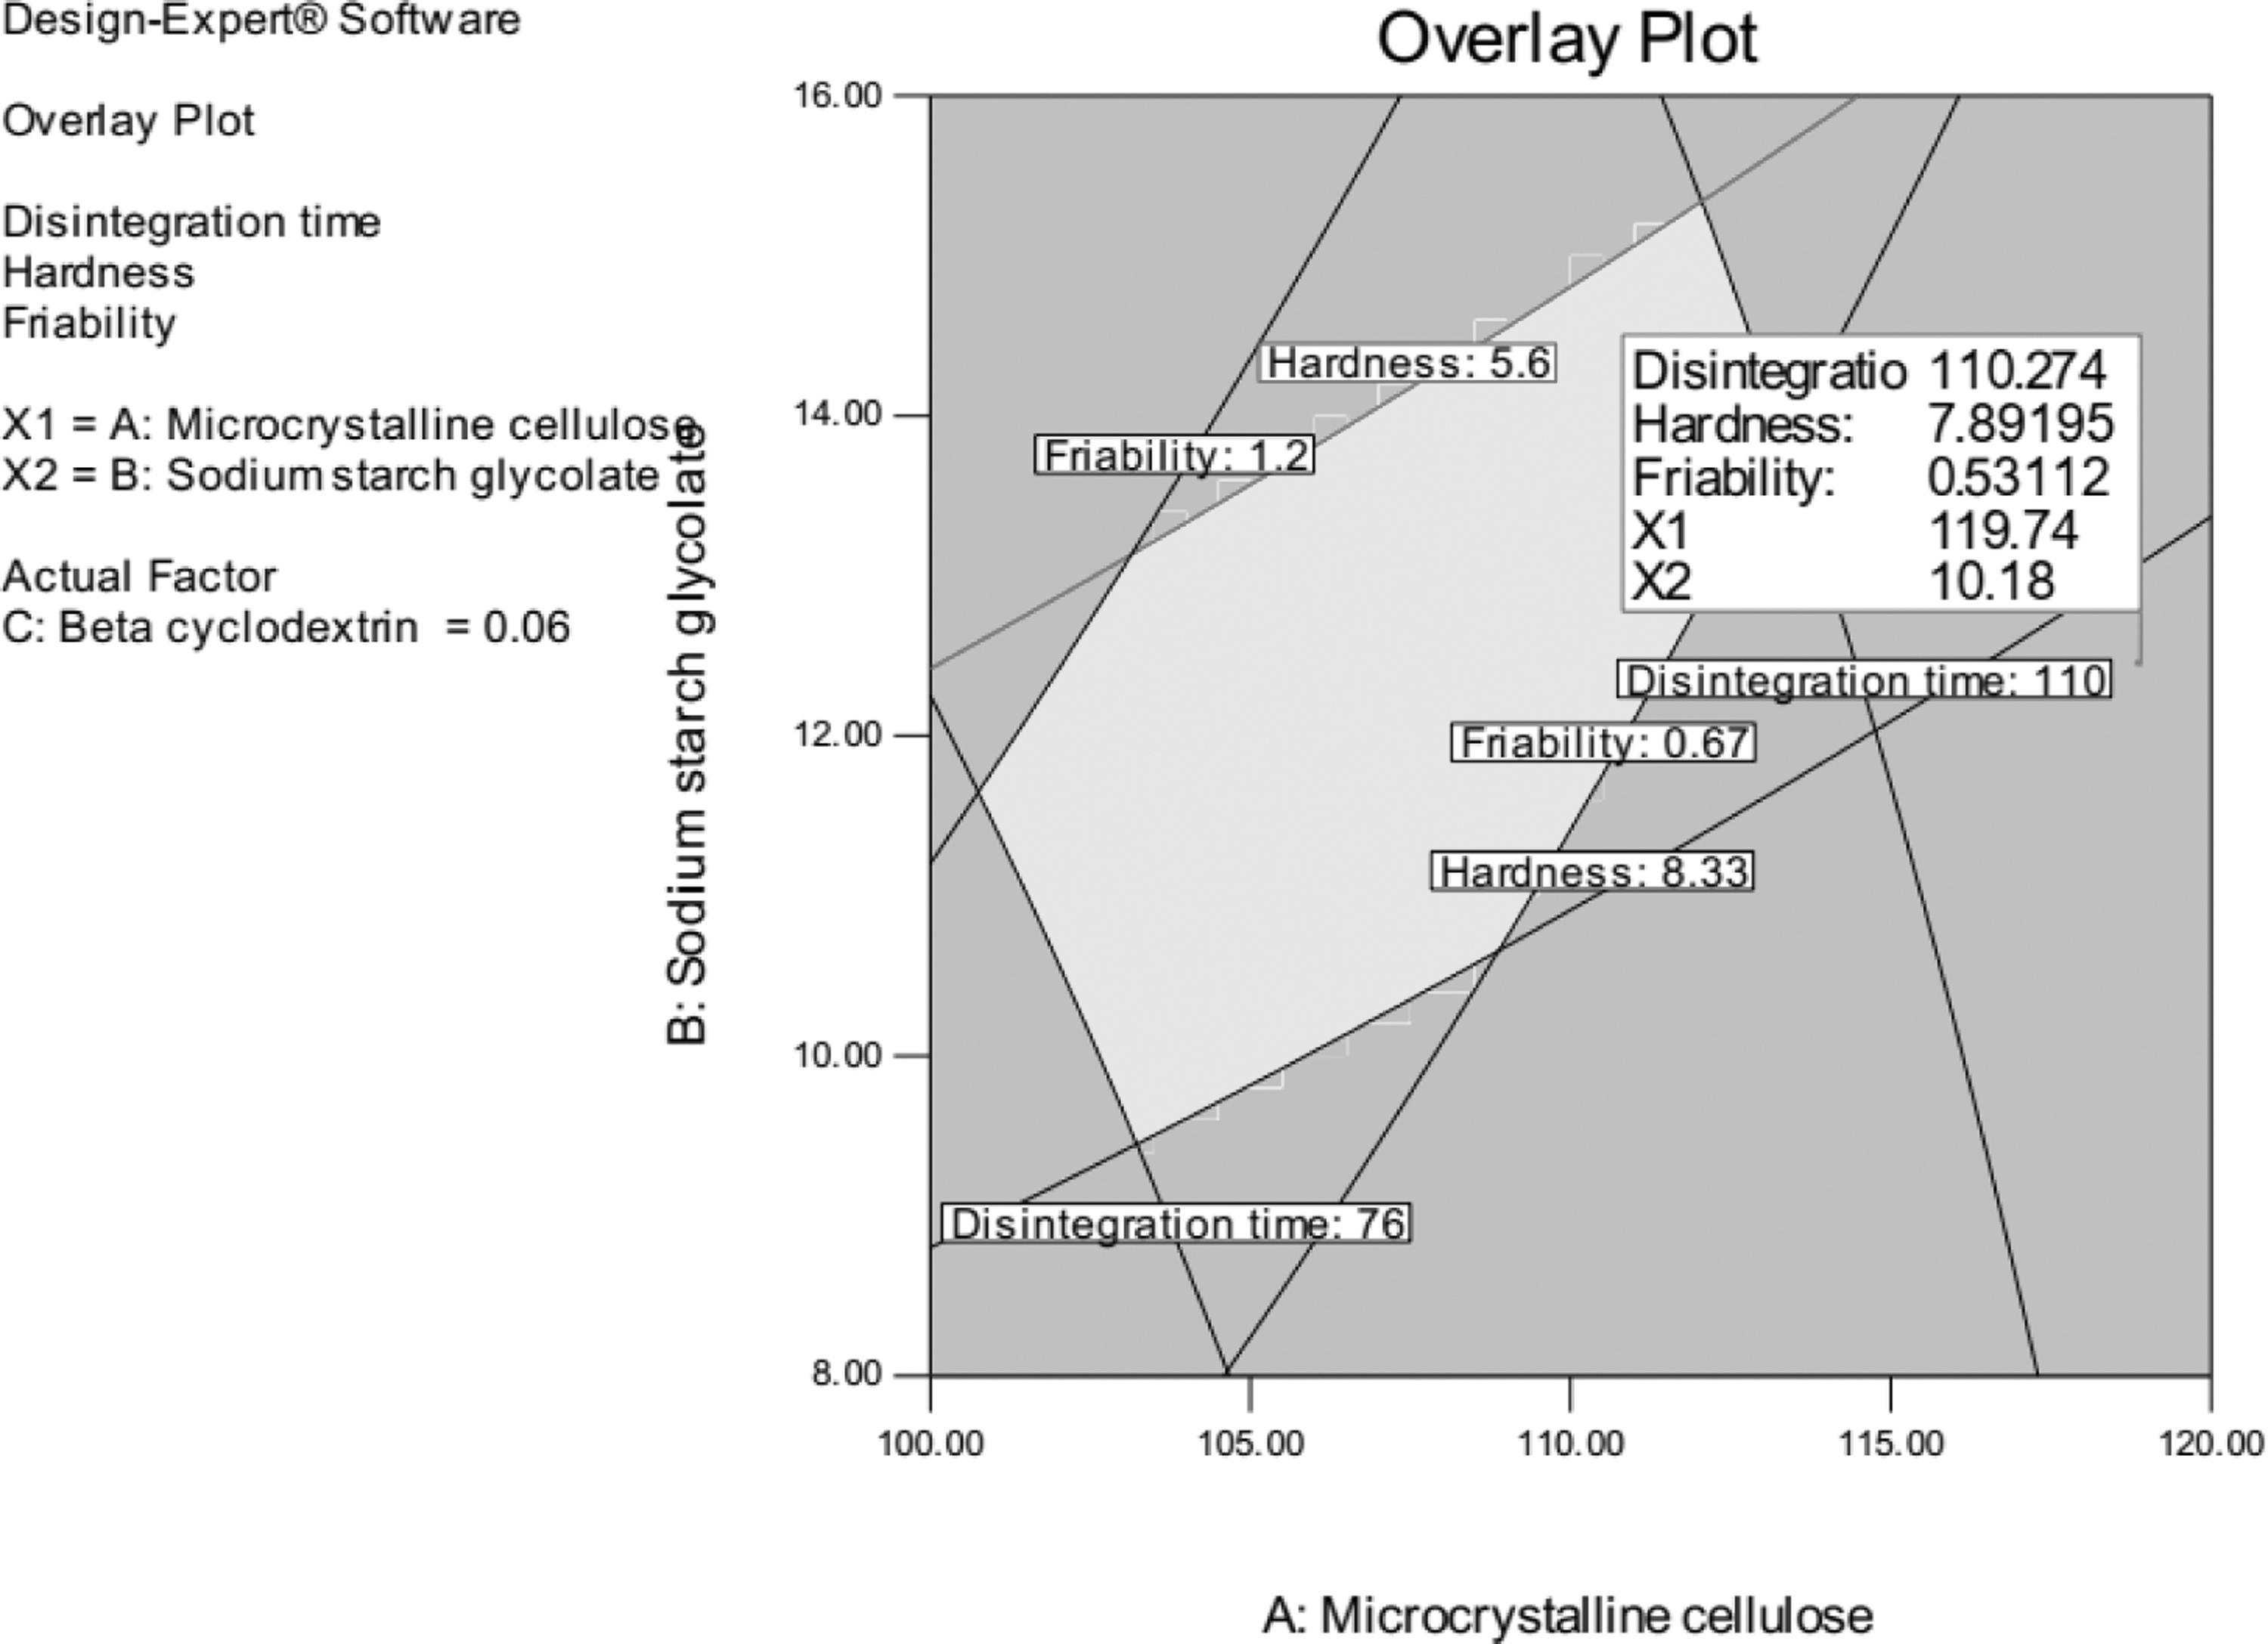
Overlay plot of design space.
Evaluation of optimized batch formulation
Before compression of the optimized batch (OB1), the flow property of the powder was analyzed and found to be the angle of repose 33.90, Hausner's ratio 1.257, and compressibility index 20.430. After compression, response variables such as disintegration time (Y1), hardness (Y2), friability (Y3), and % drug assay and weight variation were analyzed, as shown in Table 12.
Evaluation of Optimized Batch
In vitro drug release profile of OB1
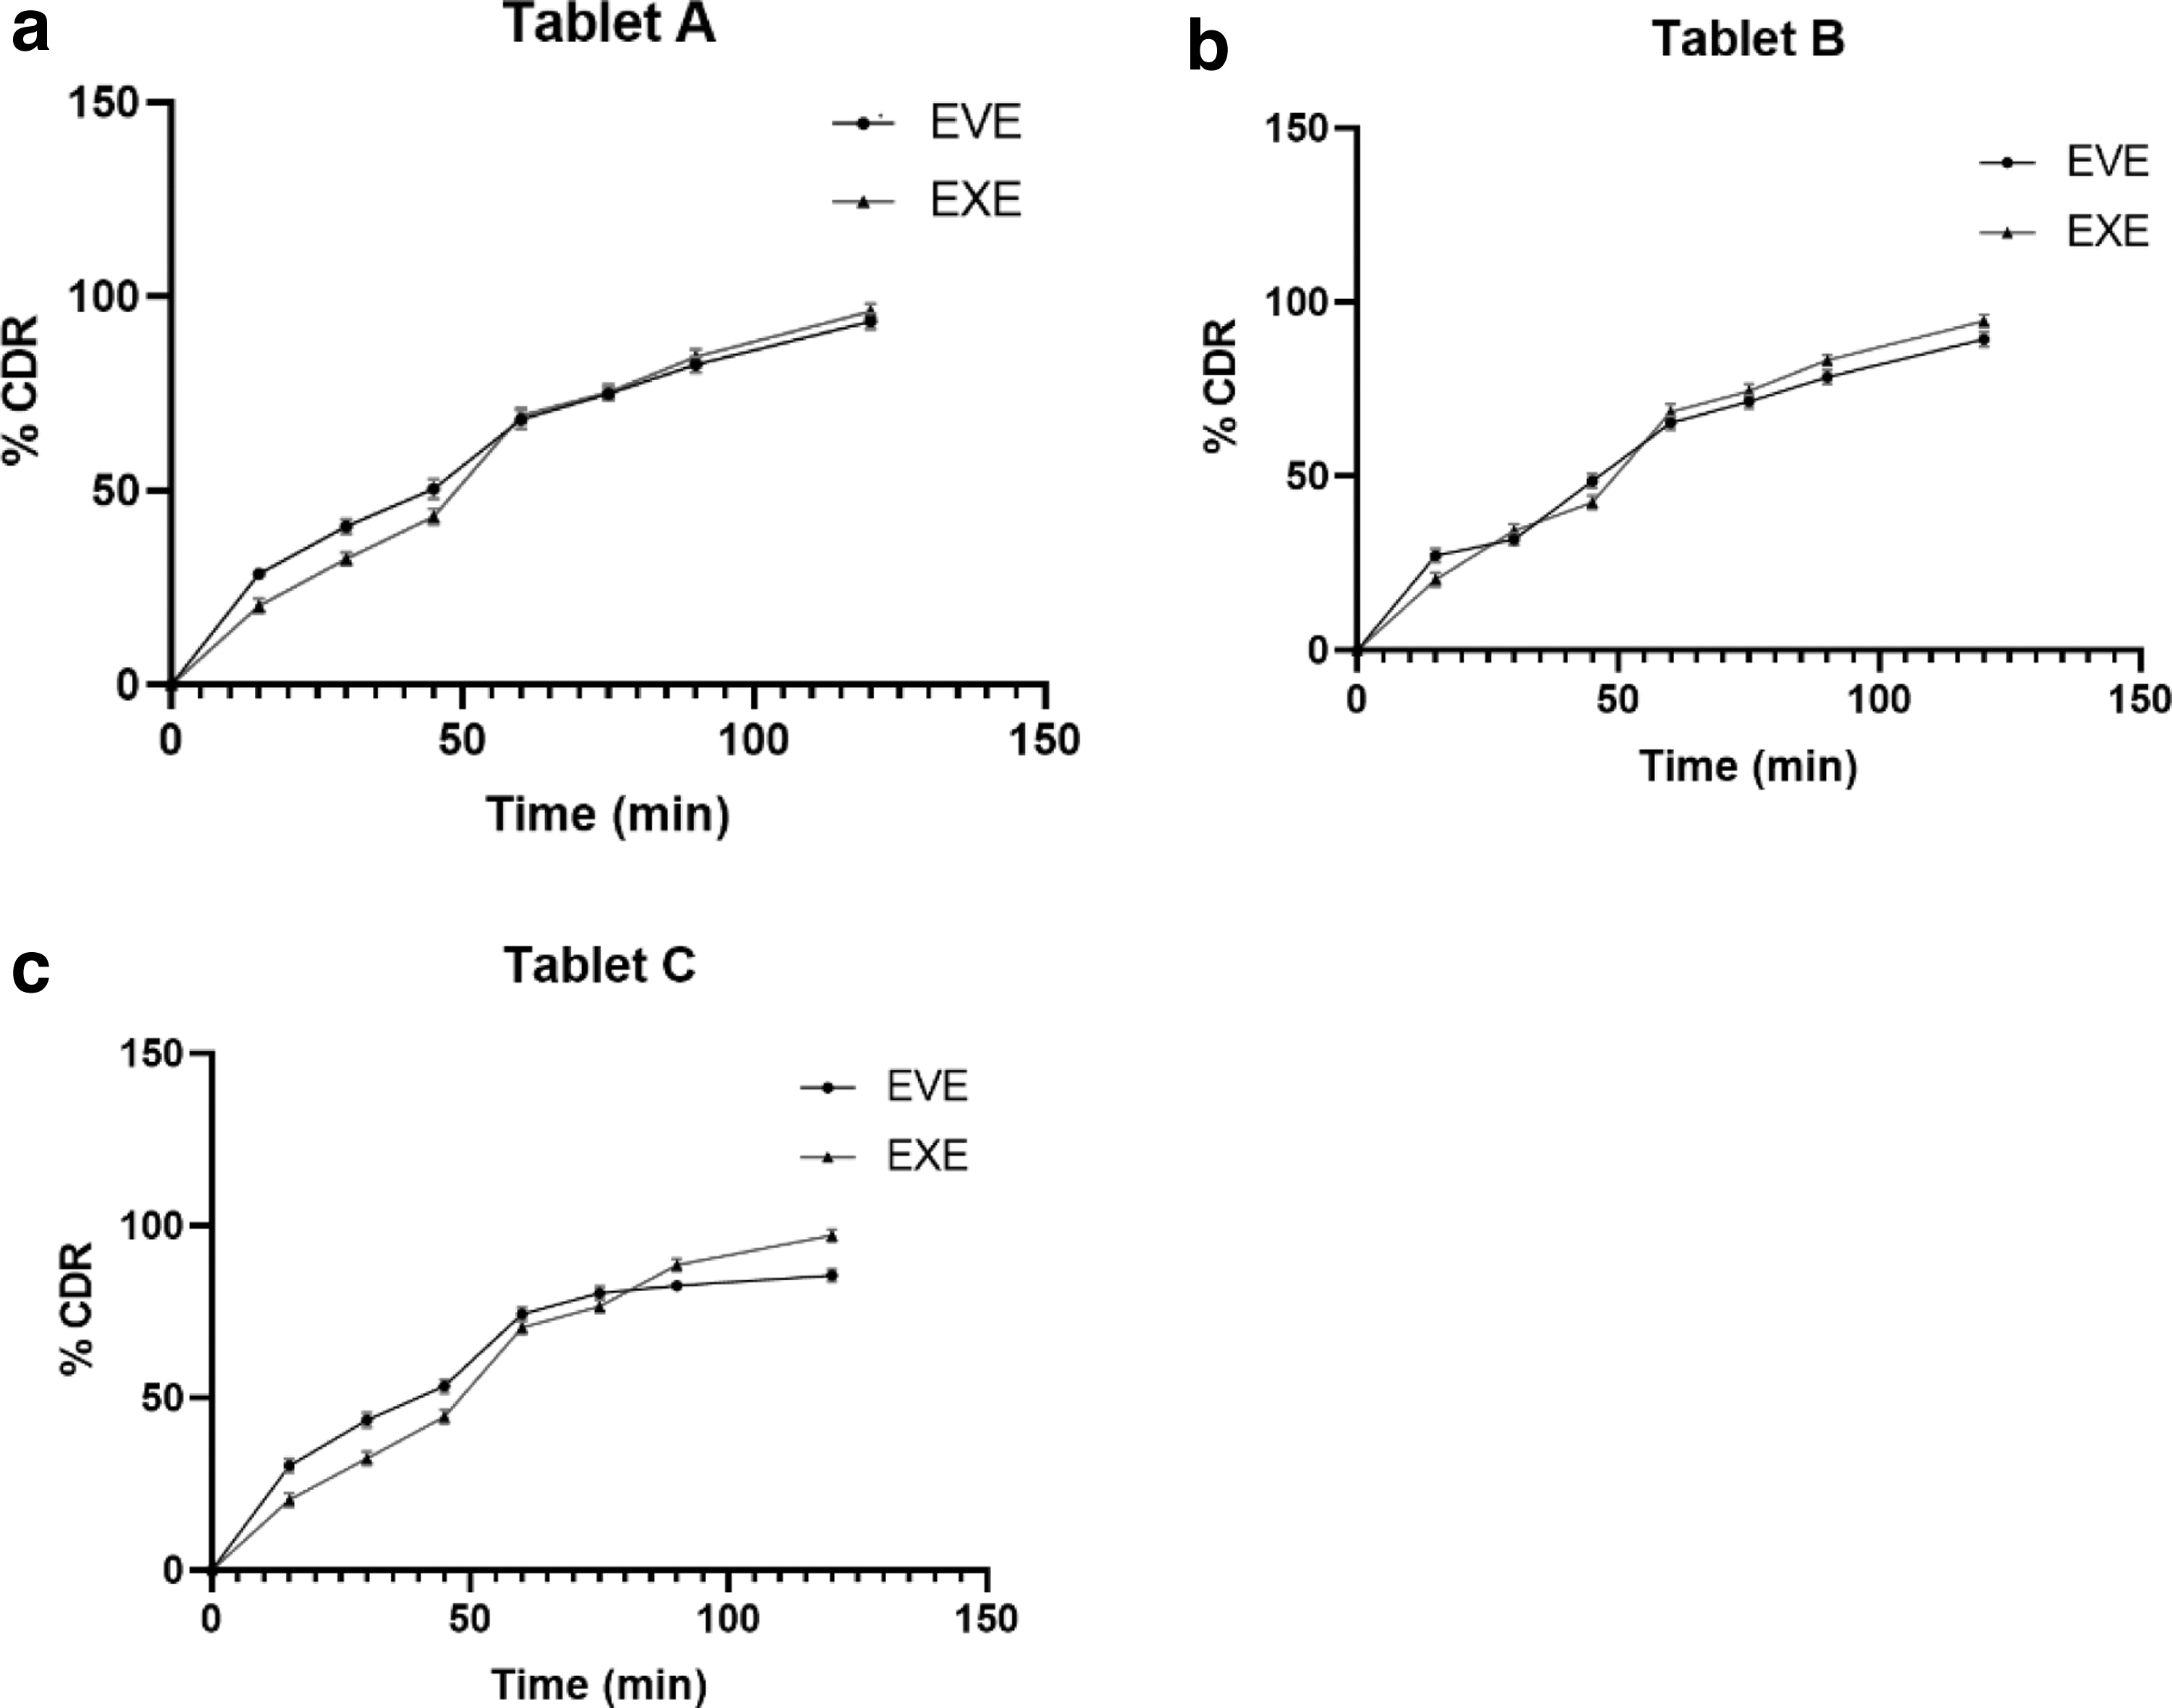
The in vitro drug release of three immediate-release tablets (OB1) in PBS 6.8 pH was evaluated using a USP dissolution apparatus type II (paddle method). The tablets were placed in 900 mL of buffer at 37°C ± 0.5°C and rotated at 50 rpm. The concentration of EVE and EXE in the dissolution medium was monitored at predetermined time intervals by the developed spectrophotometric method.
The results showed that all three tablets released the drug in a controlled manner. The release profiles were similar for all tablets, with most drugs being released within 2 h. The mean release percentages for the three tablets were 93.59%, 89.25%, and 85.56% for EVE and 96.23%, 94.61%, and 97.18% for EXE of tablets A, B, and C, respectively, as shown in Figure 7a–c. These results suggest that the three tablets are suitable for oral administration. It ensures that the EVE and EXE are released constantly, essential for maintaining therapeutic levels in the body.
In vitro release of
CONCLUSION
In conclusion, an analytical method for simultaneous estimation of EVE and EXE was developed using a validated UV-Visible spectrophotometric method. The method was linear over the concentration range of 5–35 and 5–30 μg/mL for EVE and EXE, respectively, with good precision and accuracy, as per ICH Q2 guidelines. The tablet formulation by the direct compression method was successfully developed using a factorial design (32).
The factorial design allowed for the optimization (Derringer Desirability Approach) of independent variables, microcrystalline cellulose (X1), sodium starch glycolate (X2), and beta-cyclodextrin (X3). It produced tablets with good physical properties, such as hardness (Y1), friability (Y2), disintegration time (Y3), and dissolution.
The method was successfully applied to the analysis of tablets containing EVE and EXE, and the results showed that the tablets were well formulated and that the drug content (assay) was within the specified USP (United States Pharmacopeia) limits (98%–102%). In addition, the tablets were evaluated for their in vitro dissolution profiles of OB1, and mean drug release in 2 h was 89.47% and 96.00% for EVE and EXE, respectively.
These results suggest that the combination of EVE and EXE in a tablet is a promising new treatment option for breast cancer patients, which provides improved patient compliance, lowered costs, and reduced side effects.
Footnotes
AUTHORs' CONTRIBUTIONS
D.S. conceptualized the idea and prepared the Table of Contents for the same. A.K., B.D.K., and D.S. have done the data collection and prepared the first draft. D.S., A.K., and B.D.K. reframed the draft for final approval.
DISCLOSURE STATEMENT
No competing financial interests exist.
FUNDING INFORMATION
No funding was received for this article.
SUPPLEMENTARY MATERIAL
Supplementary Table S1
Supplementary Table S2