
Abstract
Abstract
The potential for chemicals to affect endocrine signaling is commonly evaluated via in vitro receptor binding and gene activation, but these assays, especially antagonism assays, have potential artifacts that must be addressed for accurate interpretation. Results are presented from screening 94 chemicals from 54 chemical groups for estrogen receptor (ER) activation in a competitive rainbow trout ER (rtER) binding assay and a trout liver slice vitellogenin mRNA expression assay. Results from true competitive agonists and antagonists, and inactive chemicals with little or no indication of ER binding or gene activation were easily interpreted. However, results for numerous industrial chemicals were more challenging to interpret, including chemicals with (1) apparent competitive binding curves but no gene activation, (2) apparent binding and gene inhibition with evidence of either cytotoxicity or changes in assay media pH, (3) apparent binding but noncompetitive gene inhibition of unknown cause, or (4) no rtER binding and gene inhibition not due to competitive ER interaction but due to toxicity, pH change, or some unknown cause. The use of endpoints such as toxicity, pH, precipitate formation, and determination of inhibitor dissociation constants (Ki) for interpreting the results of antagonism and binding assays for diverse chemicals is presented. Of the 94 chemicals tested for antagonism only two, tamoxifen and ICI-182,780, were found to be true competitive antagonists. This report highlights the use of two different concentrations of estradiol tested in combination with graded concentrations of test chemical to provide the confirmatory evidence to distinguish true competitive antagonism from apparent antagonism.
Introduction
R
Competitive binding assays are commonly used to identify chemicals that can directly interact with hormone receptors and potentially modulate normal endocrine hormone signaling. These assays, in combination with cell or tissue culture-based assays to determine whether the chemical–receptor interaction leads to induction of a response (agonism), or reduction of a response (antagonism), provide confirmation of the chemicals' receptor-mediated activity. Accurate interpretation of the data from these assays is essential for subsequent decisions regarding prioritization of these chemicals for further testing. When analyzing the results of in vitro assays, there are several factors that could compromise or affect interpretation of the data. A number of these have been reported previously, such as time in assay, method of chemical addition, and cross contamination or “chemical creep,” among others. 1 These are concerns common to the development of any in vitro assay.
In general, interpretation of agonist type responses is relatively simple. For these assays, agonism is identified by the increase in a reporter gene or endogenous response endpoint of the receptor-mediated pathway. Assessment of agonist activity of a chemical is relatively straightforward because a series of coordinated cellular events must take place following ligand binding to the receptor, for the gene of interest to be expressed or protein to be made. This assumes there is no potential for direct chemical interference with the assay output to give a false-positive response, as could occur, for example, with fluorescent-based reporters and fluorescent test chemicals. A lack of response in a receptor-mediated assay indicates that the system is not being activated; presumably because the ligand is not binding to the receptor. This also assumes that there is no background toxicity or interference due to the chemical that is limiting the response of the biological system.
Receptor-mediated antagonism, however, is potentially more difficult to interpret because nonreceptor-mediated chemical effects could impact any of the series of cellular events necessary for gene expression. For example, a loss of cell viability or transcriptional viability would produce the same reduced mRNA expression endpoint as receptor-mediated antagonism. Identification of antagonism is usually conducted by testing the ability of a chemical to inhibit or reduce the response of the assay when stimulated with a single concentration of model agonist that will produce a near-maximal or submaximal response. Antagonism is then identified by a test chemical concentration-dependent decrease in activity when the assay system is stimulated by this level of agonist. Because the antagonism assay is designed to measure a decrease in signal, there are several potential confounding factors that can obscure the true response of the system and cause the signal to decrease by mechanisms not directly related to a competitive interaction between agonist chemical or endogenous hormone and a test chemical. 2
In the present study, the problem of how to detect true competitive estrogen receptor (ER) antagonism from other mechanisms leading to reduced response in an ER-mediated gene expression assay was addressed. Rainbow trout-based ER (rtER) competitive binding and precision cut liver slice Vtg mRNA expression assays were used as optimized to avoid misidentification of potentially active chemicals by testing chemicals up to the solubility limit of the chemical. 3 We demonstrate how factors inherent in the properties of test chemicals or the assay system itself can result in misleading antagonism-like response curves.
Limitations of antagonism assays where chemicals were tested in combination with only one concentration of 17β-estradiol (E2) are evaluated and contrasted to chemical dose–responses with two inducing concentrations of E2. Similarity in responses in rtER binding and Vtg mRNA expression assays in antagonism mode was used to sort the 94 chemicals into nine response categories. This type of information, along with additional data, is applicable to defining effects-based chemical categories to build an ER expert system (ERES) for predicting ER binding potential for large numbers of structurally diverse chemicals.4,5
Materials and Methods
Fish
Immature Erwin strain rainbow trout (Oncorhynchus mykiss), used for hepatic cytosol ER preparation and production of liver slices, were received from the US Geological Survey, Upper Midwest Environmental Science Center (LaCrosse, WI) and maintained at the US EPA in Duluth, MN, as previously described. 3
Chemicals
The 94 chemicals tested for antagonist activity along with the acronyms used to identify the chemicals, their Chemical Abstract Services Registry Number (CASRN), source, and purity are listed in Table 1. These chemicals are a subset of those tested in the development of the ERES, in which chemicals were assigned to effects-based chemical categories based on structural similarity and activity in trout ER competitive binding and ER-dependent trout liver slice assays. 5 These chemicals were selected for testing for antagonist activity for a number of reasons, including (1) they showed displacement in the binding assay but no agonist activity, and there was no information on antagonism for other chemicals in the ERES chemical category to which the chemicals were preliminarily assigned, (2) to verify activity when there were published data indicating they were ER antagonists, or (3) the chemical was selected as a representative of its ERES chemical category, and therefore, both ER-mediated agonist and antagonist activities were determined.
Figure location in article showing the response of this chemical as an example.
SA, Sigma Aldrich (St. Louis, MO); TCI, Tokyo Chemical Industry (Portland, OR); AA, Alfa Aesar (Lancashire, United Kingdom); TOC, Tocris Bioscience (Bristol, United Kingdom); IFC, Ivy Fine Chemicals (Cherry Hill, NJ); CG, Chemos GmbH & Co. KG (Regenstauf, Germany); D, Dow Chemical Co. (Midland, MI); CS, Chem Service, Inc. (West Chester, PA); MFG, MFG Chemical, Inc. (Dalton, GA); A, Acros Organics (Geel, Belgium); S, SynQuest Laboratories, Inc. (Alachua, FL); M, MatrixChemical, Inc. (Plano, TX).
Chemical purity% as reported by supplier.
CASRN, Chemical Abstract Services Registry Number; NR, not reported.
Chemicals were tested at concentrations up to those at which an effect was observed, toxicity was noted, or the apparent solubility in assay media was exceeded based on indication of precipitation by visual inspection or as detected by nephelometry (Nepheloskan Ascent; Thermo Electron Corp., Vantaa, Finland). The physiochemical property calculator SPARC (ARChem, Danielsville, GA) was used to calculate pKa values of selected chemicals.
ER binding assay
Hepatic cytosolic rtER were prepared and used in competitive binding assays measuring displacement of [3H]-E2 as previously described. 3 Each test chemical was assayed in at least two separate cytosol preparations.
Rainbow trout liver slice Vtg mRNA expression assay: agonism and antagonism
Precision cut liver slices from immature male rainbow trout were exposed to test chemicals for 48 hours at 11°C in a multiwell plate system and assayed for expression of Vtg mRNA as previously described using quantitative real-time RT-PCR technology.3,6
Chemical stocks prepared in ethanol were diluted to appropriate test concentrations in phenol red-free L-15 media (Gibco, Life Technologies, Grand Island, NY) containing 10% fetal bovine serum and penicillin (100 U/mL)/streptomycin (100 μg/mL; Sigma Aldrich, Columbia, MO). A test for agonist activity included exposure of individual liver slices to E2 at six concentrations with two replicates per concentration to produce a reference dose–response curve. Ethanol solvent controls and six graded concentrations of test chemicals with five replicate slices per concentration were used to determine activity of the chemical. A minimum of two agonist tests were performed on each chemical. If a test chemical lacked agonist activity, it was further tested at least once for antagonist activity.
The antagonist test in single E2 concentration mode was run with parallel ethanol solvent controls, E2-positive controls, and cotreatment with graded concentrations of test chemical with a concentration of E2 that on its own would be predicted to give a submaximal Vtg mRNA expression response (i.e., typically −9 log M E2). In the antagonist test mode using two E2 concentrations, a submaximal E2 concentration (i.e., typically −9 log M E2) and an E2 concentration predicted to produce maximal Vtg mRNA expression (i.e., typically −6 log M E2) were used.
Assay media conditions and liver slice viability
To address potential factors that could affect this assay response, media conditions, including pH and osmolality, were monitored using a Radiometer Blood Gas Analyzer ABL800 Flex (Radiometer Medical, Copenhagen, Denmark). Precipitation or chemical insolubility in the slice media was determined by both visual inspection and detection of light scatter with a nephelometer. Slice viability was routinely determined by measuring leakage of lactate dehydrogenase enzyme (LDH) from the liver slices into the media. The activity of LDH in the media was measured following the 48-hour incubation and compared with total slice LDH activity in the slices at 0 hour as previously described.6,7 The mitochondrial dehydrogenase assay using 3-[4,5-dimethylthiazol-2-yl]-2,5-diphenyl tetrazolium bromide (MTT) as substrate was also used to assess cytotoxicity in the liver slices with a few selected chemicals. 8
Data analysis
GraphPad Prism version 5.02 for Windows (GraphPad Software, San Diego, CA) was used for curve fitting and statistical analysis. Competitive binding curves were generated and IC50 values determined using nonlinear regression curve fit and the one-site competitor equation. Vtg mRNA expression produced by chemical tested in agonist mode was compared to that of solvent control. Chemical antagonism of E2-induced Vtg mRNA expression was determined by comparison to the level of Vtg mRNA produced by the corresponding E2 concentration on its own. ANOVA with Dunnett's multiple comparison test and two-tailed t-tests were used to determine significant responses in the slice assay. When Vtg mRNA responses had unequal variances, the data were analyzed by the Kruskal–Wallis test and differences between treatment group and controls determined by Dunn's post hoc test.
Antagonism assay data interpretation
A hypothetical E2 response curve is shown in Figure 1A. Two hypothetical outcomes for chemicals tested for ER antagonism with two of the E2 concentrations selected from the E2 dose–response curve are shown in Figure 1B and C. In Figure 1B, seven concentrations of test chemical “X” from −9 to −3 log M were used in cotreatment with a low E2 (−9 log M) or with high E2 (−7 log M) concentration. Inhibition of the ER-mediated Vtg mRNA expression requires higher concentrations of chemical “X” to successfully compete with a higher E2 concentration (−7 log M) at the ER and antagonize the response; therefore, the antagonism curve for chemical “X” with high E2 is shifted to the right compared to the curve produced with chemical “X” and low E2 (−9 log M). The shift in the curve is two log units, which is equal to the difference in concentration of the agonist used (−7 and −9 log M E2). Thus, competitive antagonism of the ER should produce characteristic response curves that are shifted when two different concentrations of E2 are tested in combination with graded concentrations of test chemical.

Curves depicting theoretical outcomes from ER-mediated Vtg mRNA expression assay conducted in antagonist mode showing test chemical concentration–response in the presence of a low or a high E2 agonist concentration.
If the inhibition of ER-mediated Vtg mRNA expression is not due to true ER antagonism, there will not be a shift in the antagonism curves equivalent to the difference in the E2 concentrations. In Figure 1C, the inhibition of the estrogenic response occurs at the same concentration of chemical “Y,” irrespective of the concentration of the coadministered E2. In this example, the loss in Vtg mRNA expression signal is not likely due to competitive displacement of E2 from the ER, because it is independent of E2 concentration.
Results
An analysis of the cytosol rtER competitive binding and Vtg mRNA expression assay results for the 94 diverse chemicals revealed different types of response outcomes in these paired assays. The response types fell within nine groupings, as shown in Table 1. Binding and Vtg mRNA expression results for representative chemicals demonstrating the response types of each group are presented below. Results for the chemicals listed in Table 1, not included in the examples presented below, are available in Supplementary Data (Supplementary Data are available at www.liebertpub.com/aivt).
ER binding and Vtg mRNA expression response of true competitive antagonists
The known mammalian ER antagonists, tamoxifen (TAM) and ICI-182,780 (ICI), were used to validate the antagonism methodology. Both chemicals fully displaced [3H]-E2 from the rtER in the competitive binding assay. The slopes of the displacement curves were parallel to that of E2 indicating competition for the ER (Fig. 2A, C). Their relative potencies compared to E2 were different, with ICI exhibiting rtER affinity identical to E2, and TAM having over two orders of magnitude lower affinity. Both TAM and ICI were tested in the liver slice Vtg mRNA expression assay for antagonist responses. Figure 2B and D shows results for TAM and ICI in the antagonism assays, respectively; with each tested against two concentrations of E2.

Activity of the two known ER antagonists, TAM and ICI, in rtER competitive binding and trout liver slice Vtg mRNA expression assays.
As expected (see the Antagonism Assay Data Interpretation section), higher concentrations of TAM or ICI were needed to produce an antagonist effect when tested against the higher E2 coexposure concentration. For example, when graded concentrations of TAM were tested with −9 log M E2, a significant decrease in Vtg mRNA expression in the slices occurred at −7 log M TAM, dropping to near background levels at −6, −5, and −4 log M TAM. However, when TAM was tested in the presence of −5 log M E2, significant antagonism of the E2-induced Vtg expression did not occur until TAM concentration reached −4 log M or higher (Fig. 2B). Comparison of Figure 2B and D also shows that the further apart the high and low E2 concentrations are in the antagonism assays, the easier it is to discern the shift in the antagonism curves expected with true ER antagonism.
If instead, the significant decrease in Vtg expression occurred at the same TAM or ICI concentration for both −9 and −5 log M E2 coexposures, then true receptor antagonism would not be indicated (as example in Fig. 1C). Of the 94 chemicals tested in Table 1 for antagonism only, TAM and ICI were found to be true competitive antagonists. Dual binding and gene activation assay response types that do not fit the profile of true antagonism with additional parameter measurements used in interpreting assay results are presented below.
Response of true ER nonbinders
4-Diethylamino-azobenzene (DAA) provides an example of a negative chemical in both the cytosol rtER binding (Fig. 3A) and Vtg mRNA assays (Fig. 3B). Similar chemicals falling into the B.1 and B.2 response groups in Table 1 produced no displacement or less than 50% displacement of [3H]-E2 from the ER in the binding assay, and no induction or inhibition of Vtg mRNA expression in the slice assay run in agonism and antagonism modes. Thirty-seven of the 94 chemicals tested fell into this dual assay response category.

Activity of DAA in cytosol competitive binding and liver slice Vtg mRNA expression assays.
These 37 chemicals represent significant structural diversity as members of a wide variety of chemical classes from all 8 of the ERES primary model nodes, 5 including acyclics, chemicals with multiple cyclic rings, charged chemicals, neutrals, and a wide range of log Kow values from −6.7 to 8.2 (Table 2). Of these 37 chemicals, 26 produced 0%–20% displacement in the liver cytosolic receptor binding assay with the other 11 chemicals producing only 20%–50% displacement (Table 1. groups B.1 and B.2). These chemicals also showed no indication of cytotoxicity in the slices as measured by LDH, and no significant change to the media pH (data not shown).
ERES nodes as described in Schmieder et al. 5
Chemical names for these acronyms can be found in Table 1.
These activity groups are defined in this article and can be found in Table 1.
RBA is the relative binding affinity calculated as 100 × (IC50 E2/IC50 chemical).
ERES, ER expert system; rtER, rainbow trout estrogen receptor.
False-positive binding with no effect on gene expression
Twelve of the 94 chemicals tested in the paired assays produced seemingly contradictory results in that they produced complete or near complete displacement in the cytosolic rtER binding assay, but no agonist or antagonist activity in the Vtg mRNA assay (Table 1, group C.1). In the case of tetrabromophenol blue (BPB), the apparent displacement occurred at concentrations in which a precipitate was observed, which may have interfered with ER binding assay (Fig. 4). When the concentrations at which precipitates were noted are excluded, then only 55% displacement was achieved. This along with the lack of agonist or antagonist activity leads to the conclusion that BPB does not bind to the rtER. Precipitate formation in the cytosol is a possible explanation for the displacement seen in the cytosolic rtER binding assay for 5 chemicals (BPB, FPB, 5ClEth, ECD, and 43CLN) of the 12 in this group (see Supplementary Data).

Activity of BPB in cytosol competitive binding and liver slice Vtg mRNA expression assays.
In other cases of binding displacement without altered Vtg mRNA expression, if no precipitation occurred to explain the apparent binding, then further binding experiments were carried out to determine the Ki to verify if displacement was due to competitive binding. For example, N-(3-carboxy-1-oxo-3-sulfopropyl)-N-octadecyl-DL-aspartic acid (AER) fully displaced [3H]-E2 from the receptor (Fig. 5A) but gave no indication of activation or inhibition of Vtg mRNA expression. This suggested either a false-positive binding result or AER was metabolically inactivated in the slice (Fig. 5B). If the Ki determination assay confirmed competitive binding to the ER, this might suggest that the chemical is metabolically inactivated in the slice to a metabolite that does not bind to the ER. Further analysis of binding to determine the Ki indicated that AER was not a competitive binder (Fig. 5C), and the lack of Vtg mRNA response in the slice assay was not due to toxicity as determined by the LDH leakage assay (Fig. 5D). Therefore, AER is classified as a nonbinder.

Activity of AER in cytosol competitive binding and liver slice Vtg mRNA expression assays.
AER along with three other structurally similar chemicals (DBS, SOS, and DSS; see Supplementary Data) would contain a net charge at assay pH and temperature based on their calculated pKa (0.30, 0.83, and 0.0 at 11°C for DBS, SOS, and DSS, respectively). As charged chemicals, they can noncompetitively disrupt the normal E2-ER interaction resulting in the displacement of [3H]-E2 from the receptor. For three other chemicals in this group (octyl-beta-d-glucopyranoside, 1-decanol, and alpha-terpineol) that produced apparent binding with no changes in Vtg mRNA expression, the very steep binding curves suggest that something other than competitive binding was responsible for displacement of [3H]-E2 from the receptor.
Inhibition of gene expression due to toxicity
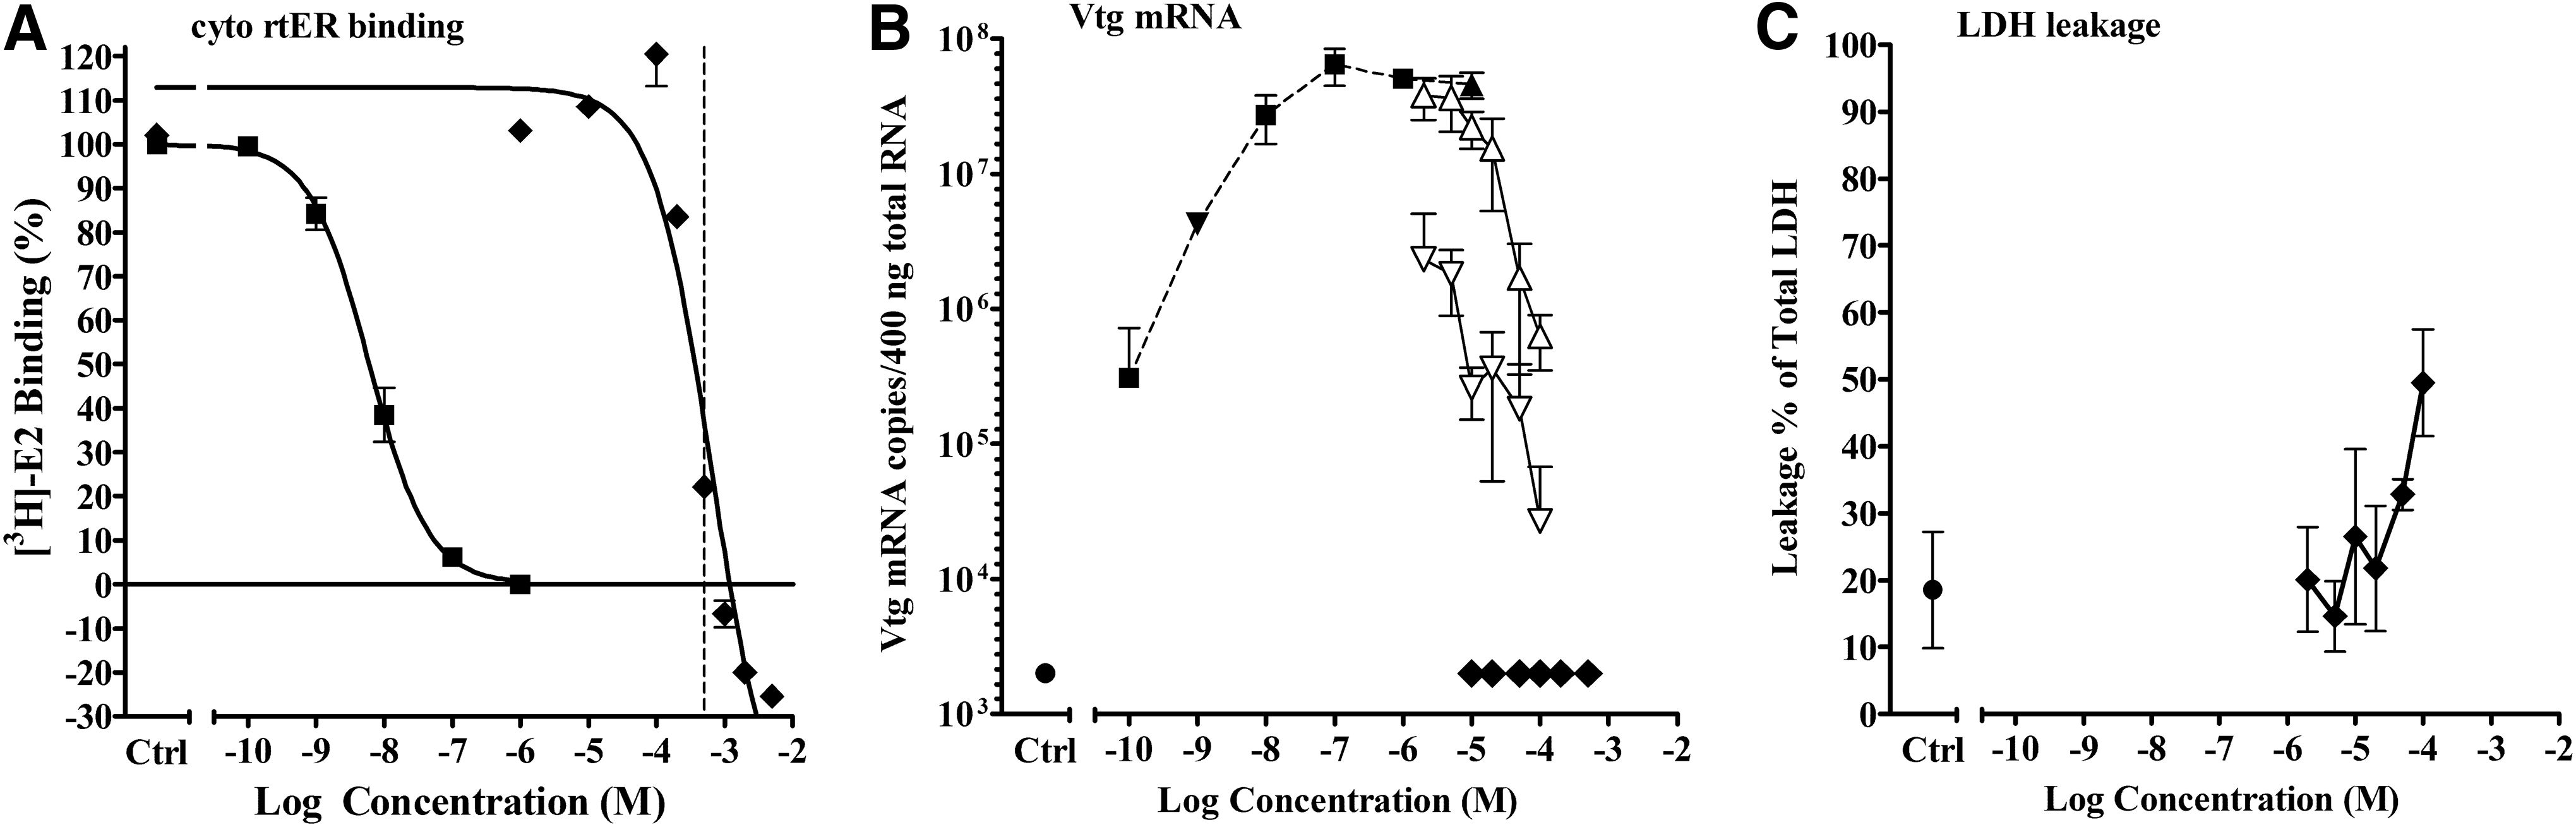
Chemical-induced cytotoxicity resulted in the inhibition of Vtg mRNA expression in the liver slices for 18 of the 94 chemicals tested in the antagonist mode. Within this group, there were seven chemicals that exhibited minor to full displacement in the cytosolic rtER binding assay (Table 1, group C.2) and the other 11 showed no displacement (Table 1, group D.1). For some of these chemicals, an antagonist test using a single E2 concentration was sufficient to reach a conclusion regarding activity. For example, chemicals that produced little or no E2 displacement in the cytosolic rtER binding assay and inhibited E2-induced Vtg mRNA expression at a concentration of test chemical that also produced toxicity was indication that the decreased Vtg mRNA expression was due to toxicity and not true antagonism.
More often chemicals tested against a single E2 concentration in antagonist mode needed additional testing such as with the time- and reagent-intensive Ki analysis to reach a conclusion about activity. An example is octylbenzenesulfonic acid (OBS). OBS fully displaced [3H]-E2 from the receptor (Fig. 6). In the liver slice, Vtg mRNA assay it did not induce Vtg mRNA expression when tested for agonist activity, but when tested in the presence of −9 log M E2 there was apparent antagonism at −3 log M OBS. The LDH assay indicated cytotoxicity at this concentration, so the decreased Vtg mRNA expression at −3 log M OBS in the presence of −9 log M E2 was likely due to toxicity in the slices and not competitive antagonism by OBS. To verify this conclusion, OBS was tested to determine the Ki. The results indicated that OBS did not competitively bind to the trout ER (Fig. 6C). OBS is also an example of a charged chemical at the assay pH, similar to AER presented above.

Activity of OBS in cytosol competitive binding and liver slice Vtg mRNA expression assays.
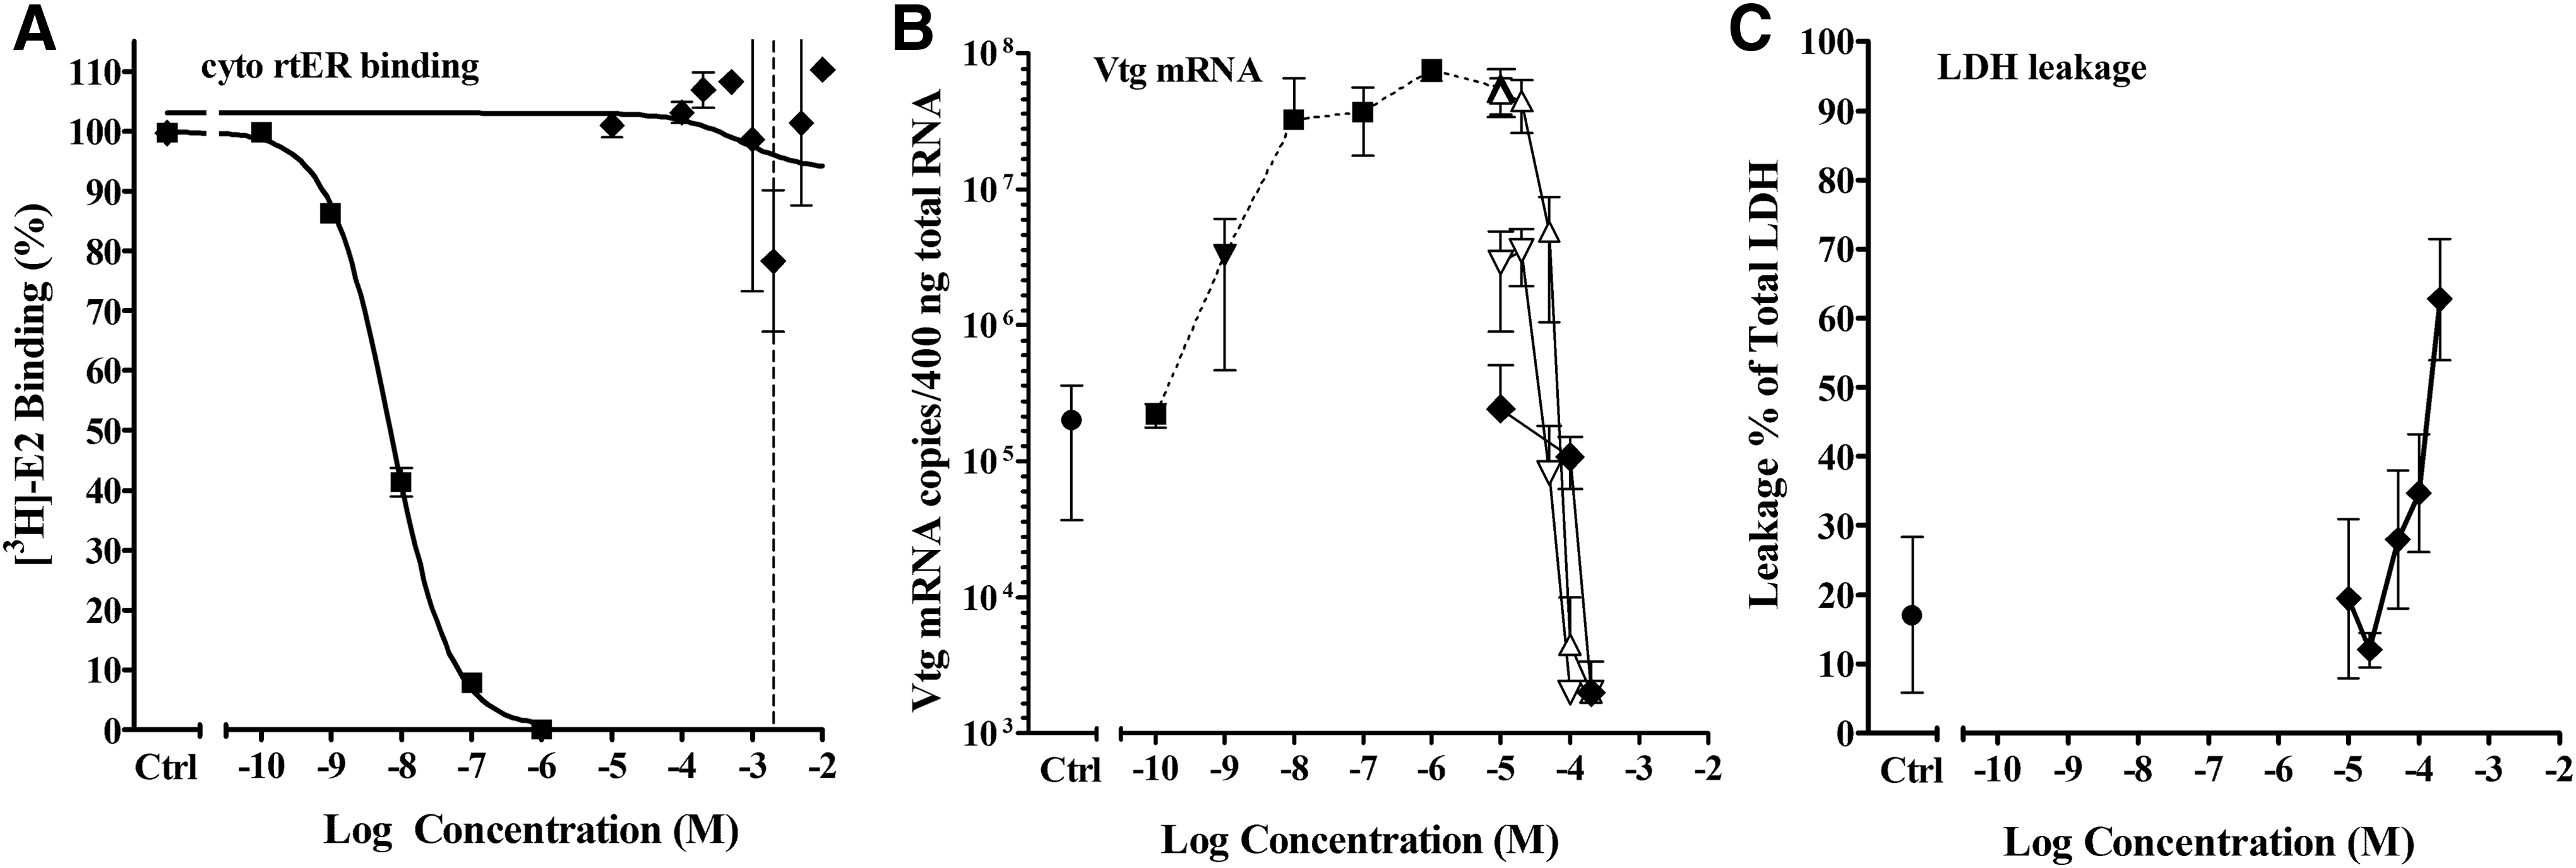
It became apparent that using two concentrations of E2 in the antagonist experiments was an effective and efficient tool for confirming true competitive antagonism from other processes that inhibited Vtg mRNA expression. For example, chlorhexidine diacetate salt (CDS) produced supramaximal displacement curves in the cytosolic rtER binding assay, however, the four highest concentrations caused a visible precipitate to form in the ER binding assay cytosol/buffer mix (Fig. 7A). CDS produced no agonist activity in the liver slice Vtg mRNA induction assay when tested alone, but did inhibit gene expression when tested in the antagonist mode. Significant inhibition of the Vtg mRNA response occurred with the four highest CDS concentrations when coexposed to either −9 or −5 log M E2; therefore, the inhibition was not due to an E2-dependent mechanism. Significant toxicity was observed at the two highest concentrations of CDS tested in the antagonist mode. It was concluded that CDS was not competitively binding to the rtER because the displacement observed in the binding assay was the result of precipitation, and the inhibition in the antagonist assay was likely due to cytotoxicity.
Activity of CDS in cytosol competitive binding and liver slice Vtg mRNA expression assays.
Of the seven chemicals that had complete binding curves and produced toxicity in the liver slice Vtg mRNA assay, two (HOI and EAD) showed precipitation in the binding assay at concentrations that caused displacement, three (OBS, DBS, and ODA) were charged chemicals, and for PAS and DiPrP the cause of apparent binding was unknown (see Supplementary Data).
Another example of a seemingly conflicting result was that of diiodomethyl-p- tolylsulfone (DTS), which had very little to no displacement in the binding assay, but reduced Vtg mRNA expression in the slice assay (Fig. 8). The inhibition of Vtg expression was independent of the E2 concentration and solely dependent on the DTS concentration, indicating that the apparent inhibition was not an ER-mediated mechanism (Fig. 8B). Measurement of LDH leakage from the slices revealed toxicity at the same concentration at which Vtg expression was reduced; therefore, the inhibition of gene expression was not ER antagonism, but more likely due to cytotoxicity or other DTS-related effects. DTS and 10 other chemicals had this response profile (Table 1, group D.1). Three chemicals (BHP, BCY, and EAD) showed no indication of toxicity measured by the LDH assay but were found to be toxic using the MTT assay with liver slices from the same experiments (see Supplementary Data).
Activity of DTS in cytosol competitive binding and liver slice Vtg mRNA expression assays.
Test chemical-mediated pH changes
Another assay parameter that can affect binding and gene expression is media pH. As concentration of chemical increases, the capacity of the assay medium to buffer the pH of the solution can become overwhelmed resulting in a change in the pH of the assay. To determine the acceptable pH range of the binding and vitellogenin slice assays, HCl or NaOH were added to the assays to adjust the pH. There is a fairly narrow pH range over which the ER binding and Vtg mRNA expression assays are operable. When the pH of the binding assay is outside of the pH range of pH 7–9, the [3H]-E2 begins to dissociate from the receptor (Fig. 9B). This occurs in the absence of any competing ligand. The decrease in pH also resulted in observed precipitates in the binding assay at HCl concentrations of −1.7, −2.0, and −2.3 log M (Fig. 9A). These points corresponded to pH values of 2.9, 4.6, and 6.3, respectively (Fig. 9B).

Effect of changing pH on estradiol binding to cytosolic rtER.
The expression of Vtg mRNA in the liver slices was as sensitive and perhaps even slightly more sensitive to decreased pH than the ER binding assay. Figure 10 displays how decreasing the media pH with HCl or increasing it with NaOH affects E2-responsive Vtg mRNA expression. The pH of the media used in the trout liver slice assay is normally near pH 7.6. There was a substantial decrease in Vtg mRNA expression with only a modest decrease in pH, whereas there was no decrease in signal when pH was increased to pH 8.6. Thus, a test chemical that alters the pH of the slice media to slightly more acidic pH could be interpreted falsely as antagonism due to the pH-dependent decrease in E2-induced Vtg mRNA expression. Furthermore, this demonstrates why determination of pH was critical to accurately interpret the Vtg mRNA response when antagonism was suspected.
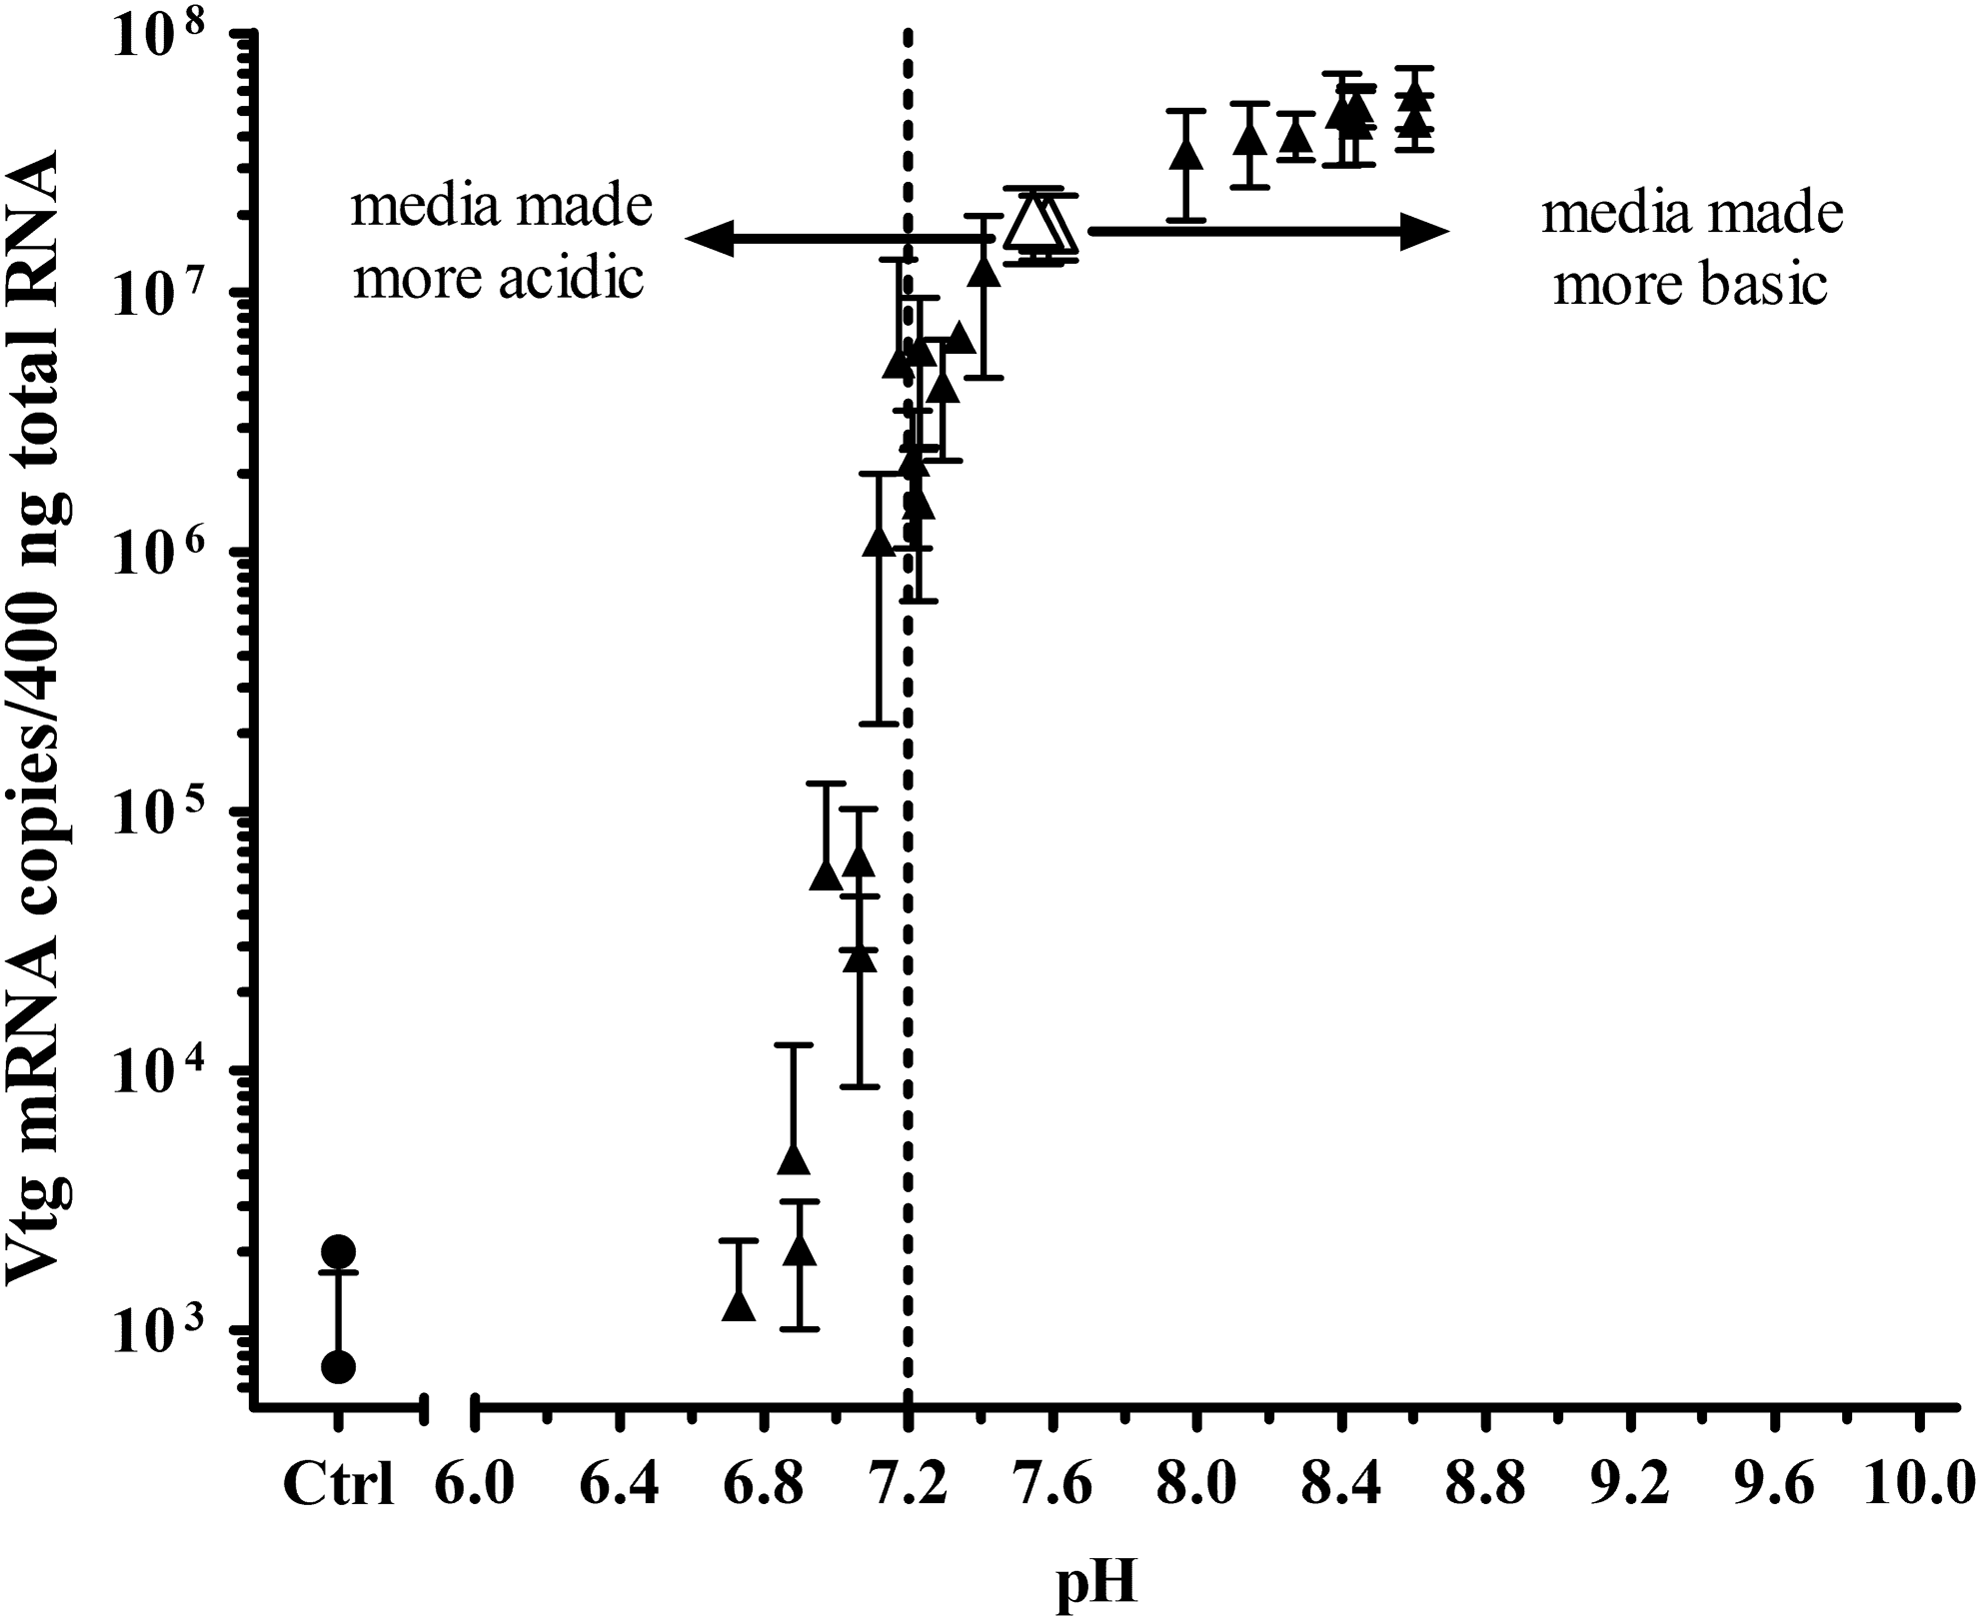
Effect of pH on Vtg mRNA expression in liver slices. Liver slices were treated for 48 hours with −6 log M E2 (1 μM) to achieve maximum Vtg mRNA induction. The responses from two separate experiments are shown. Slices were exposed to solvent control (●) at normal assay pH, or to −6 log M E2 at normal assay media pH (△), or pH adjusted with HCl or NaOH (▲).
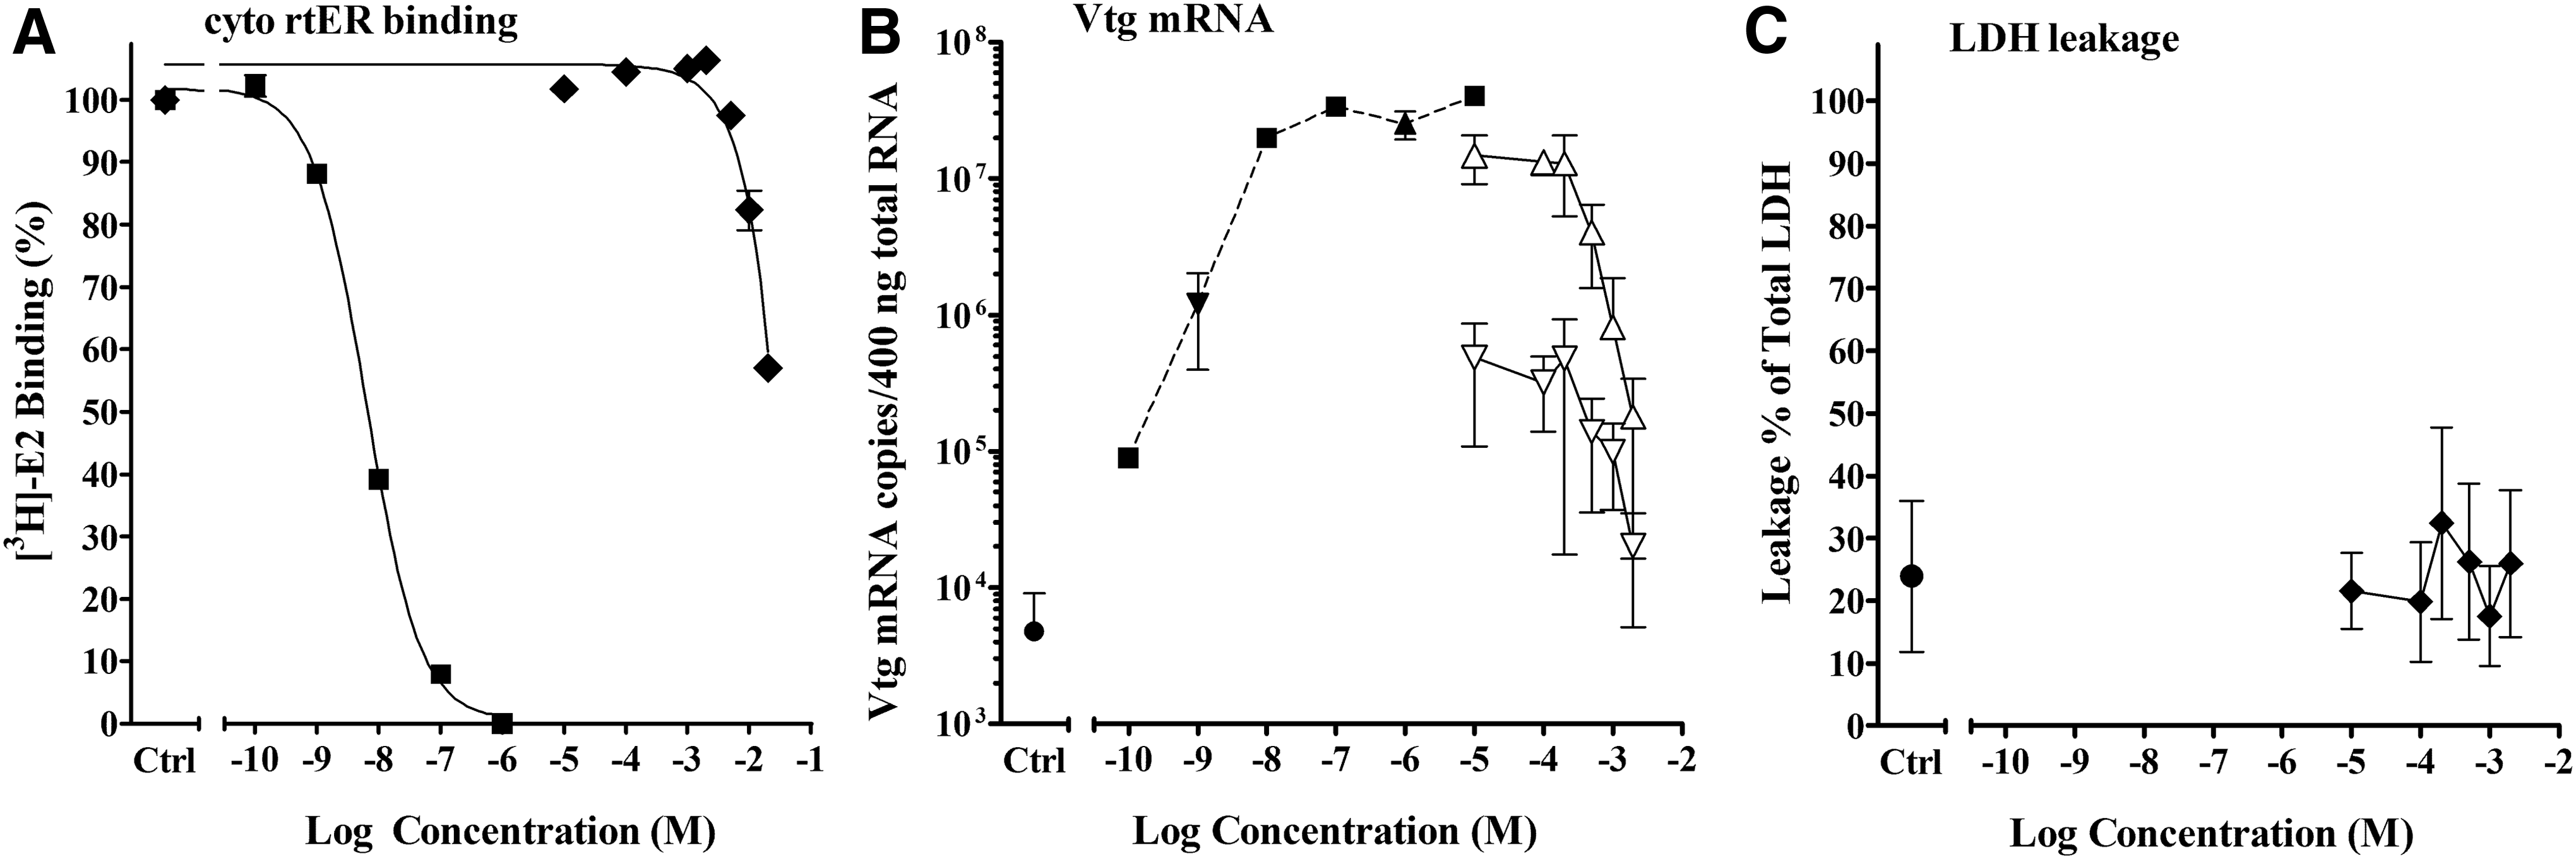
Ten of the 94 chemicals tested for antagonism were found to have significantly lowered the pH of the rtER binding and liver slice Vtg mRNA expression assays, which adversely affected assay performance (Table 1, group D.2). The apparent competitive binding curve of 2,6-pyridinedicarboxylic acid (PDC) in Figure 11A and apparent antagonism in the liver slice assay in Figure 11B would at first glance suggest that PDC was capable of interacting with the rtER to displace [3H]-E2 and antagonize the activation by E2 in the slice assay. However, measurement of the pH in binding and slice assay media indicated significant acidification when the PDC concentration approached −3 log M. These same PDC concentrations produced displacement of [3H]-E2 from the receptor in the binding assay and decreased vitellogenin mRNA induced by −8 log M E2 in the slice assay. Thus, the apparent ER binding and antagonism by PDC were artifacts of low pH and likely due to pH-associated protein denaturation or cytotoxicity.
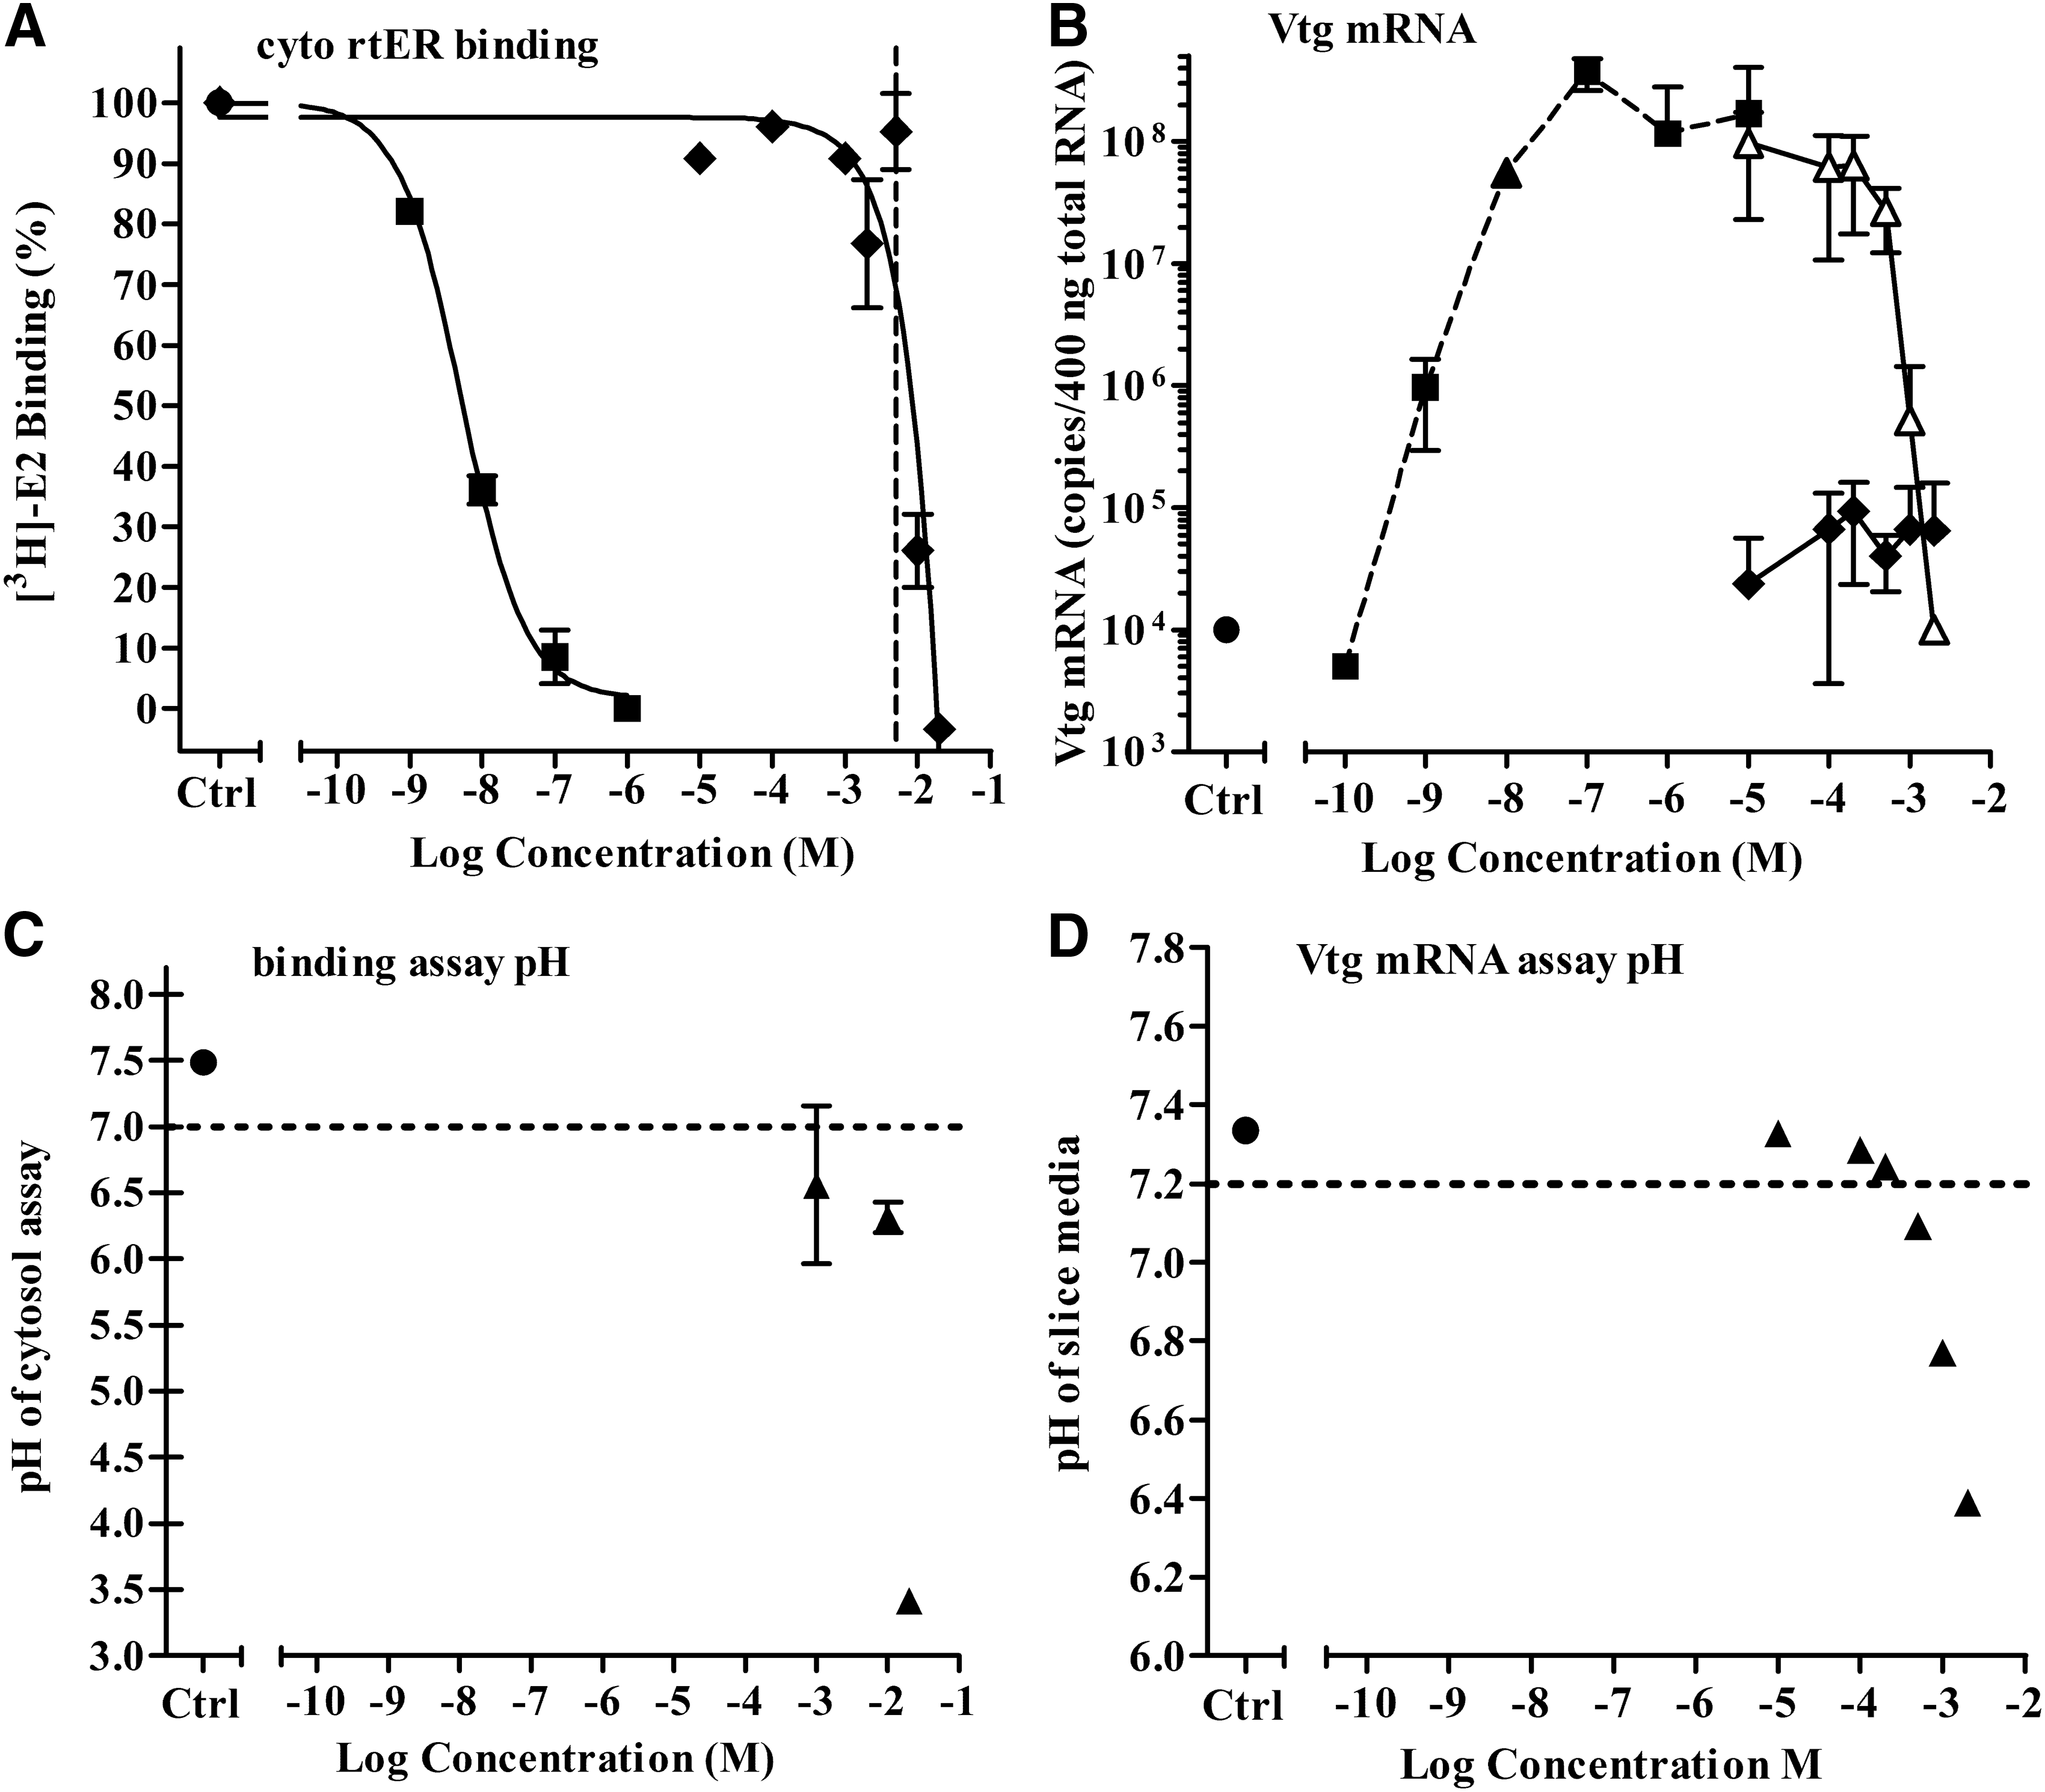
Activity of PDC in cytosol competitive binding and Vtg mRNA expression assays.
For some of the chemicals that lowered the pH of the assay, this could be anticipated because these chemicals are acids; for example, phosphoric acid diphenyl ester (PHOS), propylphosphonic acid (PPA), heptafluorobutyric acid (PFBA), and the carboxylic acid PDC described above. The calculated pKa of these chemicals at the assay temperature of 11°C provides an alert to this potential to lower the pH. The pKa of PDC is 3.92, PHOS is −0.37, PPA is 2.75, and PFBA is −0.11. The two nitrophenols that also lowered the pH, 2-methyl-4,6-dinitrophenol (MDP) and 4-nitrophenol (4NP), had pKa values of 4.52 and 6.74, respectively. At the pH of the liver slice assay, 100% of MDP and 90% of the 4NP in solution are calculated to be in ionized form. Two other chemicals in this group do not have a calculated pKa, but in aqueous solution hydrolyze to produce acids: 2,6-dimethyl-1,3-dioxan-4-ol acetate (DDA) hydrolyzes to acetic acid and the corresponding alcohol, 9 and 1,3-dichloro-5,5-dimethylhydantoin (DDH) hydrolyzes to produce hypochlorous acid. 10
Unknown reason for decrease but not true ER interaction
Fifteen of the 94 chemicals tested for antagonism against two E2 concentrations had a decrease in Vtg mRNA expression, but the decrease occurred at the same test chemical concentration regardless of the E2 concentration; therefore, the decrease in Vtg mRNA induction was likely not mediated by competitive interaction with the ER (Table 1, groups C.3 and D.3). No apparent explanation for the inhibition was determined because no precipitation was present, the media pH was within the acceptable range, and no toxicity was detected by LDH analysis. However, the use of a different cell cytotoxicity assay may have shown decreased viability (e.g., MTT) at lower concentrations than that indicated by LDH, which requires cell membrane leakage to be detected. These chemicals may have also interfered with Vtg mRNA expression via some mechanism that would not be detected by a cytotoxicity assay.
Five chemicals that produced noncompetitive Vtg mRNA inhibition exhibited apparent binding with greater than 50% displacement binding curves (Table 1, group C.3). Two of these chemicals, CNA and DBM, only produced 55% and 60% displacement, respectively, before precipitation occurring with increasing concentration. Therefore, the observed displacement may have been related to factors leading to precipitate formation. Based on the pKa of BRO, it was charged at assay pH, which likely contributed to the apparent displacement of E2 from the receptor if protein denaturation of the ER occurred. The other two chemicals in this set, DMO and pMxBA, produced 70% and 75% displacement curves, respectively, but the cause of the displacement of E2 from the ER was unclear.
Ten of the chemicals in this group had 0%–50% displacement in the binding assay (Table 1, group D.3). One of these chemicals, benzotriazole (BZOL), was found by Harris et al. to be an ER antagonist in the in vitro recombinant yeast estrogen assay using a single E2 concentration method, but they observed no antagonist activity when tested in vivo in the fathead minnow (Pimephales promelas). 11 We found BZOL to produce only 45% displacement of E2 from the cyto rtER (Fig. 12A), suggesting BZOL does not bind the rtER; but in light of the Harris et al. report we also tested BZOL in the Vtg mRNA expression assay.
Activity of BZOL in cytosol competitive binding and liver slice Vtg mRNA expression assays.
No agonist activity was observed in the trout liver slice Vtg mRNA induction assay, but a decrease in Vtg mRNA expression was observed (Fig. 12B). This inhibition occurred at the same concentrations of BZOL when tested with either −9 or −6 log M E2, and therefore, it was interpreted not to be true competitive antagonism. The media pH was within an acceptable range, no precipitation was noted in the media, and no toxicity was apparent from LDH analysis. In this case, the reason for the inhibition is unknown although it is possible that toxicity did occur but was not detected using the LDH method. Three chemicals, BHP, BCY, and EAD, had no indication of toxicity measured by the LDH assay but were found to be toxic using the MTT assay with liver slices from the same experiments.
Discussion
Relatively few chemicals have been determined to be true ER antagonists outside of pharmaceuticals or others specifically designed for this activity. The chemical features often associated with antagonism of the ER such as a structural bulky side-chain 12 suggest that the number of chemicals that would have the potential to act as antagonists would be limited. Therefore, in the course of testing a diverse group of chemicals to develop a rule-based expert system using the rtER-based competitive binding and trout liver slice Vtg mRNA induction assay, 5 it was surprising to find a relatively high proportion of chemicals that inhibited E2-induced Vtg mRNA expression.
Of the 267 chemicals tested for agonist activity in the trout liver slice assay, 94 underwent further testing for antagonist activity, and of these there were 45 that significantly decreased the E2-induced Vtg mRNA expression at one or more concentrations of test chemical. However, only two of these chemicals, the known ER antagonists TAM and ICI,13,14 produced a true competitive inhibition response in the liver slice assay and therefore were identified as antagonists. The remaining 43 chemicals (Table 1 groups C2, C3, D3, D2, D3) did not produce a true antagonist response in the liver slice assay.
Thirty-one (Table 1; groups D1, D2, D3) of these 43 that inhibited Vtg mRNA expression produced no binding activity in the cytosol rtER binding assay, which provided strong evidence that the decreased Vtg mRNA induction was not due to competition between parent chemical and E2 for binding to the ER. For seven (Table 1; group C2) of the remaining 12 chemicals that did produce ER binding displacement curves, inhibition of Vtg mRNA expression was associated with toxicity, and three of these chemicals had an ionic charge at assay pH. Of the 94 chemicals tested for antagonism, there were 7 classified as “Ionic acyclics” from Node I of the ERES and 10 classified as “Belongs to known charged group” from Node II (Table 2). None of these bound ER, supporting the hypothesis that ionic properties of chemicals can be incompatable with ER binding and activation.
For the remaining five chemicals that exhibited some binding displacement and inhibition of E2-induced Vtg mRNA expression, the decreased Vtg expression occurred at the same concentration(s) of test chemical regardless of the concentration of E2 used in the assay. This again indicated that the inhibition of E2-induced Vtg mRNA expression was not true competitive antagonism. However, unlike the seven chemicals previously mentioned, the decreased gene expression for these five chemicals was unexplained because it was not associated with other factors such as precipitate formation, an unacceptable shift in pH, or LDH leakage from the liver slice indicative of cytotoxicity. Thus, in our assessment of this relatively large set of structurally diverse chemicals, the only two that could be confidently considered as true ER antagonists were TAM and ICI, suggesting that true competitive antagonism of the rtER is uncommon.
Making a positive identification of a true loss of signal response, whether from a competitive binding assay, enzyme inhibition assay, or antagonism assay, can be supported by additional assays to rule out nonreceptor-mediated activities that would result in a decrease in signal. For example, a determination of Ki when conducing competitive binding assays does provide verification of competitive binding activity where it is in question, 15 but it is a very intensive exercise in both the amount of receptor consumed and the time required. Assessing parameters such as changes in pH or observations of precipitation can provide information that eliminates the need for Ki determinations. Although in some cases as shown above for AER, when potential artifacts cannot be identified to explain apparent binding or apparent antagonism, an experiment to determine Ki may be required to obtain a definitive answer.
Reports in the literature of assessment of ER antagonist activity of industrial or commercial use chemicals of environmental interest similarly indicate that only a limited number of chemicals appear to exhibit this activity. Only 3% of 200 pesticides tested by Kojima et al. exhibited antagonist activity using a human ERα- and ERβ-activated reporter gene in a Chinese hamster ovary (CHO) cell line. 16 In addition Takeuchi tested 100 hydroxylated polychlorinated biphenyls (PCBs) in reporter gene assay using the CHO cell line and found that 12% exhibited antagonist activity toward hERα or hERβ. 17 Work by Kramer et al. on the estrogenic and antiestrogenic activity of hydroxylated PCBs showed that of those that were apparent antiestrogens, most were cytotoxic at the concentrations that inhibited the estrogen response, and only two produced antagonism responses that did not occur at concentrations also producing cytotoxicity. 18 In an assay of a small set of phenolic-based chemicals, Yamasaki found that only one of the 10 showed antagonist activity in the hERα-based reporter gene assay. 19 High-throughput screening of the Tox21 library of 10,000 chemicals using two different cell-based assays identified ∼4% of the tested chemicals as true antagonists. 20 Additional chemicals were identified as potential antagonists but they were assigned as inconclusive antagonists due to potential assay artifact interferences or cytotoxicity.
Yet, there are reports of greater proportions of chemicals analyzed acting as ER antagonists. For example, Kolle et al. tested 88 chemicals, including 28 literature negatives and 60 literature agonists/antagonists in a validation exercise using the yeast estrogenic screening assay. 21 Their literature review identified 34% (30 of 88) of the chemicals as estrogen antagonists and experimentally determined 26% (23 of 88) were antagonists. In light of the reported low incidence of antagonism from multiple reports and knowledge of potential artifacts that can lead to false identification of antagonism, a high incidence of antagonist activity should be viewed with caution. In the case of all of these studies in which antagonist activity was assessed at only a single concentration of E2, further confidence in the classification of a chemical as an antagonist could be obtained by testing against a second concentration of E2.
Testing chemicals for antagonist activity against dual E2 concentrations can provide an additional level of confidence for categorizing the activity of a chemical as an ER antagonist. The use of two concentrations of positive control ligands, whether 5α-dihydrotestosterone or estradiol when assessing chemicals for androgen receptor or ER antagonism, respectively, has been incorporated in experimental designs by others22–24 ; however, it is far from common in the published literature. For gene expression assays, additional cytotoxicity assays could be included to monitor different cytosolic functions. These include detection of cellular ATP or MTT assays that can identify mitochondrial functional integrity9,25; or assays such as the propidium iodide assay that like LDH measures membrane integrity 26 ; or those that determine cytosolic enzyme activity such as the calcein-based cytosolic esterase activity assays. 27 With any of these cytotoxicity assays, there is always some uncertainty whether the endpoint of the assay will capture the type of toxicity or off-target mechanism targeted by the test chemical that would produce the loss of signal response.
Alternatively, selecting a suite of cytotoxicity assays may provide greater confidence in confirming or ruling out cytotoxicity; however, there can be uncertainty in knowing how many or which suite of cytotoxicity assays are sufficient to have confidence that a loss in signal is due to cytotoxicity. Other approaches for identifying antagonists in high-throughput screening have included developing network models of estrogen activity from a suite of in vitro assays and assessing the activity patterns across all of the assays to identify potential effects not likely mediated via the ER. 28 In any of these efforts to assess chemicals for potential antagonist activity in hormone receptor systems, utilization of a second concentration of model agonist could help verify antagonist activity of test chemicals.
Conclusions
The data presented above are the results of efforts to address the potential for industrial and commercial use chemicals to have estrogenic activity via binding to and subsequent activation or inhibition of E2-mediated gene expression via the rtER. In this project, in which a structure–activity approach was taken to assign chemicals into effects-based chemical categories and develop a rule-based expert system,3,5 correctly interpreting the apparent antagonistic responses was critical for assigning chemicals as ER binders or nonbinders. The quality of the resulting data using this approach was recommended by an EPA Science Advisory Panel as a gold standard data set for chemical prioritization of the defined EPA industrial chemical lists under study. 29
The use of multiple lines of evidence to indicate when toxicity, chemical precipitation, media pH, or other factors resulted in displacement of the [3H]-E2 from the receptor and/or inhibition of Vtg mRNA expression that was not ER mediated is essential to avoid incorrect labeling of chemicals as ER binders. Using two concentrations of E2 tested in combination with graded concentrations of test chemical was critical for an accurate assessment of apparent antagonist activity for many chemicals. Separation of the two E2 concentrations by at least 2 log M units is recommended to provide sufficient separation in E2 activation response to confidently identify a shift in antagonist response curves.
Rainbow trout livers were the source material for the ER binding and estrogen-responsive gene expression assays, but the concepts are applicable to in vitro or ex vivo assays utilizing any freshly isolated tissues or cultured cells. Utilizing the methods described above can help to avoid false positives due to potential artifacts inherent in the test system and increase confidence in negative determinations. Thus, as the focus on in vitro gene activation assays increases as a tool for screening chemicals for potential antagonist activity, these approaches can go a long way toward optimizing the use of in vitro results.
Footnotes
Acknowledgments
The authors thank Katie Challis and Grace Overend who provided technical assistance at various stages in this effort. The authors also thank Dr. Sally Mayasich for providing critical comments on an early draft of the manuscript. The research described in this article has been funded wholly by the US Environmental Protection Agency. Mention of trade names or commercial products does not constitute endorsement or recommendation for use.
Disclaimer
The views expressed in this article are those of the authors and do not necessarily reflect the views or policies of the US Environmental Protection Agency.
Author Disclosure Statement
No competing financial interests exist.
References
Supplementary Material
Please find the following supplemental material available below.
For Open Access articles published under a Creative Commons License, all supplemental material carries the same license as the article it is associated with.
For non-Open Access articles published, all supplemental material carries a non-exclusive license, and permission requests for re-use of supplemental material or any part of supplemental material shall be sent directly to the copyright owner as specified in the copyright notice associated with the article.