
Abstract
System dynamics (SD) modeling belongs to the rapidly evolving, interdisciplinary field of system science research. This field adds value to more traditional health research by contributing to the design and testing of complex integrated models of change, to examine health system performance and patient outcomes. Using selected milestones in HIV care management to frame our simulation research, we created a SD model to examine three patient subgroups of women of color (WOC) represented in our multi-site cohort, classified by their health care seeking status at baseline. Asked to reflect on their circumstance 6 months prior to enrollment in the MSE cohort, 53% noted they were receiving some care (In Care, n=341), 31% that they had been seeking care (Seeking Care, n=201), and 16% that they were undecided about seeking care (i.e., answered that they may or may not look for care) for treatment of their HIV (May or May Not Seek Care, n=103). Our SD model compared simulated patterns of patient retention over 24 months in relation to: (1) access to antiretroviral therapy (ART), (2) adherence to ART, and (3) viral suppression. Assessed patterns yielded insights about system capacities and constraints in the context of the SPNS initiative under evaluation.
Introduction
O
Systems thinking and SD belong to the rapidly evolving, interdisciplinary field of system science research. 3 –5 This field adds value to more traditional health research methods by contributing to the design and testing of integrated models of change, to examine health system performance and patient outcomes. 6 Methods include a variety of tools for better understanding complex problems, 1,7 with the objective being the move away from framing problems in terms of events and causes or outcomes, towards looking at them as a system comprised of interacting parts with a particular goal. 8 –10 In addition to SD modeling, social network analysis, agent-based modeling, micro-simulation, discrete event analysis, Markov modeling, and many operations research and engineering methods constitute systems science approaches that show promise for health research and health policy studies. 3,11
The hallmark of the SD approach to systems thinking and simulation is the study of feedback mechanisms, or cybernetics, which can be used to explain how things change over time. 12 –15 Systems thinking typically employs qualitative tools that often support development of robust SD models, which are computer-aided, mathematical tools that use simulation techniques to explore complexity and change of a stated problem situation. 8,16,17 Once systems thinking and SD models are validated, and there is confidence in their structure and behavior, they can be put to the task of generating plausible, sustainable solutions by using the model for policy testing, scenario analyses, or intervention optimization. 18 –22
SD modeling has been used to examine health care quality improvement; 11,23 –28 community-based systems of care; 29 –32 epidemiology and disease surveillance; 33 –37 global health care management; 38 –40 behavioral health interventions in tobacco; 37,41 –45 substance abuse; 46 –49 and mental health; 9,50 as well as in managing chronic illness. 32,51,52 SD modeling to examine HIV epidemiology, prevention, and treatment has also been conducted. 53 –55 In addition, a system dynamics model called HealthBound, originally developed for the Centers for Disease Control and Prevention (CDC), is currently being used in a project called ReThink Health, to help people understand the critical relationship between “upstream” efforts to prevent illness and the demand for the relationships between a community's access to care, health status, and socioeconomic level. 56
Methods
SD model-building deploys an iterative research process that is complete when the model achieves sufficient ‘structural’ and ‘behavioral’ validity to its intended purpose. 57 –59 Procedures for establishing structural and behavioral validity are organized around the purpose of the model, the type and quality of the sources of evidence, and calibration. 13,21,60 The model is a working set of algebraic and ordinary differential equations, generally shown as a diagram, which can then be used as a tool to explore hypotheses about the factors that contribute to the stated problem, as well as to compare problem-solving strategies. 16,17,61
Overview of system dynamics model-building steps
Major steps in SD model-building include system conceptualization, model formulation, and model simulation. System conceptualization is largely qualitative, whereby the model-building team names constructs of interest and drafts hypothesized causal influences and interdependent relationships. Model formulation involves translating the system conceptualization into a set of equations using SD modeling software and checks for structural validity of these equations. Model simulation refers to running the SD model and examining its output to ensure expected and/or plausible behavior. It also refers to conducting sensitivity analyses in which ranges of variable values are simulated to generate effects on selected outcomes in order to evaluate behavioral validity. Finally, model simulation includes the comparison of simulated outputs.
System conceptualization
Broadly, we used SD to develop a tool to examine processes of HIV care management. 2 The Health Resources and Services Administration (HRSA) 62 and the Center for Disease Control and Prevention 63 have defined five key ‘stages of care,’ or milestones, for the purpose of evaluating overall progress in HIV testing and treatment success. These key stages are presented as a percentage of the estimated total patient population who are diagnosed, linked to care, retained in care, prescribed antiretroviral therapy (ART), and who are virally suppressed.
Part of the goal of the SPNS WOC initiative was to collect data on the patient population related to these metrics. Using the ‘stages of care’ as a framework for our simulation research, we created a SD model to examine three patient subgroups of WOC who were represented in our MSE cohort, classified by their health care seeking status at baseline. Asked to reflect on their circumstance 6 months prior to enrollment in the MSE cohort, 53% noted they were receiving some care (In Care, n=341), 31% that they had been seeking care (Seeking Care, n=201), and 16% that they were undecided about seeking care (i.e., answered that they may or may not look for care) for their HIV (May or May Not Seek Care, n=103). 64 Our SD model compared simulated patterns of patient retention over 24 months in relation to: (1) access to antiretroviral therapy (ART), (2) adherence to ART, and (3) viral suppression.
Comparison of patterns for these groups was hypothesized to yield insights about system capacities and constraints, in the context of the SPNS initiative under evaluation.
Model formulation
Formulation of an SD model is facilitated by computer simulation software packages. Powersim®, iThink/Stella®, and Vensim® are among the most widely used packages for SD modeling. These software packages allow users to work with a graphical interface to build the model, equation by equation, examining preliminary simulation runs in an iterative fashion, to check and re-check the extent to which the model's behavior (simulated output) conforms to key assumptions and sources of evidence guiding the project.
Figure 1 depicts our SD model, which is presented as a Vensim® stock-and-flow diagram. Three basic types of structure detail are shown: levels or stocks, rates of flow or flows, auxiliary variables, and constants (parameters). Stocks are accumulations of material or information at a given moment. Flows are what increase or decrease a stock, incrementally, over time. Parameters are variables that have a fixed value (at least over a specified simulation time period or time horizon). Auxiliaries are terms used to build algebraic equations. Stocks are represented by a rectangle. Flows are represented by a double-lined arrow and a faucet-like icon. Often one end of a flow structure will be attached to a cloud icon. The cloud represents a sink, or a source of material of information that accumulates outside of the model boundary.
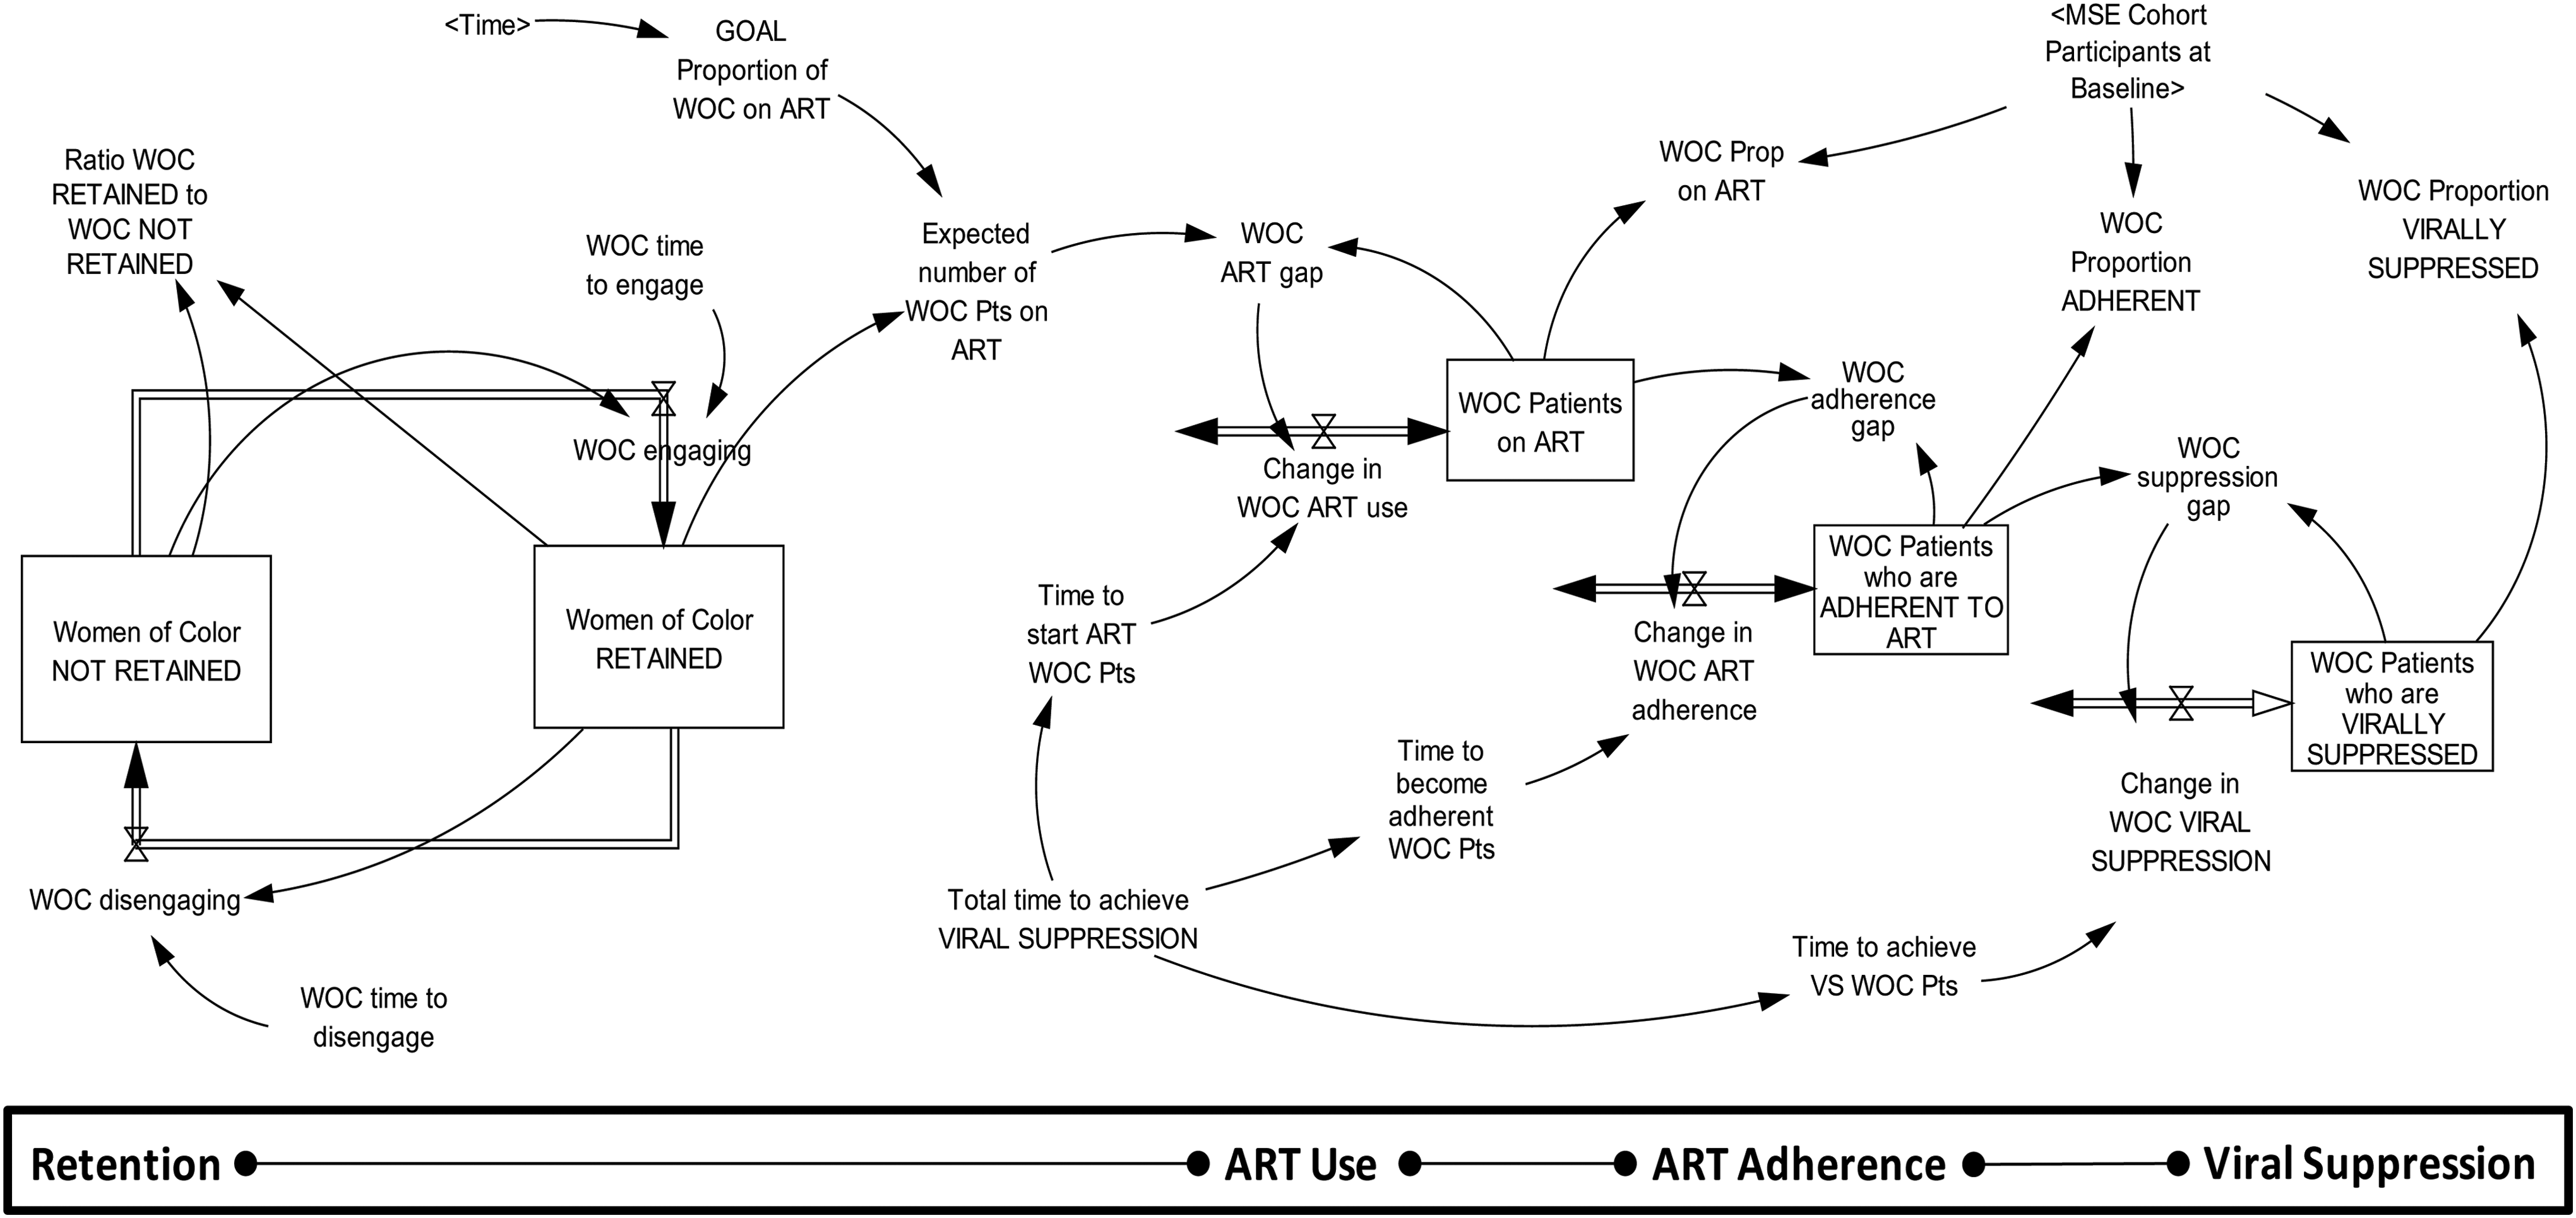
Stock-and-flow structure of a system dynamics model depicting patient engagement, treatment adherence, and viral suppression.
Major structures (i.e., constructs) represented in our SD model include Retention, ART Use, and Viral Suppression, as well as a hypothesized mediating structure not explicitly referenced in the ‘stages of care’ framework: ART Adherence. The decision to add Adherence to our SD model was informed by results of the MSE cohort study, which found that WOC who reported good medication adherence at baseline were more likely to be virally suppressed at 12 months (OR=2.077; 95% CI=1.38, 3.12), 64 as well as by recent and robust HIV care literature on retention in HIV care, ART use and adherence, and viral suppression. 65 –71
The Retention structure is comprised of two stocks or persons (WOC), those who are ‘retained’ and those who are ‘not retained.’ We applied the HIV/AIDS Bureau's (HAB) Core Clinical Performance Measures definition of ‘retained in care,’ such that one would have at least two visits, 3–6 months apart, within a given 12-month period to be classified as ‘retained.’ 72 The two stocks are linked by a flow of persons into and out of these stocks. The flow of persons is determined by the rate at which WOC ‘engage’ and ‘disengage’ from care. The initial value, the number of WOC in the stock at baseline (T0), is exactly half (50%) of the respective subgroup's sample size. Note that the number of WOC in the ‘retained’ stock is used to drive the dynamics of ART Use, ART Adherence, and Viral Suppression, which collectively form a cascaded smooth structure.
The smooth is a generic system dynamics structure that computes a moving average of the given variable. The smooth structure is defined by three parameters: its initial value and a future goal value, and the average time delay (i.e., time constant) to attain the goal. Note that the rate of change is intended to close the gap, or the difference between the expected value (or goal), and the smooth stock (or actual value). The stock adjusts toward the goal over time, unless it is impacted by another variable. The gap between the actual value and the expected value (or goal) is closed according to the specified smoothing time. The magnitude of the gap would decline to zero over the smoothing time if the net inflow were held constant, resulting in the actual value approaching the expected value (i.e., ‘goal’). Hence, the smooth structure will ultimately generate a steady state condition.
The goal value for ART Use, the first smooth in the cascade structure, increases linearly from a baseline level at T0 (which was computed from the MSE cohort study data; 64 Table 1) to a maximum of 90% after 12 months (T12), a clinical recommendation and performance measures cited by HAB. 72 Figure 2 graphs the reference modes (i.e., behavior-over-time graphs) for Proportion of WOC who are prescribed ART formulated in the model for each WOC subgroup. Note that the slope of the line from T0 to T12 is steepest for the May or May Not Seek Care subgroup (m=0.015917), suggesting that the level of effort required to meet the goal for this subgroup of patients would be resource-intensive, relative to the (m=0.01667) and (m=0.04833) subgroups.
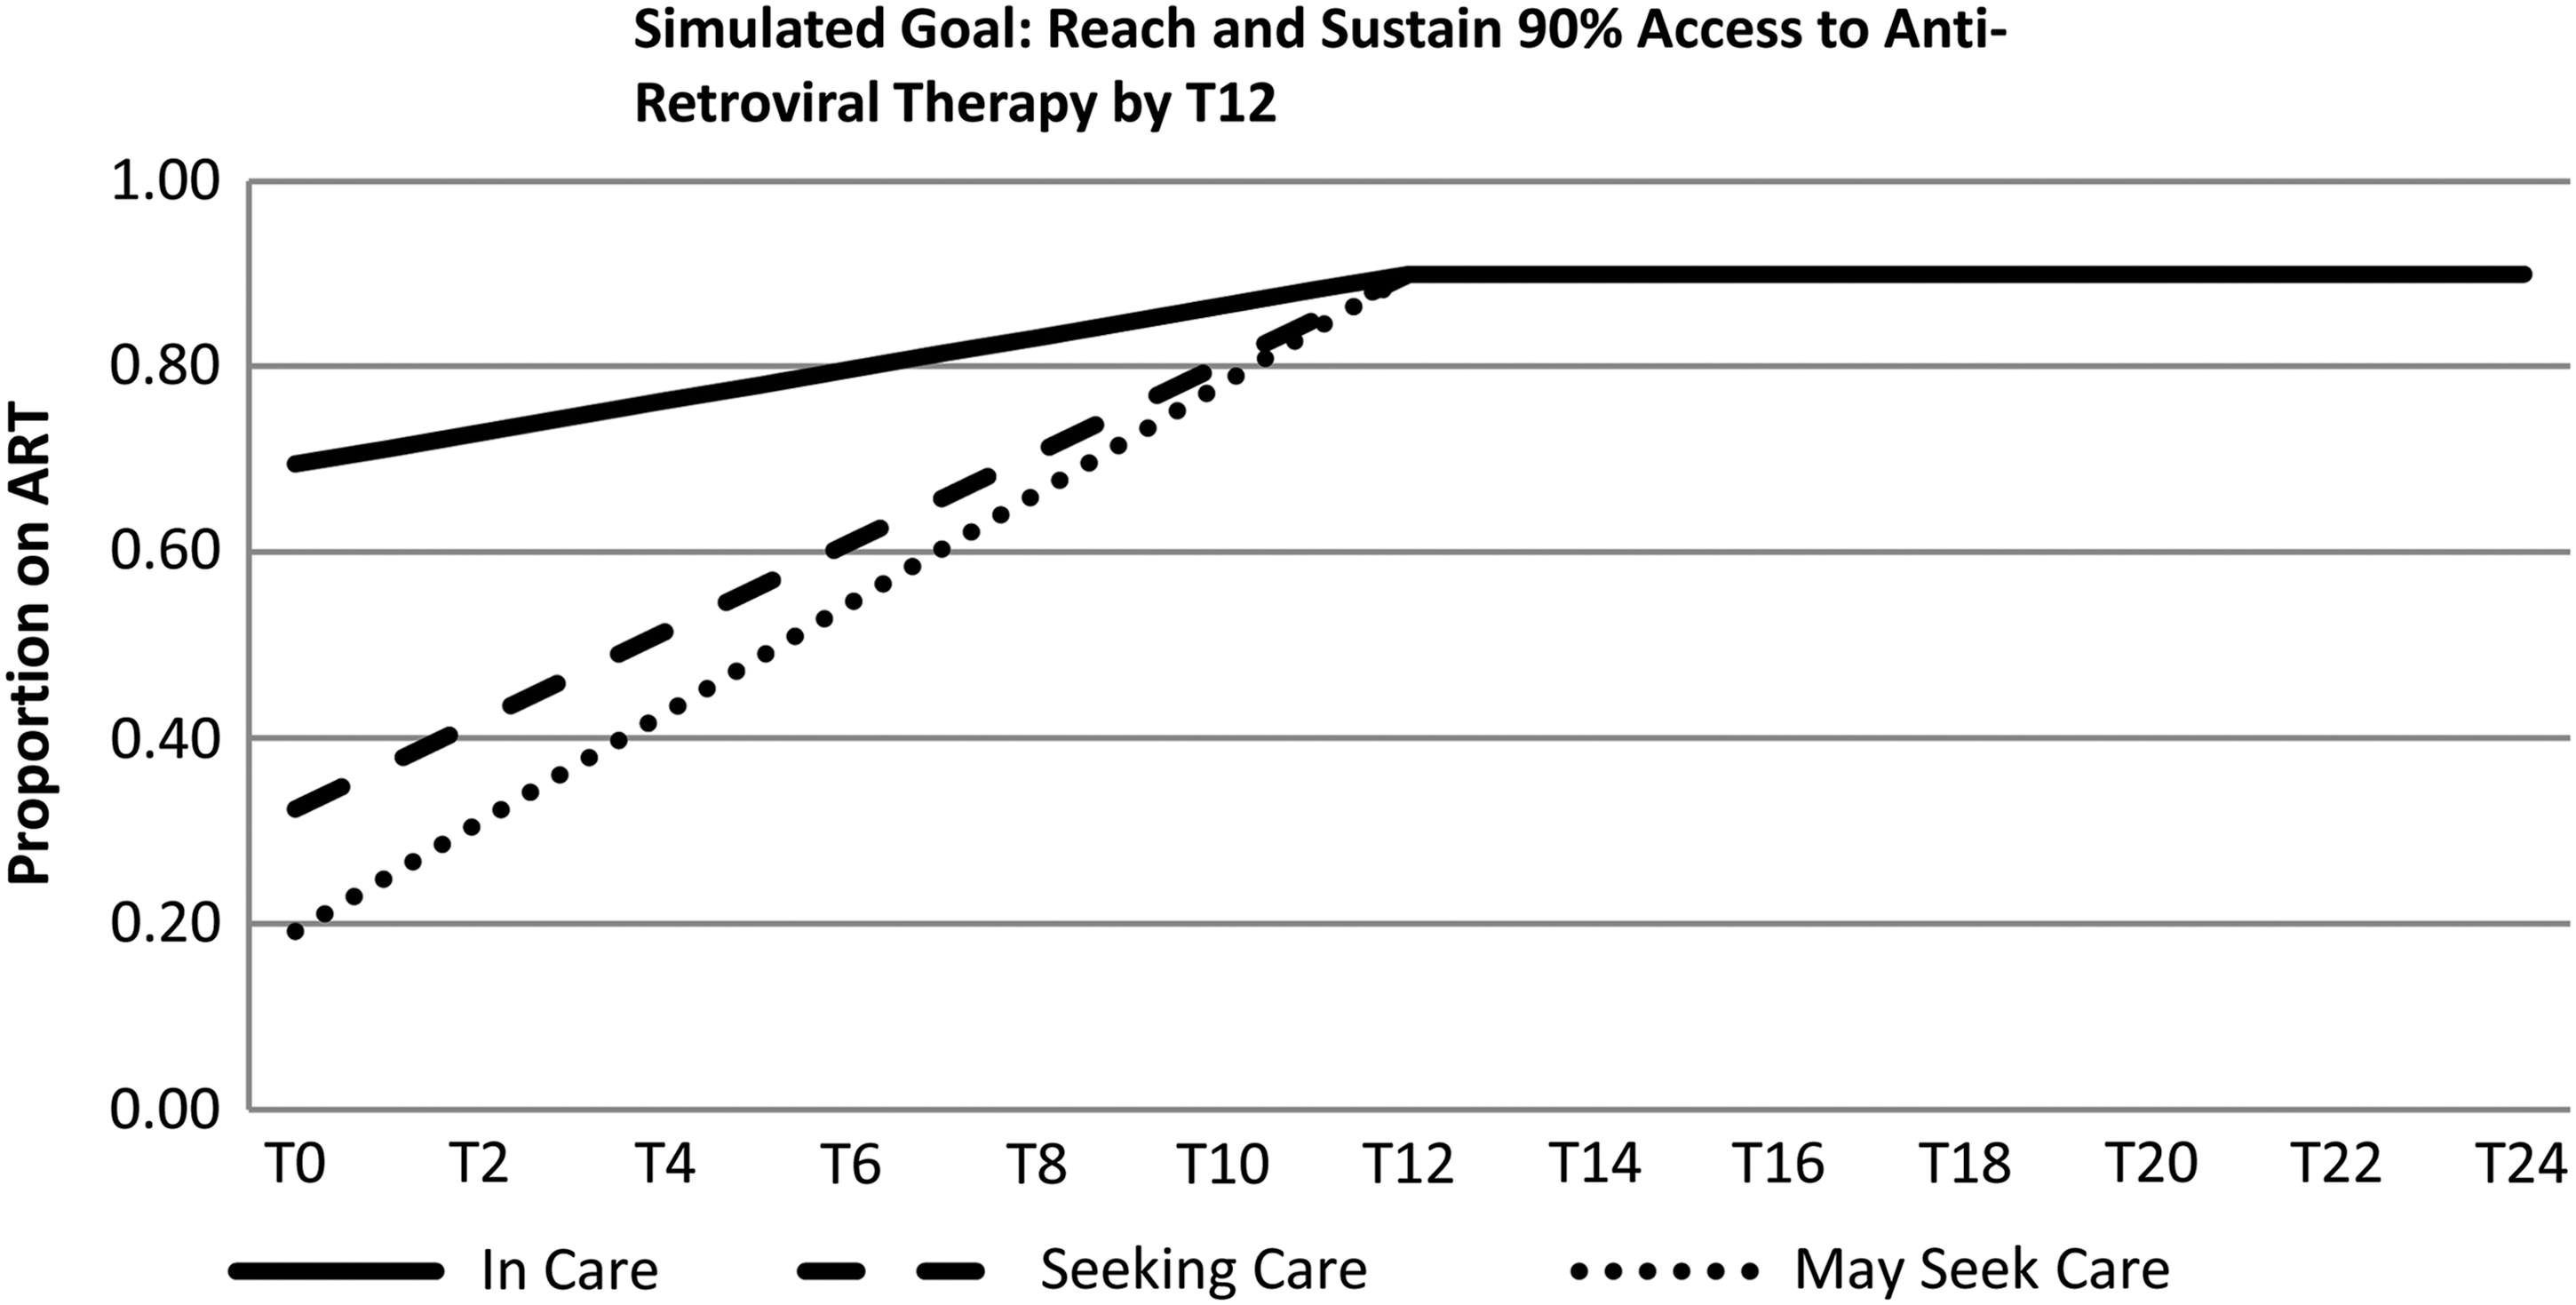
References modes for ART use for baseline care status by WOC patient subgroup.
Source: Multi-Site Evaluation Cohort Study (N=645, In Care n=341, Seeking Care n=201, May Seek Care n=103).
As the number of WOC retained in care changes over time, the cascaded smooth structure captures the average time it takes to access ART, to ‘learn’ how to become adherent, and ultimately how to achieve viral suppression. Due to limited journal space, the SD model and full equations comprising the model could not be presented here, but instead are packaged as supplementary material to the article, provided upon request to the corresponding author.
Model simulation
The incremental time unit for our SD model was ‘months,’ and the time horizon selected for simulation was 24 months. The first half of this period, T0 to T12, allowed for an historical validation of the SD model's behavior, based on known retention and viral suppression point estimates (rates) for the three patient subgroups, per analyses of the MSE cohort data. The second 12-month period (T13–T24), then, allowed us to simulate plausible ‘future’ trajectories for Retention in relation to ART Use, ART Adherence, and for Viral Suppression.
In order to generate reliable, valid simulation runs, the model must be appropriately calibrated. Model calibration involves choosing and testing estimates for initial values and other parameters in the SD model. An important goal of model calibration is the process of estimating the model parameters to obtain a match between observed and simulated behavior. Confidence that a particular structure, with reasonable parameter values, is a valid representation of reality increases if the structure is capable of generating the observed behavior. 60,73 For the current model, calibration was organized around the goal of simulating valid reference modes for (1) Retention and Viral Suppression, in relation to determined estimates of (2) other, key known parameters:
Reference modes for Retention and Viral Suppression rates
Statistical analyses of our MSE cohort data informed choice of parameter estimates in our SD model. 64 Specifically, we used estimated values for baseline (T0) and 12-month (T12) retention and viral suppression rates for In Care, Seeking Care, and May or May Not Seek Care patient subgroups (Table 2).
Source: Multi-Site Evaluation Cohort Study.
Key parameter estimates
In addition, we used MSE cohort study data to derive estimates of other key model parameters for each patient subgroup, namely the proportion of WOC on ART at baseline, the proportion of WOC with ‘good’ ART adherence at baseline, and the effect size (Pearson Product Moment Correlation, r) between ART adherence and viral suppression 64 (Table 1).
The calibration of the model was conducted iteratively, examining differences between simulated output and MSE cohort study data, identifying possible reasons for those differences, and adjusting time constants that control the flow of WOC between ‘not retained’ and ‘retained,’ and the flow of information depicting levels of ART Use, ART Adherence, and Viral Suppression for those who are ‘retained.’ Calibration is completed when the parameterized structure and the behavior of the model support a valid representation of the focal problem.
Results
Using our calibrated SD model, the simulated output of the Retention structure and the cascaded smooth structure for ART Use, ART Adherence, and Viral Suppression displays trajectories over our 24-month time horizon (Figs. 3 and 4). Figure 3 presents the dynamics of retention for each subgroup of WOC. Figure 3 shows the ratio of ‘retained’ to ‘not retained’ WOC, showing that the In Care subgroup had the highest ratio of ‘retained’ to ‘not retained’ WOC (7.8 to 1 by T16), followed by the Seeking Care subgroup (7.1 to 1 by T18), and then by the May or May Not Seek Care subgroup (2.8 to 1 by T18).

Simulated dynamics of retention for baseline care status by WOC patient subgroup.
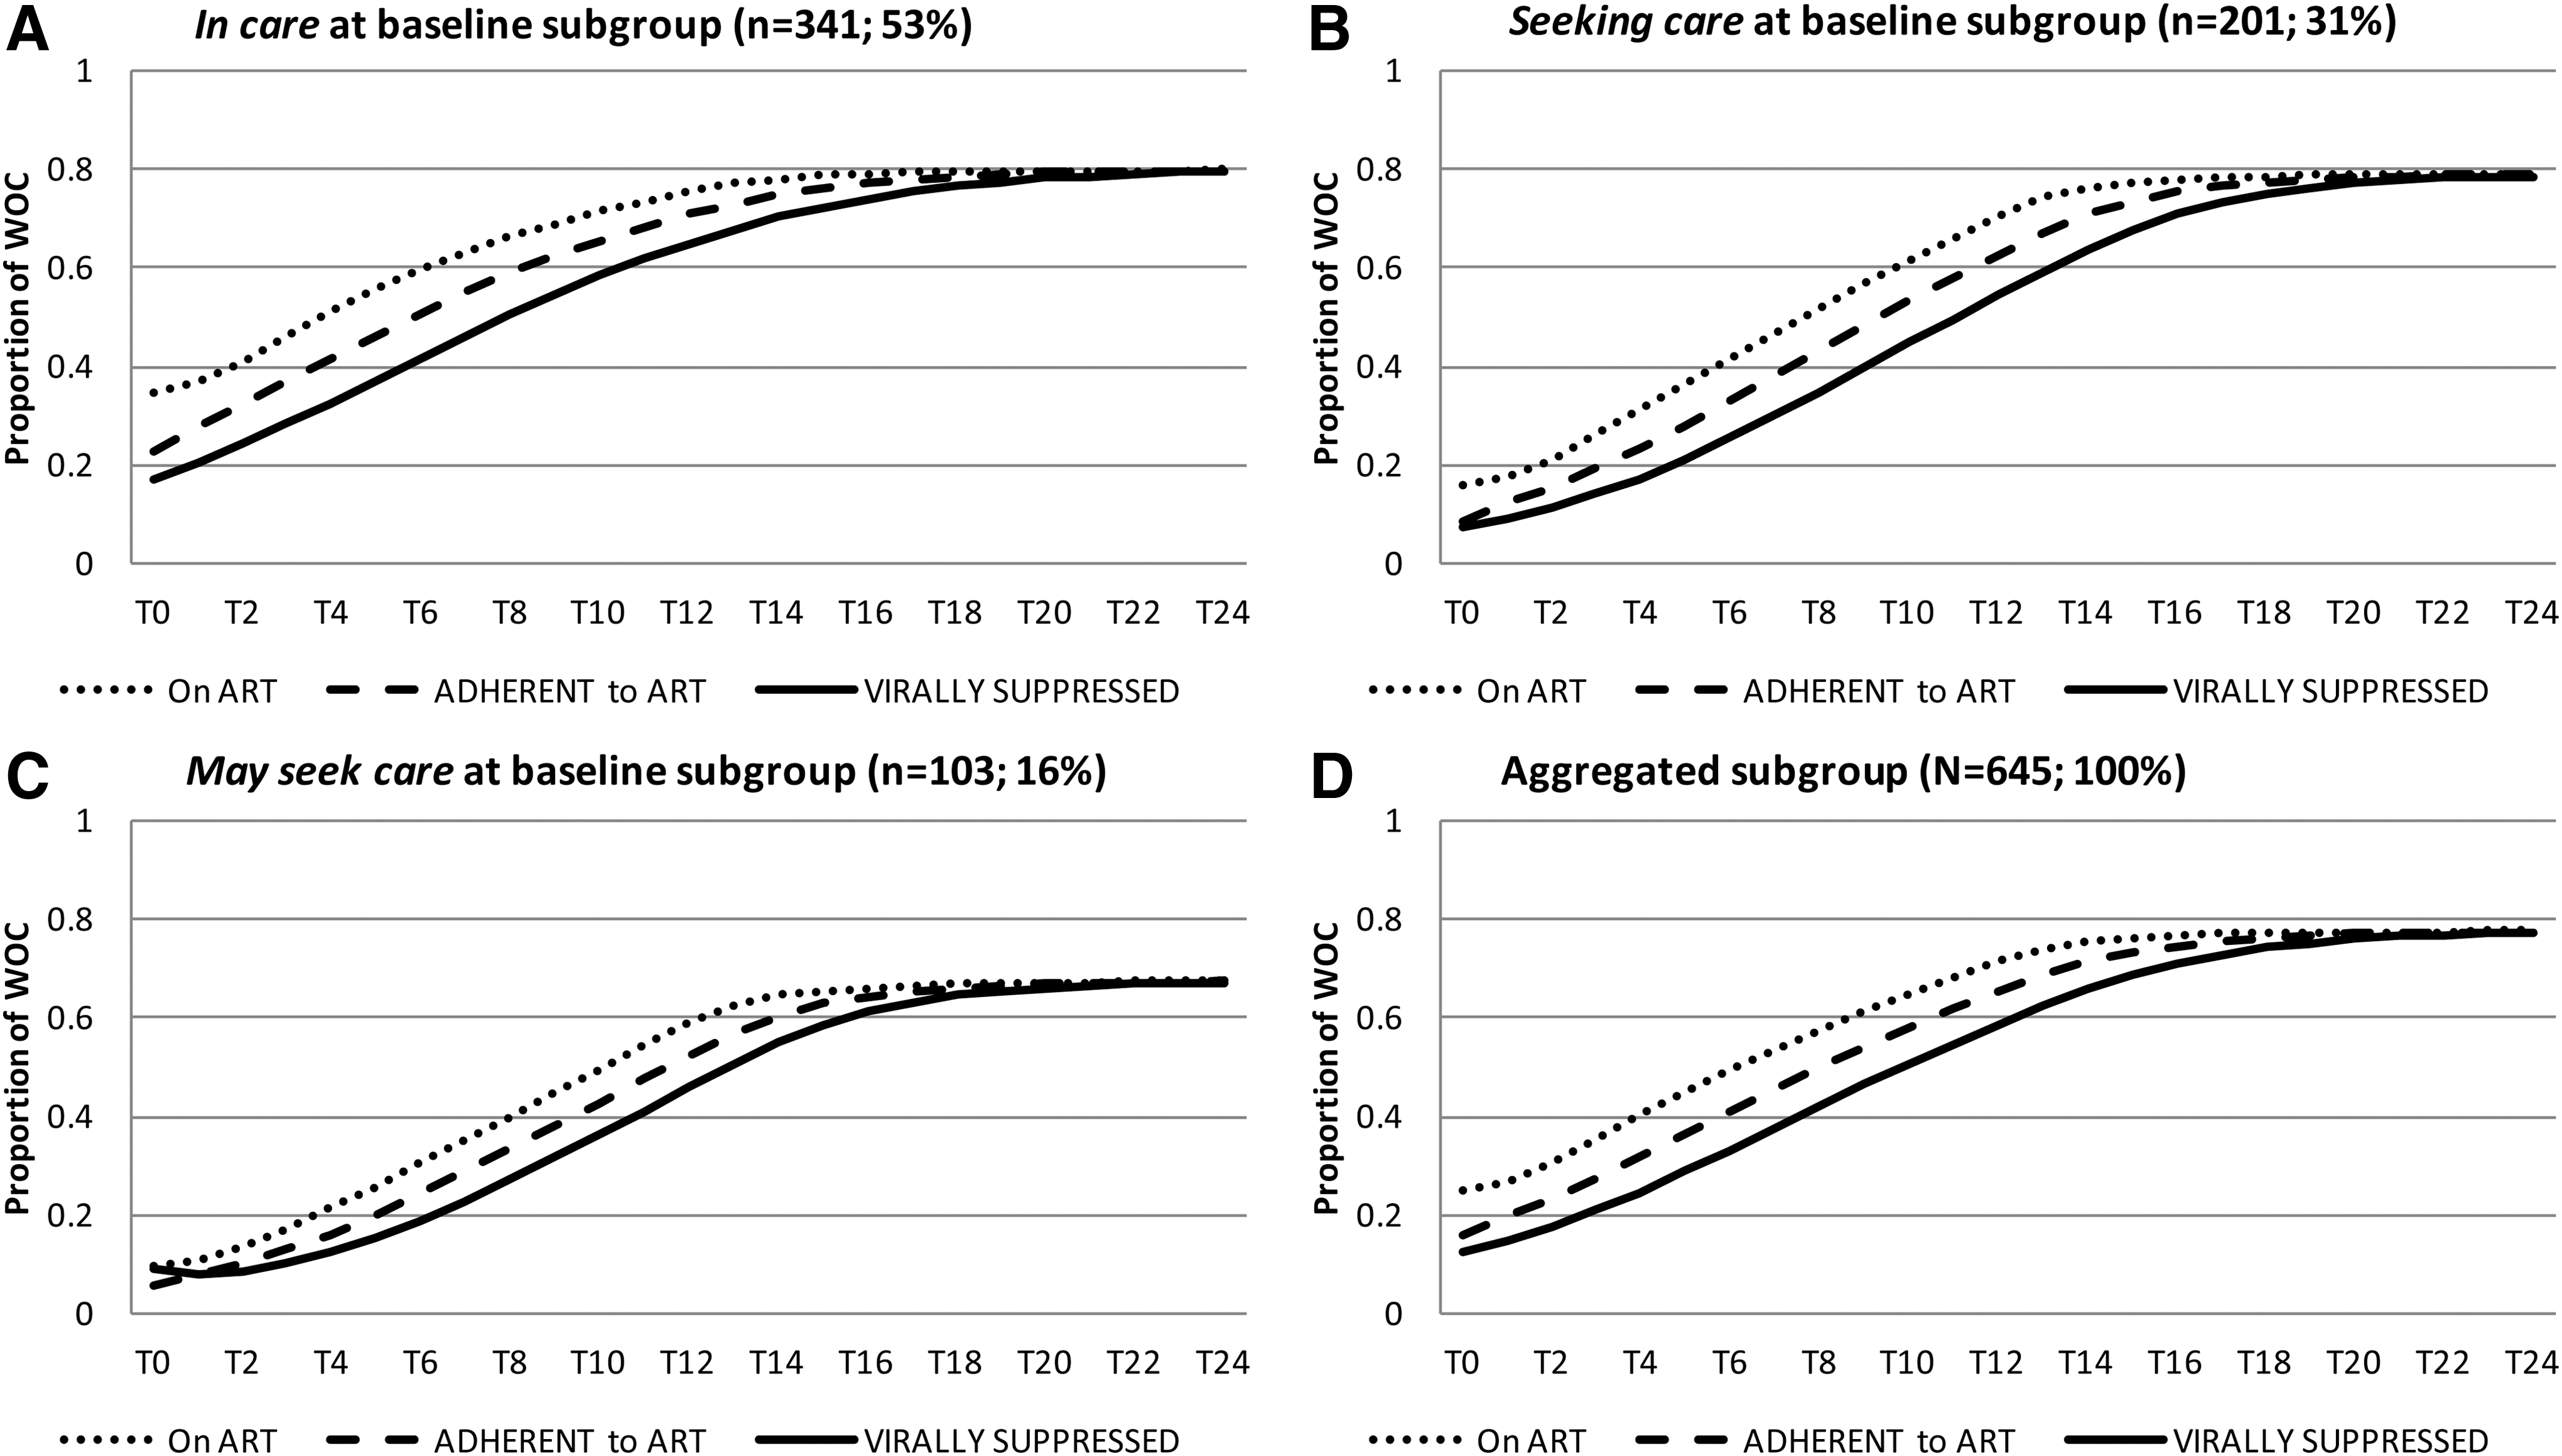
Simulated dynamics of HIV care management by baseline care status subgroup.
Figure 4 presents simulated patterns of output for the third order cascaded smooth structure, representing the dynamics of ART Use, ART Adherence, and Viral Suppression. Panels A, B, and C show results for In Care, Seeking Care, and May or May Not Seek Care subgroups, respectively. Panel D shows the pattern for the full, aggregated cohort. By observation, simulation of the In Care subgroup (A) shows the highest (best) starting levels for ART Use, Adherence, and Viral Suppression, as well as a nearly linear upward slope, attaining the highest levels of viral suppression by T22 (79% by T22). The Seeking Care subgroup (B) shows lower starting values than the In Care subgroup, but finishing at the same levels (79% virally suppressed by T22). In contrast, the May or May Not Seek Care subgroup (C), which has the lowest proportion of WOC on ART at baseline (10%), has a higher proportion of persons who are virally suppressed at baseline (8% of May Nots compared to 7% of Seeking), though the lowest level of adherence (5%). The May or May Nots also attain the lowest level of viral suppression over the 24-month time horizon, stabilizing at 67% by T24. Notably, the May or May Nots exhibit a robust ‘S’ shaped curve, indicating relatively substantial improvement over time, relative to the patterns of the other two subgroups. Examination of Panel D shows an overall pattern most similar to the In Care subgroup, which reflects their size (53% of N=645) relative to the other two subgroups. Notably, the cohort level of viral suppression does not exceed 77%, which is not reached until T24.
Finally, based on our final model calibration, Table 3 presents a comparison of time constants, or the average time required to transition from one state to another (e.g., from ‘retained’ to ‘not retained,’ or from ‘not yet virally suppressed’ to ‘virally suppressed’). What is shown is that time In Care and Seeking Care subgroups are similar in terms of time to ‘engage’ in and ‘disengage’ from being retained in care (3.3–3.5 months to ‘engage,’ respectively; and 25 months both to ‘disengage’). In contrast, the May or May Nots take approximately twice as long (about 88% longer) to ‘engage’ and about 20% less time to ‘disengage’ from being retained. However, total average time to achieve viral suppression, for an individual in the In Care subgroup is 18% higher than for an individual in the Seeking Care subgroup, and 42% longer than for an individual in the May or May Not subgroup.
Discussion
Our SD model demonstrates a useful application of simulation methods for evaluating HIV care management systems, by explicitly showing the dynamics of patient engagement relative to ART adherence and viral suppression. We build upon findings in the MSE of the Enhancing Access and Quality HIV Care for WOC initiative and upon a growing literature on the relationship between retention in high quality HIV care and achieving viral suppression. 65,67 –71,74 –78
We embroidered on the ‘stages of care’ model for understanding HIV care management outcomes by adding ART adherence as a mediating structure. There is strong evidence that adherence improves outcomes for HIV patients. 79,80 Our simulation analyses show that patterns of adherence may differ for persons with different rates of engagement and levels of retention with health care. Notably, a smaller number of persons who are ambivalent about seeking care will be retained, although our analysis indicates that they respond to treatment comparatively quickly.
For clinicians, the need to actively set high goals for fostering patient access to ART is requisite for attaining and sustaining high levels of viral suppression among patients. In the current SD model, the goal for each patient subgroup was set to 90%, which is consistent with current national guidelines in HIV care management. 2 However, as simulated results for the May or May Not Seek Care subgroup showed, there may be a need for interventions that address the often multiple and complex needs of patients, as evidenced in by Eastwood et al. (this issue), 64 if we are to make greater strides in overall HIV care management. For example, factors such as substance abuse, exposure to violence, physical health, mental health, housing fragility, and having young children may all negatively impact efforts to help a patient stay in care and attain viral suppression.
Although the current SD model is a useful tool for examining patterns of HIV care management, it does not simulate any specific intervention to improve retention or viral suppression. However, the model could be expanded by adding new structures to represent interventions that would address one or more of these factors. For example, peer support interventions, which were common and well developed across many of the WOC SPNS demonstration sites, are worthy of greater study and development, particularly if they are designed to foster greater access to ART and skill-building to help patients better learn why and well as how to adhere HIV medication protocols.
Our calibrated model and its simulated output provided a different perspective on retention and suppression than more traditional statistical modeling approaches. For example, it permits the study of time delays involved in any change (e.g., for one additional WOC to access or become adherent to HIV care). Notably, we saw that the May or May Not Seek Care subgroup, who are ostensibly the most challenged to achieve viral suppression, could realize this goal in substantially less time than WOC who presented as better integrated with an HIV care management system. One implication is that patients have different demand characteristics, which may invoke greater support.
Last, this model has been developed using a data and information taken exclusively from the MSE of the WOC SPNS initiative. While providing a novel way to enhance the initiative's evaluation, SD modeling tools such as ours could be applied to larger policy questions and calibrated to examine larger systems of care, using national data sets.
Good simulation models mimic important elements of the system under study in practicable, actionable ways. The MSE cohort study data provided a platform for exploring the dynamics of retention and HIV treatment for WOC. Real world problems are complex, and so is modeling them with validity. Simulation methods such as SD have great potential to compliment more traditional evaluation methodologies. Overall, our modeling provides an enhanced understanding about the challenge of delivering high quality HIV care management to diverse patients. The ultimate objective behind applying SD and other systems science methods is to help practitioners, policy makers, researchers—as well as patients and clients—see and address problems that inhibit more effective care management.
Footnotes
Acknowledgments
This publication was made possible by Grant Number H97HA15152 from the US Department of Health and Human Services, Health Resources and Services Administration (HRSA), HIV/AIDS Bureau's Special Projects of National Significance (SPNS) Program. Its contents are solely the responsibility of the authors and do not necessarily represent the official views of the government. The authors wish to thank the SPNS demonstration sites for their varied and useful contributions to the work presented in this article.
Author Disclosure Statement
No competing financial interests exist.