




Abstract
The role of NO in regulating the focal adhesion proteins, Src, FAK, p130 Cas, and PTP-α, was investigated. Fibroblasts expressing PTP-α (PTP-αWT cells), fibroblasts “knockout” for PTP-α (PTP-α−/− cells), and “rescued” “knockout” fibroblasts (PTP-α A5/3 cells) were stimulated with either S-nitroso-N-acetylpenicillamine (SNAP) or fetal bovine serum (FBS). FBS increased inducible NO synthase in both cell lines. Activation of Src mediated either by SNAP or by FBS occurred independent of dephosphorylation of Tyr527 in PTP-α−/− cells. Both stimuli promoted dephosphorylation of Tyr527 and activation of Src kinase in PTP-αWT cells. NO-mediated activation of Src kinase affected the activities of FAK and p130Cas and was dependent on the expression of PTP-α. Analogous to tyrosine phosphorylation, SNAP and FBS stimulated differential generation of NO and S-nitrosylation of Src kinase in both cell lines. Incubation with SNAP resulted in higher levels of NO and S-nitrosylation of immunoprecipitated Src in PTP-α−/− cells (oxidizing redox environment) as compared with the levels of NO and S-nitrosylated Src in PTP-αWT cells (reducing redox environment). SNAP differentially stimulated cell proliferation of both cell lines is dependent on the intracellular redox environment, Src activity, and PTP-α expression. This dependence also is observed with FBS-stimulated cell migration. Antioxid. Redox Signal. 13, 109–125.
Introduction
Src features two important phosphorylation sites: Tyr416, located in the activation loop, is stimulatory, and Tyr527, located in the carboxy-terminal domain, is inhibitory (9). Detailed studies based on x-ray crystallography revealed that Src kinase, although phosphorylated on tyrosine, is maintained in a dormant state by intramolecular interactions mediated by the concerted actions of the SH2 and SH3 domains (46, 55). Activation of Src kinase involves the phosphorylation of Tyr416, resulting in its displacement from the substrate-binding pocket, allowing the kinase access to substrates (29).
Protein tyrosine phosphatases (PTPs) have been implicated as negative regulators of signal-transduction pathways and may operate as tumor suppressors (4). However, positive regulatory roles for these enzymes have been described. The receptor-like PTP-α is a widely expressed transmembrane PTP with an extracellular domain heavily glycosylated and two cytoplasmic domains in tandem. The catalytic activity is located in the membrane-proximal domain, whereas the regulatory activity is found in the membrane-distal domain (8). It has been shown that PTP-α is a positive regulator of Src and is required for integrin-mediated cell spreading and migration (48). PTP-α displaces the phospho-Tyr527 residue from the Src kinase SH2 domain. This results in dephosphorylation of Src and leads to its activation (48).
A third regulatory mechanism involving the activation of Src kinase is independent of dephosphorylation of Tyr527 (47). We and others have described that the activation of Src kinase by nitric oxide (NO) and other oxidants is independent of dephosphorylation of Tyr527 (2, 18, 33).
Nitric oxide, a lipophilic free radical, has the ability to diffuse across membranes and travel relatively long distances. NO has the ability to modify the intracellular balance between levels of disulfides and sulfhydryls by forming highly reactive intracellular species that modify sulfhydryl groups to yield S-nitrosothiols (26). It also has been shown that NO increases tyrosine phosphorylation of several cytosolic proteins, including focal adhesion kinase (FAK), Src kinase, and the ERK1/2 MAP kinases. In this way, NO has been implicated in signaling pathways normally used by integrins and growth factors (33, 54).
We previously showed that NO affected focal adhesion complexes. Tyrosine phosphorylation of FAK and the association of FAK with Src kinase was observed in mouse fibroblasts treated with the NO donor (33). However, the mechanism by which NO regulates focal adhesion proteins and the consequences of this regulation on cell proliferation and migration have yet to be elucidated.
In the present study, we describe the mechanism associated with NO-mediated regulation of the focal adhesion proteins, Src kinase, FAK, p130 Cas, and PTP-α. We used mouse embryo fibroblasts (MEF) “knockout” for PTP-α (PTP-α−/− cells), MEF expressing PTP-α (PTP-αWT cells), and MEF “knockout” for PTP-α permanently transfected with a plasmid encoding the gene PTP-α (PTP-α A5/3 cells, “rescued” fibroblasts). Fibroblasts were exposed to the low-molecular-weight S-nitrosothiol S-nitroso-N-acetyl-penicillamine (SNAP) and fetal bovine serum (FBS). FBS provided a source of endogenously produced NO in the studied cell lines by differentially inducing the expression of the inducible isoform of NO synthase.
SNAP and FBS promoted changes on tyrosine phosphorylation levels and stimulated differential S-nitrosylation and activation of Src kinase in both cell lines. Levels of NO measured after incubation with SNAP or stimulation with FBS also showed a dependence on PTP-α expression. Higher levels were determined in PTP-α−/− cells as compared with the levels measured in PTP-αWT cells. NO/nitrosothiol signaling is partly determined by the cellular redox environment (26). Examining the redox couple GSH/GSSG, we determined an oxidizing intracellular redox environment in PTP-α−/− cells and a reducing intracellular redox environment in PTP-αWT cells.
Finally, the differences on SNAP-stimulated cell proliferation of both cell lines are dependent on the intracellular redox environment, Src activity, and PTP-α expression. The same dependence also is observed with FBS-stimulated cell migration.
Materials and Methods
Materials
Anti-β actin, 5,5'- dithiobis-2-nitrobenzoic acid (DTNB), glutathione reduced form (GSH), glutathione disulfide form (GSSG), glutathione reductase (GR), β-NADPH, sulfosalicylic acid, triethanolamine, and 2-vinylpyridine were obtained from Sigma Aldrich (St. Louis, MO). The anti-nitrosocysteine (SNOCys) mouse monoclonal antibody was obtained from AG Scientific (San Diego, CA). The anti-phosphotyrosine mouse monoclonal antibody PY20 was from BD Biosciences. The anti-phospho Src Tyr416, anti-phospho Src Tyr527, anti-p130Cas, anti-phospho p130Cas, and anti-phospho PTP-α Tyr789 were obtained from Cell Signaling Technologies (Beverly, MA). S-Nitroso-N-acetylpenicillamine (SNAP), 4-amino-5-(4-chlorophenyl)-7-(t-butyl)pyrazolo[3,4-d]pyrimidine] (PP2), and 4-amino-5-methylamino-2,7'-difluorescein diacetate (DAF-2DA) were obtained from Calbiochem (San Diego, CA). Protein A-agarose, Protein G-agarose, and the antibody anti-total Src were from Upstate Biotechnology (Lake Placid, NY). Mouse monoclonal and rabbit polyclonal secondary antibodies conjugated with HRP were from Pierce (Rockford, IL). A rabbit polyclonal antibody against the intracellular domain of PTP-α produced at the laboratory of Dr. Jan Sap (University of Copenhagen, Copenhagen, Denmark), was used in this study. The detection systems used for developing Western blots were ECL (GE Healthcare, United Kingdom) and Super Signal, obtained from Pierce (Rockford, IL).
Cell cultures and transfections
Mouse embryonic fibroblasts (MEFs) knockout (PTP-α−/−) and wild-type (PTP-αWT) cells for the PTP-α enzyme were originally isolated from E13- to E15-day-old embryos. PTP-αWT and PTP-α−/− embryos and cells were always derived in parallel from the same pregnancy. Cells were cultured in Dulbecco's modified Eagle's medium (DMEM) supplemented with 10% fetal bovine serum (FBS), penicillin, and streptomycin antibiotics. For spontaneous immortalization, cells were trypsinized and reseeded every 3 days at a density of 106/100-mm dish, as previously described (48). The procedures described were performed in Dr. Jan Sap's laboratory, and immortalized MEFs were provided for the experiments described here.
For experiments, cells were starved with 0.5% FBS for 48 h, as indicated. After becoming confluent, cells were incubated with 0.5 mM SNAP for 30 min or with 10% FBS for 30 min at 37°C.
Plasmid PMJ30 PTP-α (WT) was transfected into PTP-α−/− cells by using Lipofectamine reagent. Transformed cells were selected and cultured with 0.5 mg/ml geneticin disulfate. PTP-α−/− cells permanently transfected with PTP-α were characterized with mRNA and protein expression levels. Three clones expressing PTP-α presenting similar growth properties were selected, and clone A5/3 was used in the experiments.
Immunoprecipitations
MEF cells were lysed in RIPA buffer (20 mM Tris, pH 8.0, 137 mM NaCl, 1% NP 40, 10% glycerol, 1 mM PMSF, 10 μg/ml leupeptin, 10 μg/ml aprotinin, 200 μM vanadate) and had their protein content determined. Equal amounts of protein (500 μg) from lysates were immunoprecipitated with a mouse monoclonal anti-Src antibody (clone GD11). The antibody was previously conjugated with protein G-agarose.
Immunoblotting
For immunoblotting experiments, MEF cells were lysed in lysis buffer [20 mM HEPES, pH 7.5; 150 mM NaCl, 10% glycerol, 1% Triton-X-100, 1.5 mM MgCl2, 1 mM EGTA, 1 μg/ml aprotinin, 1 μg/ml leupeptin, 1 mM PMSF, and the phosphatase inhibitors (2 mM sodium orthovanadate, 50 mM NaF, 10 mM sodium pyrophosphate]. Total cell lysates (60 μg protein/lane) or immunoprecipitated tyrosine Src kinase protein was resolved in 10% sodium dodecyl sulfate (SDS) polyacrylamide gels. Gels were blotted onto nitrocellulose sheets, and blots were probed by using monoclonal or polyclonal antibodies against the signaling proteins Src kinase, FAK, p130Cas and PTP-α. Blots also were probed against the phosphorylated forms of these proteins (Src phospho-Tyr527 and phospho- Tyr416, FAK phosphorylated on Tyr397, p130Cas phosphorylated on Tyr410, and PTP-α phospho-Tyr 789), as indicated. After incubation with an appropriate horseradish peroxidase (HRP)-conjugated secondary antibody, blots were developed by using the ECL or Super Signal systems.
Src kinase activity assay
Src kinase activity from PTP-α−/− and PTP-αWT cells was assessed by an auto-kinase assay. Src kinase was immunoprecipitated from 500 μg of cell lysate with 3 μg of mAb Src (GD11). Immune complexes were collected with 40 μl of a 50% slurry of protein G-agarose. Beads were washed 3 times in kinase buffer (20 mM HEPES, pH 7.5; 150 mM NaCl, 10% glycerol, 0.1% Triton-X, and 10 mM MgCl2). Then 50% of each immunoprecipitate was immunoblotted with anti-Src antibody (GD11) to ensure that equal quantities of Src were used in each assay (not shown). After suspending the beads in 50 μl of kinase buffer containing 25 μM ATP and 10 mCi γ32P ATP (3,000 Ci/mmole), the kinase assay was performed at 30°C for 20 min before termination by addition of SDS/PAGE sample buffer, twice concentrated. Samples were boiled for 5 min and resolved with SDS/PAGE (10% gels). After drying, gels were exposed overnight to autoradiographic films at −80°C. The intensity of the band corresponding to Src kinase was determined with enhanced laser densitometry.
Real-time PCR
Total RNAs were treated with DNase (Invitrogen-Carlsbad, Carlsbad, CA), according to the manufacturer's instructions, and an aliquot of the treated RNA was reverse-transcribed to cDNA by using the SuperScript First-Strand Synthesis System for (Real-time) RT-PCR (Invitrogen). RT-PCR assays were performed by using SYBR Green PCR Master Mix (Applied Biosystems, Warrington, United Kingdom) in a GeneAmp 5700 Sequence Detection System (Applied Biosystems). The primers were obtained from Prodimol (Belo Horizonte, Brazil) and the sequences optimized for RT-PCR were as follows: Src kinase sense: 5′-GAACCCGAGAGGGACCTTC- 3′; Src kinase antisense: 5′-GAGGCAGTAGGCACCTTTTGT-3′. RT-PCRs were performed in triplicate. The parameters for the PCRs were 50°C for 2 min, 95°C for 10 min, 40 cycles of 95°C for 15 s, and 60°C for 1 min. The relative expression ratio (experimental/control) was determined based on the 2-[Δ][Δ]Ct method (6).
Confocal microscopy analysis of S-nitrosylation of Src kinase
Cells grown on glass coverslips were incubated with 0.5 mM SNAP for 30 min and with 10% FBS for 10 min. To prevent the formation of the SNO linkage, treatment of cells with 2 mM HgCl2 for 30 min at 25°C was performed before induction of S-nitrosylation (22). Cells were fixed with 2% paraformaldehyde for 30 min and permeabilized with 0.01% saponin and 1% bovine serum albumin for 10 min at room temperature. After permeabilization, cells were incubated with the anti-SNOCys, the anti-Src kinase, and the anti-phospho-Tyr416 Src kinase antibodies (1:100 dilution) for 1 h. This was followed by incubation with the following secondary antibodies: Texas Red anti-rabbit (1:200 dilution) and FITC conjugated anti-mouse IgG (1:200 dilution), respectively, for 30 min. Coverslips also were incubated with 4',6-diamidine dihydrochloride (DAPI; Boehringer-Mannheim, Germany); dilution, 1:5,000 for 20 min to visualize the cell nucleus. As a negative control, cells stimulated either with 0.5 mM SNAP or with 10% FBS were preincubated with 2 mM HgCl2 for 30 min at 25°C, which selectively displaced NO from S-NO bonds on cysteine residues, preventing the reaction to occur.
Images and the extension of co-localization of total Src and S-nitrosylation and of phospho-Tyr416 Src and S-nitrosylation were determined with a confocal microscope, LSM-510 NLO (Carl Zeiss, Jena, Germany).
Determination of intracellular levels of nitric oxide
For determination of the intracellular levels of NO, cells were preincubated with 5 μM DAF-2DA (4-amino-5-methylamino-2,7-difluorescein diacetate) for 30 min at 37°C in the dark. Once deacetylated by intracellular esterases, DAF-2 remains at the cytoplasm, free to react with NO in the presence of O2, generating the highly fluorescent benzotriazole DAF-2T, detected with excitation/emission maxima of 480/530 nm, respectively (27). Cells were incubated with the appropriated stimuli, and cell-associated fluorescence was analyzed in a FACSCalibur flow cytometer (Becton Dickinson Co., Franklin Lakes, NJ). Results are expressed as DAF2-derived fluorescence (mean fluorescence intensity). Unlabeled samples were used as blanks. Experiments were performed in triplicate.
Quantitative determination of S-nitrosation levels of Src kinase
For immunoprecipitations, 1 × 10⁶ cells were lysed in high-salt buffer (500 mM NaCl, 1% NP-40, 50 mM Tris, pH 8.0; 100 μM EDTA, 10 μg/ml leupeptin, 10 μg/ml aprotinin, 1 mM PMSF, and 10 mM NEM). Immediately after lysis, cells were centrifuged at 10,000 g for 10 min at 4°C. The supernatant was incubated with protein A-Sepharose for 30 min with agitation (pre-cleared). The supernatant containing the proteins was quantified, and 500 μg of proteins from lysates was incubated with 4 μg of mouse monoclonal anti-Src antibody for 2 h at 4°C and protected from light. Immune complexes were collected with 40 μl of protein A-Sepharose for 2 h at 4°C. The immune complexes were washed 3 times in high-salt buffer and then incubated with 70 μl of 100 μM glycine (pH 3. 0) for 10 min. This procedure was repeated 3 times. To the collected supernatant, a 10% sulfanilamide acid solution was added for 10 min to eliminate the nitrite present in sample buffer. Immunoprecipitated Src kinase from PTP-α−/− and PTP-αWT cells was analyzed on silver-staining polyacrylamide gels. The same amount of immunoprecipitated Src kinase obtained from each cell line was then analyzed for its nitrosothiol content. The immunoprecipitates were added into the photolysis unit (Sievers, Boulder, CO) to determine their nitrosothiol content. The concentrations of nitrite and nitroso compounds were determined after reductive cleavage by an iodide/triiodide-containing reaction mixture, and by subsequent determination of the NO released into the gas phase by its chemiluminescent reaction with ozone (O3). NO reacts with O3 to form nitrogen dioxide (NO2); a proportion of the latter arises in an electronically excited state (NO*2), which, on decay to its ground state, emits light in the near-infrared region and can be quantified with a photomultiplier. Provided O3 is present in excess and reaction conditions are kept constant, the intensity of light emitted is directly proportional to NO concentration (15).
Quantitative determination of glutathione and glutathione disulfide
PTP-α−/− and PTP-αWT cells at a density of 1 × 10⁶ per well were lysed in lysis buffer containing 20 mM Hepes, pH 7.5, 150 mM NaCl, 1.5 mM MgCl2, 1 mM EGTA, 10% glycerol, and 1% Triton X-100. After cells were centrifuged at 12,000 rpm for 10 min at 4°C, the supernatant was immediately transferred to Eppendorf tubes and stored at −80°C. GSH and GSSG concentrations were determined essentially as described by Rahman et al. (38).
After obtaining the concentrations of GSH and GSSG, these concentrations were used to calculate the Nernst equation for the reduction potential of the GSSG/2GSH redox pair:
at 25°C, pH 7.0.
The values obtained are a good estimate of the cellular redox environment (42).
Cell-proliferation assay
PTP-αWT and PTP-α−/− cells were cultured in DMEM to 70% confluency (5 × 10³ cells), followed by 48-h period of starvation with DMEM 0.5% FBS. Cells were then exposed to 0.1 mM, 0.5 mM SNAP, or 10% FBS for 30 min. To establish the importance of the redox environment and of the activation of Src kinase in SNAP-induced changes in cell proliferation, cells were respectively preincubated with 10 mM NAC or 2 μM PP2, a potent inhibitor of Src kinase, before stimulation with the nitrosothiol or with serum. Medium was removed, and cells were placed in fresh DMEM without FBS for 48 h at 37°C in a humidified 5% CO2 incubator. MTT [3-(4,5-dimethylthiazolyl-2)-2,5-diphenyltetrazolium bromide] diluted 1:10 from a stock solution of 5 mg/ml in DMEM without FBS was added, and the cells were incubated for 1 h. Absorptions were measured at 570 nm in a microplate reader (E-max; Molecular Devices, Sunnyvale, CA). The difference in optical density between the sample wavelength (570 nm) and the reference wavelength (650 nm) was calculated by using the software SOFTmax version 2.01 (Molecular Devices).
Cell-migration assay
To assess cell migration by using an in vitro “wound” closure assay, MEFs were grown in 24-well plates in DMEM supplemented with 10% FBS. During the period of 24 h before wounding, cells were maintained in serum-free DMEM. To establish the importance of Src kinase and of the redox environment in FBS-induced cell migration, cells were incubated with 2 μM PP2 or 10 mM NAC, respectively, before stimulation with FBS. The cell monolayer was scratched (“wounded”) with a sterile pipette tip, and the migration of cells into the “wounded” area was followed by contrast-phase microscopy. Digital images of the “wounded” area were taken at times 0, 7, and 10 h after wounding. Wound closure was determined by measuring the wound width during the period of examination (10 h). Measurements were performed in triplicate per experimental point.
Statistical analysis
Results are expressed as mean ± SD. Results are the mean of at least three separate experiments in each group. The statistical-analysis significance was assessed with one-way analysis of variance with Student's t test used for comparisons. A value of p < 0.05 was considered statistically significant.
Results
Expression levels of PTP-α and Src kinase in murine fibroblasts
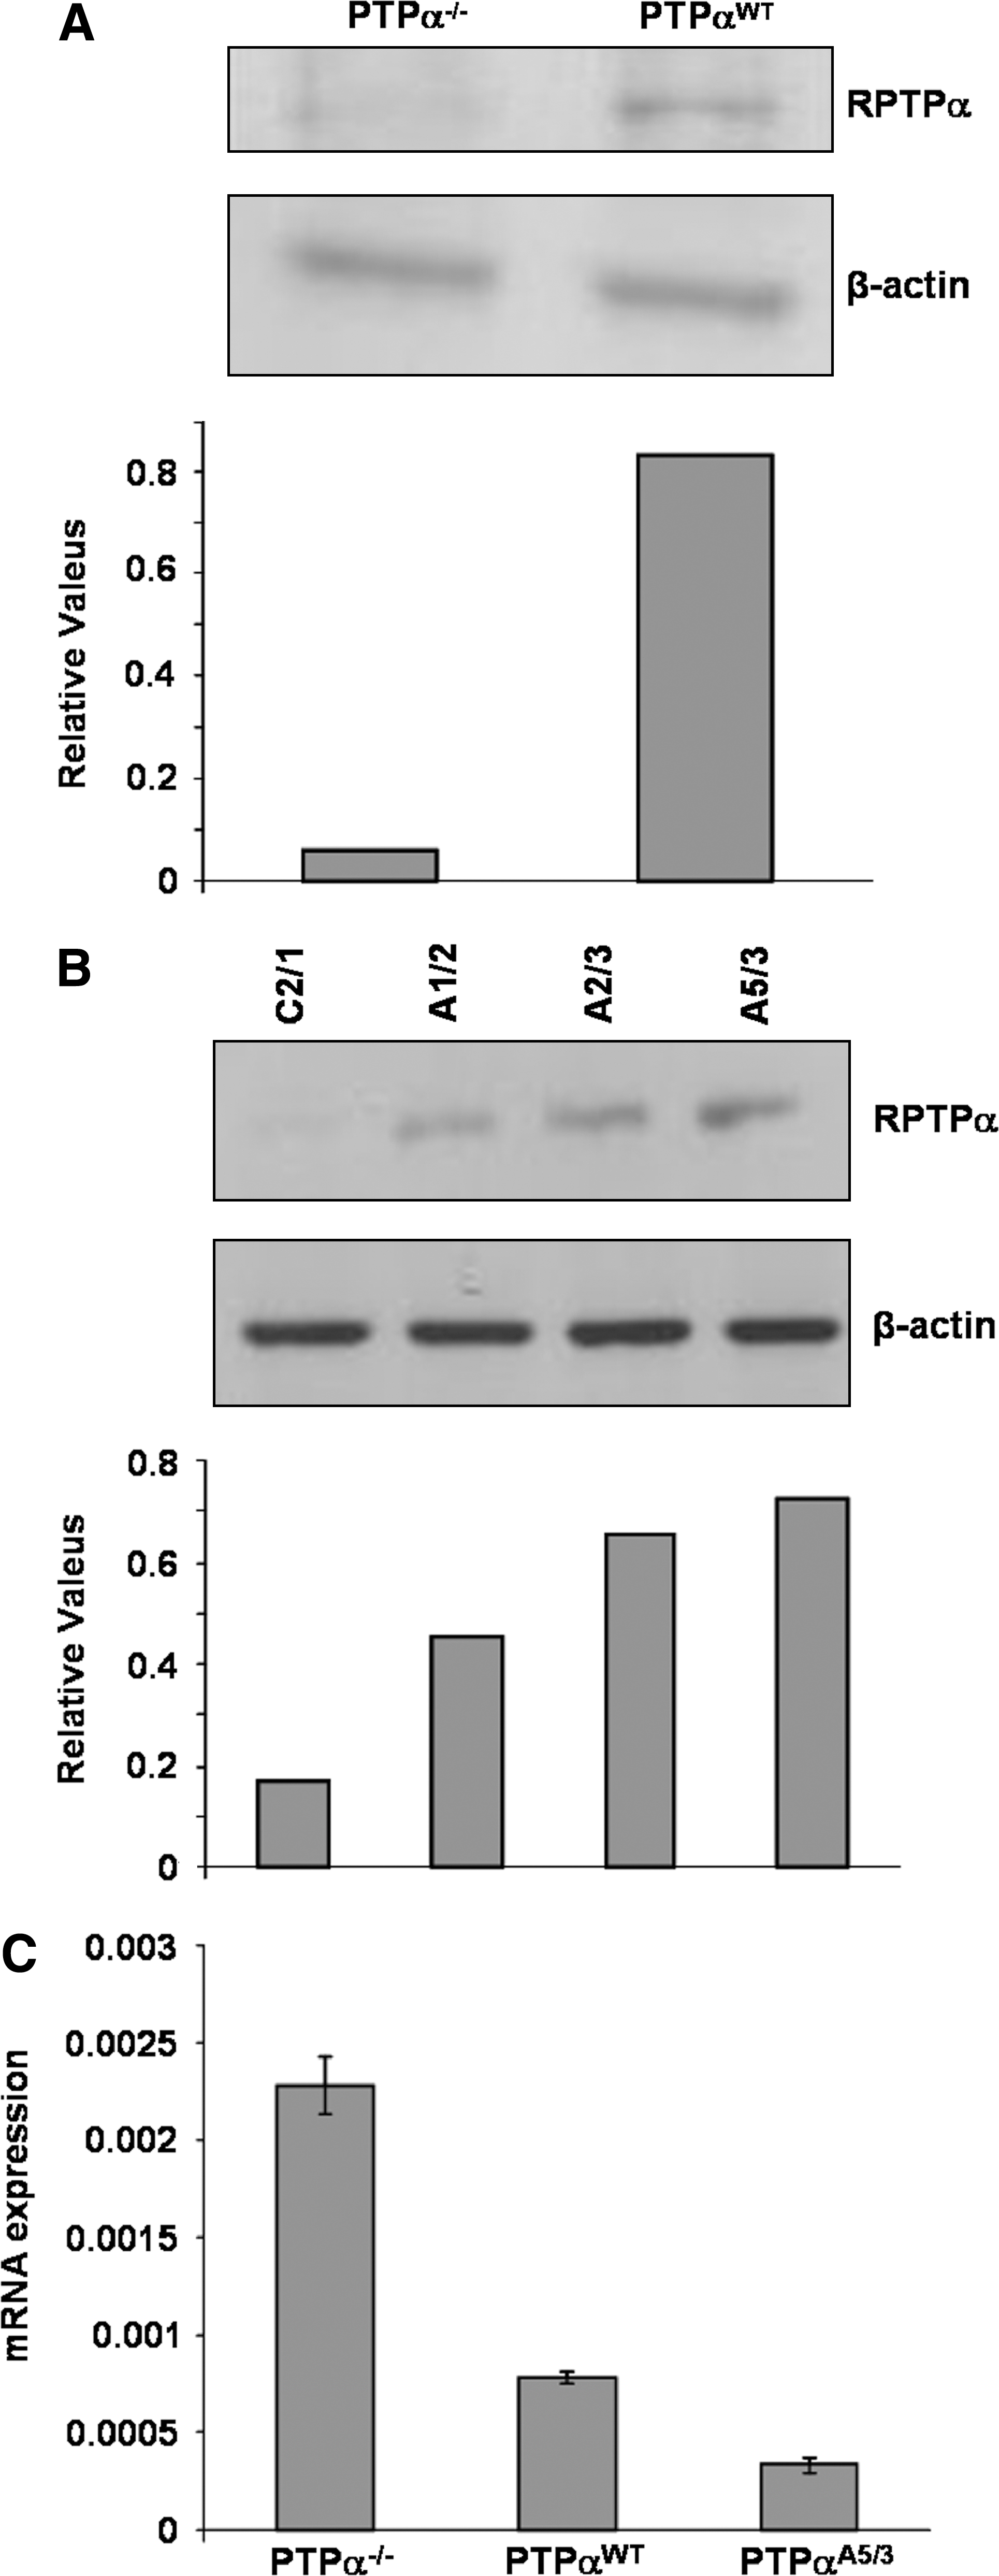
PTP-α−/− and PTP-αWT cells were analyzed for PTP-α expression by anti-PTP-α immunoblotting of protein lysates obtained from their cultures (Fig. 1A). The analysis revealed a single 130-kDa protein band reacting with a rabbit polyclonal antibody anti-PTP-α raised against its monomeric form (130 kDa). Stable transfection of PTP-α−/− cells, with a plasmid encoding the PTP-α (wt) gene, reintroduced the phosphatase in these cells. Western-blot analysis showed three clones (A1/2, A2/3, A5/3) expressing different levels of PTP-α and cells transfected with the empty vector (C2/1) (Fig. 1B). Experiments were performed with the three clones. We showed the representative results obtained by using clone A5/3 (Figs. 1C, 3B, and S2). We also found that Src expression levels in these cells were inversely related to the expression levels of PTP-α. Quantitative real-time PCR–based measurements revealed that Src mRNA expression in PTP-α−/− cells was higher if compared with Src mRNA expression in PTP-αWT cells and in PTP-αA5/3 cells (Fig. 1C).
SNAP modulates tyrosine phosphorylation levels of focal adhesion kinase, p130Cas, and of PTP-α through Src kinase
Previous reports described the focal-adhesion proteins Src, PTP-α, FAK, and p130Cas as important targets for NO-mediated signaling events (16, 33). Taking advantage of using phosphospecific antibodies that recognize Src phosphorylated at Tyr416, FAK phosphorylated at Tyr397, p130Cas phosphorylated at Tyr410, and PP2, a specific inhibitor of Src kinase, we examined their phosphorylation pattern on PTP-αWT cells and PTP-α−/− cells exposed to SNAP. In PTP-αWT cells and in PTP-α−/− cells, SNAP stimulated phosphorylation of Tyr416 on Src kinase. We found that in addition to stimulation of Src phosphorylation, SNAP induced tyrosine phosphorylation of FAK and p130Cas in PTP-α−/− cells. Preincubation of PTP-α−/− cells with the Src inhibitor PP2 followed by stimulation with 0.5 mM SNAP, resulted in inhibition of SNAP-induced phosphorylation of Src at Tyr416, p130Cas at Tyr410, and of FAK at Tyr397 (Fig. 2A).
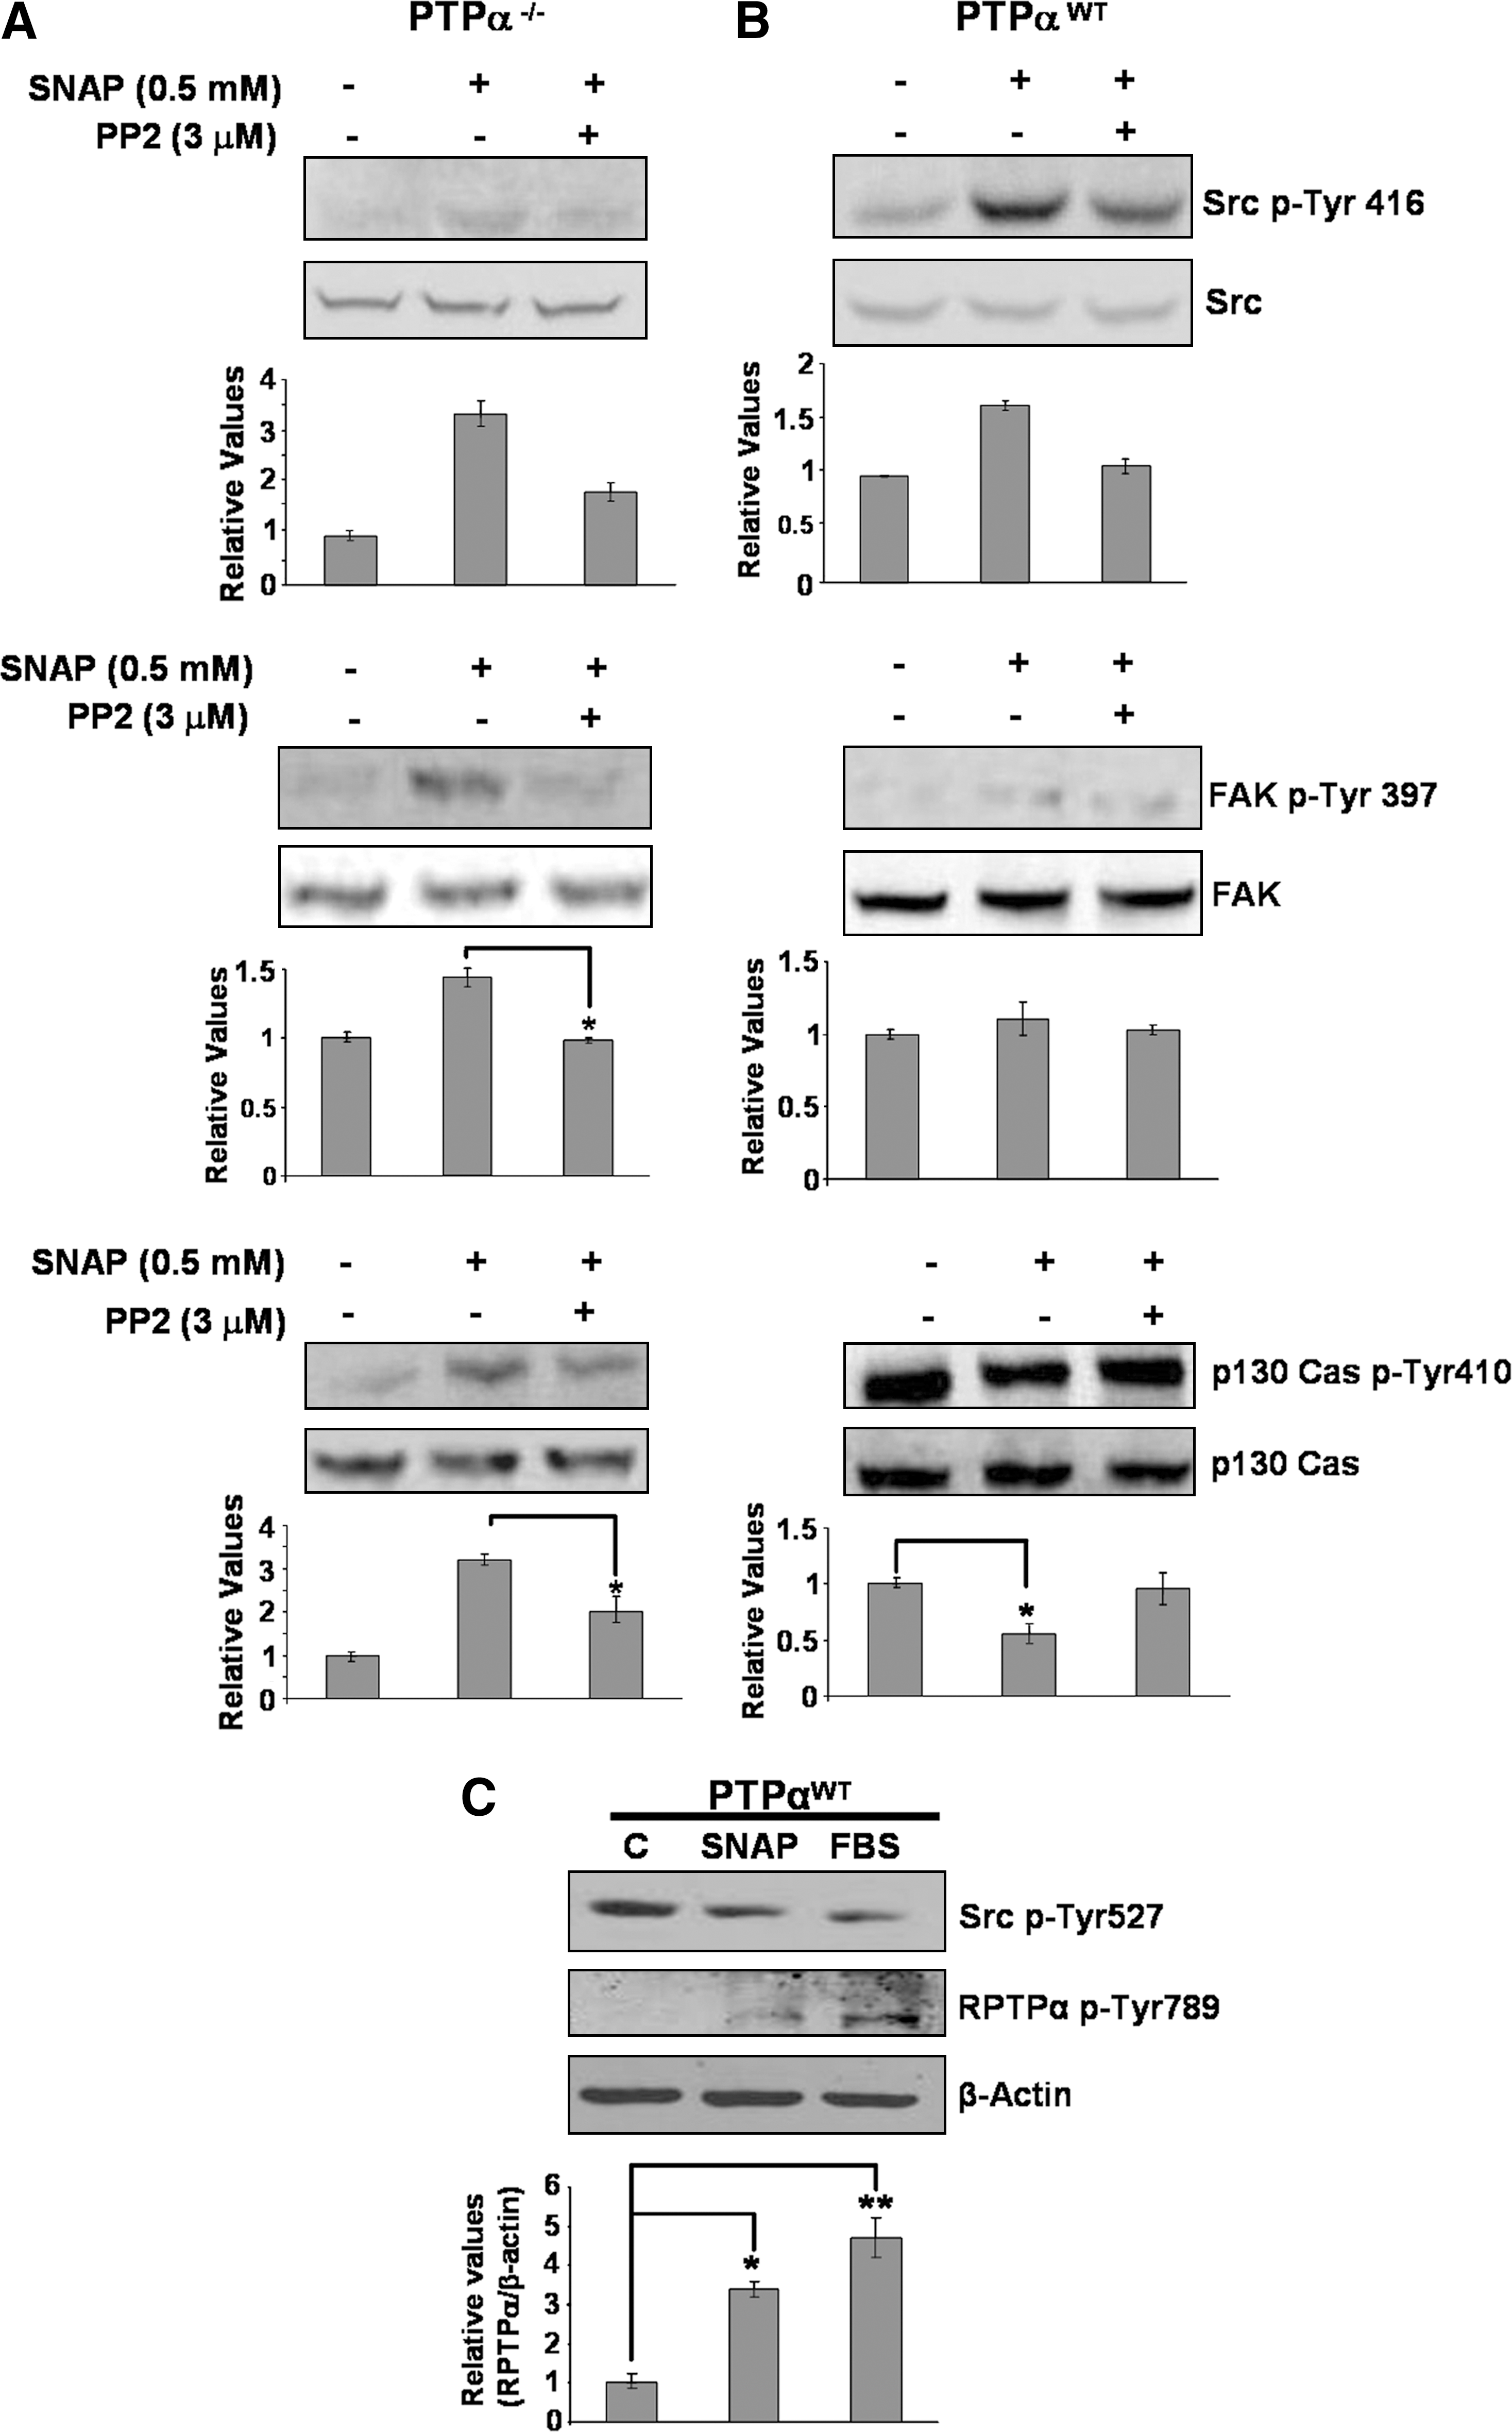
SNAP promoted dephosphorylation of p130Cas and did not change the tyrosine phosphorylation levels of FAK in PTP-αWT cells. Inhibition of Src kinase with PP2 in PTP-αWT cells reversed SNAP-induced tyrosine dephosphorylation of p130Cas (Fig. 2B).
P130Cas was described as an additional substrate for PTP-α (10). In addition, Src family kinases–mediated tyrosine phosphorylation of PTP-α at Tyr789 was described as a positive regulator of the phosphatase activity (47). Serum-starved PTP-αWT cells were incubated either with 10% FBS or with 0.5 mM SNAP. Both SNAP and FBS promoted simultaneous dephosphorylation of Tyr527 on Src kinase and tyrosine phosphorylation of Tyr789 on PTP-α (Fig. 2C).
SNAP and fetal bovine serum stimulate changes in the phosphorylation levels and activation of Src kinase in PTP-α−/− and PTP-αWT cells
We used specific antibodies against the phosphorylated (Tyr416 and Tyr527) forms of Src kinase and compared the SNAP- and FBS-stimulated changes on tyrosine phosphorylation of Src kinase in PTP-α−/− and PTP-αWT cells. Serum-starved (48 h) PTP-α−/− and PTP-αWT cells were exposed to 0.5 mM SNAP or to 10% FBS for 30 min and the phosphorylation levels of Tyr416 and Tyr527 were analyzed by Western blot. In PTP-αWT cells incubated either with 0.5 mM SNAP or with 10% FBS, phosphorylation of Tyr416 was enhanced while simultaneous dephosphorylation of Tyr527 took place (Fig. 3A). In PTP-α−/− cells, phosphorylation of Tyr416 was enhanced on exposure of cells to SNAP or to FBS; whereas phosphorylation levels of Tyr527 remained practically unchanged (Fig. 3A). Reintroduction of the PTP-a (wt) gene into PTP-α−/− cells and stimulation of these cells with SNAP or FBS revealed the same phosphorylation pattern for Src kinase described for PTP-αWT cells (Fig. 3B).
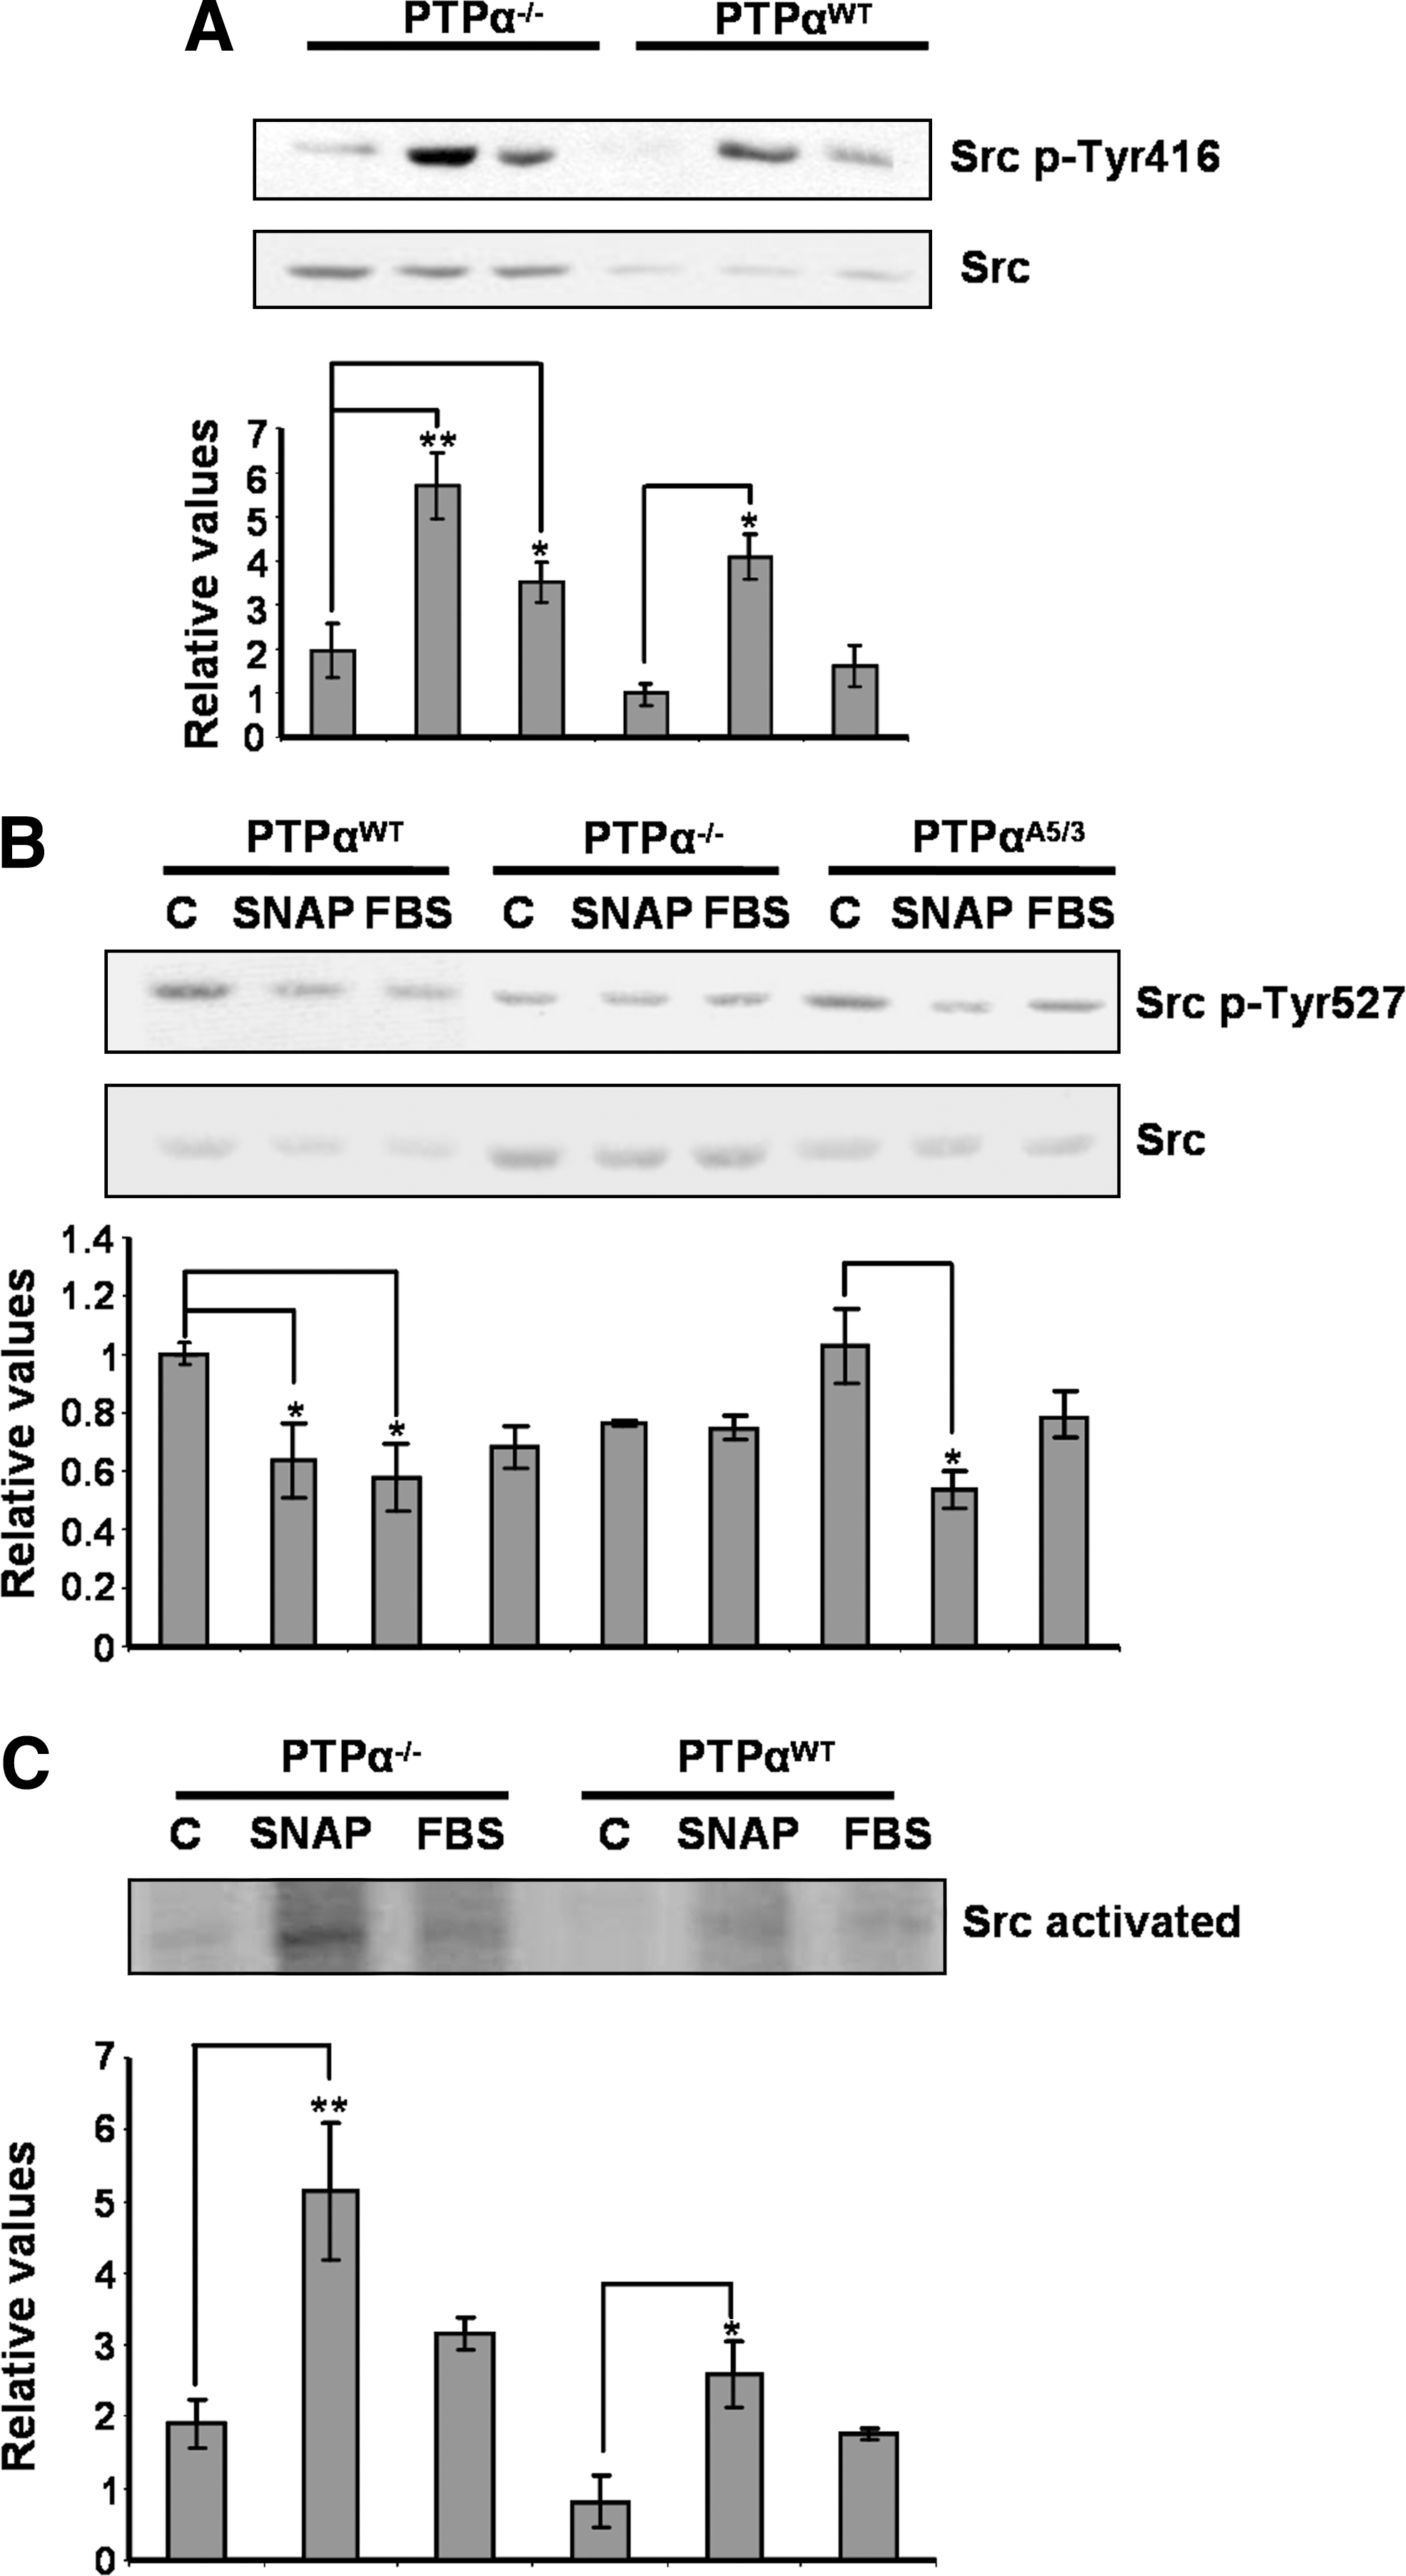
The activity of Src kinase under stimulation with the nitrosothiol or with FBS was determined by using an in vitro autokinase assay. Immunoprecipitated Src kinase from PTP-α−/− and PTP-αWT cells incubated with 0.5 mM SNAP or with 10% FBS was stimulated to phosphorylate itself in an in vitro autokinase assay. Autophosphorylation levels of Src kinase on stimulation with SNAP or with FBS were higher for Src immunoprecipitated from PTP-α−/− cells as compared with the levels found in Src obtained from PTP-αWT cells (Fig. 3C).
SNAP and fetal bovine serum promote differential S-nitrosylation of Src kinase on PTP-α −/− and PTP-αWT cells
The presence of millimolar concentrations of GSH in a cellular environment could minimize S-nitrosylation reactions (5). We determined the levels of GSH/GSSG for both cell lines stimulated with SNAP or with FBS. The redox state of the GSSG/2GSH redox couple was calculated, and the obtained values were applied to the Nernst equation (42). More negative values of the reduction potential were obtained for PTP-αWT cells, suggesting a reducing environment in these cells. Conversely, less negative values of the reduction potential were obtained for PTP-α−/− cells, suggesting an oxidizing environment in these cells (Table 1).
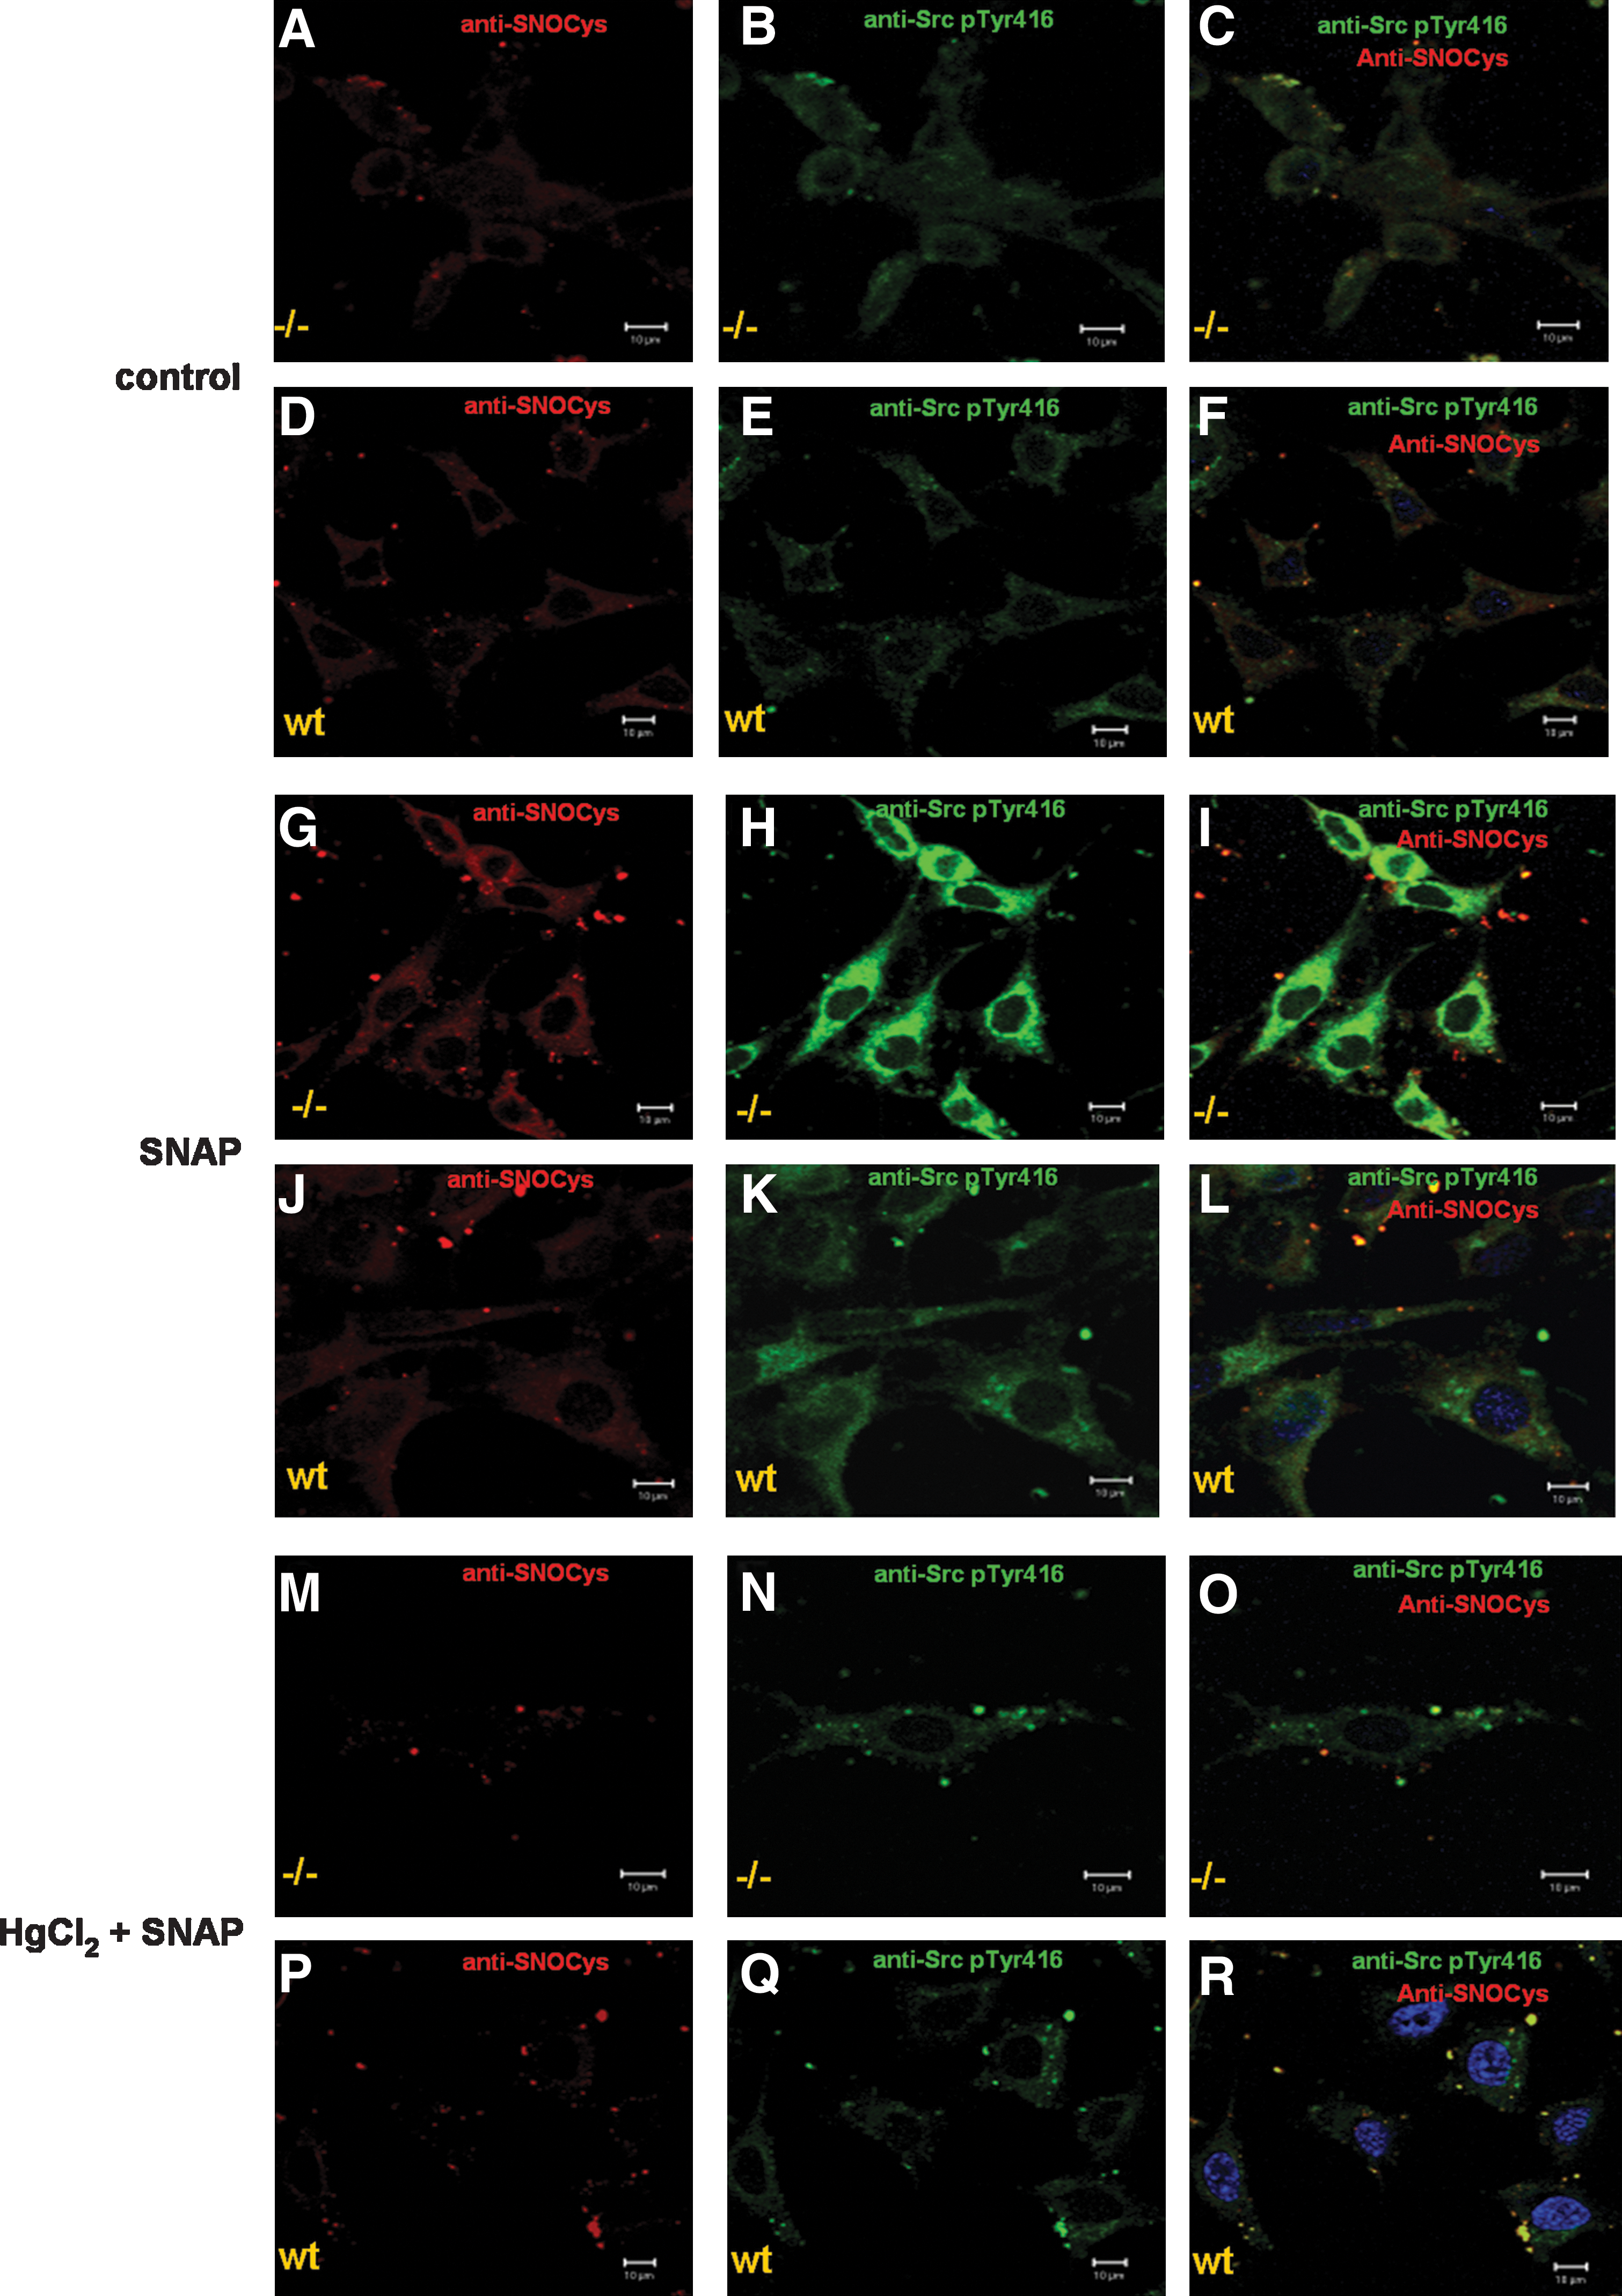
S-Nitrosylation on Src kinase from both cell lines was investigated by using the same experimental conditions for detecting changes in the phosphorylation levels. With a confocal microscopy–based technique and antibodies that recognize nitrosylated cysteines on proteins (anti-SNOCys antibodies) (22) and the phosphorylated Tyr416 residue on Src, we examined the occurrence of S-nitrosylation on Src kinase from both cell lines exposed or not to SNAP during 30 min at 37°C. S-nitrosylation labeling superimposed with Src kinase labeling in PTP-α−/− cells incubated with 0.5 mM SNAP. In contrast to PTP-α−/− cells, S-nitrosylation labeling was slightly superimposed on Src kinase labeling in PTP-αWT cells, suggesting that nitrosylation levels on activated Src kinase differed among the two cell lines. Anti-SNOCys antibody reactivity was greatly reduced by treating cells with 2 mM HgCl2 before treatment of cells with the nitrosothiol (Supplemental Fig. 1; see
S-nitrosylation of Src kinase also was determined on PTP-α−/− cells that were stably transfected with the PTP-α (wt) gene and incubated with 0.5 mM SNAP (PTP-αA5/3 cells). In this case, nitrosylation levels of Src kinase were qualitatively similar to those detected in PTP-αWT cells (Supplemental Fig. 2; see
We further investigated the relation between Src activation by tyrosine phosphorylation and S-nitrosylation again by using confocal-microcopy–based measurements. Accordingly, S-nitrosylation labeling can be superimposed with phospho-Tyr416 Src kinase labeling in PTP-α−/− cells incubated with 0.5 mM SNAP. Anti-phospho-Tyr416 Src kinase antibody reactivity was strongly stimulated after treatment with SNAP. On the contrary, in PTP-αWT cells incubated with 0.5 mM SNAP, the anti-phospho-Tyr416 Src kinase antibody reactivity was less intense. In agreement with the observations made for colocalization of S-nitrosylation labeling on total Src kinase labeling, S-nitrosylation labeling was less superimposed on phospho-Tyr416 Src kinase labeling in PTP-αWT cells. Incubation of both cell lines with 2 mM HgCl2 before exposure to the nitrosothiol resulted in great reductions in anti-SNOCys antibody and in anti-phospho-Tyr416 Src kinase antibody reactivities (Fig. 4A–R and for the determinations of colocalization, refer to Supplemental Fig. 3; see
Stimulation of PTP-α−/− cells and PTP-αWT cells with FBS, a physiologically relevant agonist of Src kinase, revealed a differential expression of the inducible isoform of NO synthase (iNOS). Expression of iNOS was strongly stimulated by 10% FBS in PTP-α−/− cells as compared with PTP-αWT cells (Fig. 5, upper left panel). As PTP-α−/− and PTP-αWT cells constitutively express iNOS, we next determined whether iNOS activation and subsequent NO production were influenced by FBS. Direct determination of NO produced in cells was obtained after incubation of cells with the fluorescent dye DAF2-DA (for details, see Materials and Methods). The dye-loaded cells showed an increase in fluorescence intensity after 30-min incubation with FBS. Higher levels of NO were produced in PTP-α−/− cells, as compared with the levels generated by PTP-αWT cells (Fig. 5, upper right panel).
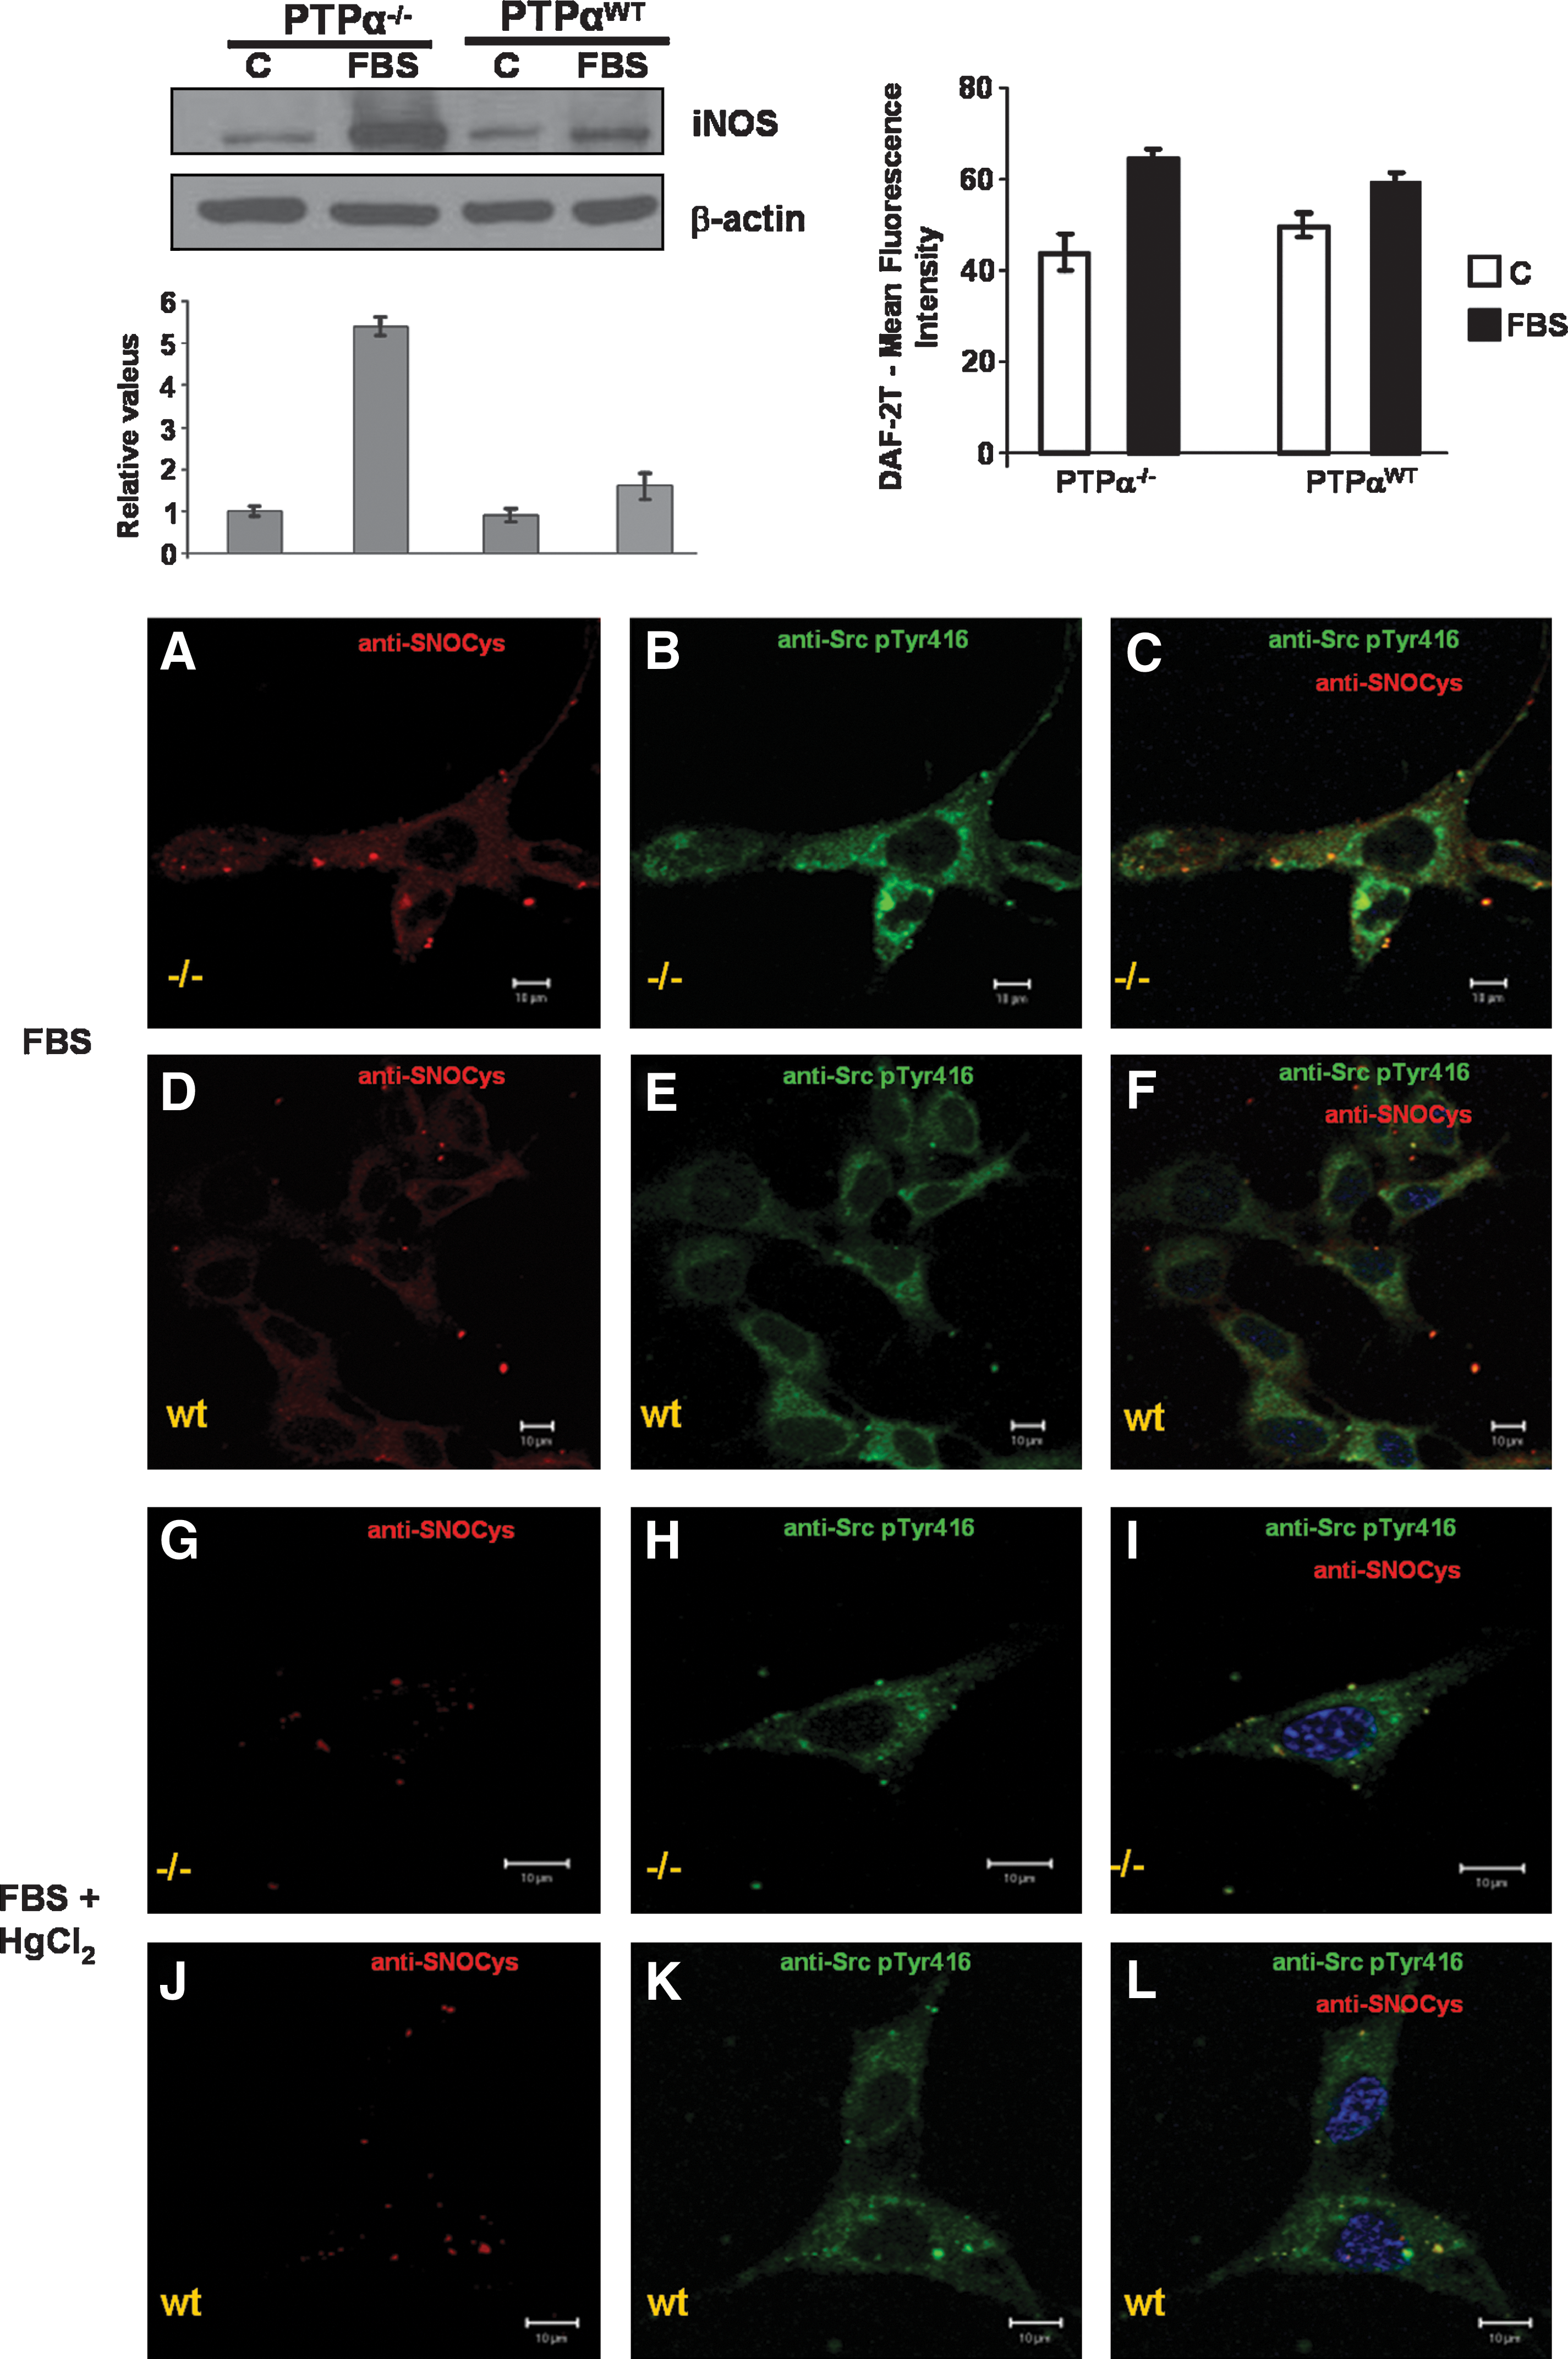
S-nitrosylation of Src kinase and of its activated form, phospho-Tyr 416 Src kinase, was determined in PTP-α−/− cells and in PTP-αWT cells with confocal microscopy. The same pattern described for S-nitrosylation of Src kinase resulting from addition of exogenous nitrosothiol (SNAP) was observed after stimulation of both cell lines with FBS. S-Nitrosylation labeling can be strongly superimposed with phospho-Tyr416 Src kinase and total Src kinase labeling in PTP-α−/− cells incubated with FBS. The opposite is true for PTP-αWT cells incubated with FBS; S-nitrosylation labeling was less superimposed on total Src kinase and on phospho-Tyr416 Src kinase labeling in PTP-αWT cells. Incubation of both cell lines with 2 mM HgCl2 before stimulation with FBS strongly prevented anti-SNOCys antibody and anti-phospho-Tyr416 Src kinase antibody reactivities (Fig. 5A–L, and for the determinations of colocalizations, refer to Supplemental Fig. 4; see
In addition, we examined the occurrence of S-nitrosylation on PTP-α. S-Nitrosylation was absent in PTP-α expressed in PTP-αWT cells incubated either with 0.5 mM SNAP or with FBS (not shown).
These observations suggested that S-nitrosylation levels of Src kinase were qualitatively higher in PTP-α−/− cells than in PTP-αWT cells. In addition, S-nitrosylation of Src kinase promoted by endogenous or exogenous sources reflects on kinase activity by stimulating phosphorylation on Tyr416 residue. Results also indicate that in this experimental model, S-nitrosylation occurred preferentially on Src kinase and did not occur on PTP-α.
To determine the actual concentrations of NO generated after SNAP being metabolized intracellularly, we loaded PTP-α−/− cells and PTP-αWT cells with DAF2-DA and incubated them with 0.5 mM SNAP. The dye-loaded cells showed a differential increase in fluorescence intensity 30 min after the addition of the nitrosothiol. Higher intracellular levels of NO were detected in PTP-α−/− cells as compared with the levels measured in PTP-αWT cells (Fig. 6, upper panel).
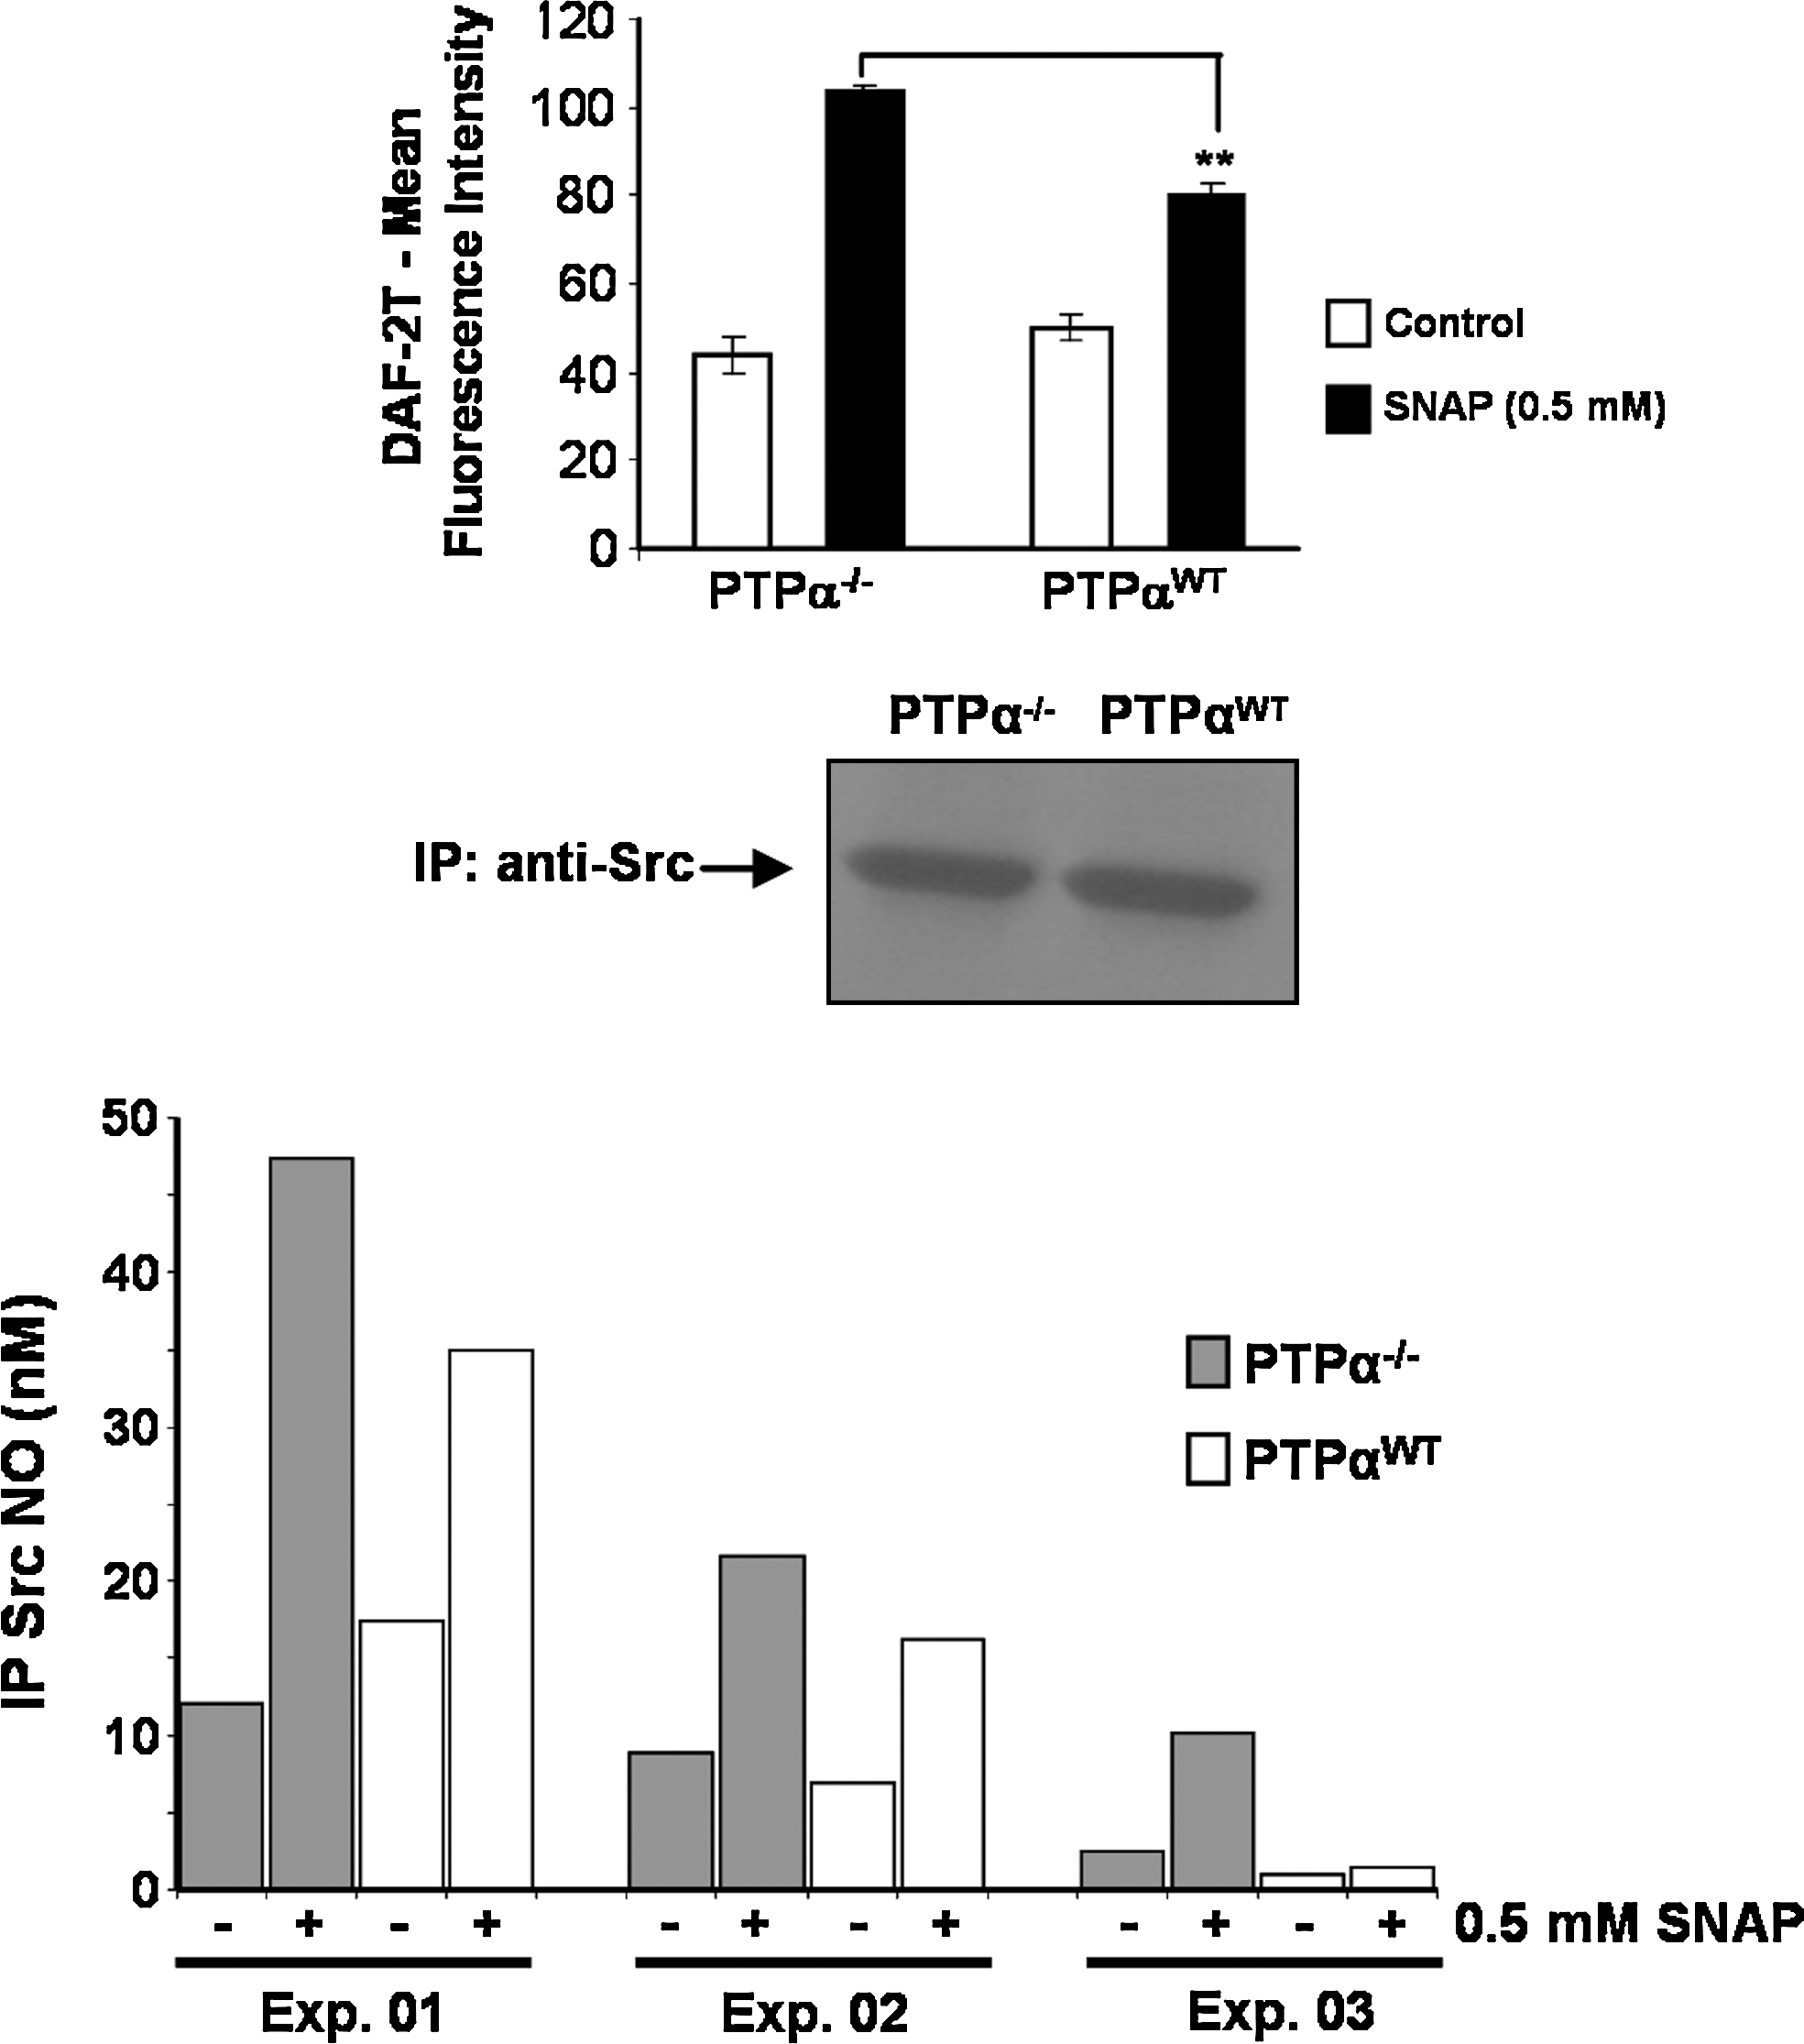
Quantification of S-nitrosylation was obtained after immunoprecipitation of the same amount of Src kinase from PTP-α−/− and PTP-αWT cells exposed to 0.5 mM SNAP (Fig. 6, middle panel). Nitrosylation levels of the immunoprecipitates were quantitated by using the Nitric Oxide Analyzer–based method developed by Feelisch et al. (15) and modified in our laboratory (see details in Materials and Methods). Immunoprecipitation of Src also was performed with an isotype-matched control antibody (IgG2a), and the protein was not immunoprecipitated with this antibody (not shown). S-Nitrosylation levels of Src kinase immunoprecipitated from PTP-α−/− cells were significantly higher than the nitrosylation levels of Src kinase obtained from PTP-αWT cells. Basal nitrosothiol levels on Src kinase from PTP-α−/− cells corresponded to approximately 12 nM (first experiment), 7 nM (second experiment), and 2 nM (third experiment). On treatment of the cells with SNAP, nitrosothiol levels increased to 47 nM, 22 nM, and 11 nM, respectively. Conversely, basal nitrosothiol levels on Src kinase from PTP-αWT cells corresponded to approximately 18 nM (first experiment), 8 nM (second experiment), and 1 nM (third experiment). Treatment with SNAP increased the nitrosothiol levels to ∼35 nM, 15 nM, and 1.5 nM, respectively. We normalized the values of nitrosothiol levels obtained after SNAP treatment, representing them as percentages of increment above basal values. Basal values were considered to be 100% for normalization purposes. For PTP-α−/− cells, the mean increment on nitrosothiol levels of Src kinase was 419.6 ± 118.9%. Conversely, for PTP-αWT cells, the mean increment on nitrosothiol levels of Src kinase was 177.3 ± 23.9% (Fig. 6, lower panel).
The intracellular redox environment and the expression of PTP-α modulate SNAP-induced proliferation in mouse embryo fibroblasts.
We determined an intracellular oxidizing environment in PTP-α−/− cells, as compared with an intracellular reducing environment in PTP-αWT cells (Table 1). Under these conditions, NO/nitrosothiol signaling could be differentially modulated (54). By exposing the two cell lines to different concentrations of SNAP (0.1 and 0.5 mM) we sought to relate these differences to cellular proliferation. Our data demonstrated that PTP-αWT cells proliferate on the stimulus of both concentrations of SNAP. We found a strong stimulation of proliferation of PTP-αWT cells exposed to 0.1 mM SNAP. Furthermore, incubation of PTP-αWT cells with 0.5 mM SNAP also resulted in significant stimulation of cell proliferation. By contrast, incubation of PTP-α−/− cells with 0.5 mM SNAP resulted in growth arrest. Only if PTP-α−/− cells were exposed to 0.1 mM SNAP was a proliferative response noted. Pretreatment of cells with NAC, a GSH precursor, inhibited 0.5 mM SNAP-induced proliferation of PTP-αWT cells, whereas it reversed the growth-arrest effects on PTP-α−/− cells exposed to the same concentration of the nitrosothiol. Interestingly, the proliferative response observed on both cell lines after exposure to 0.1 mM SNAP was ablated after enhancement on their intracellular GSH levels because of NAC treatment (Fig. 7A).
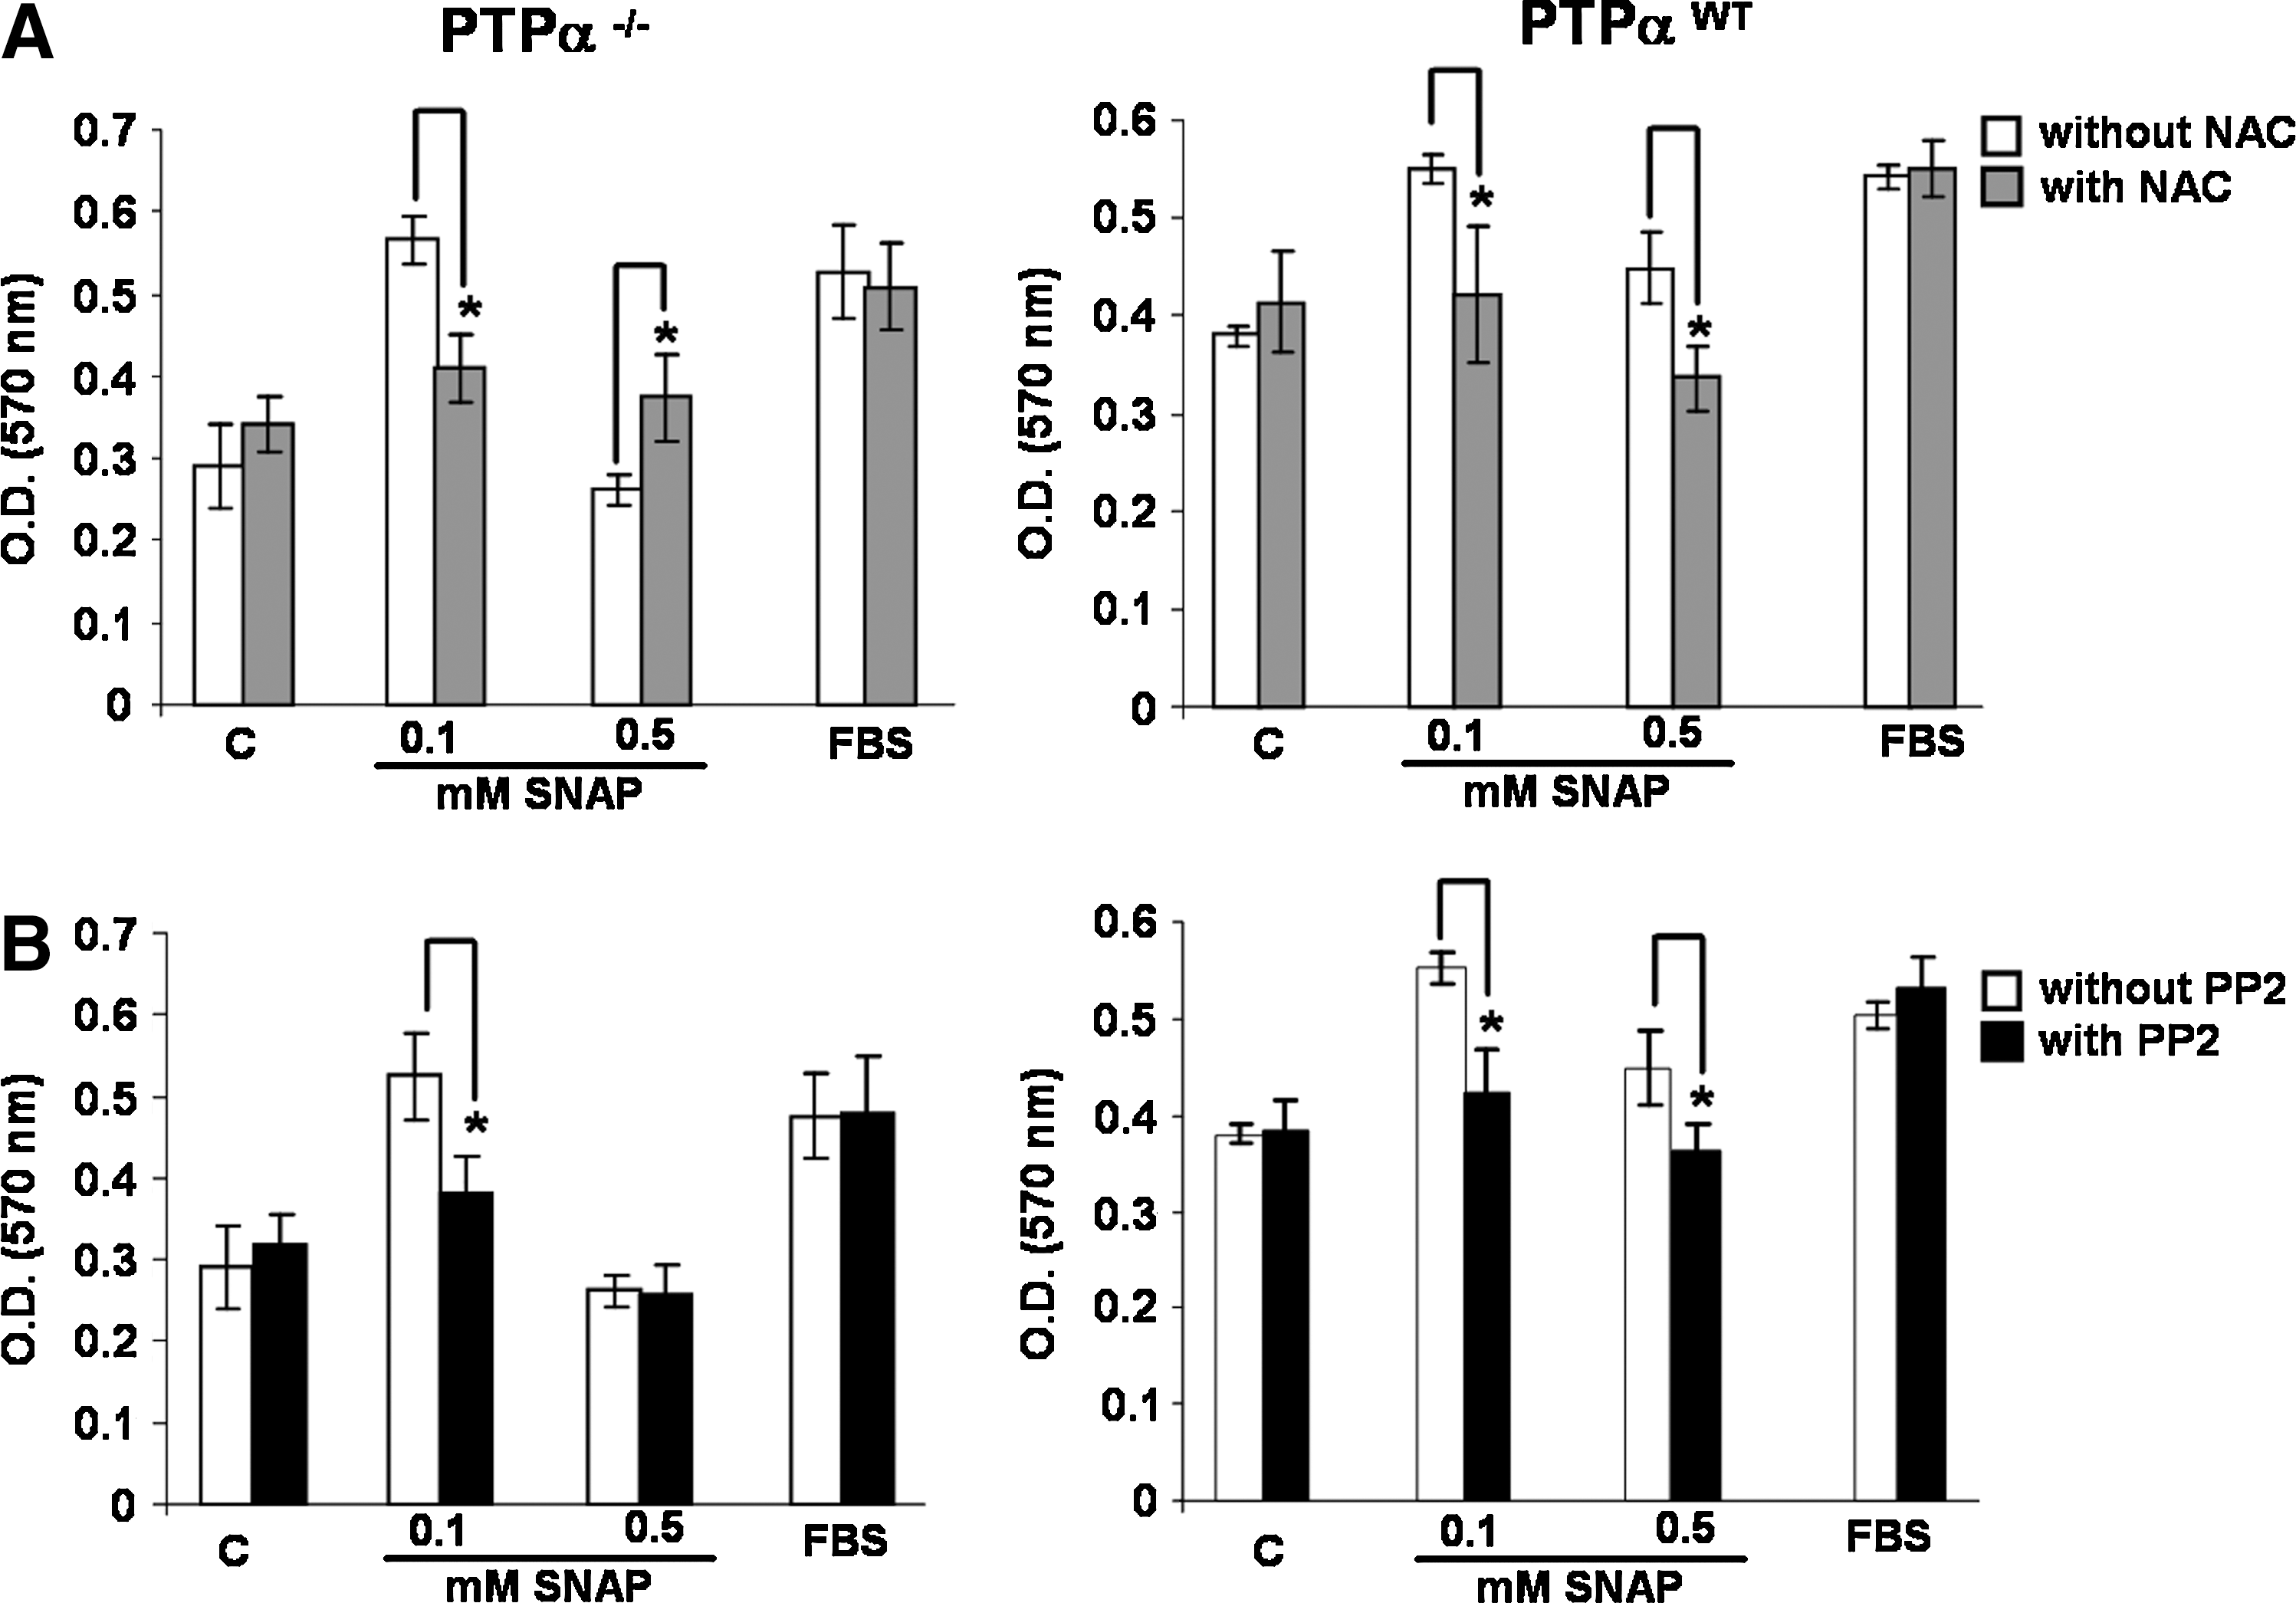
We also examined the participation of Src kinase in the proliferative/nonproliferative responses induced by SNAP on both cell lines. Preincubation of PTP-αWT cells and PTP-α−/− cells with 2 μM PP2, a potent and selective inhibitor of Src kinase, blocked the proliferative response induced by SNAP (Fig. 7B). Incubation of both cell lines with FBS resulted in proliferation, which was not affected by NAC or by PP2 (Fig. 7A and B).
The intracellular redox environment and the expression of PTP-α modulate FBS-stimulated cell migration in mouse embryo fibroblasts
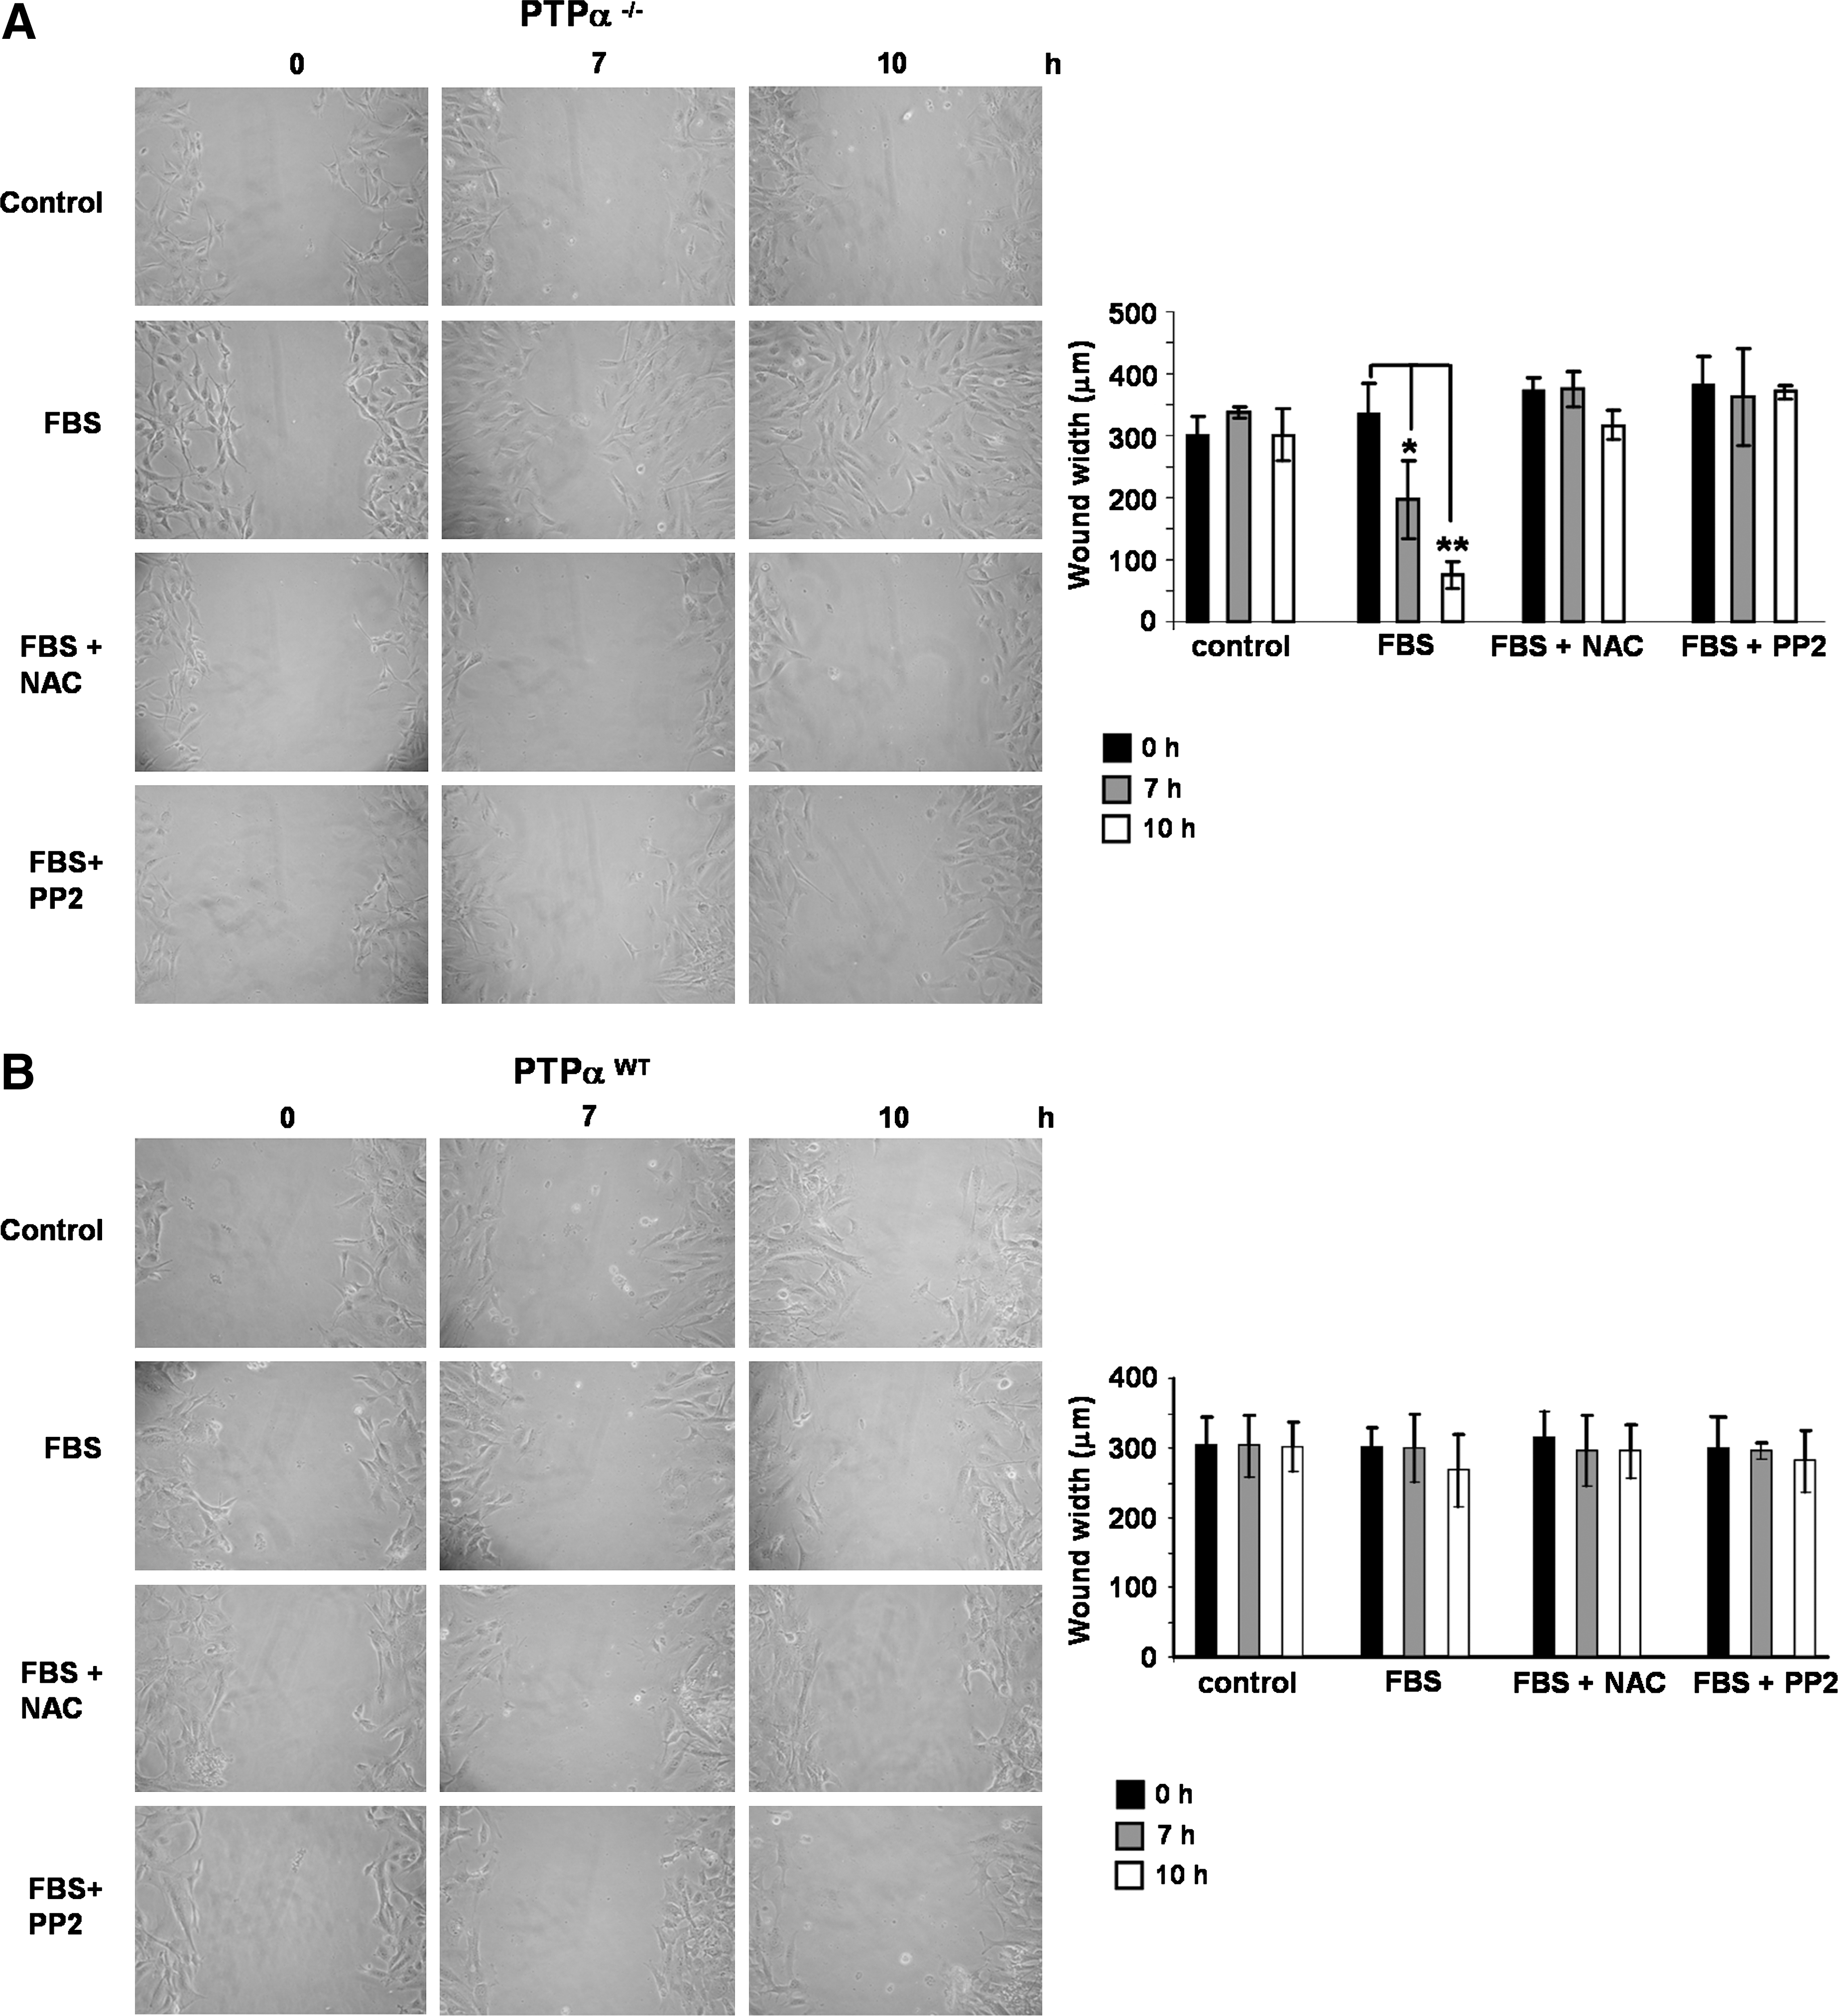
In addition to cell proliferation, interactions of Src with FAK and other focal adhesion–associated proteins result in modulation of cell adhesion and migration (43). The migration capacities of PTP-αWT and PTP-α−/− fibroblasts were examined in a cell culture “wound closure” assay. Confluent wells of cells were “wounded” by scraping with a pipette tip, creating a space free of cells. PTP-α−/− cells close the gap by 10 h after stimulation with 10% FBS, whereas in the absence of stimulation, cells were unable to fill the gap within this period. A significant delay in the FBS-stimulated ability of PTP-α−/− cells to migrate into the empty space was observed after preincubation either with PP2 (2 μM) or with NAC (10 mM) (Fig. 8A). Conversely, PTP-αWT cells preincubated or not with PP2 or with NAC were not significantly stimulated to migrate into the empty space by 10% FBS during the total period of 10 h (Fig. 8B). Addition of SNAP did not stimulate cell migration during the period of 10 h (not shown).
Discussion
The structural design of Src kinase allows its regulation at multiple levels, including redox regulation. The intramolecular interaction between phospho-Tyr527 at the carboxy-terminal domain of Src kinase and its SH2 domain forms the binding pocket, maintaining the enzyme in an inactive state (41). The inactive conformation of the kinase is unlatched when phospho-Tyr527 is dissociated or is displaced from the SH2 domain at the binding pocket. It is well established that dissociation of phospho-Tyr527 allows its dephosphorylation by a specific PTP, PTP-α (48). However, v-Src kinase, which lacks the domain containing phospho-Tyr527, is not regulated by dephosphorylation (7). Therefore, regardless of the presence of a PTP, conformational changes such as those imposed by oxidation–reduction reactions could destabilize the structure of Src kinase for activation. Early observations pointed to a redox-based regulation of the tyrosine phosphorylation levels of Src kinases in murine fibroblasts and in T lymphocytes (33, 36). Results from prior studies indicate that NO donors such as the nitrosothiol SNAP promoted tyrosine phosphorylation of Src kinase (33). Putative NO-mediated modifications on sulfhydryl groups of Src kinase allowed the kinase activation through a mechanism independent of dephosphorylation of phospho-Tyr527 (2). However, many other potential interactions occur between NO, PTPs, and Src kinase.
Early observations by our group described tyrosine phosphorylation–stimulatory properties of NO (37). Furthermore, we and others described changes on the phosphotyrosine content of Src promoted by exogenous NO sources. NO-stimulated tyrosine phosphorylation of Src was accompanied by recruitment and induction of tyrosine phosphorylation of FAK, a focal adhesion protein (2, 33).
By using the MEF cells PTP-α−/− and PTP-αWT, we were able to present an in-depth description of the NO-mediated signaling pathways involving focal adhesion proteins. The study performed with the two cell lines allowed us to show that the nitrosothiol SNAP-induced activation of Src triggered two different signaling cascades. In PTP-α−/− cells, the signaling cascade involved the participation of the focal adhesion proteins FAK and p130Cas. In PTP-αWT cells, PTP-α and p130Cas participate in the signaling cascade (Fig. 9A).
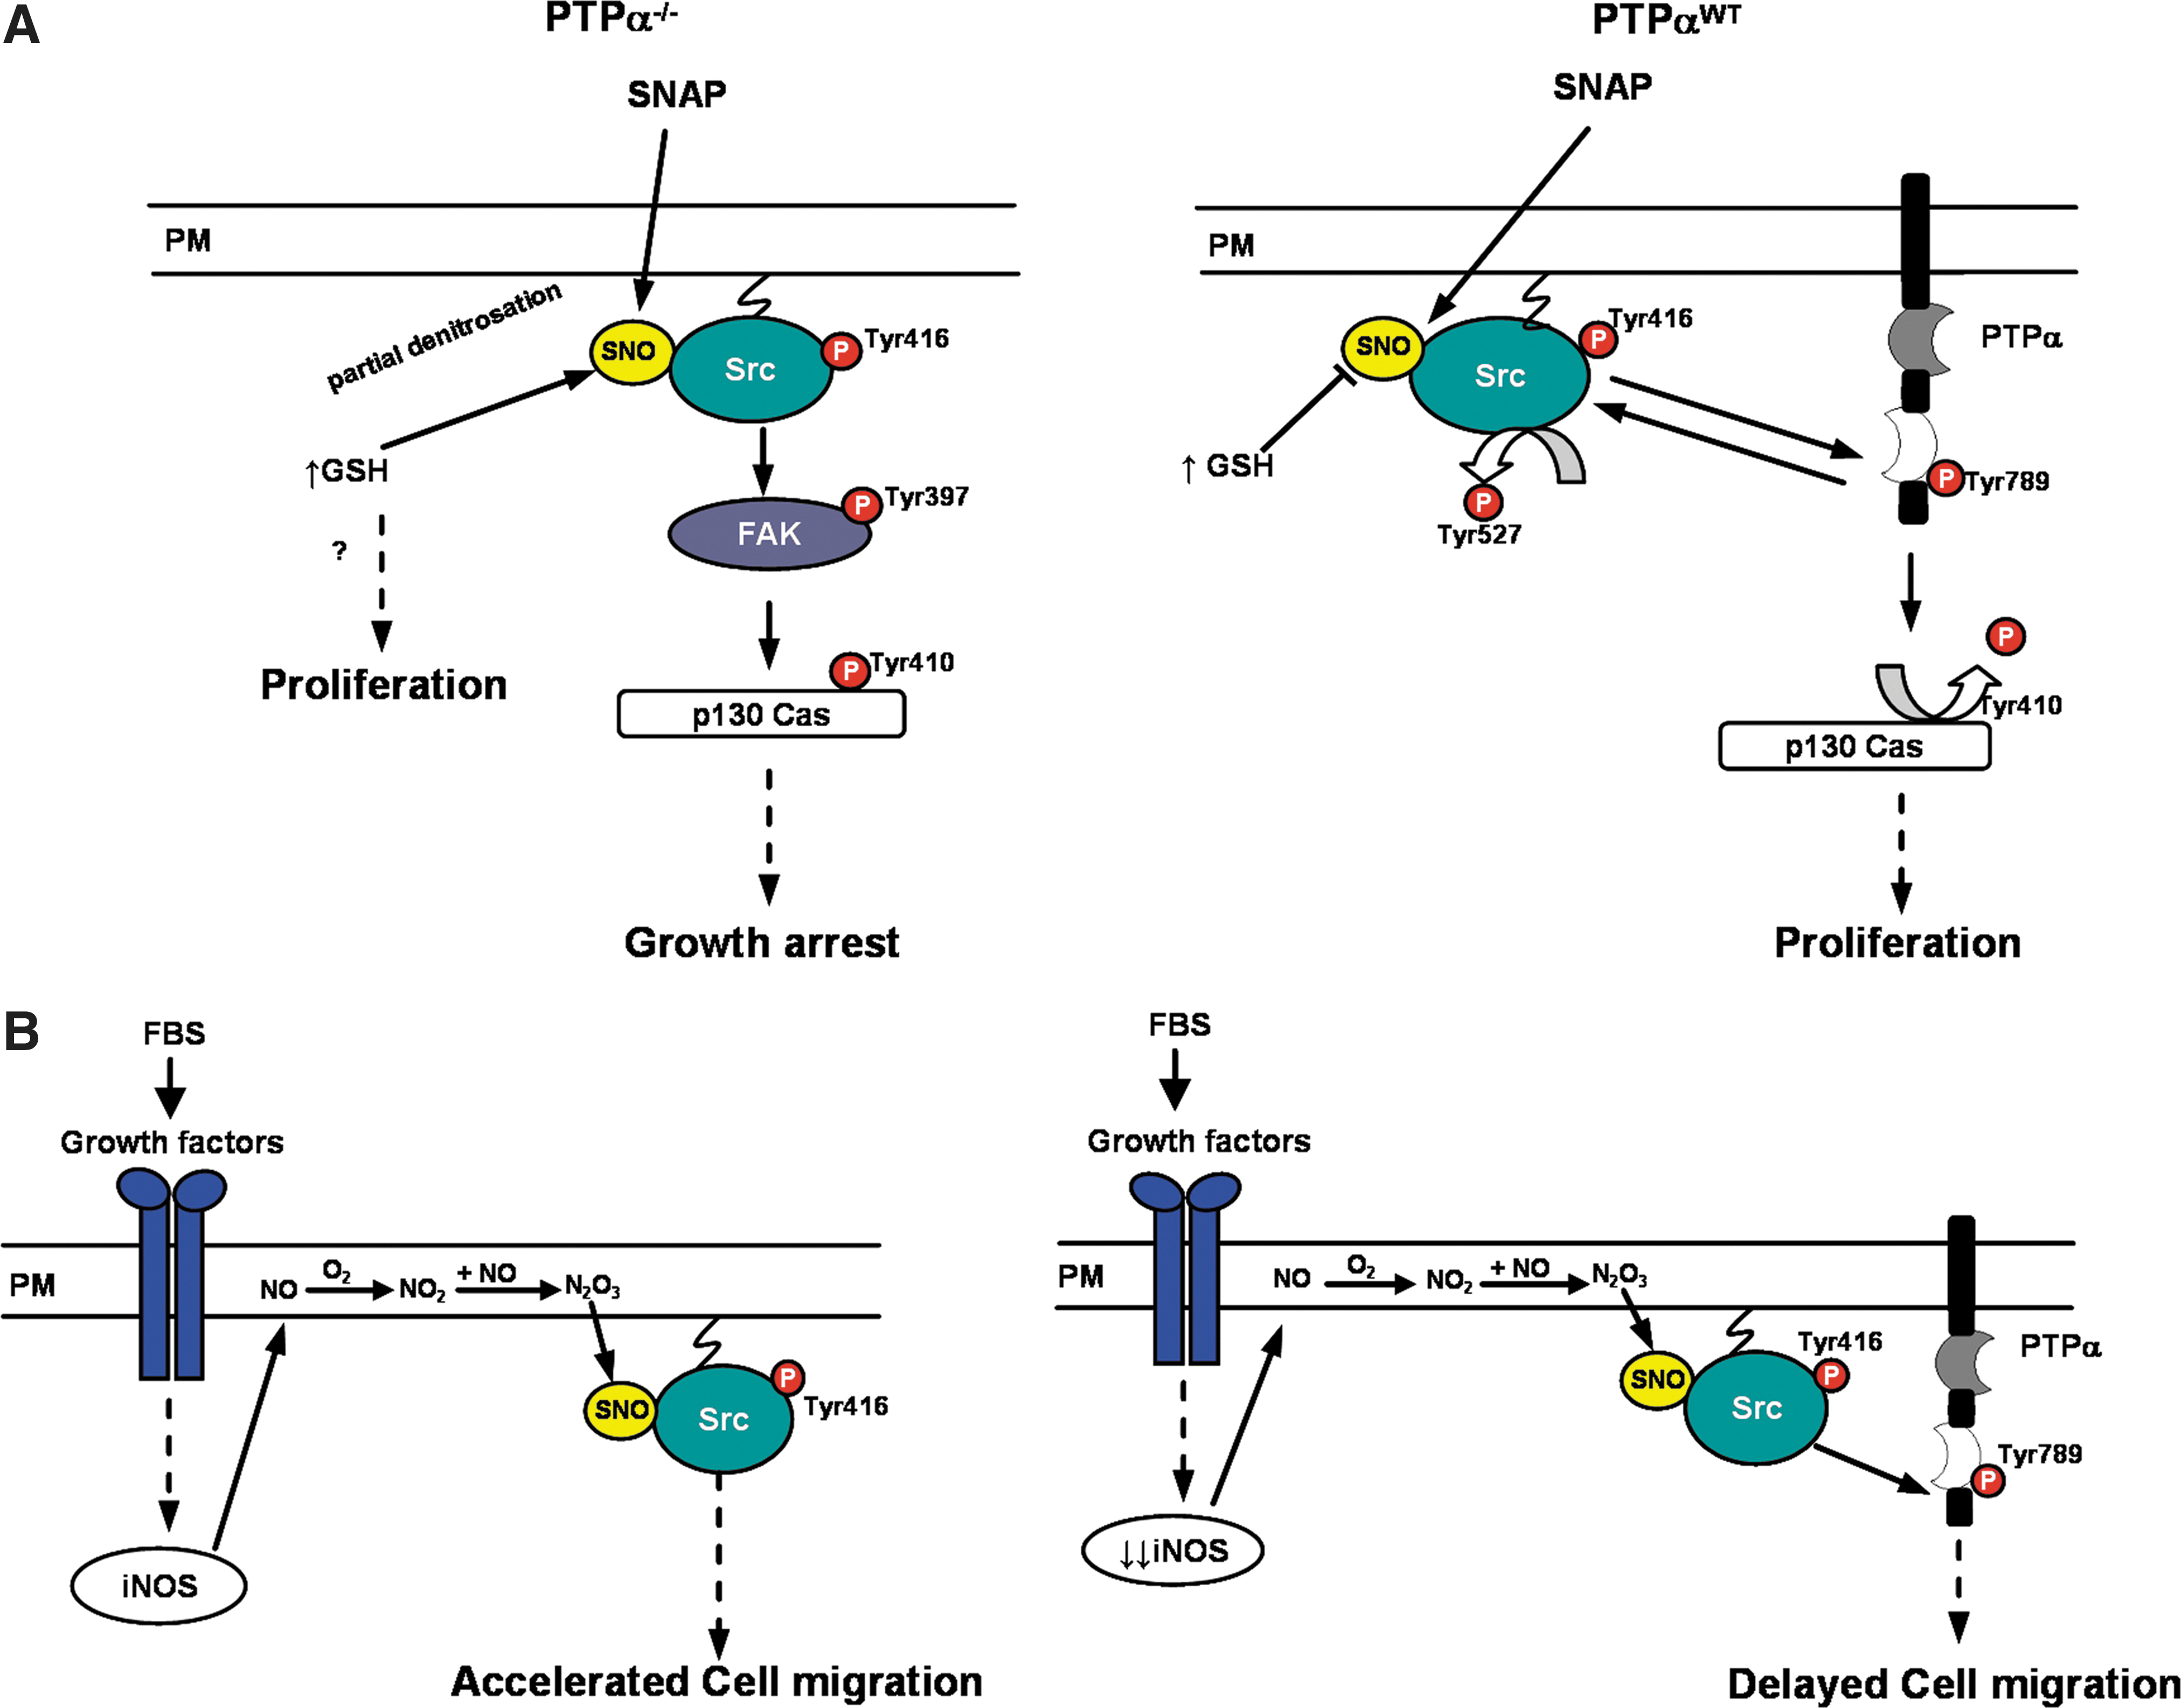
Interactions of FAK with Src are associated with signals arising from integrin ligation (44). Phosphorylation of Tyr397 on FAK is mainly due to autophosphorylation, and this creates a high-affinity binding site for the SH2 domain of Src kinase (30). Our previous work showed that increasing concentrations of the NO-donor sodium nitroprusside promoted the association of FAK with Src (33). Zeng et al. (55) showed that PTP-α−/− fibroblasts were characterized by markedly reduced levels of phospho-Tyr397. We showed that levels of phosphorylation of FAK at Tyr397 were stimulated in PTP-α−/− cells exposed to SNAP. These findings strongly suggest that SNAP-induced FAK tyrosine phosphorylation is directly regulated by Src kinase activity. The Src-FAK complex mediates the phosphorylation of the so-called FAK-associated proteins such as p130Cas (44). P130Cas is an adaptor protein with multiple domains that is at least partially located at focal adhesion sites (17). SNAP-stimulated tyrosine phosphorylation levels of p130Cas in PTP-α−/− cells. Inhibition of Src by PP2 blocked SNAP-induced tyrosine phosphorylation levels of FAK and of p130Cas, suggesting a connection between the three signaling proteins.
Conversely, levels of phospho-Tyr397 of FAK on PTP-αWT did not change with treatment with SNAP. In PTP-αWT cells, phosphorylation of Tyr410 on p130Cas diminishes on stimulation with SNAP, suggesting that the nitrosothiol mediates the activation of a tyrosine phosphatase. PP2 blocked the SNAP-induced dephosphorylation of p130Cas, implying the direct participation of Src in the phosphatase activation. Early observations described p130Cas as an in vivo substrate for PTP-α (10), and our findings indicated that SNAP, similar to FBS, stimulated tyrosine phosphorylation of PTP-α on Tyr789, and dephosphorylation of Tyr527 on Src, which stimulates the kinase. Although PTP-α is a positive regulator of Src activity by maintaining its overall phosphorylation status, it is also a substrate for the kinase (47). PTP-α is phosphorylated by Src at Tyr789, which causes a displacement of the SH2 domain of the kinase, thereby exposing Tyr527 at the carboxy terminal of Src to the action of the phosphatase (47, 49) (Fig. 9A).
Like all PTPs, PTP-α contains a conserved cysteine residue in the catalytic domain as well as other potentially modifiable residues, which can be redox regulated (34, 51). Nitrosothiols such as SNAP have the potential to nitrosylate this cysteine residue and regulate the activity of PTP-α, as well as the activity of other PTPs (11). However, we did not detect S-nitrosylation of PTP-α in PTP-αWT cells incubated with SNAP. These findings suggest that nitrosative-stress conditions such as those used in the present study may impose alternative redox-based regulatory mechanisms for PTP-α signaling. Thus, SNAP-stimulated tyrosine phosphorylation of Tyr789 on PTP-α in PTP-αWT cells may be related to S-nitrosylation and activation of Src kinase in these cells.
The NO-mediated activation of Src kinase was first described as a process independent of dephosphorylation of phospho-Tyr527 (2). Here we confirm these early findings and further demonstrate that similar to FBS, SNAP-mediated activation of Src kinase may also occur with dephosphorylation of phospho-Tyr527 in PTP-αWT cells and in PTP-α−/− cells transfected with a PTP-α expression plasmid.
Most aspects of cellular physiology are influenced by two signaling systems that are based on the principle of posttranslational modification of proteins. One is protein phosphorylation/dephosphorylation; the other is the redox-based modification of proteins. They govern many of the same signal-transduction pathways through overlapping sets of cellular targets (26).
Changes in the intracellular redox environment affect tyrosine phosphorylation–mediated signal-transduction pathways (32). The intracellular redox environment also modulates S-nitrosylation and other redox-based signaling mechanisms. Depletion or enhancement on the intracellular GSH content induced by pretreatment of cells with
Early studies using NO donors demonstrated that the concentration of GSH in myocytes was an important determinant of the extent of S-nitrosylation of creatine kinase. Increasing intracellular GSH decreased the magnitude of S-nitrosylation, whereas depletion of GSH had the opposite effect (5). In PTP-α−/− cells, levels of GSH were lower as compared with the levels encountered in PTP-αWT cells. Accordingly, we found higher nitrosothiol content on Src kinase in PTP-α−/− cells stimulated with 0.5 mM SNAP as compared with the levels determined on Src kinase in PTP-αWT cells stimulated with the same concentration of SNAP. Although Src kinase expression levels were higher in PTP-α−/− cells at the mRNA and protein levels, S-nitrosylation was quantitatively determined in equal amounts of immunoprecipitated Src kinase from both cell lines and found to be higher in PTP-α−/− cells as compared with PTP-αWT cells. Another important observation of the present study was the difference in the intracellular levels of NO measured in both cell lines after incubation with the same concentration of SNAP. High levels of intracellular NO in PTP-α−/− cells may also explain the higher levels of S-nitrosylation of Src kinase found in these cells.
Redox-based modifications on proteins could compete or cooperate with phosphorylation. In the present report, we showed that SNAP stimulated Src kinase activity in murine fibroblasts through phosphorylation of Tyr416 and S-nitrosation of cysteine residues of the kinase. The two posttranslational modifications apparently cooperate with each other. Earlier findings described slight conformational changes introduced on p21Ras by S-nitrosylation associated with its activation (53). Nitrosylation of Src kinase probably promotes conformational changes on the molecule that are sufficient to facilitate phosphorylation at Tyr416 and activation of the kinase. Activation occurred in PTP-αWT cells and in PTP-α−/− cells and was independent of dephosphorylation of Tyr527 on the latter. Our findings are in agreement with those made by Giannoni et al. (18). They reported that Src kinase becomes oxidized on specific cysteine residues in response to cell attachment to the extracellular matrix and that this modification enhances kinase activity.
Another important finding described here is that, in addition to the intracellular redox environment, the expression of PTP-α potentially modulates the levels of S-nitrosylation of Src kinase. Reintroduction of PTP-α on PTP-α−/− cells lowered the nitrosylation levels of Src kinase to the levels found in wild-type cells. This indicates that expression of PTP-α or its absence allows differential levels of redox regulation of Src kinase.
Akhand et al. (2) previously demonstrated that NO-based modifications on Src kinase were associated with the formation of disulfide bonds between kinase molecules, which leads to autophosphorylation of Src kinase at Tyr416. Other redox-based modifications, such as S-glutathionylation of Src kinase, may potentially occur. Glutathionylation and S-nitrosylation may occur simultaneously in the same protein in the presence of appropriate interactions between reactive oxygen and nitrogen species. The chemical nature of the nitrosating agent, and features such as histidine, and basic and acidic residues flanking the reactive cysteine, will determine the occurrence of glutathionylation or S-nitrosylation (20). However, in our study, we used the nitrosothiol SNAP, which contains a sterically hindered S-nitroso group that predominantly modifies protein thiols to S-nitrosothiols through a transnitrosation reaction (57). Src kinase features 10 cysteine residues that are potentially nitrosatable. Although the identification of this/these residue(s) is of major importance, such identification is beyond the scope of this study but remains a target for future investigations.
Early findings described the induction of expression of iNOS in 3T3 murine fibroblasts by serum (19). Likewise, we found that FBS induces the expression of iNOS in PTP-α−/− and in PTP-αWT murine fibroblasts. Differences in the expression of iNOS found on PTP-α−/− and in PTP-αWT murine fibroblasts reflected on the intracellular levels of NO. Intracellular levels of NO were higher in PTP-α−/− cells as compared with the levels found in PTP-αWT murine fibroblasts. Although the serum-induced expression of iNOS in both cell lines is a physiologically relevant source of NO in the system, the question remains: are the cellular responses to NO donors comparable to responses from NO generated from NOS? Examining our experimental model, we found some similarities and differences in the cellular responses to NO generated from SNAP from responses from NO generated from iNOS derived from FBS stimulation on both cell lines. Src kinase was found to be a target for nitrosylation promoted by the nitrosothiol SNAP or by FBS-induced iNOS expression. Nitrosylation of Src promoted by SNAP is a transnitrosation reaction (57); whereas nitrosylation derived from FBS-induced iNOS expression probably arises from nitrosating species such as NO2 and N2O3. The reaction of NO with O2, yielding NO2 and N2O3, occurs from 30 to 300 times more rapidly within the membrane, and Src is myristoylated and anchored to the plasma membrane (31; 41). Thus, it is reasonable to expect that iNOS-stimulated S-nitrosylation of Src is promoted by these nitrosating species. In addition, compartmentalization of iNOS at the plasma membrane allows local NO delivery to its molecular targets (21) (see Fig. 9B).
FBS, like SNAP, promoted differential levels of S-nitrosylation in Src kinase. Differences in S-nitrosylation are probably related to the differences in the intracellular redox environment in both cell lines. Lower nitrosylation levels were determined in PTP-αWT cells stimulated either with SNAP or with FBS, as compared with the nitrosylation levels found in PTP-α−/− cells incubated in the same experimental conditions.
It is reasonable to assume that specific signaling pathways are activated in response to different concentrations of NO. Low relative concentrations of NO favor proliferation, whereas higher levels of NO favor growth arrest and apoptosis (3, 39, 40, 50, 52). Indeed, measurements of intracellular levels of NO after incubation of both cell lines with the same concentration of SNAP (0.5 mM) revealed significant differences. Levels of NO were higher in PTP-α−/− cells as compared with the levels determined in PTP-αWT cells. In addition to the concentration of NO, differences in the intracellular redox environment defined by higher or lower GSH levels are equally important. The same concentration of SNAP (0.5 mM) was shown to induce proliferation in PTP-αWT cells and growth arrest in PTP-α−/− cells, and both signaling events were reversed by enhancing the intracellular GSH levels. This modulation was not observed when both cell lines were stimulated with FBS. Although differences in Src nitrosylation were observed in both cell lines, enhancement of GSH levels or inhibition of Src did not block proliferation induced by FBS in both cases.
In addition to proliferation, activation of Src kinase also is related to cell adhesion and migration events (43 –45, 55). In our experimental model, FBS-induced expression of iNOS with consequent stimulation of S-nitrosylation of Src kinase in PTP-αWT and in PTP-α−/− cells resulted in differential cell migration. Expression of PTP-α was a determining factor in the process. Cell migration was stimulated by FBS in PTP-α−/− cells, depending on Src kinase activity and on the intracellular levels of GSH. Conversely, expression of PTP-α changes the cell responses to FBS regarding cell migration. An apparent delay noted in the process and the dependence on Src kinase and on the intracellular redox environment was not observed (Fig. 9B).
In conclusion, NO/nitrosothiol-mediated signaling pathways involving Src kinase and the focal adhesion proteins FAK, p130Cas, and PTP-α are differentially regulated. Differential regulation involves the expression of PTP-α or its absence. Expression of PTP-α was found to be related to low expression levels of the NO-generating enzyme iNOS, low levels of intracellular NO, and a reducing intracellular redox environment. Absence of the expression of PTP-α was found to be related to high expression levels of the enzyme iNOS, high levels of intracellular NO, and an oxidizing intracellular redox environment.
The expression of PTP-α in the studied cell lines determined the expression levels of Src kinase. Higher expression levels of Src were detected in PTP-α−/− cells as compared with the levels found in PTP-αWT cells. A similar observation was made for the human epithelial carcinoma cell line A431. These cells do not express PTP-α and feature high expression levels of Src kinase and increased malignancy (25). Conversely, expression of PTP-α in breast carcinoma cells led to delays in tumor growth and metastasis associated with increased accumulation of the cell population in G0 and G1 (2). We conclude that in tumor cells expressing or not expressing PTP-α, the mechanism involving S-nitrosylation and tyrosine phosphorylation of Src kinase associated with the regulation of the other focal adhesion proteins is of major importance in NO-mediated tumor progression.
Footnotes
Acknowledgments
This work was supported by grants from FAPESP (Fundação de Amparo a Pesquisa do Estado de São Paulo/Brazil, Proc. 06/56311-0) and from Conselho Nacional de Desenvolvimento Científico e Tecnológico/Brazil (CNPq) Instituto do Milênio, Redoxoma (Projeto 42011/2005) to H.P.M. M.F.C. was a fellow from CNPq.
Disclosure Statement
No competing financial interests exist.
Abbreviations Used
References
Supplementary Material
Please find the following supplemental material available below.
For Open Access articles published under a Creative Commons License, all supplemental material carries the same license as the article it is associated with.
For non-Open Access articles published, all supplemental material carries a non-exclusive license, and permission requests for re-use of supplemental material or any part of supplemental material shall be sent directly to the copyright owner as specified in the copyright notice associated with the article.
