




Abstract
The mechanisms underlying nitric oxide (•NO) synthesis and inactivation in the brain are essential determinants of •NO neuroactivity. Although •NO production is well characterized, the pathways of inactivation in vivo remain largely unknown. Here, we characterize the kinetics and the major mechanism of •NO inactivation in the rat brain cortex and hippocampus in vivo by measuring locally applied •NO with carbon-fiber microelectrodes (CFMs) and ceramic-based microelectrode arrays (MEAs). An apparent first-order clearance was observed in both brain regions, with decay rate constants (k) of •NO signals of 0.67 to 0.84 per second, significantly higher than the k obtained in agarose gel (0.099 per second), used as a •NO diffusion-control medium. •NO half-life in vivo, estimated by mathematical modeling, was 0.42 to 0.75 s. Experiments using MEAs support that the •NO diffusion radius is heterogeneous and related to local metabolic activity and vascular density. After global ischemia, k decreased to control values of diffusion in gel, but during anoxia, k decreased only 21%. Additionally, k in brain slices was threefold to fivefold lower than that in vivo, and hemorrhagic shock induced a 53% decrease in k. Overall, the results support that •NO scavenging by circulating erythrocytes constitutes the major •NO-inactivation pathway in the brain. Antioxid. Redox Signal. 14, 1011–1021.
Introduction
•NO can rapidly diffuse away from its source site across cell membranes, lacks a specific membrane receptor, and can potentially interact with many biologic targets with different kinetics. Thus, •NO effects are critically dependent on its spatiotemporal concentration dynamics and surrounding tissue chemical environment (3, 28). To understand its signaling mechanisms in the brain and develop strategies to modulate its bioactivity in pathologic conditions, it is crucial to know the mechanisms for the regulation of •NO dynamics.
•NO bioactivity depends on the balance between its synthesis and inactivation. It is well established that, in the brain, •NO is synthesized mainly by neuronal •NO synthase via an increase in intracellular Ca2+, after activation of glutamate N-methyl-
In this study, we addressed this question along with the kinetics and spatial features of subsecond •NO clearance in the rat cerebral cortex and hippocampus in vivo, by direct amperometric •NO measurement with carbon-fiber microelectrodes (CFMs) (2) and ceramic-based microelectrode arrays (MEAs) (5). We observed an apparent first-order •NO inactivation, accounting for an estimated •NO half-life of 0.4 to 0.7 s, for physiologically relevant concentrations. In addition, we provide experimental evidence in vivo supporting that •NO scavenging by circulating RBCs is the major •NO-inactivation mechanism, shaping •NO-concentration dynamics in the brain. Our findings present new perspectives to understanding the mechanisms involved in the regulation of •NO bioactivity in the CNS, highlighting the importance of the interactions between •NO and the vasculature, with implications in both physiologic and pathologic conditions.
Materials and Methods
Chemicals and solutions
•NO standard solutions were prepared as previously described (2). In brief, purified •NO gas was bubbled for 30 min through deoxygenated phosphate-buffered saline (PBS), 0.05 M, pH 7.4. The concentration of •NO saturated solutions was checked by using a ISO-•NOP 2-mm Pt sensor connected to the amperometer ISO-•NO Mark II (World Precision Instruments, Inc., Sarasota, FL), giving an average •NO concentration of 1.70 ± 0.05 mM (n = 9).
Carbon-fiber microelectrodes fabrication
Microelectrodes coating
Nafion (Sigma-Aldrich, St. Louis, MO) coating of CFMs and MEAs was done by dipping the microelectrode tip into a fresh Nafion solution (5%) for 1–2 s and drying for 4 min at 170°C. This process was repeated twice. Then CFM tips were electroplated with ortho-phenylenediamine (o-PD) (Fluka) by applying a potential of +0.7 V versus Ag/AgCl for 30 min, in a 5 mM o-PD solution. MEAs were electroplated with meta-phenylenediamine (m-PD) (Sigma-Aldrich) by applying a triangular wave (+0.25 to +0.75; 3 Hz) during 20 min.
Microelectrodes calibration
The system used for all recordings was the Fast Analytical Sensing Technology computer-controlled potentiostat system (FAST-16; Quanteon, Lexington, KY). Measurements were carried out by using constant-voltage amperometry in a two-electrode configuration. The potential of the working microelectrode, for
For oxygen measurement with CFMs, the applied potential was −0.8 V versus Ag/AgCl. Microelectrodes were calibrated similar to those in previous studies (38), by subtracting the electrochemical current inside brain tissue, after cardiac arrest ([O2] = 0) to the current recorded over the brain surface, superfused with saline ([O2] ≈273 μM).
Animal and surgical procedures
All animal procedures were approved by the local institutional animal care and use committee and were in accordance with the European Community Council Directive for the Care and Use of Laboratory Animals (86/609/ECC). In vivo and ex vivo studies were carried out in 8- to 9-week-old Wistar rats (250–390 g), as previously described (2, 5, 22).
Global ischemia by cardiac arrest was induced by a lethal dose of urethane administered intraperitoneally. Cardiac arrest was determined by monitoring the blood flow in the rat rear right paw with a flow probe (Periflux Systems 5010, Perimed, Uppsala, Sweden).
In hypoxia and hyperoxia experiments, a moderate gas flow was created in front of the rat nose by means of a funnel plugged to a gas tank containing nitrogen or 100% oxygen, respectively.
Hemorrhagic shock was induced by withdrawing 6 ml of blood by means of successive 1-ml blood collections via a catheter introduced in the right femoral artery.
Electrochemical Recordings
Micropipette/CFM arrays had a tip separation of 270 to 330 μm. When using MEAs, the micropipette tip was placed between sites 2 and 3, 250 to 300 μm over the recording surface. In vivo experiments were carried out in the cerebral cortex and in the CA1 region of the hippocampus (not histologically confirmed). The following coordinates, calculated from bregma, based on the rat brain atlas of Paxinos and Watson (41), were used for CFMs: rat cerebral cortex, anterior-posterior (AP), −3.4; medial-lateral (ML), −2.4; dorsoventral (DV), −1.5; and AP, −4.1; ML, −2.8; DV, −1.5; and for hippocampus, AP, −3.4; ML, −2.4; DV, −2.5; and AP, −4.1; ML, −2.8; DV, −2.5. When using MEAs, micropipette-tip coordinates were cerebral cortex, AP, −3.4; ML, 2.4; DV, −1.4; and AP, −4.1; ML, −2.8; DV, −1.4; and for hippocampus, AP, −3.4; ML, −2.4; DV, −2.7; and AP, −4.1; ML, −2.8; DV, −2.7.
The data-acquisition rate was 10 Hz in CFM experiments and 2 Hz in MEA recordings. After baseline current stabilization (15 min),
For the experiments in agarose gel, a 0.2% (wt/vol) agarose concentration in PBS was used.
Mathematical modeling of •NO diffusion
•NO diffusion from a spherical source was modeled by using Wolfram Mathematica 6.0 software, based on the following equation (42):
where C is •NO concentration t seconds after an instantaneous burst of •NO production, a is the radius of the sphere, r is the distance between the center of the source sphere and the detector, Q corresponds to the initial •NO concentration at the center of the source, and D is the •NO diffusion coefficient. This model assumes first-order •NO inactivation kinetics, with a first-order decay constant given by λ. Solutions for continuous •NO application were generated by numerically integrating Equation 1 by using the NIntegrate command in Wolfram Mathematica 6.0.
Statistical analysis
Kinetic analyses were carried out by using Microcal Origin Pro 7.5. Data are presented as mean ± standard error of the mean (SEM). Differences between two datasets were evaluated with a Student t test. Statistical tests between multiple datasets were carried out by using a one-way analysis of variance (ANOVA).
Results
Nitric oxide signals in agarose gel versus in vivo
We used selective •NO CFMs (45) and the ceramic-based MEAs (44) to understand better the kinetics of •NO clearance in the brain. With CFMs, the clearance rate of exogenously applied •NO in vivo in the cerebral cortex and hippocampus was compared with that in agarose gel, which was used to evaluate the contribution of free diffusion to the temporal profile of •NO signals, as previously done with other compounds (39, 47). Fig. 1A shows representative recordings, in which different •NO signal amplitudes were achieved by local application of different volumes of a saturated •NO solution in agarose gel (Fig. 1A, top) and in rat cerebral cortex (Fig. 1A, bottom). The temporal profile of successive •NO signals is very reproducible, regardless of the number and frequency of •NO applications. However, •NO signals in vivo are significantly faster than those in agarose. Fig. 1B shows typical normalized •NO signals, which decay with a t1/2 of 0.9 s in vivo (cortex) versus 7.0 s in agarose. On average, the rise time of signals was 3.90 ± 0.10 s (n = 15) from five experiments in agarose and 1.95 ± 0.1 s (n = 201) from 16 experiments in vivo. Differences in rise time were statistically significant comparing agarose and in vivo times (p < 0.0001).
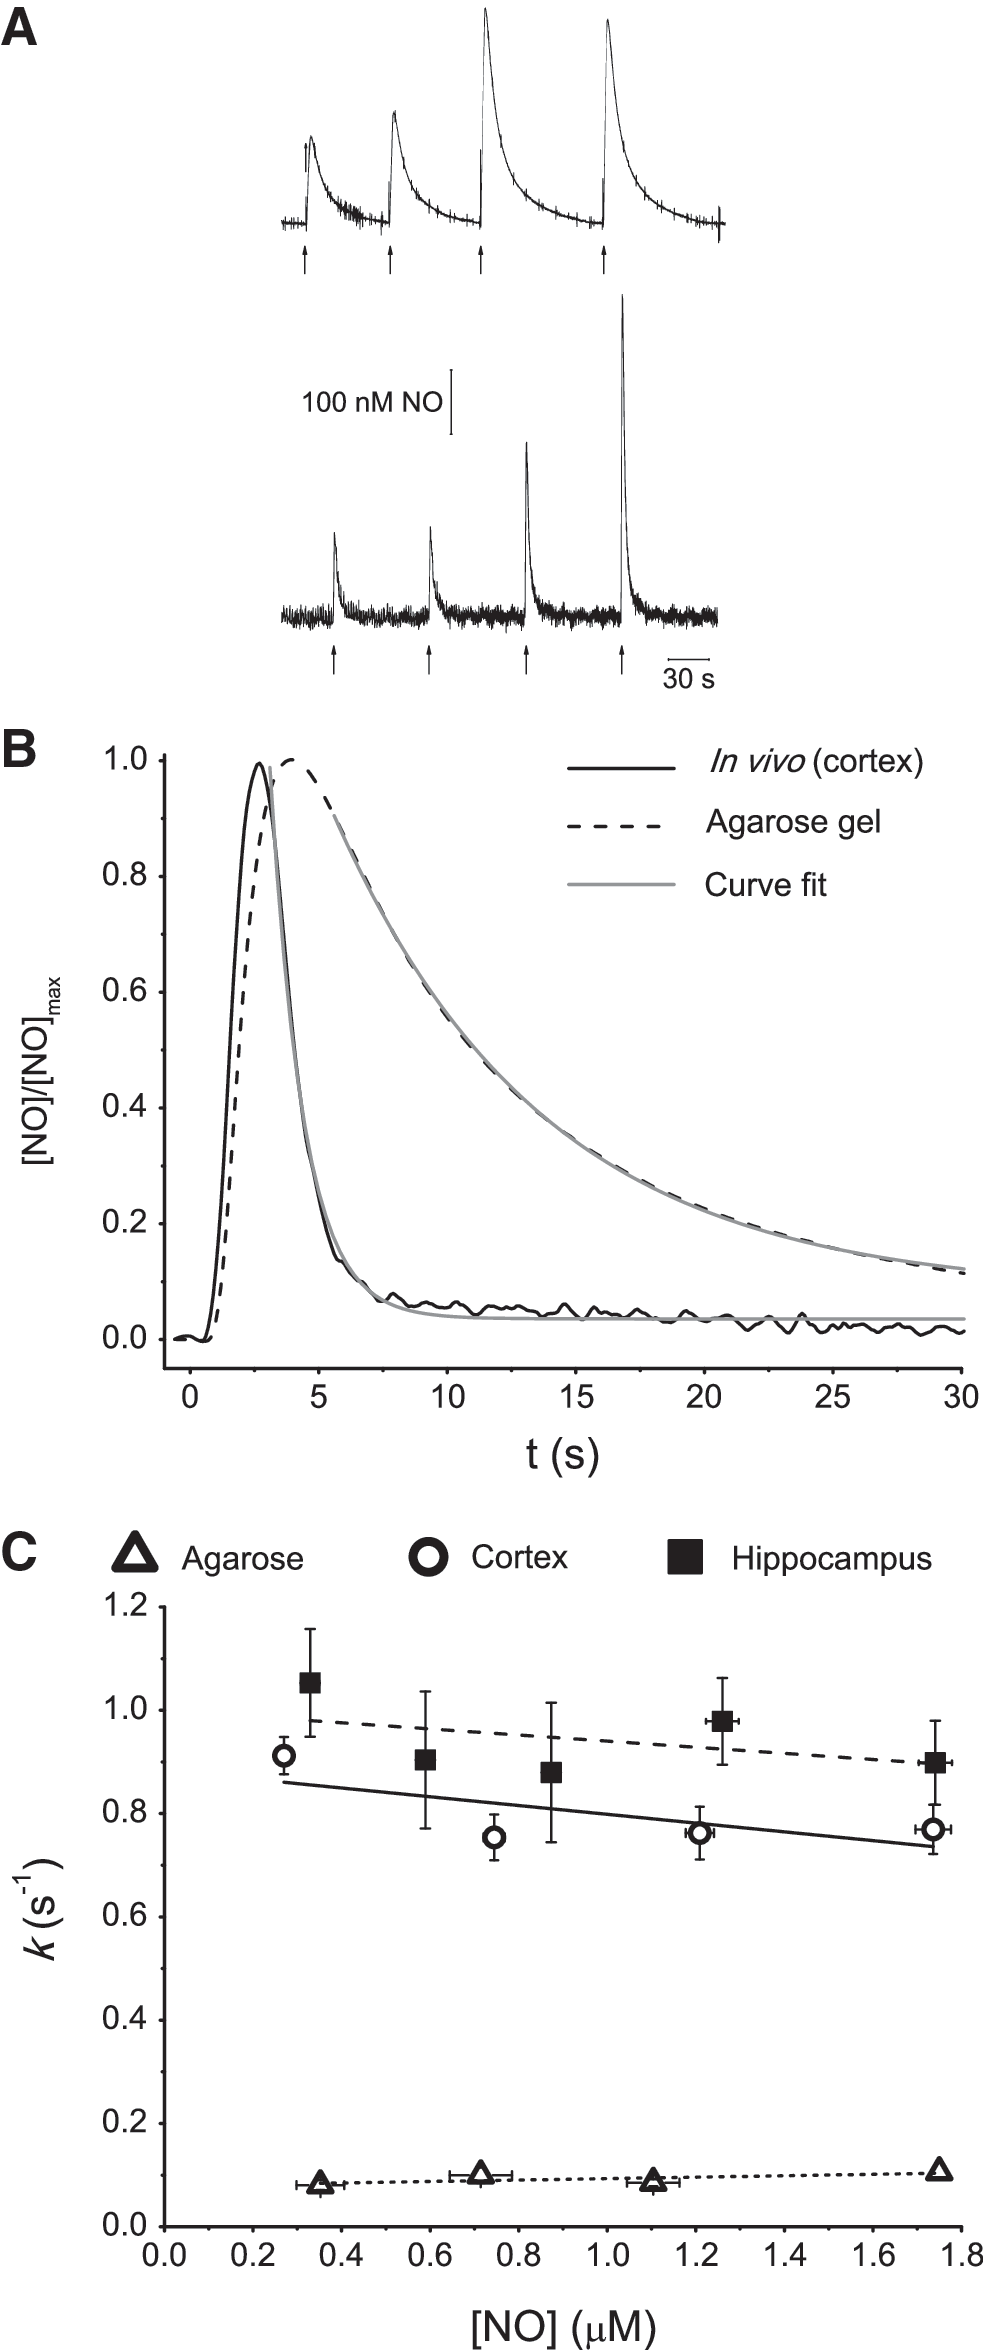
The kinetics of •NO decay were determined by fitting a first-order exponential decay function to the decay phase of signals, as shown in Fig. 1B. The curve fits are in a good match with signal decay profiles both in agarose and in vivo, indicating that the apparent first-order decay rate constant (k) can be used to describe quantitatively the time course of the •NO signal decay. Furthermore, in accordance with apparent first-order decay, k values were constant both in vivo and in agarose, for concentrations ranging from 200 to 2,000 nM (Fig. 1C). The mean k was 0.83 ± 0.09 per second (n = 128) from eight experiments in cortex, 0.84 ± 0.1 per second (n = 73) from eight experiments in hippocampus, and 0.099 ± 0.006 per second (n = 15) from five experiments in agarose. The k was significantly higher between both brain regions in vivo and in agarose (p < 0.001).
•NO scavenging shapes •NO signals
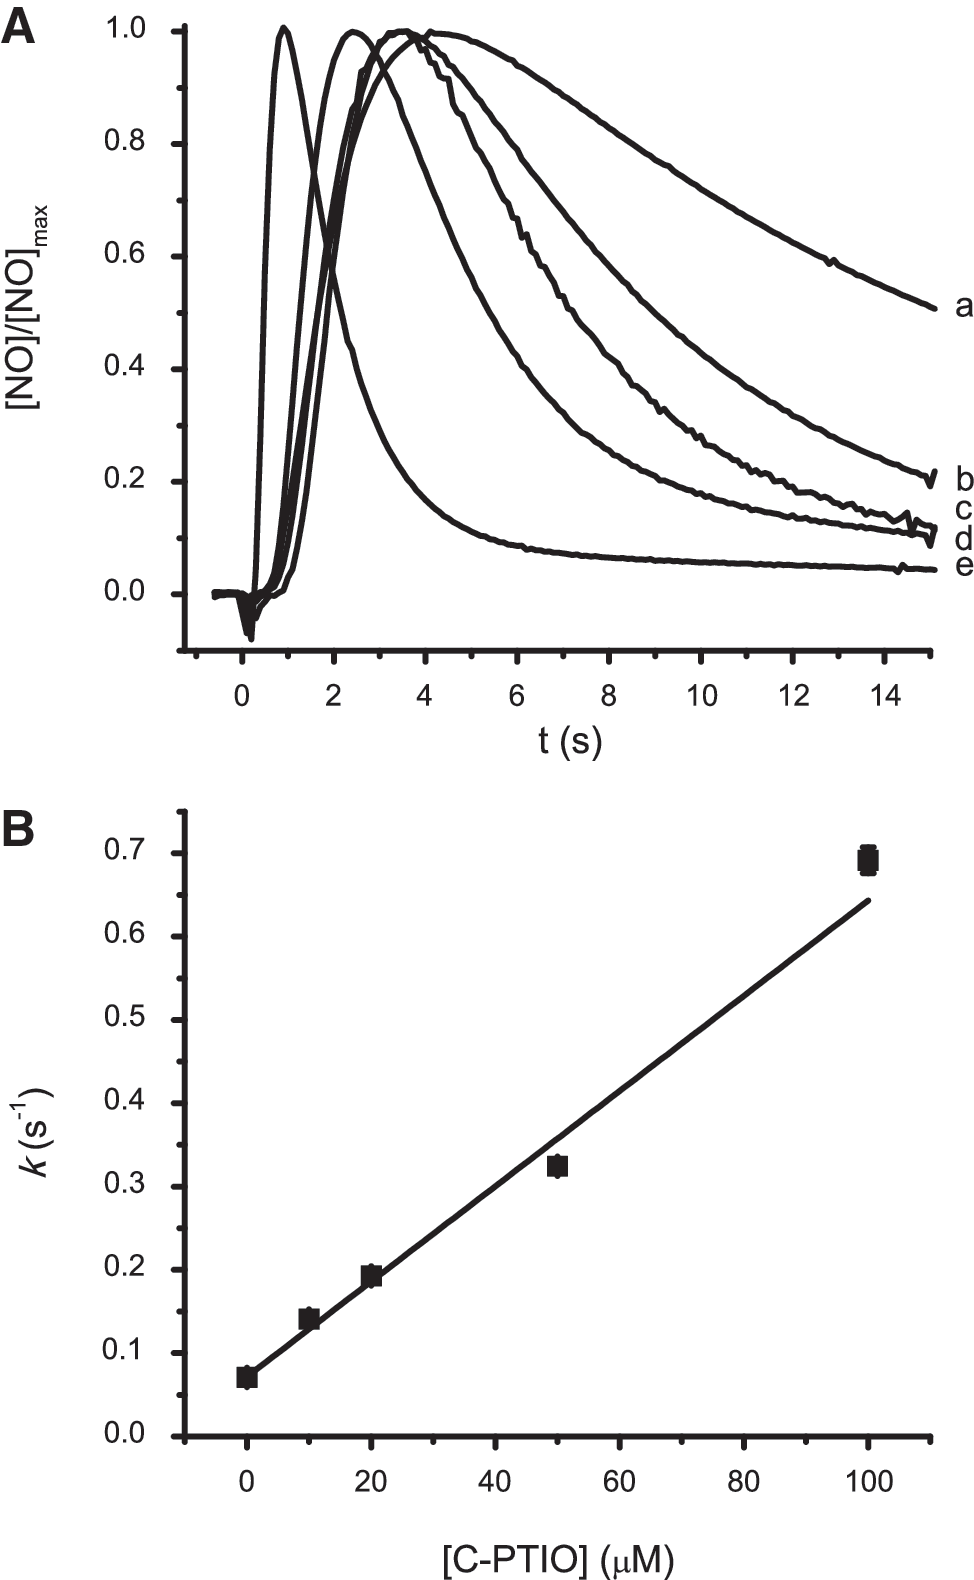
To evaluate whether the temporal profile of •NO signals accurately reflects the kinetics of inactivation reactions in the recording media, we carried out experiments in agarose gel supplemented with the •NO scavenger C-PTIO. Fig. 2A shows the effect of increasing C-PTIO concentrations (10 to 100 μM) on the temporal profile of •NO signals. Both the rise time and the decay rate were affected by the scavenger in a concentration-dependent way. The rise time of signals shown in Fig. 2A decreased from 4.2 s in nonsupplemented agarose to 1 s in agarose supplemented with 100 μM C-PTIO. This result was expected, because the rise time is the instant when the rates of •NO concentration increase because of diffusion from the micropipette and clearance from the recording site become equilibrated. Thus, the higher the clearance rate, the faster this instantaneous equilibrium is attained, which is also in accordance with the lower rise time of •NO signals in vivo, as compared with in agarose. By plotting k versus C-PTIO concentration (Fig. 2B), we observed a linear relation with a slope of 0.57 × 10⁴ M−1s−1, which is in accordance with the rate constant (0.6 × 10⁴ M−1s−1) for the scavenging reaction of •NO by C-PTIO (15), an observation that further accounts for the reliability of the experimental approach. Moreover, the rate constant (k = 0.70 per second) obtained in agarose gel supplemented with 100 μM C-PTIO is in the range of the values obtained in vivo, supporting the activity of efficient biochemical mechanisms of •NO removal at the recording site in vivo.
Microelectrode array recordings
MEAs provided spatial resolution of •NO clearance in brain tissue by simultaneously monitoring four brain areas in 200-μm increments in a dorsoventral orientation (Fig. 3A and B). Fig. 3C shows a typical recording obtained on successive local •NO applications in the hippocampus. On average, signal rise time was 2.6 ± 0.2 s (n = 83) from 10 experiments in the cortex and 2.2 ± 0.4 s (n = 64) from six experiments in the hippocampus (p > 0.05). The k values were 0.67 ± 0.06 per second in cortex and 0.77 ± 0.1 per second in hippocampus (p > 0.05). Typically, •NO was not detected at all MEA sites, which is not attributable to differences between the LODs of the MEA recording sites. Furthermore, when considering the number of experiments in which •NO was detected from each site, relative to the total number of experiments, it is evident that the sites closer to the micropipette tip (sites 2 and 3) showed the highest probability of •NO detection (Fig. 3D). Comparing sites at the same distance from the •NO source, a greater probability of detecting •NO exists in a more-ventral position in cortex (sites 1 and 2) and in a more-dorsal position in hippocampus (sites 3 and 4). These results suggest a heterogeneous •NO diffusion/inactivation through the tissue microenvironment surrounding MEA sites.
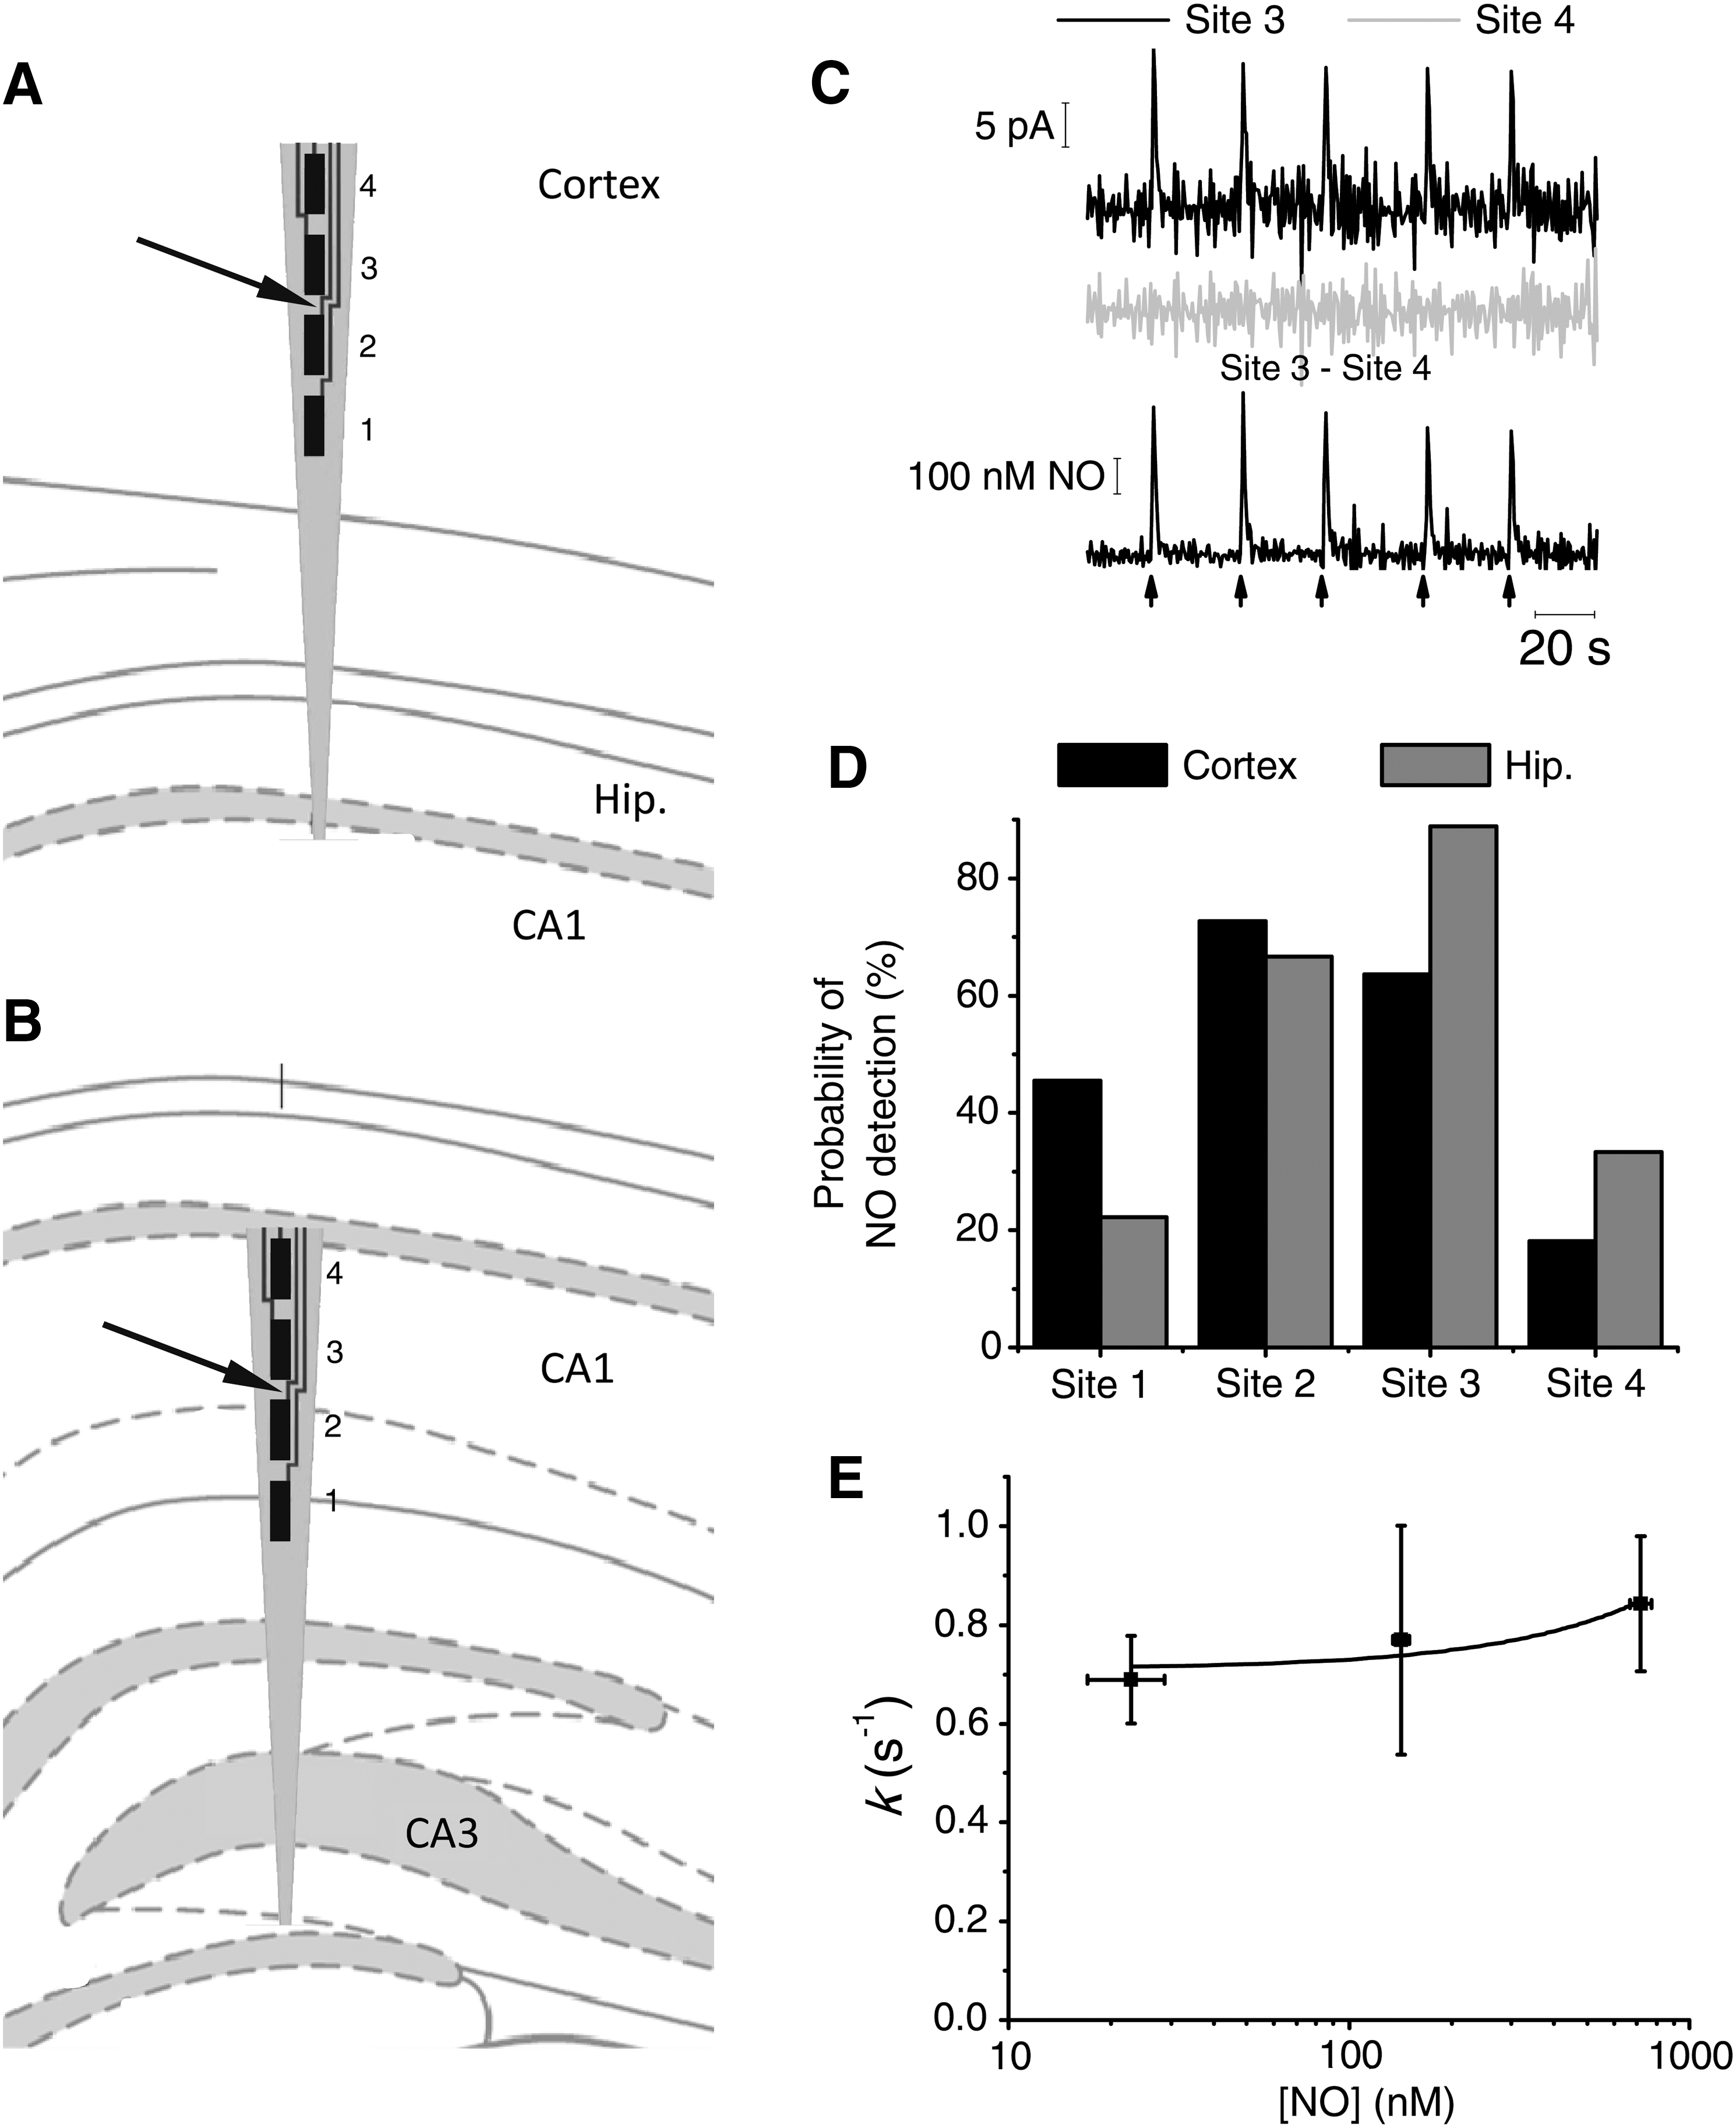
With MEAs, one can also improve the signal-to- noise ratio of •NO signals by subtracting the current of an MEA site that does not detect •NO from an MEA site where •NO is oxidized (Fig. 3C, bottom). With this approach, signals with amplitudes as low as 100 nM were measured. Further to improve the signal-to-noise ratio, a large number of very small signals (n > 40) were averaged. Fig. 3E shows k values for low-nanomolar •NO signal amplitudes. The k does not significantly change in this range (ANOVA, p > 0.05).
Global ischemia impairs •NO inactivation in vivo
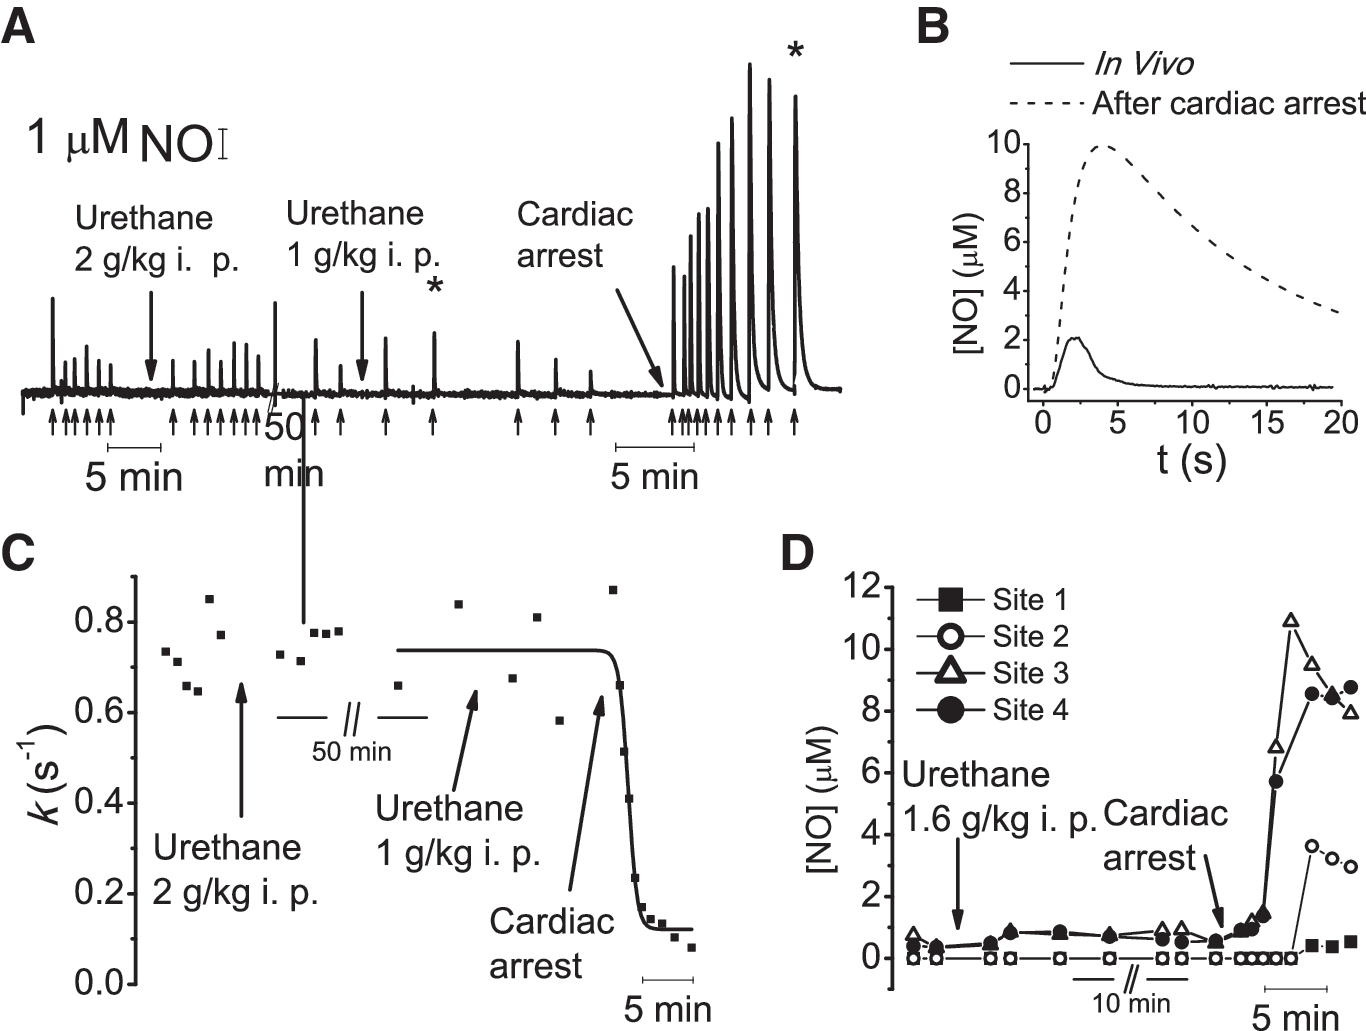
The kinetic data indicate that •NO signals in vivo are shaped by a powerful and robust apparent first-order inactivation mechanism. We investigated its potential identity by recording the variation of k after global ischemia (cardiac arrest), induced by a lethal dose of urethane. Fig. 4A shows a representative recording (from seven experiments) of •NO signals in vivo and the corresponding k values after urethane administration (Fig. 4C). Fig. 4B illustrates the significant change in •NO signal dynamics shortly after cardiac arrest (Fig. 4B), translating into a decrease in k from 0.73 per second to 0.08 per second and an eightfold increase in signal amplitude. With MEAs, the differences in signal amplitudes between the recording sites in vivo greatly decrease after cardiac arrest (Fig. 4D). On average, the ratio of •NO signal amplitudes between sites not detecting/detecting •NO in vivo was 56 ± 15% after cardiac arrest. Together, these results indicate that •NO inactivation is greatly impaired during ischemia.
Oxygen-dependent vs. vascular •NO inactivation
The global ischemia results support that •NO inactivation in vivo is an active process, depending either on tissue oxygen supply or on RBC perfusion in cerebral vessels or both. These hypotheses are conceivable, because many •NO-inactivation mechanisms found in vitro are oxygen dependent (13, 19, 32, 40). Furthermore, RBCs constitute the strongest •NO sink in the bloodstream (30).
To assess the contribution of oxygen-dependent •NO inactivation, brief hypoxia was induced by exposing the animal to a nitrogen-enriched atmosphere for 1 to 2 min. After the onset of nitrogen exposure, oxygen concentration rapidly decreased in the brain to concentrations less than 10 μM and quickly recovered to baseline levels after nitrogen removal (Fig. 5A). No significant change in k was observed under the same conditions, as compared with control (Fig. 5B), supporting that •NO inactivation is insensitive to moderate decreases in oxygen concentration. Nevertheless, the contribution of •NO-consumption mechanisms with high oxygen affinity (<5 μM) was still uncertain. Thus, anoxia was induced by nitrite intraperitoneal overdose (200 mg/kg, IP), causing a progressive decrease in oxygen tension in the brain to nearly zero, due to oxidation of a significant fraction of ferrous hemoglobin to metHb (27), resulting in cardiac arrest (Fig. 5C). After nitrite administration, k decreased 21 ± 5% (n = 5) and, after cardiac arrest, further decreased to values similar to those observed in agarose (Fig. 5D).
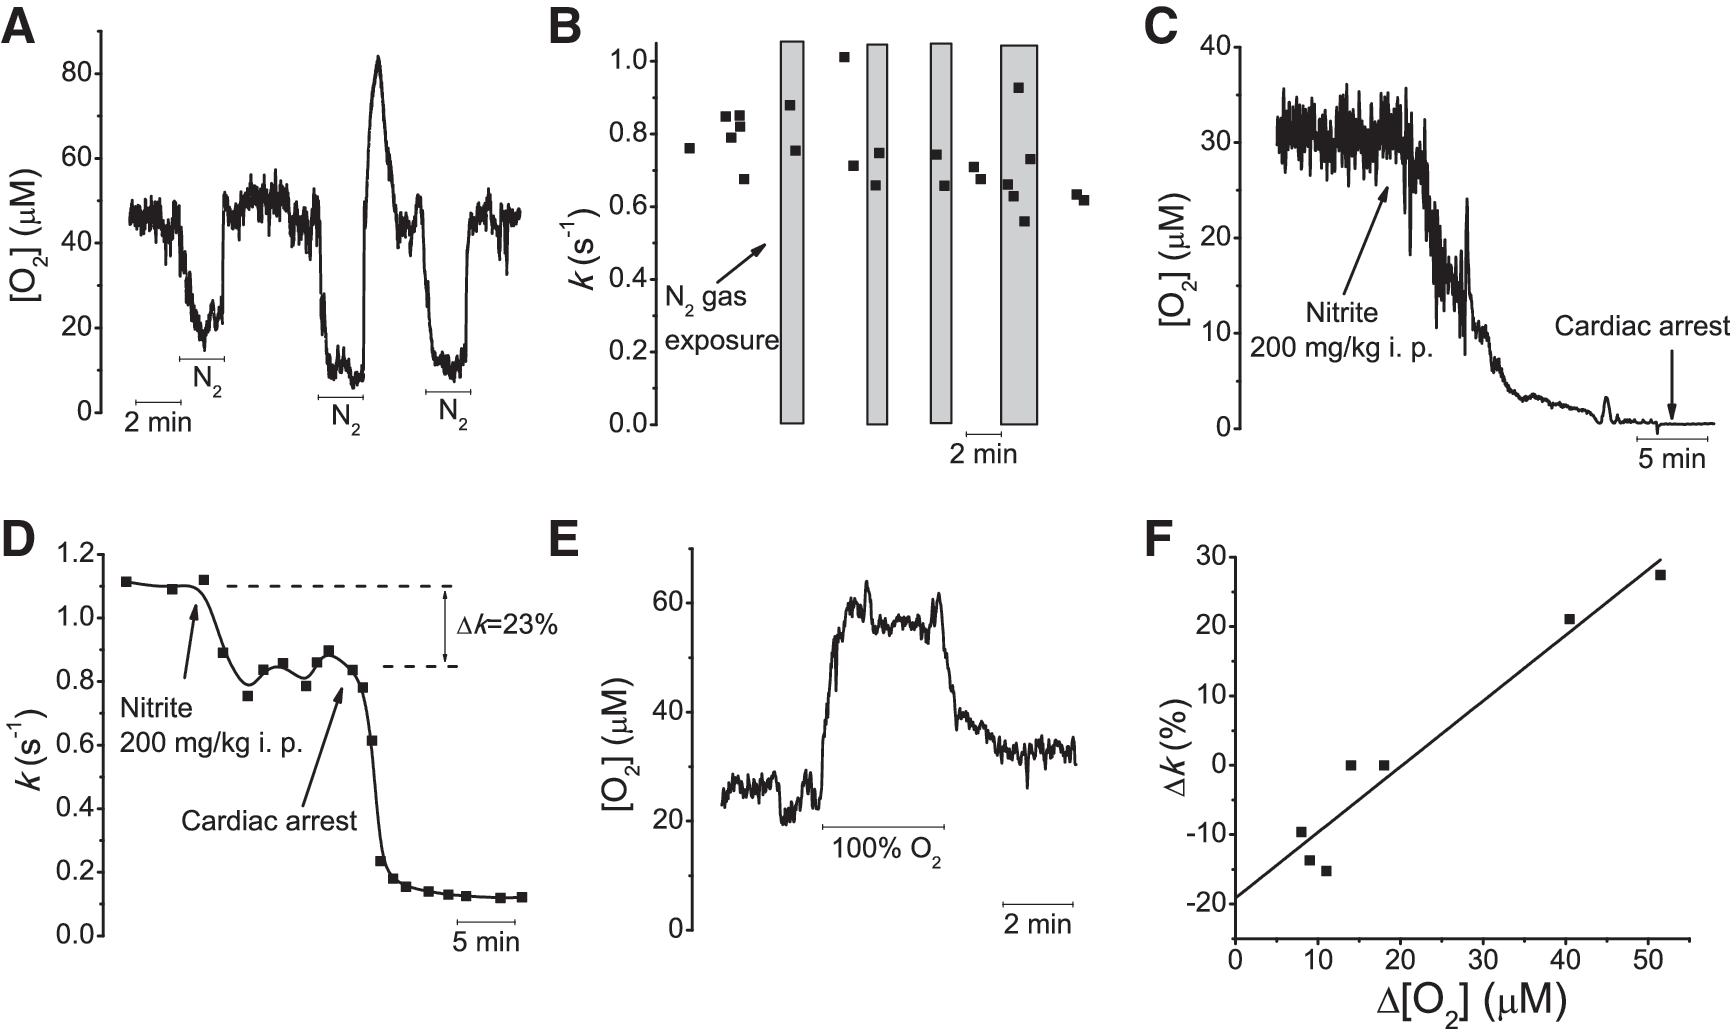
Despite nitrite oxidation of Hb(II) to Hb(III), which scavenges •NO much more slowly than Hb(II) (10). Lethal levels of metHb are around 70% of total Hb, which should not affect the •NO reaction with RBCs (49), indicating that the decrease observed in k before cardiac arrest is RBC independent. However, other possible nitrite effects, independent of oxygen tension, may contribute to the decrease in k, such as oxidation of plasma free Hb, which can reach 1 μM (21) and hypotension-induced decrease in cerebral blood flow, due to a strong hypoxic vasodilation (26) or decreased cardiac output. Nevertheless, one may conclude that anoxia causes at most a 21% decrease in k.
Further to characterize oxygen-dependent •NO inactivation, we quantified •NO signal decays under conditions of normobaric hyperoxia. For each experiment, both oxygen and •NO recordings were sequentially performed. Hyperoxia-induced brain tissue oxygen concentration increases (Fig. 5E), ranging from 8 to 51 μM. A linear relation was obtained by plotting the variation in oxygen concentration against the relative change in •NO signals k (Fig. 5F). Interestingly, for small oxygen increases (<11 μM), k decreased, whereas high oxygen increases caused an increase in k of about 25%. These variations in k are in accordance with the decreases of 21% during anoxia experiments (where the absolute oxygen change was similar). Together, although these results support the activity of oxygen-dependent •NO-inactivation mechanisms in the brain, the relatively small changes observed in k support that the major mechanism affecting •NO clearance in vivo is oxygen independent, pointing to the reaction between •NO and RBCs as the main candidate.
This latter hypothesis was first tested by locally applying •NO in brain slices, a metabolically active brain-tissue preparation devoid of functional vasculature. •NO signals in brain slices, recorded with MEAs, showed an average k of 0.18 ± 0.01 per second both in cortex (n = 8) and in hippocampus (n = 2). Although these values were significantly higher than the average k of 0.099 per second in agarose (p < 0.0001), supporting the activity of •NO-inactivation processes in the brain perivascular tissue, they are more than threefold lower than the average k in vivo (Fig. 6A), an observation that further points to the reaction between •NO and RBCs as the major determinant of the regulation of •NO half-life in the brain in vivo.

RBC contribution to •NO decay in vivo was directly assessed by inducing hemorrhagic shock. With this protocol, the decrease in blood volume causes severe hypotension and ultimately impairs brain microcirculation by decreasing cerebral blood flow and functional capillary density (7). The microcirculation impairment is also supported by the fact that approximately 1 h of progressive blood withdrawal caused cardiac arrest. As shown in Fig. 6B, during hemorrhage, k progressively decreased before cardiac arrest. Although a concomitant decrease in cerebral oxygen tension may have occurred during these experiments, the average decrease in k was 53 ± 4.6%, which is more than twice that during anoxia (p < 0.01). Taken together, the results in this section point to a major role of the reaction between •NO and circulating RBCs in governing nitric oxide dynamics in the brain in vivo.
Modeling •NO diffusion and inactivation
To quantify •NO inactivation, we must take into account the diffusional component of the signals. Reported •NO diffusion coefficients in aqueous solution range from 2.0 to 4.5 × 10⁻⁵ cm2/s (12, 35, 50). However, the assumption that •NO diffusion is not significantly affected by cellular structures was recently disputed by the estimation of a much lower apparent •NO-diffusion coefficient (D•NO app) of 0.85 × 10⁻⁵ cm2/s across aortic wall tissue (33).
Given the uncertainty regarding D•NO app in brain tissue, we estimated the apparent first-order rate constant of •NO inactivation in the brain in vivo (λ) by modeling •NO-diffusion/inactivation from the micropipette to the microelectrode, assuming a range of D values (Eq. 1).
Fig. 7A shows the relation between k and λ for D in the range of 1 to 4 × 10⁻⁵ cm2/s, while keeping all the other parameters in Eq. 1 at the values: a = 112 μm (a sphere with a volume of 6 nl); r = 300 μm; Q = 1,700 (Q affects the signal amplitude but not the signal shape; we assumed that Q equals the saturated •NO-solution concentration). Taking into account the average k obtained in vivo by using CFMs (k = 0.84 per second) and the plot in Fig. 7A, the predicted λ as a function of D is shown in Fig. 7B. Based on this relation, a good match between representative experimental and theoretic decay profiles can be obtained by using different D values (Fig. 7C). Considering a range of possible D•NO app in vivo, from 4.5 × 10⁻⁵ to 0.85 × 10⁻⁵ cm2/s, λ would range from 0.92 to 1.64 per second, corresponding to •NO half-lives from 0.75 s to 0.42 s, respectively.
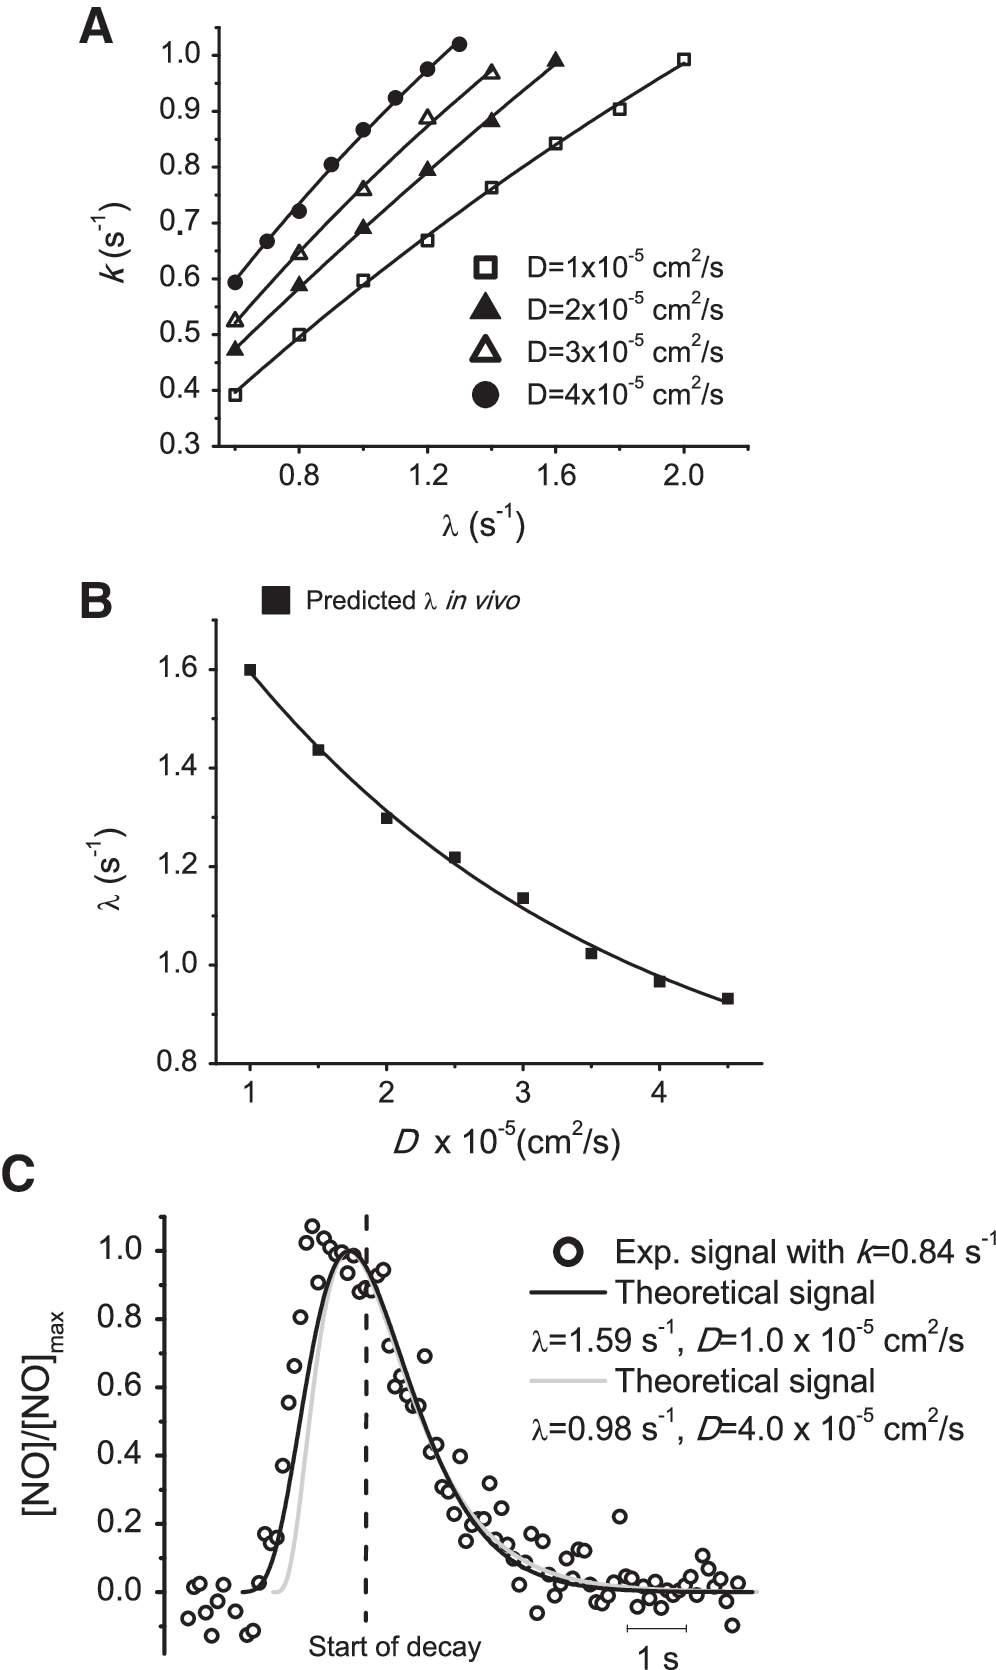
Theoretic signals k was robust to variations in the source volume and application time from 2 to 12 nl and 0 to 0.3 s (<5% variation). Because we estimated λ based on theoretic signals k, this observation accounts for the robustness of our approach.
Discussion
On the basis of experimental data in vivo and mathematical modeling, we showed in these studies that •NO scavenging by circulating red blood cells likely constitutes the strongest •NO-inactivation pathway in the rat brain, affecting •NO decay and half-life in vivo. This mechanism greatly contributes to a robust apparent first-order kinetics of •NO inactivation, resulting in an estimated •NO half-life of 0.42 to 0.75 s in cortex and hippocampus. It is well established that RBCs are the stronger •NO sink in the vasculature (30). However, the extent to which RBCs can inactivate perivascular •NO has remained unknown and controversial, because of the difficulty in measuring •NO dynamics in vivo.
In this study, the observation that global ischemia nearly abolishes •NO inactivation indicated a crucial role of circulating RBCs in supporting •NO inactivation in the brain in vivo. Because RBC circulation is tightly coupled with tissue oxygen supply/metabolic activity, we used three different approaches, aiming to isolate the contribution of these factors to •NO inactivation: (a) real-time measurements of •NO changes under anoxia, hypoxia, and hyperoxia; (b) comparison of the kinetics of •NO decay in vivo versus brain slices; and (c) measurements under moderately impaired RBC microcirculation in vivo. Collectively, the results support a relatively small contribution (<21%) of O2-dependent •NO inactivation to signal decay and support a major role of •NO scavenging by RBCs in determining •NO half-life in the brain in vivo. The continuous flow of RBCs might provide an almost nonsaturable way to inactivate •NO in the brain, which is in agreement with the robust apparent first-order kinetics of •NO clearance observed in our experiments for physiologically relevant •NO signal amplitudes.
In most situations, •NO acts as a paracrine messenger in the brain. After activation of a relatively large brain region, small dispersed •NO sources of low individual efficacy can cooperate to originate an extensive and strong volume signal (43). •NO half-life plays an important role in shaping the resulting volume signal. Mathematical simulations have shown that cooperativity is significantly decreased when assumed •NO half-lives are <500 ms. Conversely, further increases up to 5 s did not considerably increase cooperativity (43). It is noteworthy that our estimated •NO half-life of 0.42 to 0.75 s, by mathematical modeling with a range of D•NO app values in the brain from 0.85 × 10⁻⁵ cm2/s to 4.5 × 10⁻⁵ cm2/s, fits in the minimum values needed to ensure strong cooperativity between •NO sources.
Another implication of the estimated •NO half-life is that for endogenous •NO, volume signals with a duration (i.e., a rising and a decay phase) significantly higher than 0.42 to 0.75 s, the temporal encoding of the signal should be mainly controlled by the kinetics of •NO biosynthesis in the tissue. This may constitute an efficient temporal coupling between the integrated nNOS activity of the tissue and the resulting •NO volume signal formed. A recent study from our group (34), in which we have characterized endogenous •NO signals in the rat brain hippocampus following activation of glutamate receptors, indicates that such phenomenon may occur in vivo since the endogenous signals had a duration (both the rising and decay phases) about one order of magnitude higher than the estimated •NO half-life in the present study. This observations support that •NO inactivation, in addition to avoiding the buildup of toxic •NO concentrations, is fine tuned to support efficient •NO volume signaling.
The physiological relevance of finely regulating the levels of excitotoxic compounds in the brain such as •NO and glutamate is evidenced by the similarity between exogenous glutamate and •NO signals (5), which decay much faster than classic neurotransmitters such as DA (44). However, the rapid clearance of glutamate is due to the high-capacity glutamate transporters, primarily located on glia, whose activity can be regulated in different ways in response to a variety of stimuli (11). Our findings on •NO inactivation pose an important question regarding whether the same versatility exists in the regulation of •NO dynamics by the vasculature. Here, we propose biologic processes that might accomplish this task:
Vascular density may be envisaged as a long-term mechanism for the regulation of •NO spatiotemporal dynamics. The results with the MEAs support that the vascular density is important in defining the •NO diffusion radius in vivo. Based on previous measurements in the brain, the vascular density is higher in the dorsal portion of the cortex in comparison with ventral locations close to the corpus callosum (8). This gradient is inversely related with our probabilities of •NO detection, comparing MEA sites at the same distance from the micropipette tip. Therefore, the different •NO-detection probability distributions among the MEA sites between the brain regions studied are likely due to distinct patterns of vascular density (8). To meet local oxygen demand, vascular density is generally correlated with metabolic activity (20), which often correlates with synaptic activity and •NO production. Therefore, in brain regions with rich •NO signaling, vascular density may be regulated to maintain local physiologic levels of both oxygen and •NO. This hypothesis is further supported by the finding that some regions with similar metabolic activity possess significantly different vascular density, such as the CA1 and CA3 subregions of the hippocampus (8), which may reflect distinct specialization of the local vasculature for the regulation of •NO dynamics, to meet specific •NO-signaling requirements.
Short-term regulation of •NO lifetime by vasculature is likely mediated by neurovascular coupling. The transient increase in cerebral blood flow and blood volume after neuronal activation may constitute a feedback mechanism by which synaptically derived •NO increases its own inactivation rate. The physiologic relevance of such a mechanism is uncertain, but it might help protect neurons against unnecessary •NO exposure.
To allow •NO-meditated vasodilation, physical barriers exist to limit the rate of the •NO reaction with intraerythrocytic hemoglobin (29, 30, 49). Moreover, experimental evidence supports that •NO likely diffuses more slowly in tissues than in water, and it has been suggested that the •NO diffusion coefficient is dependent on tissue composition (33). Accordingly, it is possible that the vascular wall in blood vessels retards •NO diffusion from brain parenchyma to the bloodstream and, in this way, limits the vascular •NO-inactivation rate in the brain. In this case, regulation of •NO diffusion through vascular walls may constitute a mechanism for the modulation of •NO half-life in the brain. Further experiments are needed to clarify the biologic meaning of interactions between •NO and the vasculature, but given the importance of RBCs in •NO inactivation, shown in this work, these processes might be crucial in the regulation of brain •NO signaling.
In pathologic situations affecting these mechanisms, a deregulation of •NO levels may occur, such as in ischemia/reperfusion. We observed a great decrease in the •NO-inactivation rate during ischemia, which might potentiate •NO accumulation in the affected tissue, formed from either residual NOS activity or NOS-independent •NO-synthesis mechanisms, such as nitrite ischemic reduction (25). It has been found that preischemic administration of •NO donors or nitrite in vivo decreases brain ischemia/reperfusion infarct volume in models of focal ischemia (25). One of the mechanisms underlying a neuroprotective role of •NO during ischemia is its vasodilatory action, which likely enhances microcirculation in the regions adjacent to the affected area (penumbra). Thus, it is possible that the impairment of •NO inactivation in the brain region affected by ischemia is protective by increasing local •NO availability and consequently enhancing microcirculation in the adjacent tissue, contributing to the decrease the infarct volume. After reperfusion, impairment of brain microcirculation also has been observed (23). However, in this phase, significant redox alterations also occur in the tissue, which may change the •NO-inactivation rate independent of RBCs. Other pathologies with recognized impairment of cerebral vasculature are multiple sclerosis and Alzheimer disease (36, 37). Our findings provide new perspectives for understanding •NO signaling alterations in these diseases.
Apart from •NO scavenging by circulating RBCs, the results in brain slices also support the activity of perivascular •NO inactivation. Interestingly, the decrease in k observed in vivo during anoxia (21%) is similar to the difference between k in brain slices and agarose, relative to the average k in vivo (15%), supporting that inactivation mechanisms impaired during anoxia in vivo are active in brain slices. Oxygen-dependent •NO inactivation was also supported by hyperoxia experiments, in which a maximum k increase of 25% was observed for oxygen increases of ∼45 μM. These results support a nonsaturable trend in oxygen-dependent •NO inactivation and support that it is, at least in part, not mediated by a high oxygen-affinity mechanism. Another interesting point is that the decrease in k for small oxygen increases, supporting a combined effect of two processes with opposite effects in k during hyperoxia: a decrease in cerebral blood flow, due to hyperoxic vasoconstriction (48) and the increase in tissue oxygen content. The linear trend line y intercept in Fig. 5F of −19% might give an estimation of the isolated effect of vasoconstriction in •NO-signal k values. However, it is unclear whether the contribution of vasoconstriction was constant along the whole range of O2 increases obtained.
Oxygen-dependent •NO inactivation has been frequently found in dispersed preparations in vitro, resulting from the activity of molecules such as globins, some ubiquitous detoxifying enzymes, and cytochrome c oxidase (13, 18, 19, 40). In intact brain tissue, an unknown mechanism imposing a •NO half-life of 10 ms, for •NO concentrations <10 nM, has been reported in acute cerebellar slices (17), 60-fold slower in organotypic cerebellar slices (16). These half-lives are significantly lower than we found in brain slices of cortex and hippocampus, which may suggest significant heterogeneity in perivascular •NO inactivation among different brain regions. However, further experiments are needed to confirm this hypothesis, because the previous studies were based on the measurement of cGMP accumulation in tissue.
Our results indicate that, at the tissue level, the •NO-consuming activity of brain perivascular tissue is much weaker than that of the vasculature. However, intraneuronal •NO inactivation may serve as an additional barrier to protect vital intracellular structures against •NO toxicity (4) or even finely to regulate intracellular •NO effects, as recently proposed for cytoglobin in vascular cells (19).
In summary, this study evidences a critical role of the vasculature in the regulation of •NO spatiotemporal dynamics in the brain. We showed that the magnitude of •NO inactivation attributable to the vasculature is much higher than perivascular •NO inactivation. This study helps clarify what contributes to •NO inactivation, which previously remained largely unknown, having implications for the understanding of •NO signaling in the brain in either normal physiologic or pathologic situations and shows that caution should be taken when extrapolating conclusions regarding •NO dynamics from in vitro studies to physiological situations. Finally, our results support that new therapeutic approaches targeting cerebral vasculature might be developed to regulate •NO levels in pathologic situations.
Footnotes
Acknowledgments
This work was partially supported by grant SAU-BEB/103228/2008 from FCT(Portugal) and Calouste Gulbenkian Foundation (Prémio Estímulo à Investigação 2008). RMS and CFL acknowledge FCT fellowships SFRH/BD/31051/2006 and SFRH/BD/27333/2006, respectively. We thank Dr. Jorge Quintero from the Center for Microelectrode Technology, University of Kentucky, for his work on the brain-slice preparations.
Author Disclosure Statement
No competing financial interests exist.