




Abstract
Coenzyme Q (CoQ) is not only the single antioxidant synthesized in humans but also an obligatory element of mitochondrial functions. We have previously reported CoQ deficiency in white adipose tissue of ob/ob mice. We sought to determine (i) whether this deficit exists in all species and its relevance in human obesity and (ii) to what extent CoQ could be involved in adipocyte differentiation. Here we identified in rodents as well as in humans a specific very strong nonlinear negative correlation between CoQ content in subcutaneous adipose tissue and obesity indexes. This striking correlation reveals a threshold value similar in both species. This relative deficit in CoQ content in adipose tissue rapidly took place during the time course of high-fat-diet-induced obesity in mice. Adipocyte differentiation was assessed in vitro using the preadipocyte 3T3-F442A cell line. When CoQ synthesis was inhibited by a pharmacological approach using chlorobenzoic acid, this strongly triggered adipose differentiation. In contrast, adipogenesis was strongly inhibited when a long-term increase in CoQ content was obtained by overexpressing human 4-hydroxy benzoate acid polyprenyltransferase gene. Altogether, these data suggest that a strict level of CoQ remains essential for adipocyte differentiation, and its impairment is associated with obesity. Antioxid. Redox Signal. 14, 403–413.
Introduction
At this crossroad between oxidative stress and mitochondria, coenzyme Q (CoQ) is an intriguing molecule. Indeed, it is the only lipophilic nonenzymatic antioxidant synthesized in humans (13) but also the single lipid component obligatory for mitochondrial and extra-mitochondrial electron transport (27). At this subcellular level, it has also other important functions such as the regulation of the mitochondrial permeability transition pore and the activity of uncoupling proteins (12).
CoQ biosynthesis begins with the formation of a hydroxyl-benzoic acid head group derived from tyrosine and a lipophilic polyisoprenoid chain (26), synthesized from acetyl-coenzyme A through the mevalonate pathway. The number of polyisoprenoid units determines the CoQ form, for example, CoQ9 in rodents and CoQ10 in humans. Several CoQ proteins are required for the CoQ step-by-step biosynthesis in eukaryotes. Although their genes are well known in Saccharomyces cerevisiae, they are not definitively identified in human. Nevertheless, 4-hydroxy benzoate acid polyprenyltransferase (COQ2) is the key enzyme catalyzing the attachment of the polyisoprenoid chain to the quinone ring, and this activity takes place mainly in the inner mitochondrial membrane, facing the matrix side. The human homolog gene of COQ2 (hCOQ2) has been isolated and validated (14).
CoQ content was increased in isolated adipocytes versus the stromal vascular fraction of adipose tissue and its levels were strongly reduced in obese Zucker rats (17). However, we recently reported that co-administration of CoQ with Rosiglitazone results in the amelioration of oxidative metabolism and antioxidant protection in target tissues (5).
In the present study, we confirmed a specific deficit of CoQ content in adipose tissue in obesity models including humans. Further, we aimed to investigate the effect of CoQ on adipocyte differentiation.
Materials and Methods
Animal experimentation
Obese ob/ob and lean C57BL/6 male mice were housed under standard conditions (12-h light/dark cycles), feeding (diet: UAR Villemoissson sur Orge; food and water ad libitum), and temperature (21°C).
For the high-fat (HF)-diet experiences, lean C57BL/6 mice were divided into two groups. One group was fed with standard diet (lean animals), and the other received a HF diet (High Fat Bioserve, SAFE), both ad libitum. Body weight (BW) was monitored weekly for 14 weeks.
Mice were sacrificed by decapitation after CO2 anesthesia at weeks 0, 6, and 12 (lean animals), or every 2 weeks (HF-diet mice). Blood, inguinal WAT (iWAT), epidydimal WAT, liver, heart, and gastrocnemius skeletal muscle samples were dissected, weighted, frozen, and analyzed for CoQ and α-tocopherol contents.
Human samples
Samples of human abdominal subcutaneous adipose tissue were obtained from patients undergoing abdominal dermolipectomy in the Plastic Surgery Department of Croisé Laroche Clinic, Ambroise Paré Clinic, C.I. Dr. Omez Clinic, La Louvière Clinic (France), and during bariatric surgery at Antwerp University Hospital, Belgium. Patients gave their informed consent and this study was approved by the Ethical Committee of Croisé Laroche Clinic, Ambroise Paré Clinic, C.I. Dr. Omez Clinic, La Louvière Clinic, and the Antwerp University Ethical Committee. Samples were frozen for further CoQ and α-tocopherol analysis.
Isolation of mature white adipocytes from iWAT of obese mice
Mature white adipocytes were isolated from subcutaneous iWAT of lean and obese mice. In brief, tissues were digested at 37°C with 0.5 mg collagenase type II (Sigma) per gram of tissue for 45 min in oxygenated Krebs solution (pH 7.4) containing 20 mM HEPES, 3 mM glucose, and 3.5% free fatty acid bovine serum albumin. Tissue digests were filtered and floating mature adipocytes were separated by centrifugation. The upper fraction was then collected and cell number determined.
Cell culture conditions
3T3-F442A preadipocytes were routinely cultivated under a 5% CO2 humidified atmosphere at 37°C. Cells were kept in Dulbecco's modified Eagle's medium supplemented with 10% donor bovine serum, 2 mM L-glutamine, 0.25 U/ml amphotericin B, and antibiotic mixture (100 U/ml penicillin + 100 μg/ml streptomycin) until confluence. For differentiation experiments, cells were seeded at 5500 cells/cm2 in six-well plates and were grown for 4 days until confluence (day 0). At day 0, cells were induced to differentiate by the change of 10% donor bovine serum to 10% fetal bovine serum. For COQ2 inhibitor or antioxidants treatments, confluent cells (J0) were treated every 2 days with 0.25–1 mM chlorobenzoic acid (CBA) or 50 μM MnTBAP until 7 or 14 days of differentiation.
Cell number was assessed using Beckman coulter. Triacylglycerol content was measured on cells scrapped in phosphate-buffered saline (PBS) using the Triglycerides Enzymatic PAP150 Kit (BioMérieux) and protein content was measured with Bio-Rad DC protein assay kit (Bio-Rad Labs).
Establishment of 3T3-F442A clones stably expressing hCOQ2
The plasmid used in the present study was pBV134 (a kind gift by I. Climent, Sweden), the construction of which has been described in a previous publication (14). This plasmid contained human COQ2 cDNA under the control of cytomegalovirus promoter and neomycin resistance gene under the control of SV40. Proliferating 3T3-F442A cells were transfected by electroporation with 2 μg of plasmid pBV134 with Amaxa Electroporator and Cell Line Nucleofector Kit V. After plating, geneticin-resistant clones were selected after 9 days of culture and independently amplified. Four clones were selected for further studies: hCOQ2 cl A, B, C, and D.
Quinones determination
Cells and frozen iWAT were solubilized in 2-propanol for detection of α-tocopherol and CoQ9 or CoQ10 by reverse-phase high-performance liquid chromatography with electrochemical detection on the same run as previously described (16). Results were expressed as nmol/mg of mitochondrial proteins or nmol/g of tissue.
Determination of ROS generation
Total and mitochondrial ROS were assessed by flow cytometry using 2′,7′-dichlorodihydrofluorescein diacetate (H2-DCFDA; Invitrogen) and MitoSOX Red (3,8-phenanthridinediamine, 5-(6′-triphenylphosphoniumhexyl)-5,6 dihydro-6-phenyl; Molecular Probes), respectively, with a method slightly modified from Mukhopadhyay et al. (21). Briefly, 1 million cells were trypsinized and incubated for 10 min at 37°C with H2-DCFDA or MitoSOX in PBS (with Ca/Mg). After washing twice with PBS, the measurements were carried out using fluorescence activated cell sorting Calibur (Becton Dickinson). H2-DCFDA and MitoSOX Red were excited by laser at 488 nm, and the data were collected at forward scatter, side scatter, and 585/42 nm channel. The data are presented as mean intensity of MitoSOX Red fluorescence.
Aconitase activity
Aconitase (cis-isocitrate hydratase, EC4.2.1.3) was measured as a marker of oxidative damage using Bioxytech Aconitase-340 Assay Kit (OxisResearch) on cell homogenates. The assay is based on measurement of concomitant formation of NADPH from NADP+ when isocitrate (produced by aconitase) was decarboxylated by isocitrate dehydrogenase. Briefly, confluent cells were homogenized in 500 μL assay buffer (Tris-HCl, pH 7.4) provided by the kit with tissue lyser beads (Qiagen). Enzymatic reaction was started by mixing 200 μL homogenate (about 2 mg proteins/ml) with 200 μL trisodium citrate in Tris-HCl (pH 7.4), 200 μL isocitrate dehydrogenase, and 200 μL NADP+. Absorbance was recorded during 30 min at 340 nm at 37°C. Then, slope was estimated in the linear part of the curve and aconitase activity was calculated according to the supplier's instructions with normalization to the protein concentration of the sample measured by Lowry method (Bio-Rad DC protein assay).
RNA extraction and real-time polymerase chain reaction analysis
Cells were homogenized in a highly denaturing guanidine-thiocyanate-containing buffer supplied by RNeasy Mini Kit (Qiagen). Total RNA was then extracted according to the supplier's instructions. After elimination of all residual DNA by DNase I (Qiagen), 0.5 μg RNA was reverse transcribed using High-Capacity cDNA Reverse Transcription Kit (Applied Biosystems) with random primers and Multiscribe Reverse Transcriptase (Invitrogen). Real-time polymerase chain reaction (PCR) was performed starting with 12.5 ng cDNA and both sense and antisense oligonucleotides in a final volume of 20 μl using the SYBR Green TaqMan Universal PCR Mastermix (Eurogentec). Fluorescence was monitored in GeneAmp 7000 detection system instrument (Applied Biosystems). Oligonucleotide primers were designed using Primer Express (Perkin-Elmer Life Sciences) and verified on Blast Nucleotide software. Primer specificity was checked by the occurrence of a single pike of expected size during dissociation experiments. Analysis of reference genes (cyclophillin or 36B4) expression was performed to normalize gene expression. Results were expressed as arbitrary units relative to reference gene expression and efficiency of the PCR reaction was checked for all couple of primers.
Statistical analysis
Results are expressed as means ± standard error of the mean. Statgraphics Plus 5.1 was used for statistical analysis. Simple nonlinear regression was used to assess the relationship between bodyweight or iWAT weight and CoQ or α-tocopherol contents in rodent adipose tissue, and body mass index (BMI) and CoQ or α-tocopherol contents in human adipose tissue. The analysis of variance with lack-of-fit test was assessed to determine whether the selected model was adequate to describe the selected data. The test was performed by comparing the variability of the current model residuals to the variability between observations at replicate values of the independent variable X. When the p-value for lack-of-fit in the analysis of variable table was ≥0.10, the model was considered to be adequate for the observed data.
Summary statistics as well as 95% confidence intervals for each parameter (BW, WAT weights, BMI, CoQ, and α-tocopherol contents in rodents or humans) and each population (lean and obese for rodents, or BMI <30 and BMI >30 for humans) were calculated. Standardized kurtosis was assessed to determine whether the samples came from a normal distribution (value between −2 and +2). Short-cut values were determined as the superior limit of the 95.0% confidence interval for obese populations.
Results
Quinones contents in adipose tissue in lean and obese mice and human
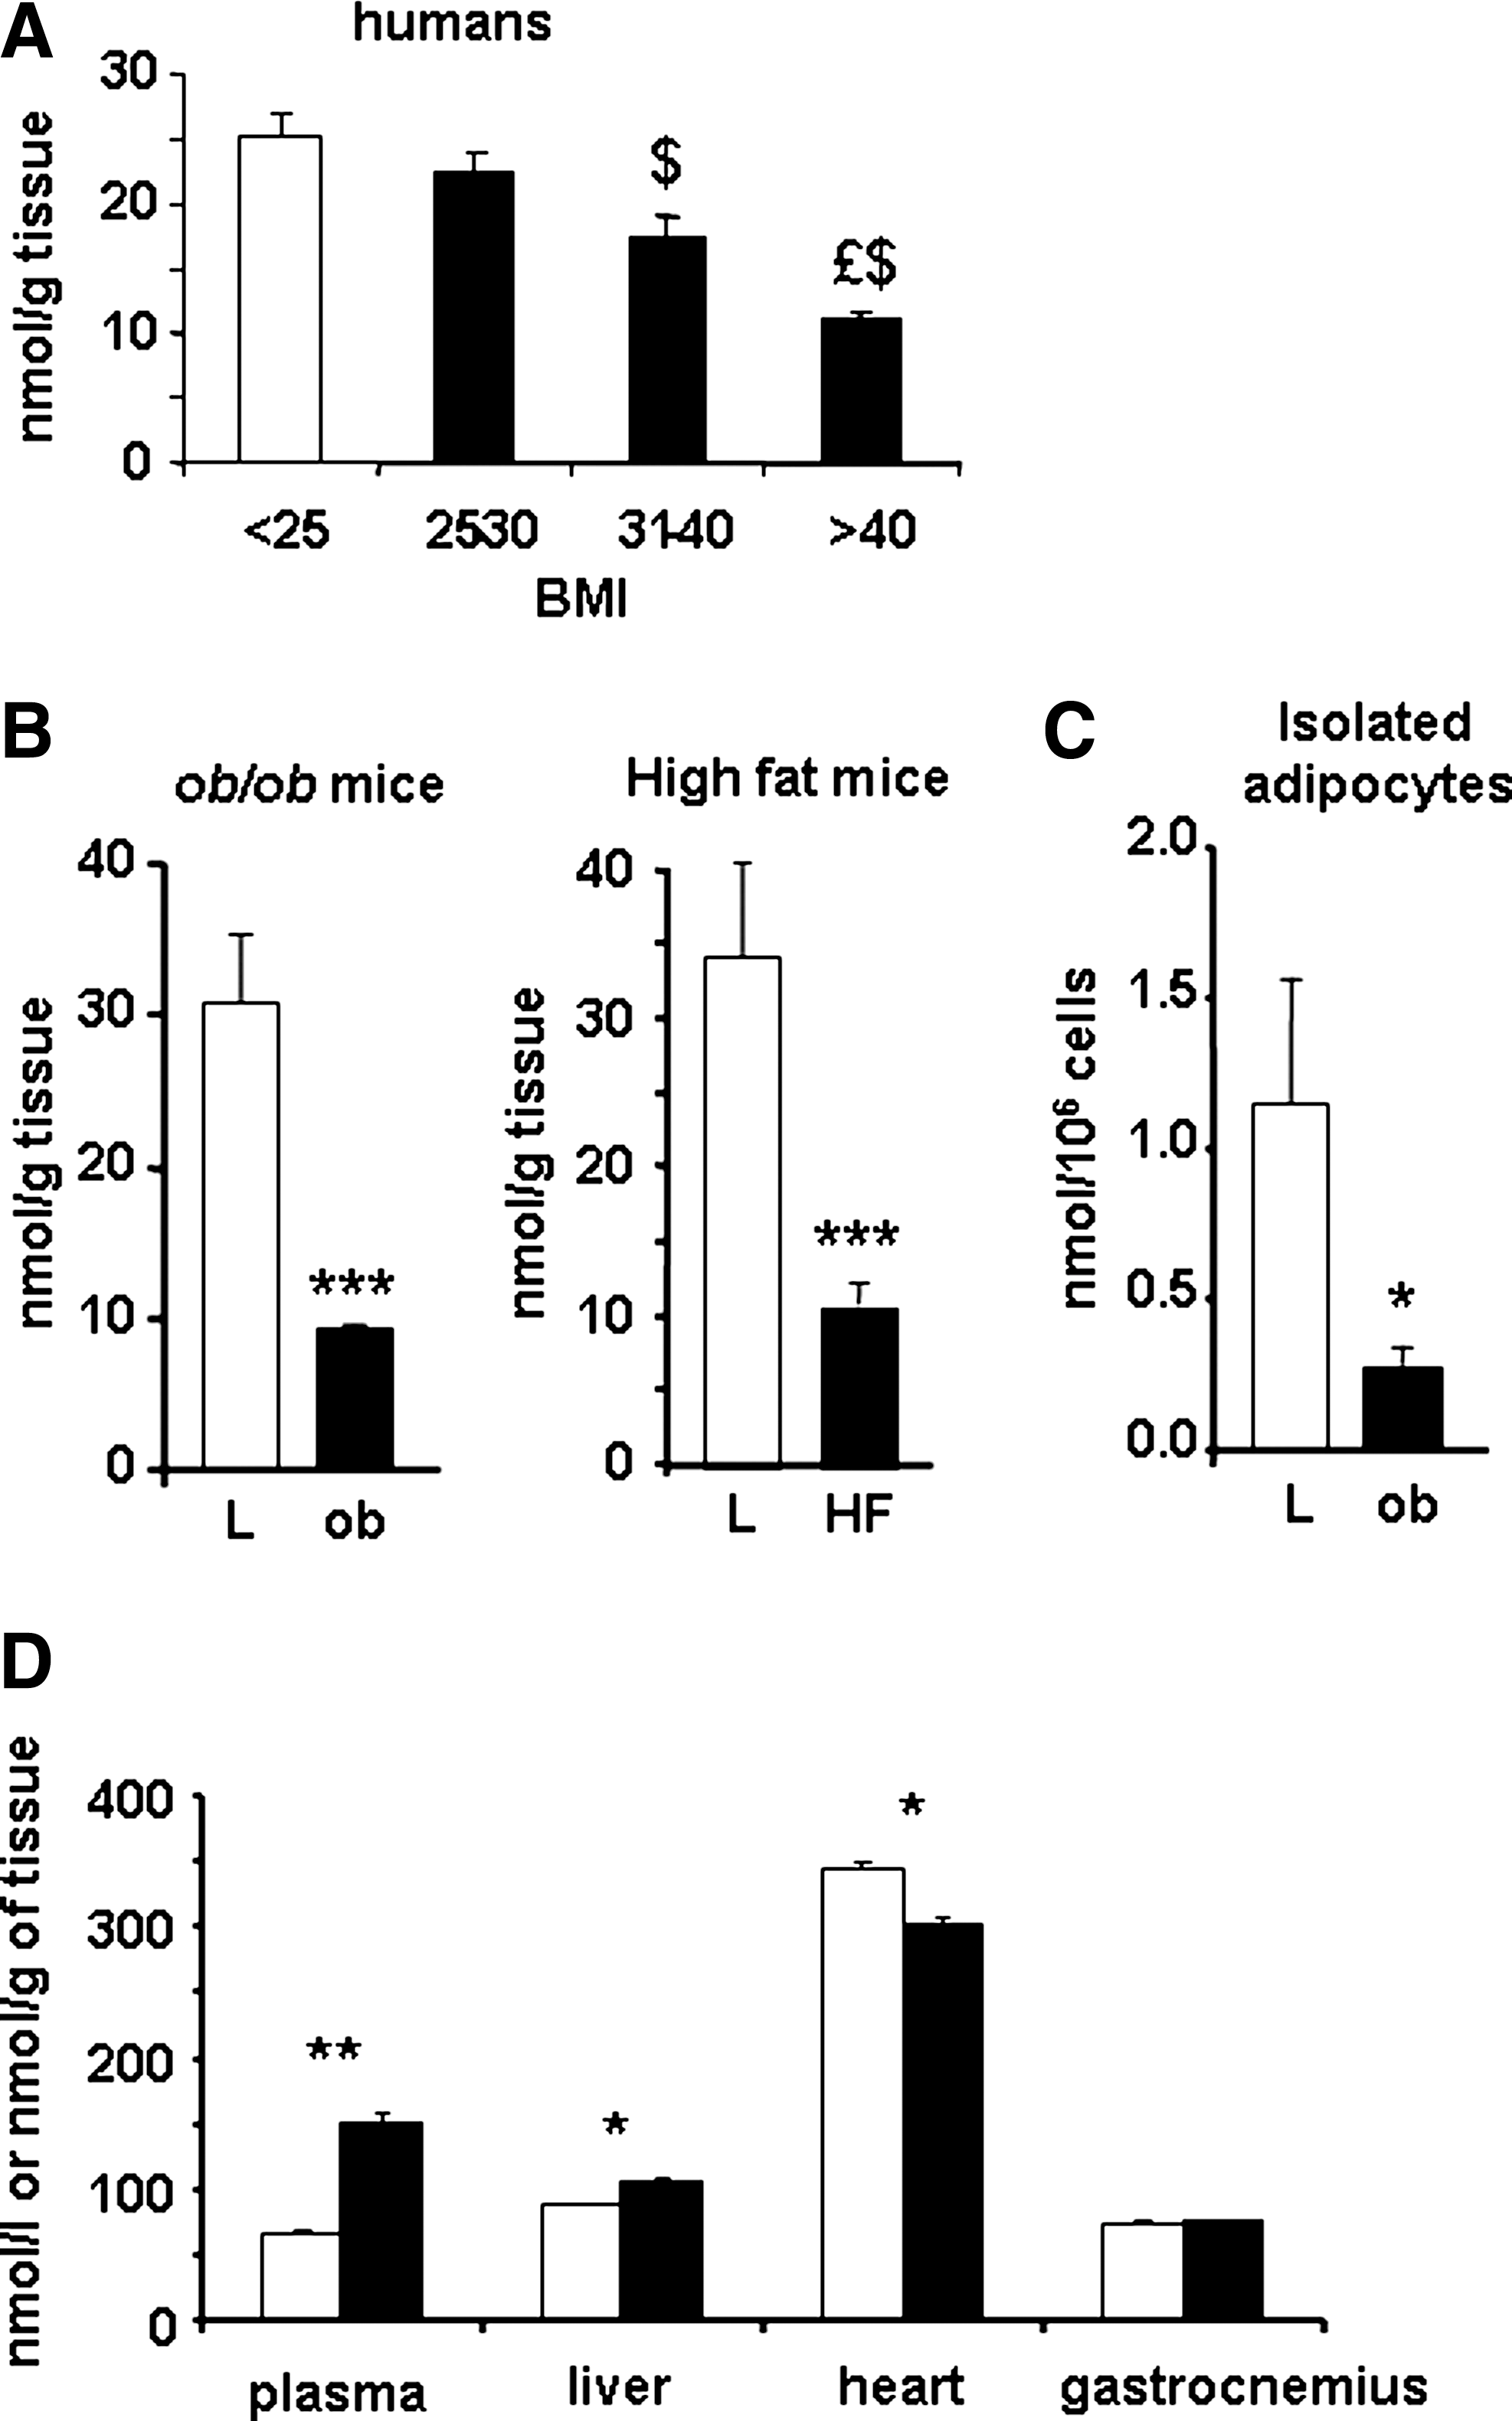
CoQ and α-tocopherol were quantified in different tissues of lean and genetic or diet-induced obese mice as well as in humans. In all situations, CoQ content was significantly decreased in subcutaneous adipose tissue (Fig. 1A, B). No similar decrease was observed for α-tocopherol, another lipophilic antioxidant (data not shown). Taking into account the cell number, CoQ was still decreased in isolated adipocytes from obese animals (Fig. 1C), whereas no change was observed in mitochondrial proteins (data not shown). In contrast to adipose tissue, CoQ content was increased in blood and liver and slightly decreased in heart of obese mice, with no changes in skeletal muscle (Fig. 1D). Taken together, our data demonstrate that adipocyte hypertrophy and obesity are associated with a specific CoQ deficit in adipose tissue. Further, in ob/ob mice, this reduction of CoQ content in adipose tissue was associated with a strong decrease in mRNA level of enzymes involved in its synthesis: CoQ 2, 6, and 7 (Supplemental Fig. 1; see
When all measures were analyzed independently and compared between ob/ob and HF-diet-induced obesity mice, no difference was found between these two groups in either body and adipose tissue weights, or CoQ and α-tocopherol content in adipose tissue. Thus, data for both obese populations were put together for the following analysis. When BW and iWAT weight were plotted as a function of adipose tissue CoQ (Fig. 2A, C) or α-tocopherol (Fig. 2B, D) levels, a strong nonlinear negative correlation was obtained for CoQ only. These curves revealed a much greater variability in adipose tissue CoQ levels of lean compared with obese mice (variance for lean and obese mice: 81.62 vs. 19.23, respectively) (Fig. 2C). The superior limit of the 95.0% confidence interval for the obese population was 13.66 nmol CoQ/g tissue (Table 1). This clearly identifies a striking threshold value below which all the animals were obese (Fig. 2A).

p < 0.001 obese versus lean mice. Standardized skewness and standardized kurtosis values outside the range of −2 to +2 indicate significant departures from normality.
CoQ, coenzyme Q; WAT, white adipose tissue.
We then investigated whether similar correlations could be present in humans. No difference between male and female was found for either CoQ or α-tocopherol (data not shown) content in adipose tissue. Thus, in lean humans, CoQ content was 23.39 ± 8.19 and 25.60 ± 7.83 nmol/g for male and female, respectively, and in obese individuals, CoQ values were 11.52 ± 2.47 and 13.26 ± 4.32 nmol/g for male and female, respectively. Thus, for the following analysis both sexes were pooled (Table 2 and Fig. 2). BMI was plotted as a function of CoQ or α-tocopherol contents in subcutaneous WAT (Fig. 2E, F). Once again a strong nonlinear regression was found for CoQ. Like in rodents, the curve revealed in humans a great variability in adipose tissue CoQ levels of nonobese compared with obese individuals (variance for lean and obese humans: 61.06 and 8.33, respectively) (Table 2). Interestingly, the short-cut values for CoQ in humans (13.26 nmol/g) and rodents (13.66 nmol/g) were almost the same (Fig. 2A, C, and E). It is noteworthy that α-tocopherol values of normal and those of obese people largely overlapped (Fig. 2F and Table 2).
p < 0.001 and b p < 0.01 obese versus lean subjects. Standardized skewness and standardized kurtosis values outside the range of −2 to +2 indicate significant departures from normality.
BMI, body mass index.
To define whether CoQ decrease was a cause or a consequence of obesity, we investigated the changes of CoQ content during a 12-week HF-diet-induced obesity model. Although the adipose tissue weight largely increased (Fig. 3A), on one hand, the tissue concentration of CoQ in iWAT rapidly and strongly decreased in a significant way from 6 to 12 weeks of diet (Fig. 3B), and on the other hand, the total content of CoQ increased until 6 weeks in the fat pads, significantly more raised in iWAT HF mice; however, 12 weeks of diet is associated with a significantly decreased total content of CoQ in the two pads of HF-diet mice (Fig. 3C). This decrease was specific to CoQ as, in the same condition, the content of α-tocopherol did not change during the first weeks or even a significant increase could be detected at the end of the 12-week period (Fig. 3D).

Inhibition of CoQ synthesis increased adipogenesis
The previous in vivo results suggested a possible role of CoQ in adipogenesis. Therefore, we wanted to know whether CoQ level could control in vitro adipocyte differentiation. To this end, two strategies were developed in the murine preadipocyte cell line 3T3-F442A. First, in preliminary experiments, we unsuccessfully tried to knock down CoQ biosynthesis using siRNA. We never obtained stable clones suggesting that CoQ deficiency could be lethal for our cells. As an alternative, we decided to set up a pharmacological strategy to inhibit CoQ synthesis using CBA. Second, to obtain a long-term increase in CoQ content, 3T3-F442A clones stably expressing human COQ2 gene were generated.
CBA has been described as a COQ2 enzyme inhibitor almost 35 years ago (1). We therefore treated line 3T3-F442A with increasing concentrations of CBA, from confluence till the end of the differentiation process, 7 days later. As expected and shown in Figure 4A, 1-week CBA treatment significantly decreased CoQ content. As the maximal effect was obtained with 1 mM CBA, this concentration was chosen for next experiments. After 1-week treatment with CBA 1 mM, 3T3-F442A cells accumulated more triglycerides than cells treated with the vehicle (Fig. 4B). This result was confirmed by the concomitant increase in peroxisome proliferator–activated receptor gamma 2 and FAS mRNA, two recognized markers of adipose differentiation (Fig. 4C).
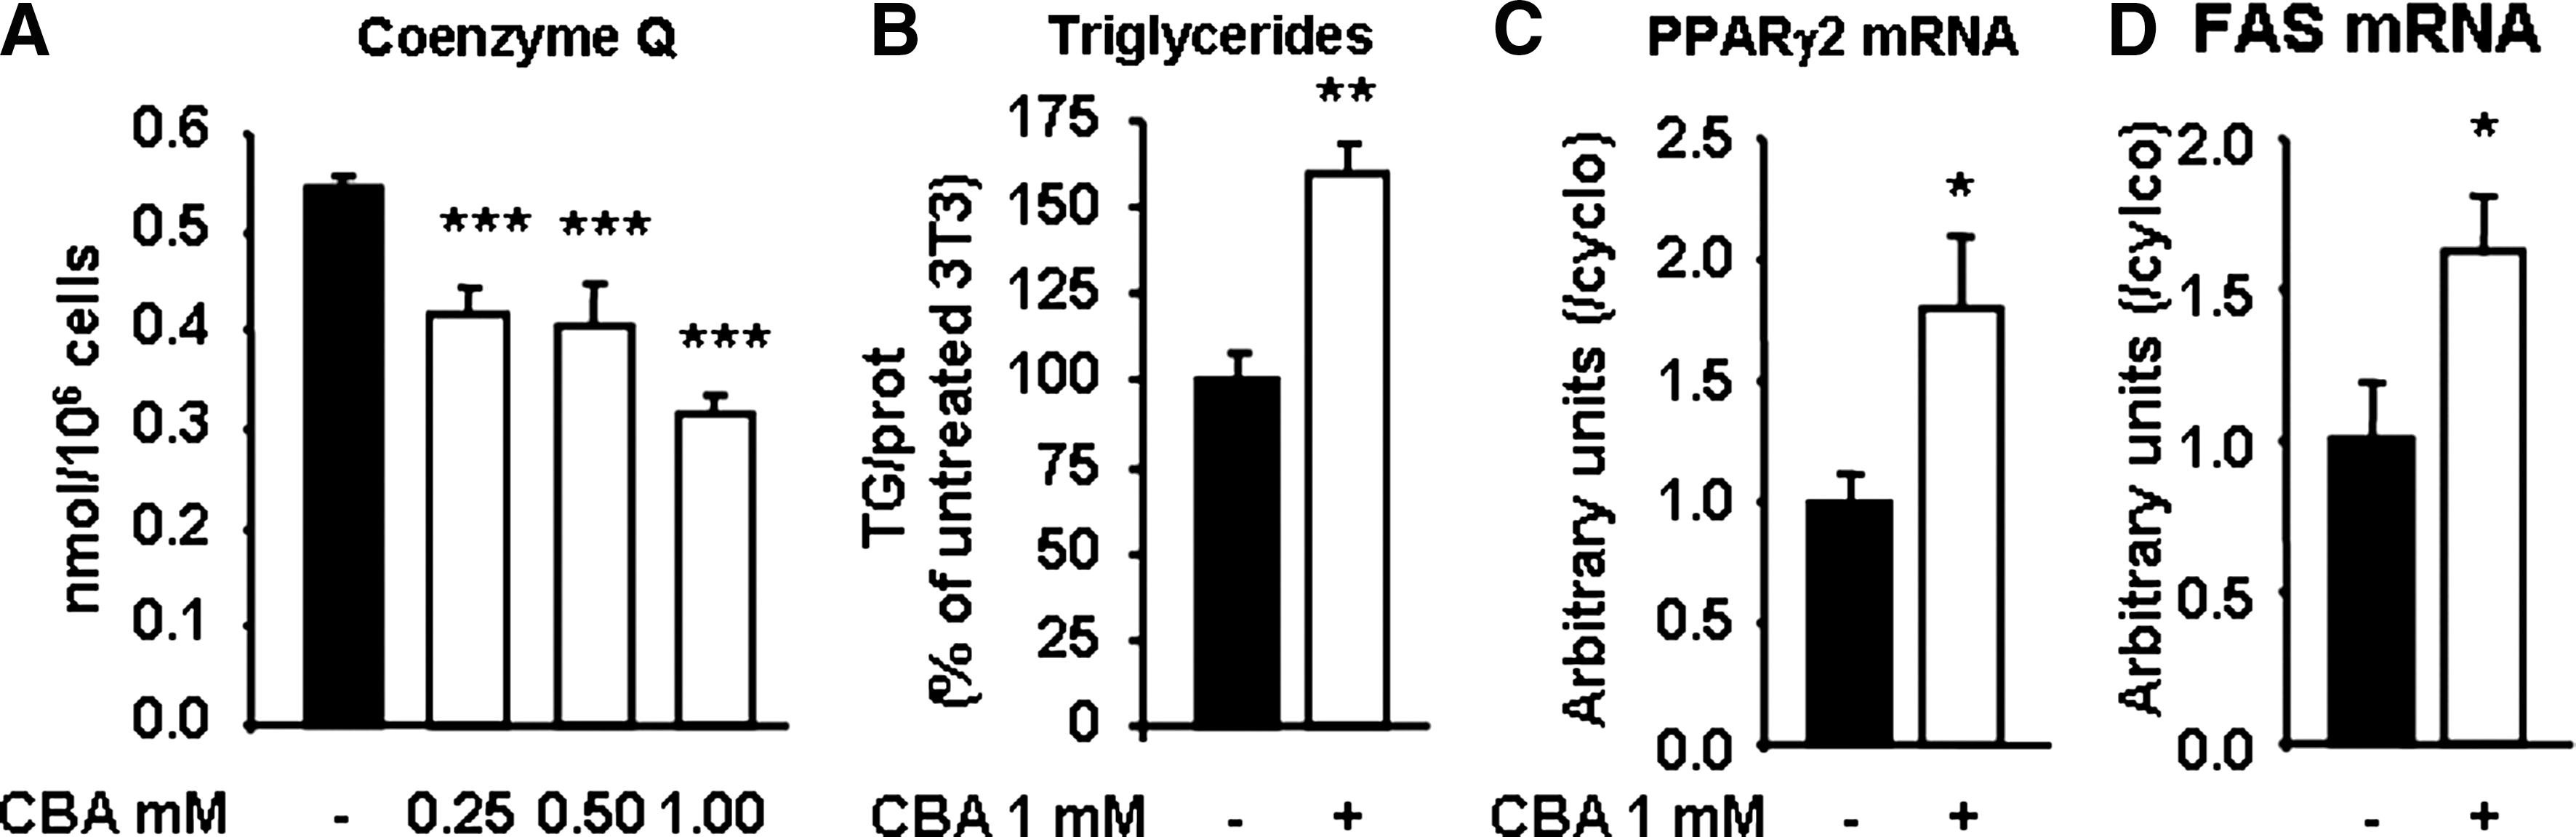
Therefore, CBA reduces CoQ content in 3T3-F442A cells and increases their capacity to differentiate to adipocytes.
Enhancing CoQ synthesis decreased adipogenesis
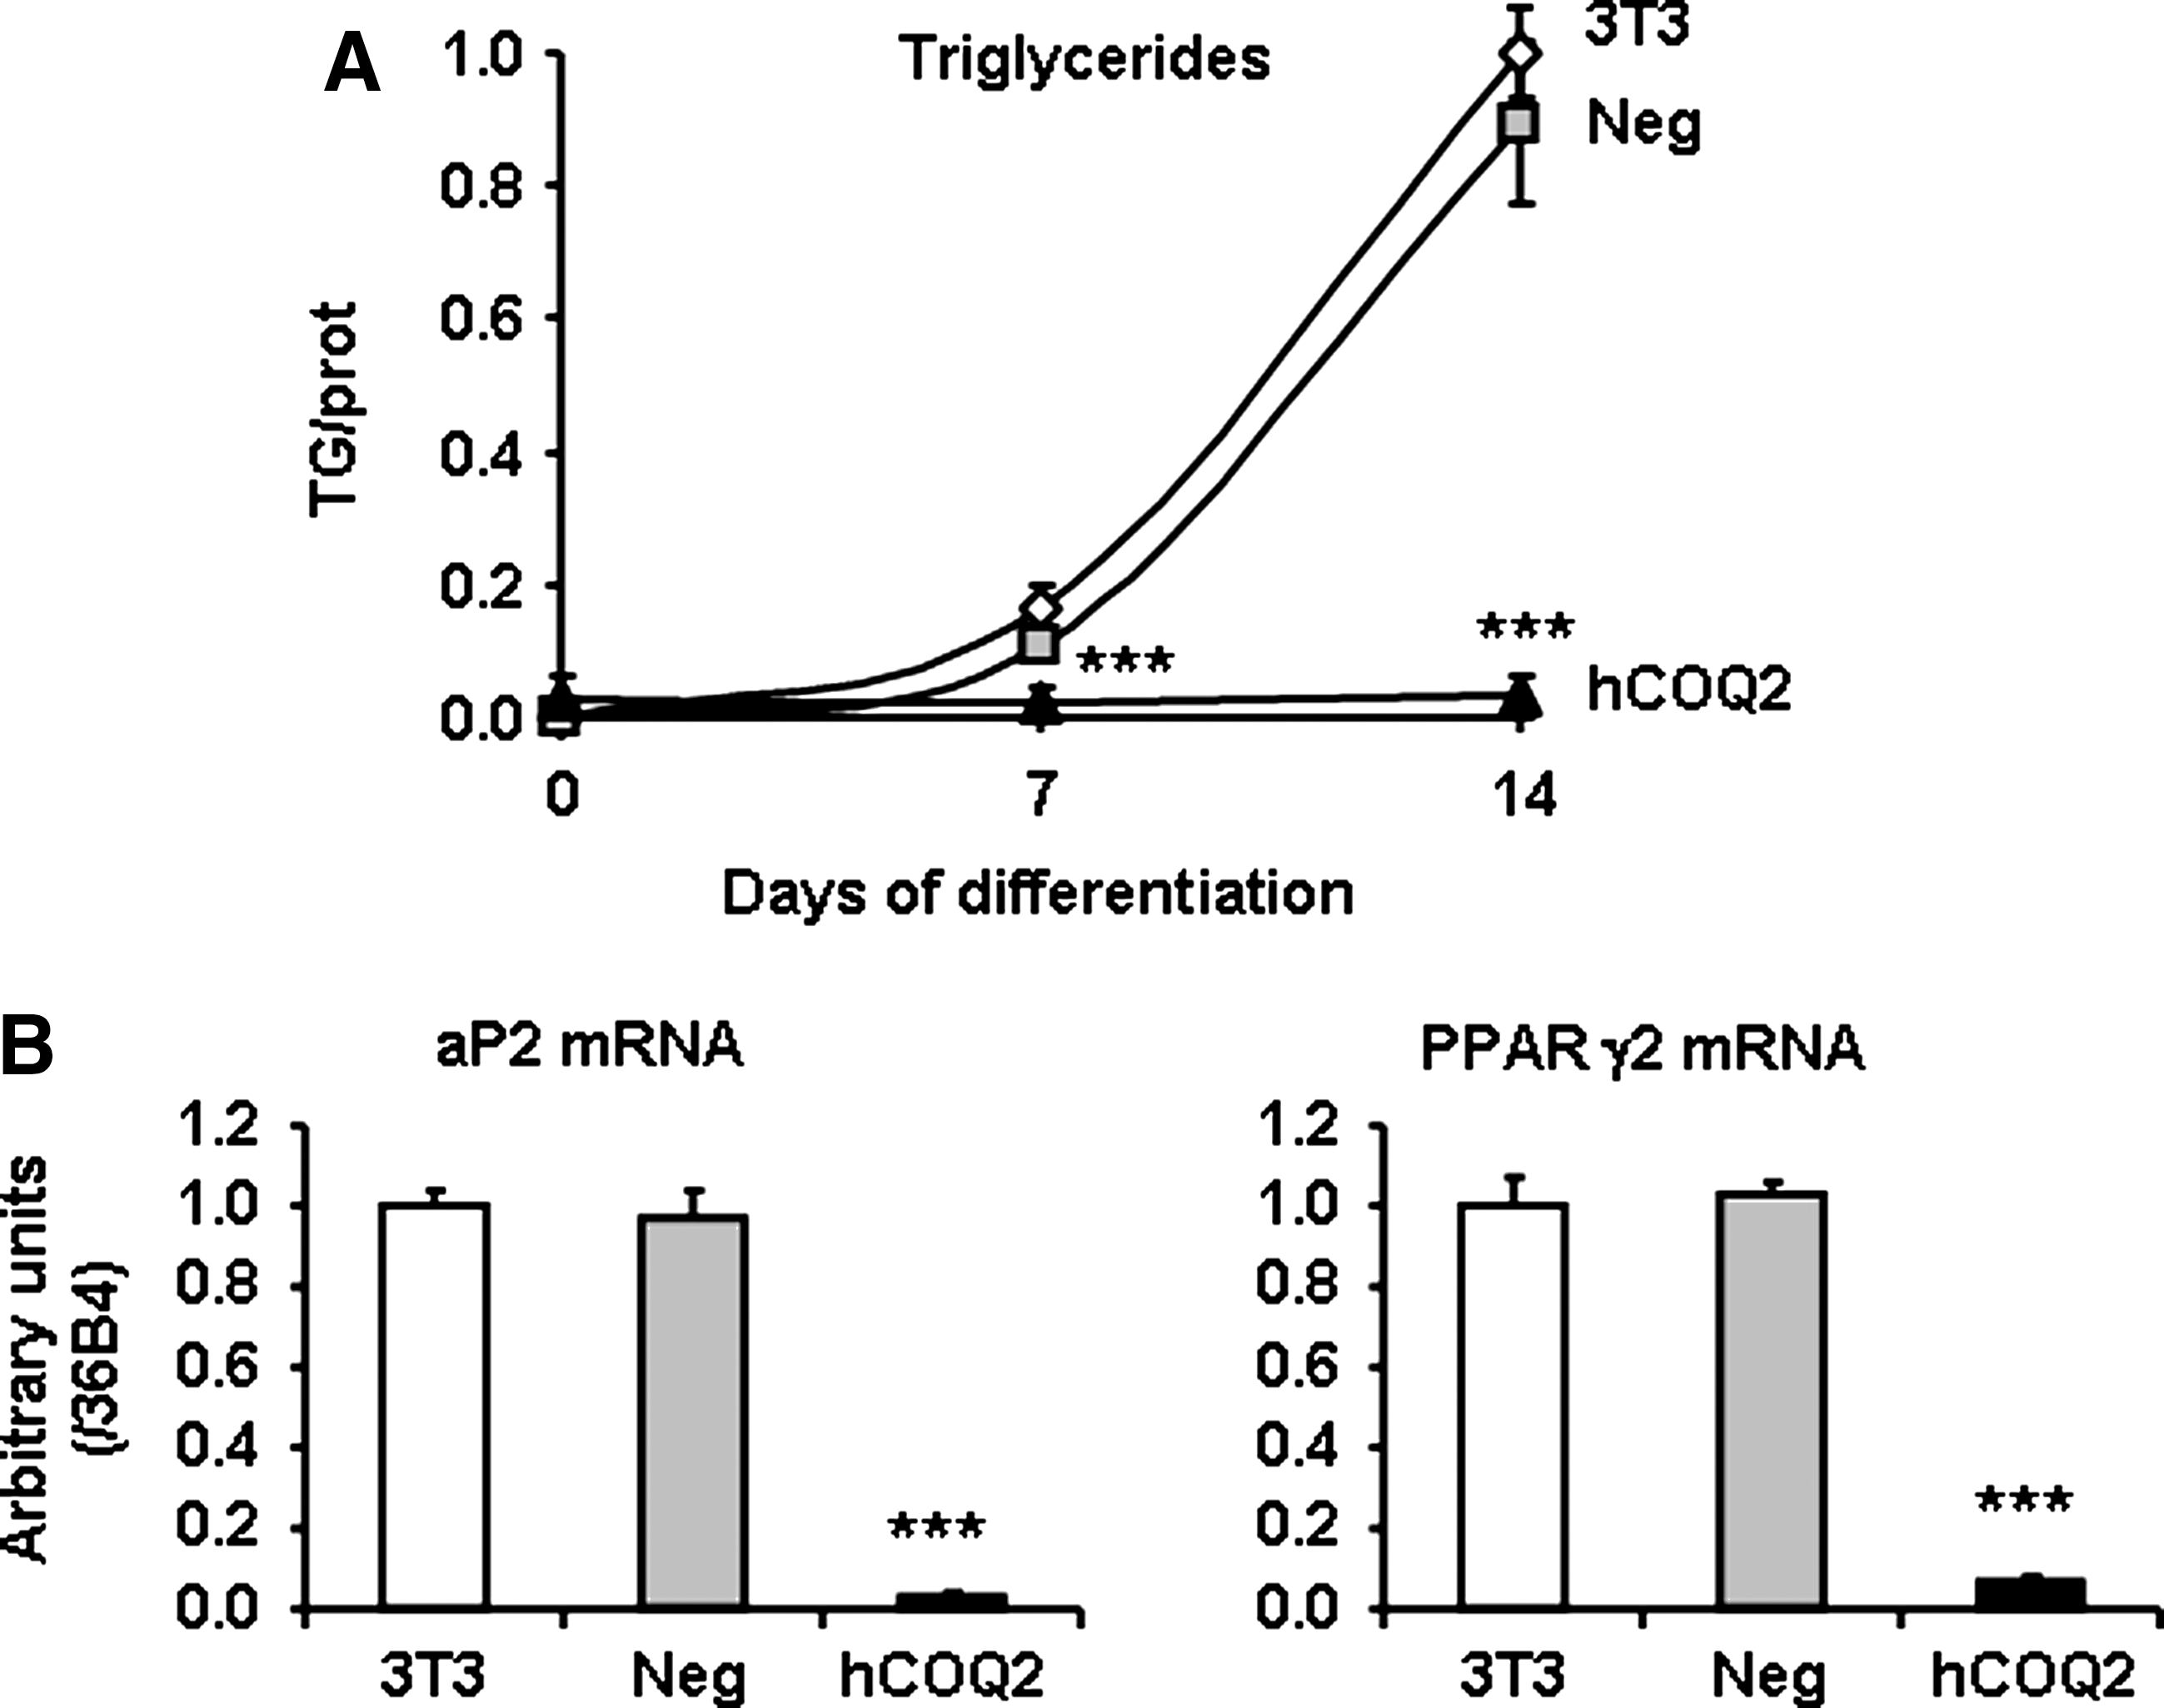
To study the long-term effects of an increase in CoQ content on adipocytes, 3T3-F442A (3T3) clones stably expressing hCOQ2 were generated with a standard procedure. Clones overexpressing hCOQ2 were selected, independently amplified, and then selected using a double screening: (i) COQ2 overexpression and (ii) an increase in CoQ content. When compared with untransfected 3T3-F442A or clones transfected with a vector containing a scramble DNA (called Neg 3T3), four COQ2 clones were selected with variable levels of hCOQ2 mRNA (Fig. 5A). These four clones contained significantly more CoQ and accumulated than control cells (native and Neg 3T3 cells) (Fig. 5B). As shown in Figure 5C, triglycerides accumulation was strongly reduced in hCOQ2 overexpressing clones compared with control cells after 14 days of differentiation. The time course of differentiation of hCOQ2 clone B demonstrated that triglycerides content was reduced since 7 days of differentiation (Fig. 6A). The strong decrease in peroxisome proliferator–activated receptor gamma 2 and activator protein 2 mRNA levels confirmed the reduction of adipose differentiation in hCOQ2 clone B (Fig. 6B).

ROS production in hCOQ2 clones
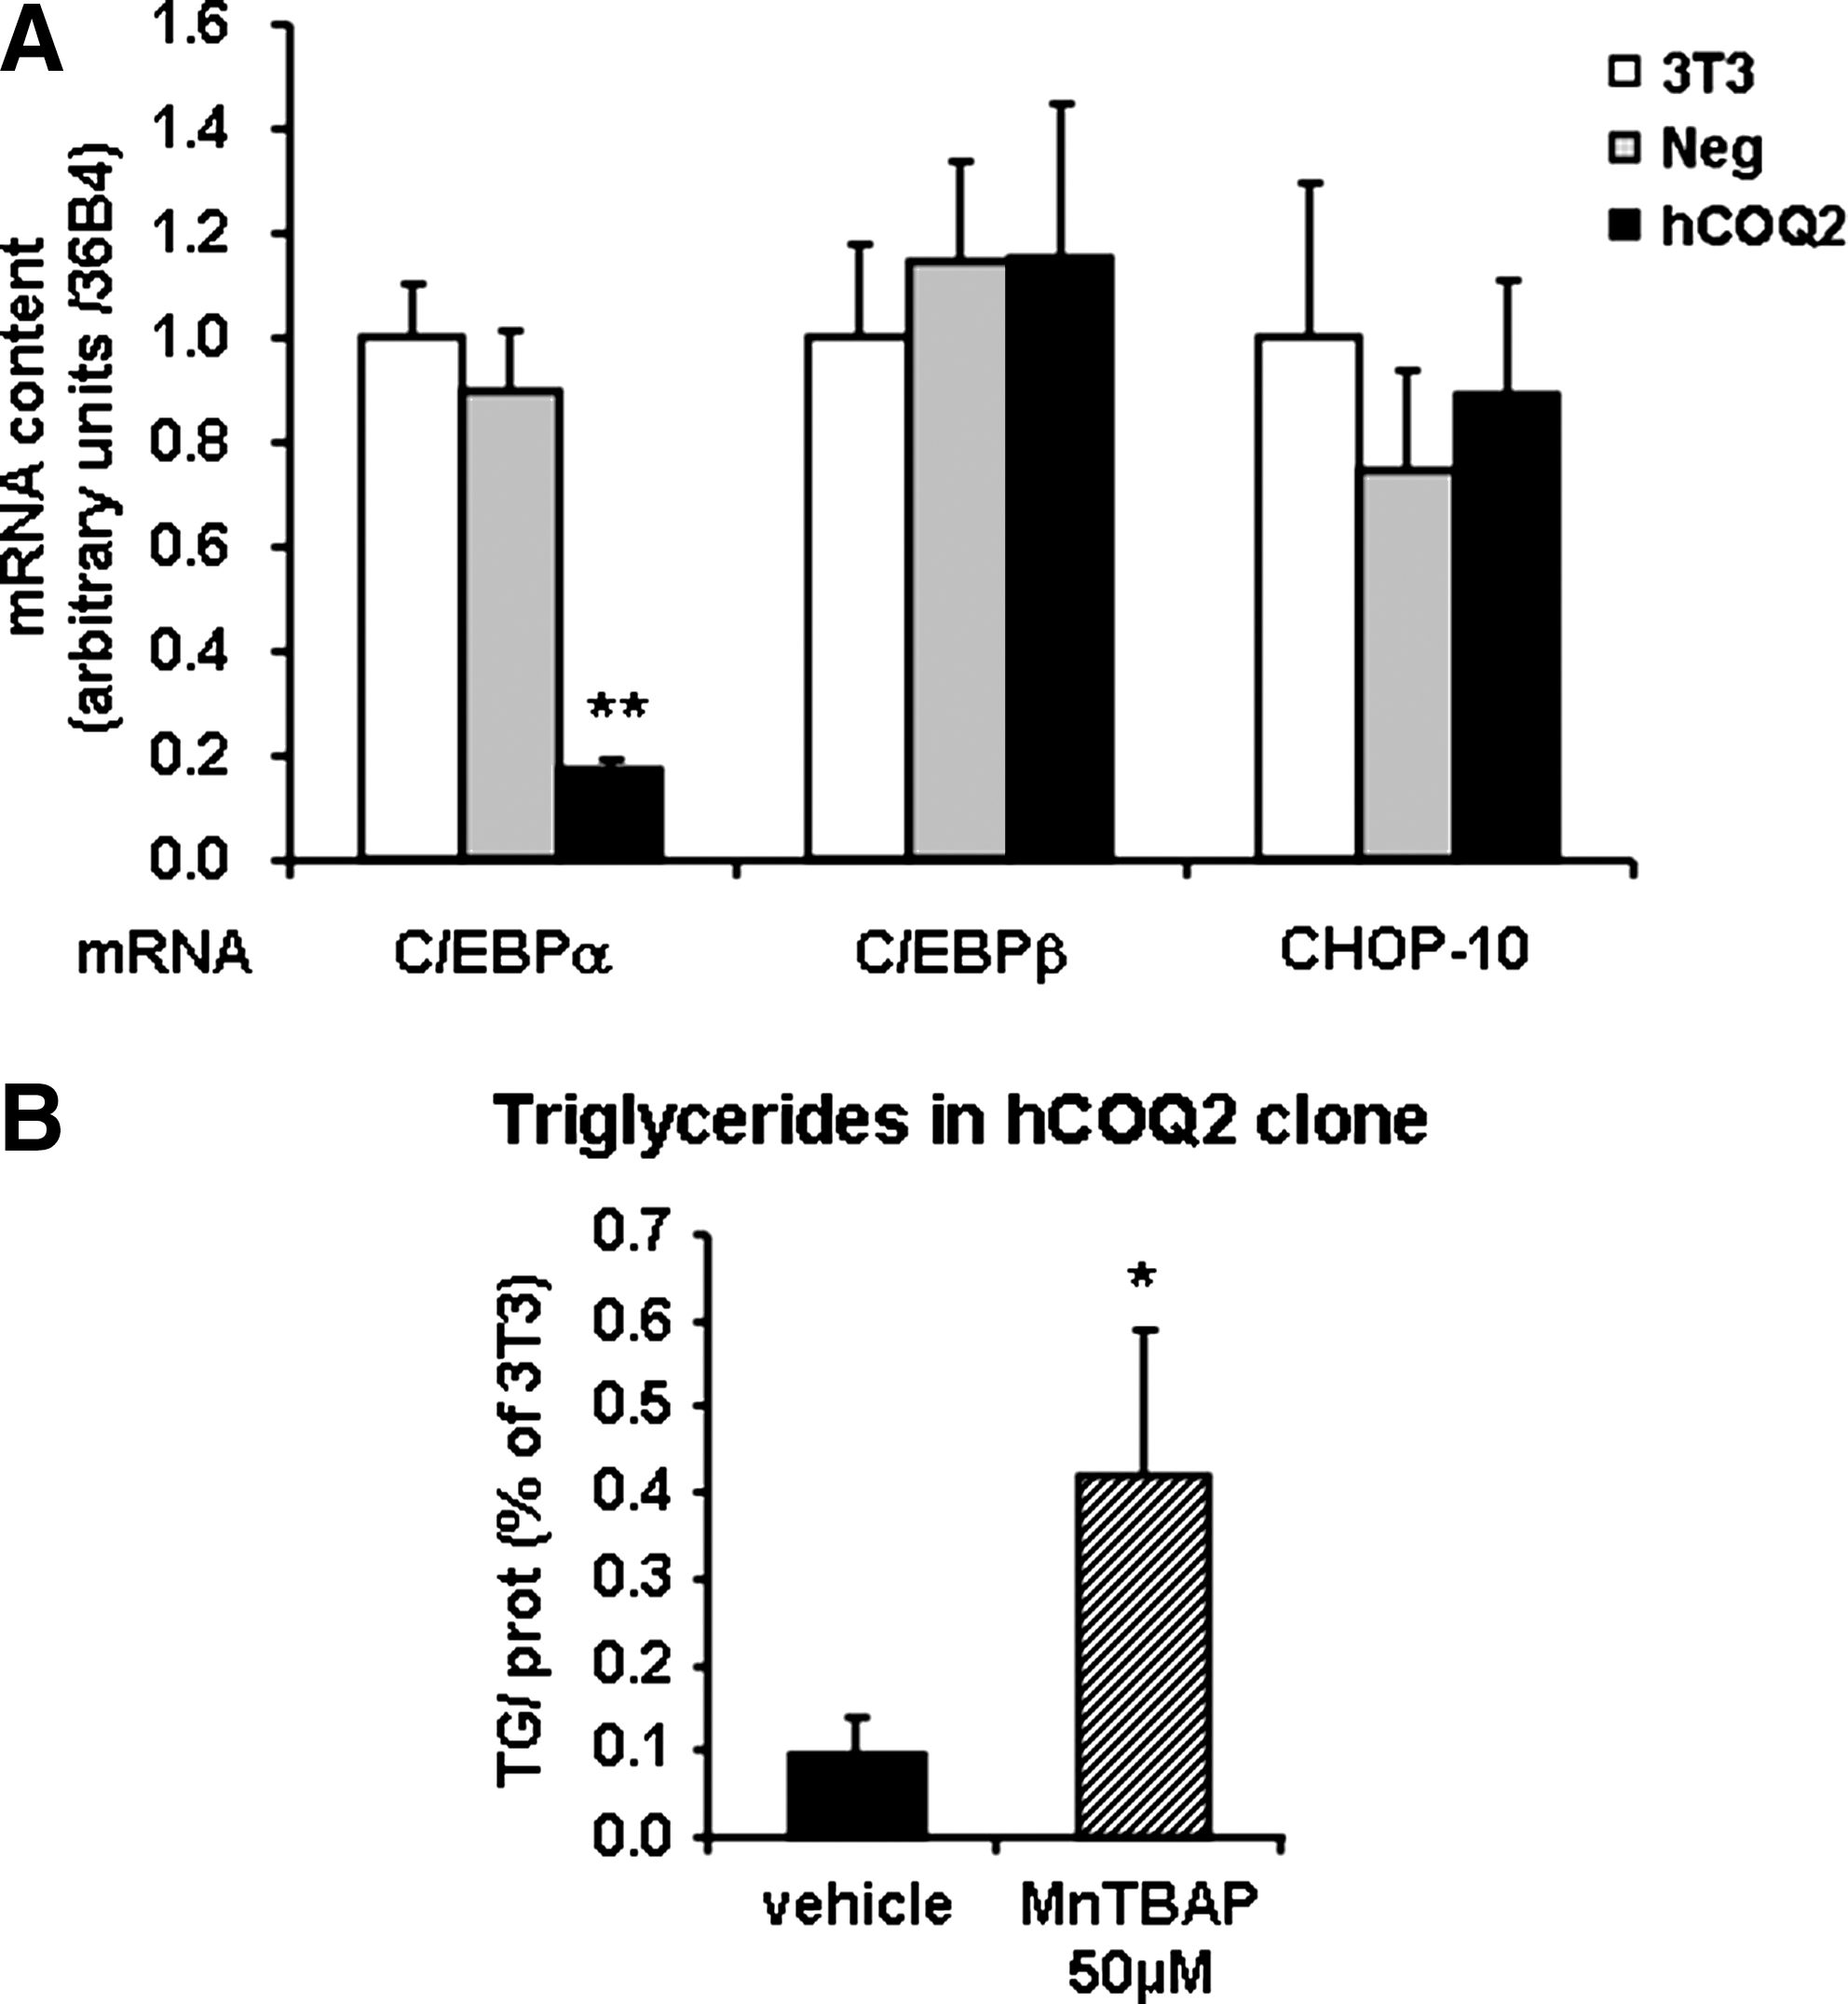
As CoQ is known to display a role as antioxidant or ROS-producing agent, depending on its localization, total and mitochondrial ROS were measured in hCOQ2 clone B to determine the effect of CoQ content increase. Therefore, ROS were measured in confluent COQ2 clones with H2-DCFDA (a nonspecific probe) and with a probe specific to mitochondrial ROS (MitoSOX). In these conditions, hCOQ2 clones produce less ROS than 3T3 or Neg cells, whereas mitochondrial ROS were significantly increased (Fig. 7A, B, respectively). The decrease in total ROS was further confirmed by the fact that aconitase activity measured in the same conditions was not inhibited (Fig. 7C). The potential increase of ROS observed in mitochondria in hCOQ2 cells linked to the decreased part of the mitochondrial oxidized CoQ (Fig. 7E) is associated with a constant activity of the aconitase. The mitochondrial CoQ redox state is consistent with the increase of mitochondrial ROS generation, which demonstrates that these mitochondrial ROS have a specific share at a strict level in the redox-dependent way of adipocyte differentiation, particularly in CCAAT/enhancer-binding protein alpha transcription (Fig. 8A), and shows that there is an antioxidant regulation, which could be explained by the increase of CoQ. We then tried to reverse this ROS production with MnTBAP, an antioxidant specific for mitochondrial ROS. Interestingly, 14 days of treatment with 50 μM MnTBAP partially reversed the low differentiation of hCOQ2 clone because it accumulated 4.4-fold more triglycerides than untreated hCOQ2 cells (Fig. 8B). Further, this could be explained by the very low level of CCAAT/enhancer-binding protein alpha mRNA at confluence in hCOQ2 clone compared with Neg cells (Fig. 8A) when mRNA encoding other transcription factors, CCAAT/enhancer-binding protein beta and CHOP-10, were not modified.

Discussion
In this article, we highlight for the first time the specific reduction of tissue CoQ levels in obese individuals and identified a threshold value in adipose tissue CoQ content in rodent and humans, below which all the individuals are obese. Strikingly, this threshold value for adipose tissue CoQ content is almost similar in mice and humans and suggests that this value is conserved between species. The reduction seems not to be a nonspecific dilution effect due to an increased cell size because similar decrease in another lipophilic compound such as α-tocopherol does not occur. The notion of “phenotypic threshold effect” has been proposed to explain the manifestation of some mitochondrial abnormalities (24). In fact, threshold values for each OXPHOS complex activity have been characterized. These values are tissue and age related. Threshold values for mitochondrial enzyme activities are high (>50%) (20) and are similar to those of CoQ content in mice and humans (60% and 45%, respectively; present data). Such thresholds probably protect cells against a deleterious defect in mitochondrial function. Above this value, lean individuals display a great variability in adipose CoQ content. This suggests that under certain conditions, adipose tissue CoQ content can largely vary without obvious phenotype.
CoQ content threshold may have important metabolic consequences considering the broad and vital functions of CoQ and WAT. Because of its antioxidant capacity, a reduction in CoQ levels may contribute to unbalanced ROS production in WAT. On the other hand, altered CoQ levels may also affect mitochondrial electron transport as well as all the processes that depend on mitochondrial respiration, such as lipid oxidation and also ROS production. This is consistent with a recent study that reports that respiratory chain dysfunction and oxidative stress correlate with severity of primary CoQ deficiency (23). Thus, we can propose that phenotypic manifestation of an adipose CoQ defect, in this case obesity, only occurs when its threshold value is bypassed. The fact that CoQ is partially decreased in adipose tissue of obese subjects but not fully depleted strongly supports its vital function also in this tissue; values below the threshold would be incompatible with healthy life. Primary CoQ deficiency with very low tissue levels of CoQ, but no complete CoQ depletion, is a rare inborn mitochondrial encephalomyopathy with heterogeneous clinical presentations, representing either a tissue-specific CoQ deficiency (muscle and central nervous system in different degrees) or a multisystemic pathology (11, 25). It is remarkable that patients with primary CoQ deficiency accumulate triglycerides in muscle fibers and that CoQ treatment reverses this phenotype (3, 10, 19, 22). Further, obese individuals respond with a clear BW reduction when treated with CoQ for 8–9 weeks (28). The increase of CoQ content in liver and blood during HF-diet-induced obesity in mice could be linked to the fact that over 65% of the plasma CoQ is transported by the low-density lipoprotein fraction. So the increased biosynthesis of CoQ in liver might be to engage in answer to the hepatologic stress engendered by the diet. Similar data on increased CoQ in human plasma have been described as an adaptive response by the liver after 1 month of high-heat-treated foods and high-fat diet (2).
Using complementary approaches, we demonstrate that COQ2 controls adipocyte differentiation. In preliminary experiments, we unsuccessfully tried to knock down CoQ biosynthesis using siRNA. We never obtained stable clones, which suggests that CoQ deficiency could be lethal for our cells. As an alternative, we decided to set up a pharmacological strategy to inhibit COQ2 activity (1). These experiments clearly demonstrated that the inhibition of COQ2 by CBA was associated with a significant decrease in CoQ content and a concomitant strong enhancement of adipocyte differentiation. As the approach based on reducing CoQ levels, relying on the use of a single drug, should be taken with caution in relation to other potential effects of CBA, we decided to use a genetic strategy by overexpressing hCOQ2 in 3T3-442A preadipocytes (14). The selected clones display a strong decrease in TG content after adipocyte differentiation induction. This is also associated with a strong inhibition of adipocyte markers, demonstrating a strong inhibition of adipocyte differentiation. Altogether, these experiments definitively demonstrate that CoQ biosynthesis control adipocyte differentiation. The measure of total and mitochondrial ROS demonstrates that CoQ increase is associated with the decrease of total ROS and the increase of mitochondrial ROS is associated with the increase of reduced CoQ. This is consistent with ambivalent role of CoQ on redox metabolism. Indeed, it acts as a lipophilic antioxidant but also as one of the main mitochondrial generator of anion superoxide, especially in its reduced form. The treatment with MnTBAP, an analog of manganese superoxide dismutase, plus catalase partly reverses the inhibition of the adipogenic differentiation. This reversion is limited but consistent with our previous report demonstrating that a moderate mitochondrial oxidative stress strongly inhibits adipocyte differentiation (6). This is also consistent with another recent report in which we also demonstrated that, in vivo, CoQ supplementation inhibits proadipogenic effect of rosiglytazone (5). We tested in vitro the effect of CoQ supplementation in culture medium on adipocyte differentiation, but whatever the vehicle, we failed to significantly and reproducibly enhance CoQ content (unpublished results).
Altogether, these in vitro data suggest that the decrease of CoQ in adipose tissue could participate in obesity. The time course during HF-diet-induced obesity suggests that it is not the case and that this deficit is not a primary cause of obesity but an early consequence. Afterward and on its turn, this event could participate in obesity development.
In conclusion, this study reveals an unknown role of CoQ in adipose tissue and emphasizes the importance of redox metabolism in its biology.
Footnotes
Acknowledgments
This work was supported by the ANR-05-BLAN-0339-02. The authors thank Y. Jeanson for his great involvement in this project and his technical expertise, and A. Bessac for her technical expertise and help in measurement of CoQ.
Author Disclosure Statement
No competing financial interests exist.
Abbreviations Used
References
Supplementary Material
Please find the following supplemental material available below.
For Open Access articles published under a Creative Commons License, all supplemental material carries the same license as the article it is associated with.
For non-Open Access articles published, all supplemental material carries a non-exclusive license, and permission requests for re-use of supplemental material or any part of supplemental material shall be sent directly to the copyright owner as specified in the copyright notice associated with the article.
