




Abstract
This article has been officially retracted by the journal
Introduction
We previously developed a cell-based biological system involving human ATSCs (adipose tissue stromal cells) that have the potential to differentiate into multiple cell lineages, including neurons (20, 22). Our results showed that adult somatic stem cells have the capacity to participate in the regeneration of various tissues, suggesting that the restriction of differentiation is not completely irreversible and can be reprogrammed via transdifferentiation. Human ATSCs are transformed into more primitive stem cells after the ectopic induction of Ago2 expression, either directly or indirectly, via an increase in their proliferation and differentiation ability. Transcription factors that control stem cell plasticity and self-renewal have been identified (7, 34) and the core regulatory circuitry by which these factors exert their regulatory effects on protein-coding genes has been described (1, 2, 10, 18, 24, 29, 30, 45). Although adult somatic stem cells possess varying lifespans, it also possible to extend their life cycle via gene expression regulation, suggesting their usefulness as an autologously available therapeutic cell source.
Innovation
Nuclear Ago2 is colocalized with nuclear Oct4 or HSP60 at specific regulatory regions of functional genes and positively controls cell self-renewal and differentiation. Ago2 binding resulted in the overexpression of Oct4, Klf4, Sox2, Nanog, Rex1, and the cell cycle-activating genes CDK2, CDK4, and RUNX3. In addition, Ago2 binding leads to the expansion of the S-phase cell population and increases TERT activity. Ago2 control of nuclear HSP60 has critical functions for stem cell behavior by controlling stemness and self-renewal genes after binding to the regulatory regions of those genes. Moreover, nuclear Ago2 negatively regulated ROS accumulation and p38/JNK inactivation in cultured hATSCs via HSP60 control. A study conducted after our preliminary work showed that HSP60 has the ability to directly regulate cell self-renewal, and differentiation via a direct interaction with ROS scavenging functional genes and genes involved in cell growth, such as GPx1, GPx3, SEPN1, TXNL1, stemness genes, c-myc, TERT, and STAT3.
Human HSP60 is a member of the highly conserved heat shock protein (HSP) family, which includes molecular chaperones from several species of organisms. HSPs are typically located in the mitochondrial matrix and can be regulated by various stresses. HSP60 synthesis and transport to the extracellular surface has been observed in response to a variety of cellular stresses (5, 38). HSPs are implicated in several important cellular processes, including DNA replication, regulation of gene expression, signal transduction, differentiation, apoptotic cell death, and cell growth. The blockage of HSP60 expression induces caspase activation and cell death, indicating its anti-apoptotic role (3). Furthermore, the addition of recombinant HSP60 increases both cell proliferation and colony-forming ability in human colorectal carcinoma RKO cells (31). Moreover, HSP60 has been shown to protect epithelial cells from stress-induced apoptotic cell death via the activation of extracellular signal-regulated protein kinase (ERK) and the inactivation of caspase 3 (6). In the brain, HSP60 is endogenously expressed in astrocytes, neurons, microglia, oligodendrocytes, and ependymal cells, and neural expression is upregulated during development (12). The expression of HSP60 and HSP10 is increased after brain insults, such as hemorrhage and cerebral ischemia (15, 16). Mammals, including humans, have the ability to regenerate acutely injured tissues. During the regenerative process, mature organ specific tissues or cells obtain stem cell potency, including self-renewal and differentiation, through the partial dedifferentiation and proliferation of parenchymal and mesenchymal cells. During injury repair, one of the major responses against cellular stress is the induction of heat shock proteins (HSPs), which are critical for cell survival and also have a chaperone function, as demonstrated by their ability to bind proteins and mediate conformational changes during protein folding (42). In our study, we found that Ago2 present in the nucleus positively regulates HSP60 expression via direct binding to the HSP60 regulatory region in cultured hATSCs. Ago2 induces HSP60 expression, which effectively contributes to hATSCs self-renewal, differentiation, and survival via Oct-mediated cell reprogramming. In this study, we found that Ago2/HSP60 induces cellular reprogramming via direct binding of HSP60 to the regulatory regions of the c-myc, STAT3, and Oct4, including stemness genes to modulate stem cell self-renewal, survival, and differentiation potency. We suggest an expanded model in which Ago2/HSP60 modulates stem cell self-renewal and differentiation and provides a detailed molecular mechanism for this process in the nuclei of hATSCs. The Ago2-mediated control of HSP60 plays a very important role as a key functional regulator in the understanding of the molecular mechanism of stem cell self-renewal and differentiation.
Results
Nuclear Ago2 controls self-renewal of hATSCs via direct binding on functional genes
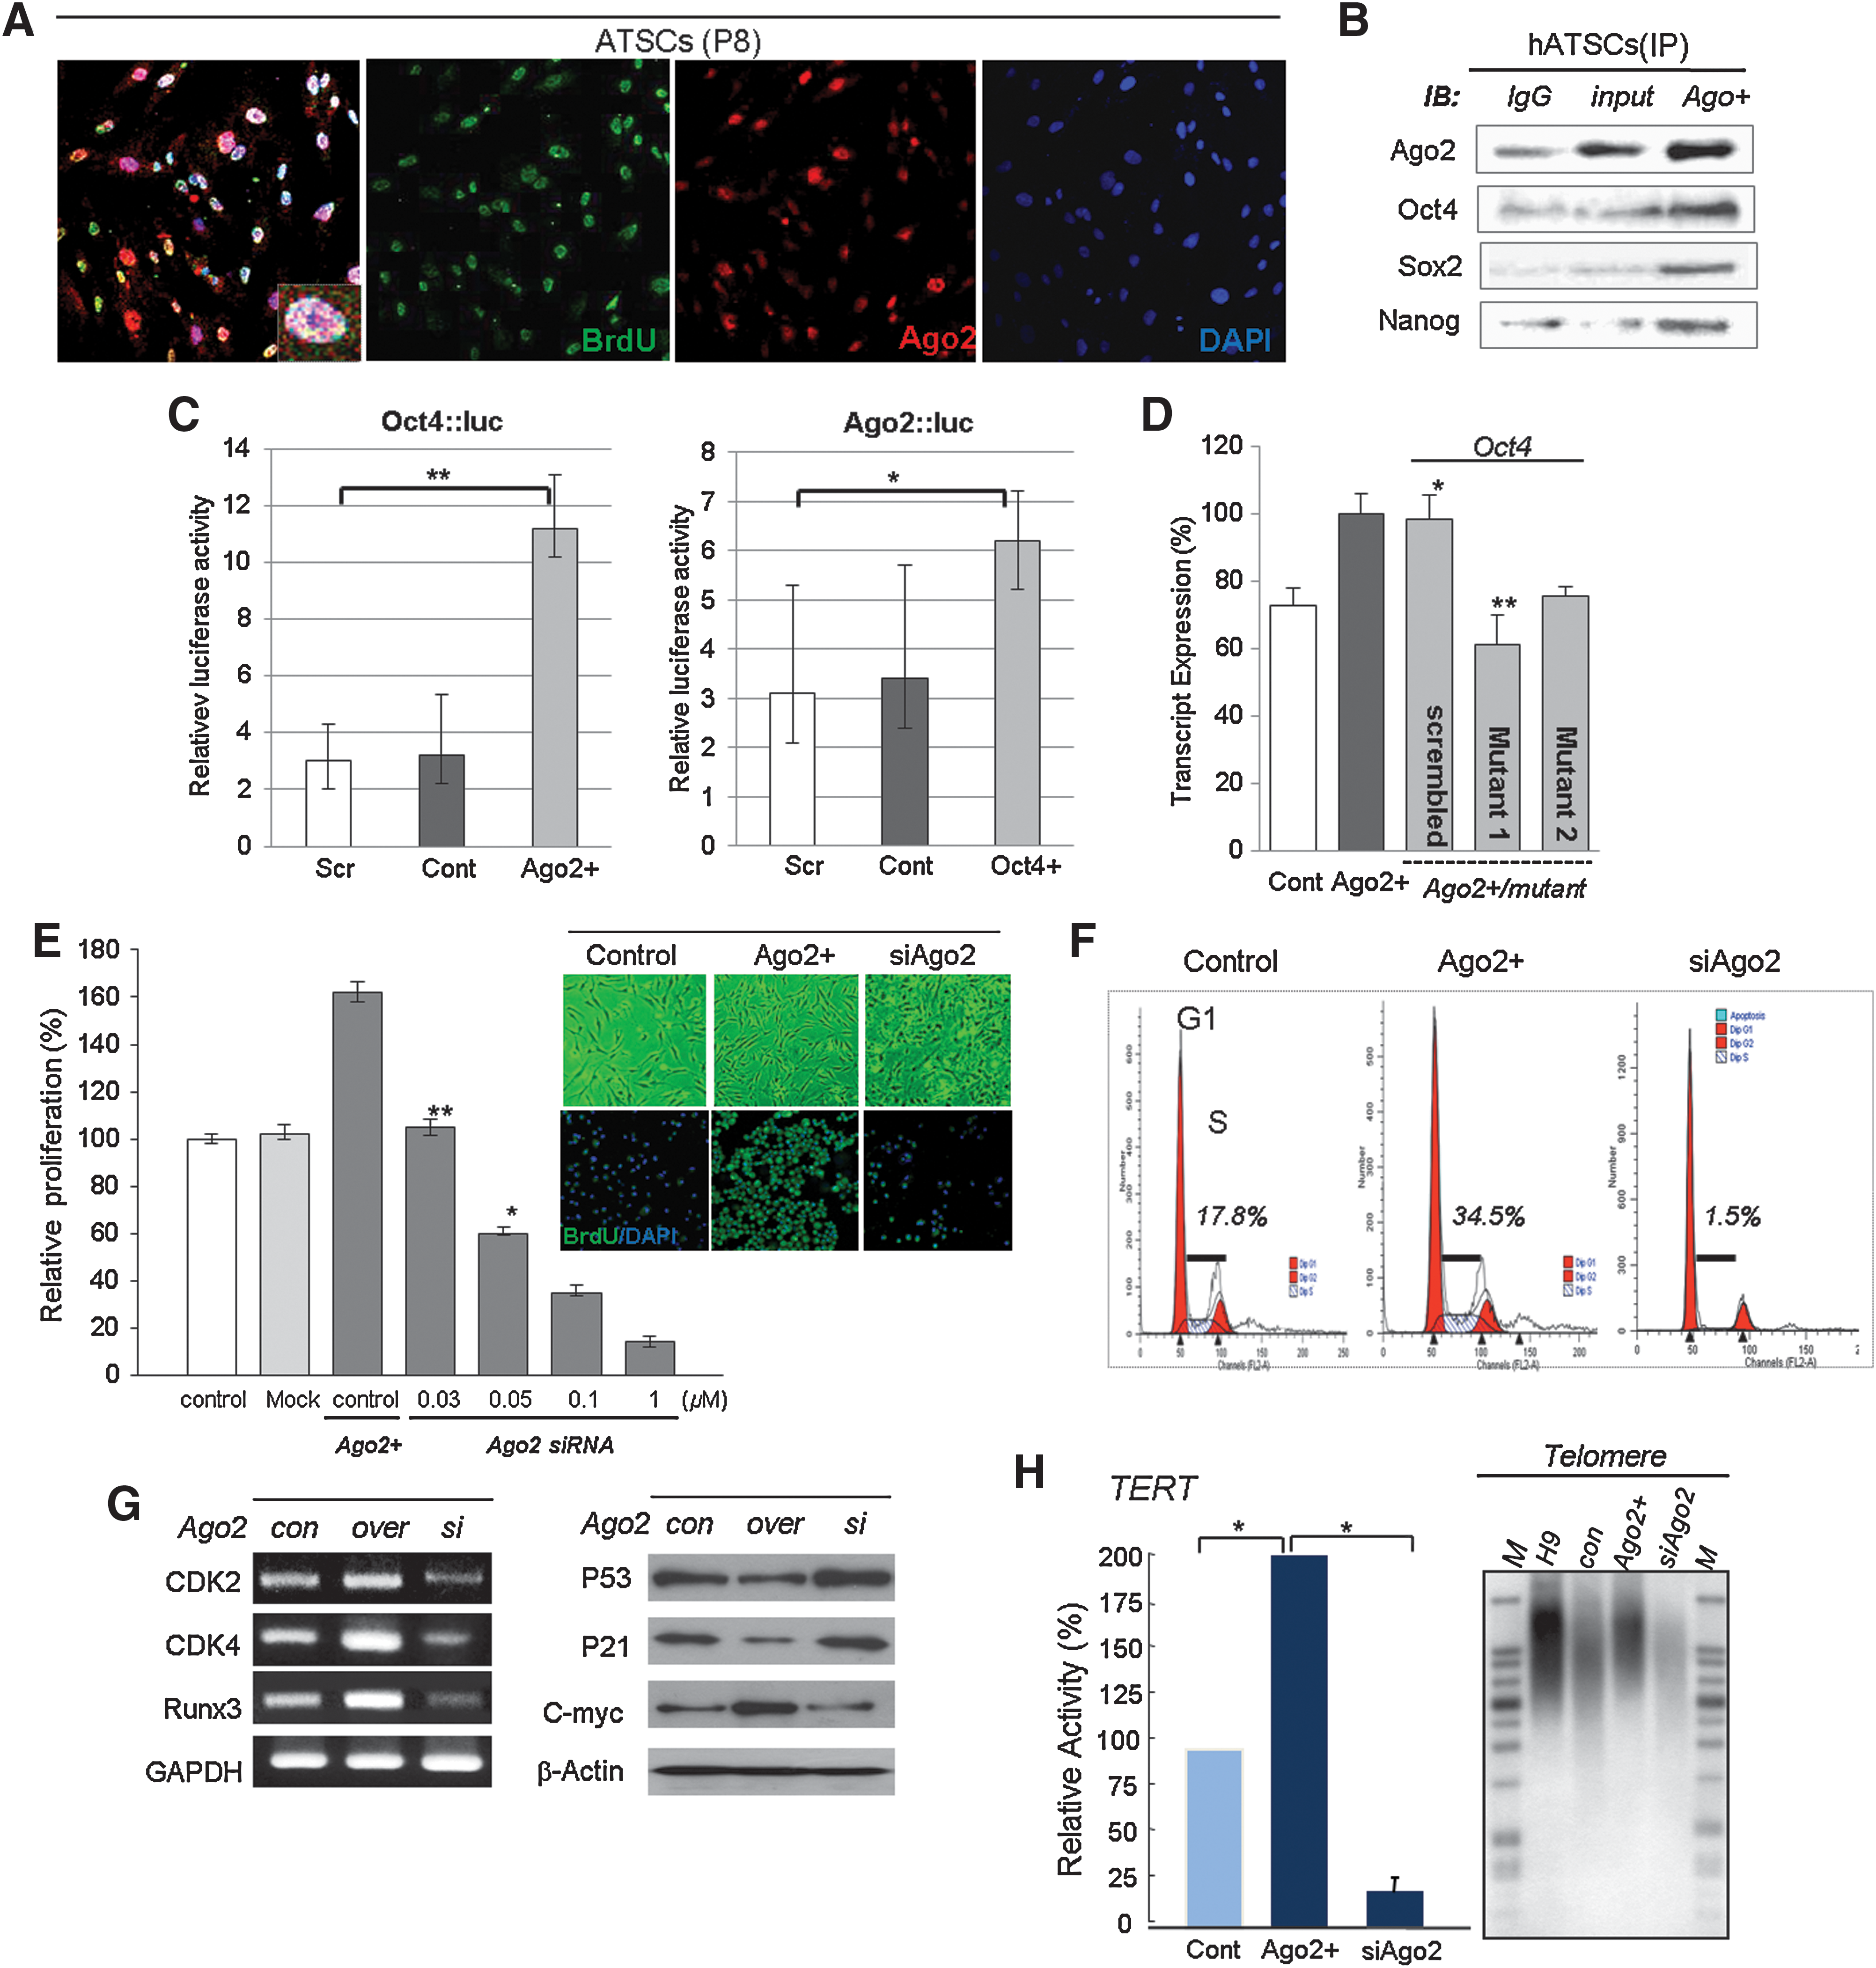
We identified the nuclear distribution of Ago2 and its binding affinity for the regulatory regions of specific genes by CHIP-on-chip analysis. We also tested whether regulatory regions occupied by Ago2 induced the activation or repression of target genes at the transcriptional level. Immunocytochemical staining for Ago2 and BrdU revealed that the expression of Ago2 was involved in the self-renewal of hATSCs and coincided with the co-localization of Ago2 and BrdU in the nucleus (Figs. 1A and 1B). In contrast, as shown in Figure 1B, ectopic Ago2 expression in ATSCs resulted in the markedly increased binding of Ago2, Oct4, Sox2, and Nanog to regulatory regions of chromosomal DNA. Ectopic Ago2 expression also led to markedly higher DNA binding by Ago2, Oct4, Sox2, and Nanog, and we propose that it is indispensable for hATSC self-renewal (Fig. 1B). Next, we investigated the DNA binding efficiency of Ago2 before and after its overexpression in hATSCs. As was seen following Ago2 CHIP/Chip, when we overexpressed Ago2 gene in hATSCs, there was an almost 14-fold increase in the number of Ago2 DNA binding genes (n=1727) compared with control hATSCs (n=122) (data not shown). We also detected Ago2 bound to specific sequences in the regulatory region of the Oct4 gene and investigated the expression of Oct4 using a luciferase assay. Ago2 stimulation enhanced luciferase activity driven by the Oct4 promoter in hATSCs, and we also confirmed that Oct4 stimulation enhanced luciferase activity driven by the Ago2 promoter (Fig. 1C). Cultured hATSCs that was transfected with Ago2 or Oct4 had enhanced luciferase activity (Fig. 1C). Moreover, we analyzed Oct4 transcript expression after transfection with two types of mutated Ago2 binding motifs. Mutant-transfected hATSCs expressed Oct4 at a low level compared to cells transfected with scrambled DNA after Ago2 overexpression (Fig. 1D). The disruption of Ago2 expression in hATSCs reduced proliferation activity and downregulated the S-phase cell population and expression of self-renewal related genes (Figs. 1E–1G). We functionally categorized the Ago2-occupied genes as follows: transcriptional regulation (n=93), neural development (n=109), and development and cell proliferation-related genes (n=293) (21). Moreover, hATSCs that expressed ectopic Ago2 showed high TERT activity and extended telomere lengths along with increased expression of stemness genes and self-renewal genes, such as CDKs, Runx3, and c-myc (Figs. 1G and 1H).
Ago2 control of HSP60 directly induces hATSC self-renewal and escape from senescence
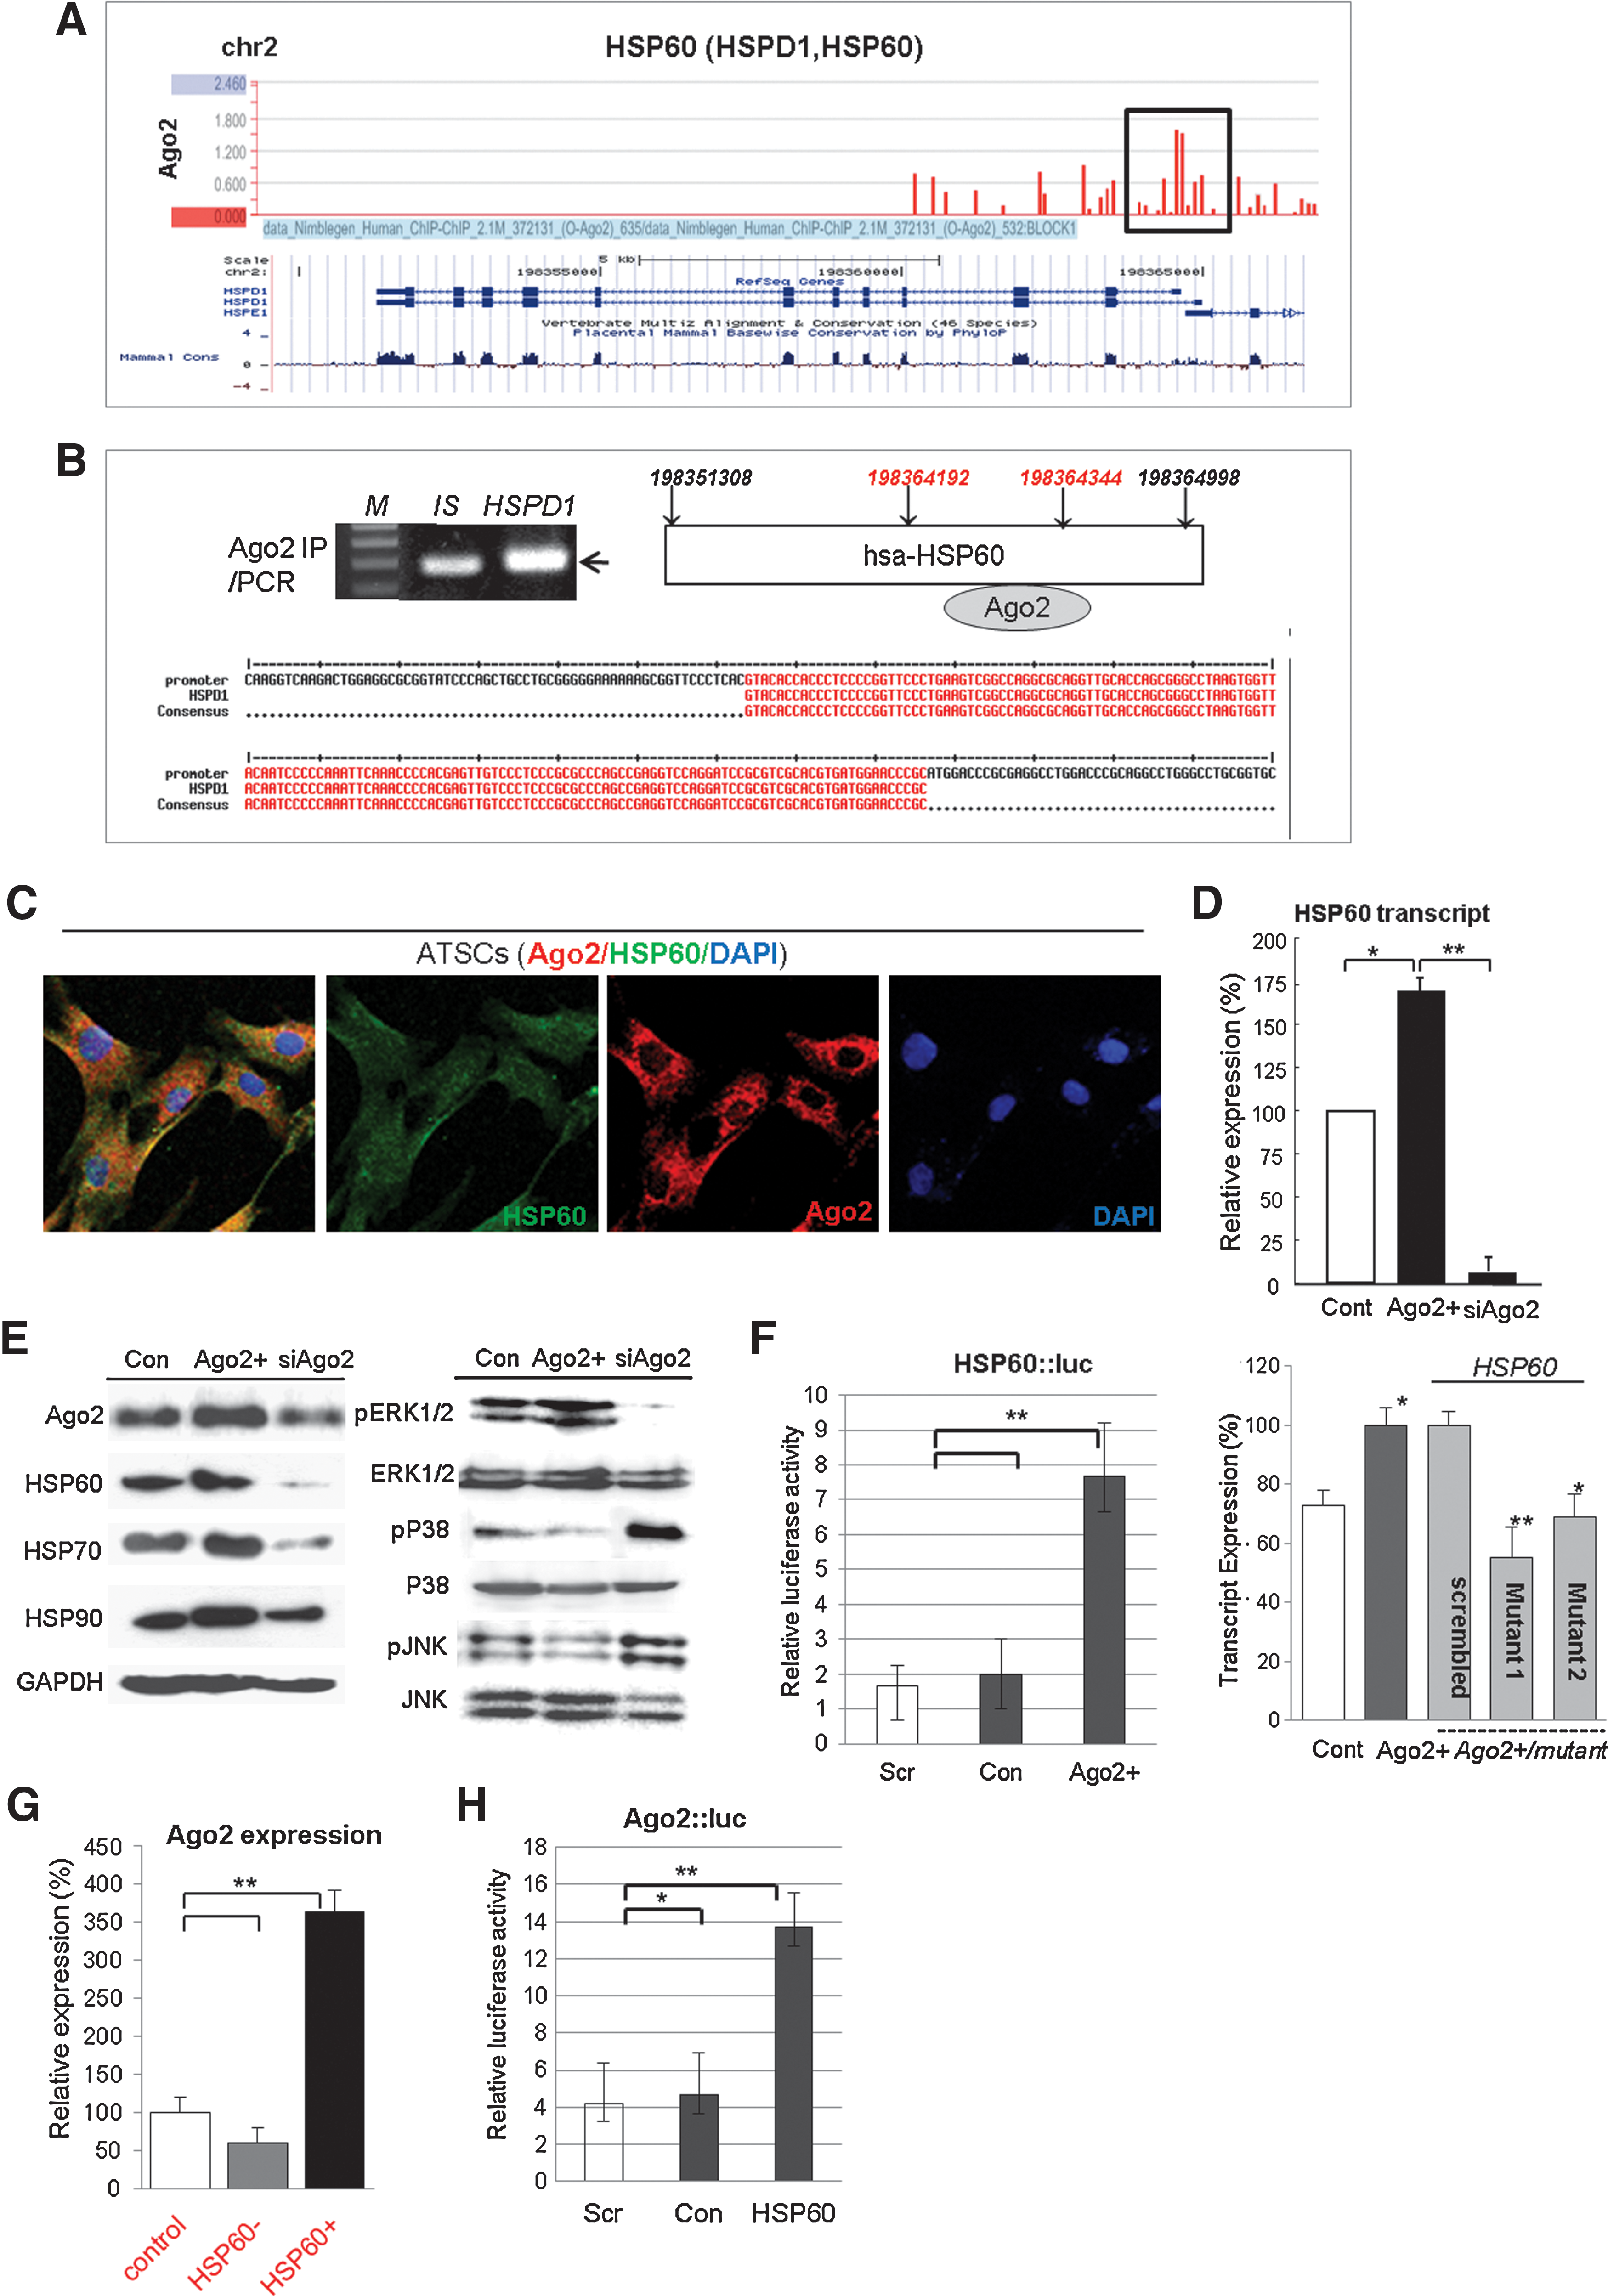
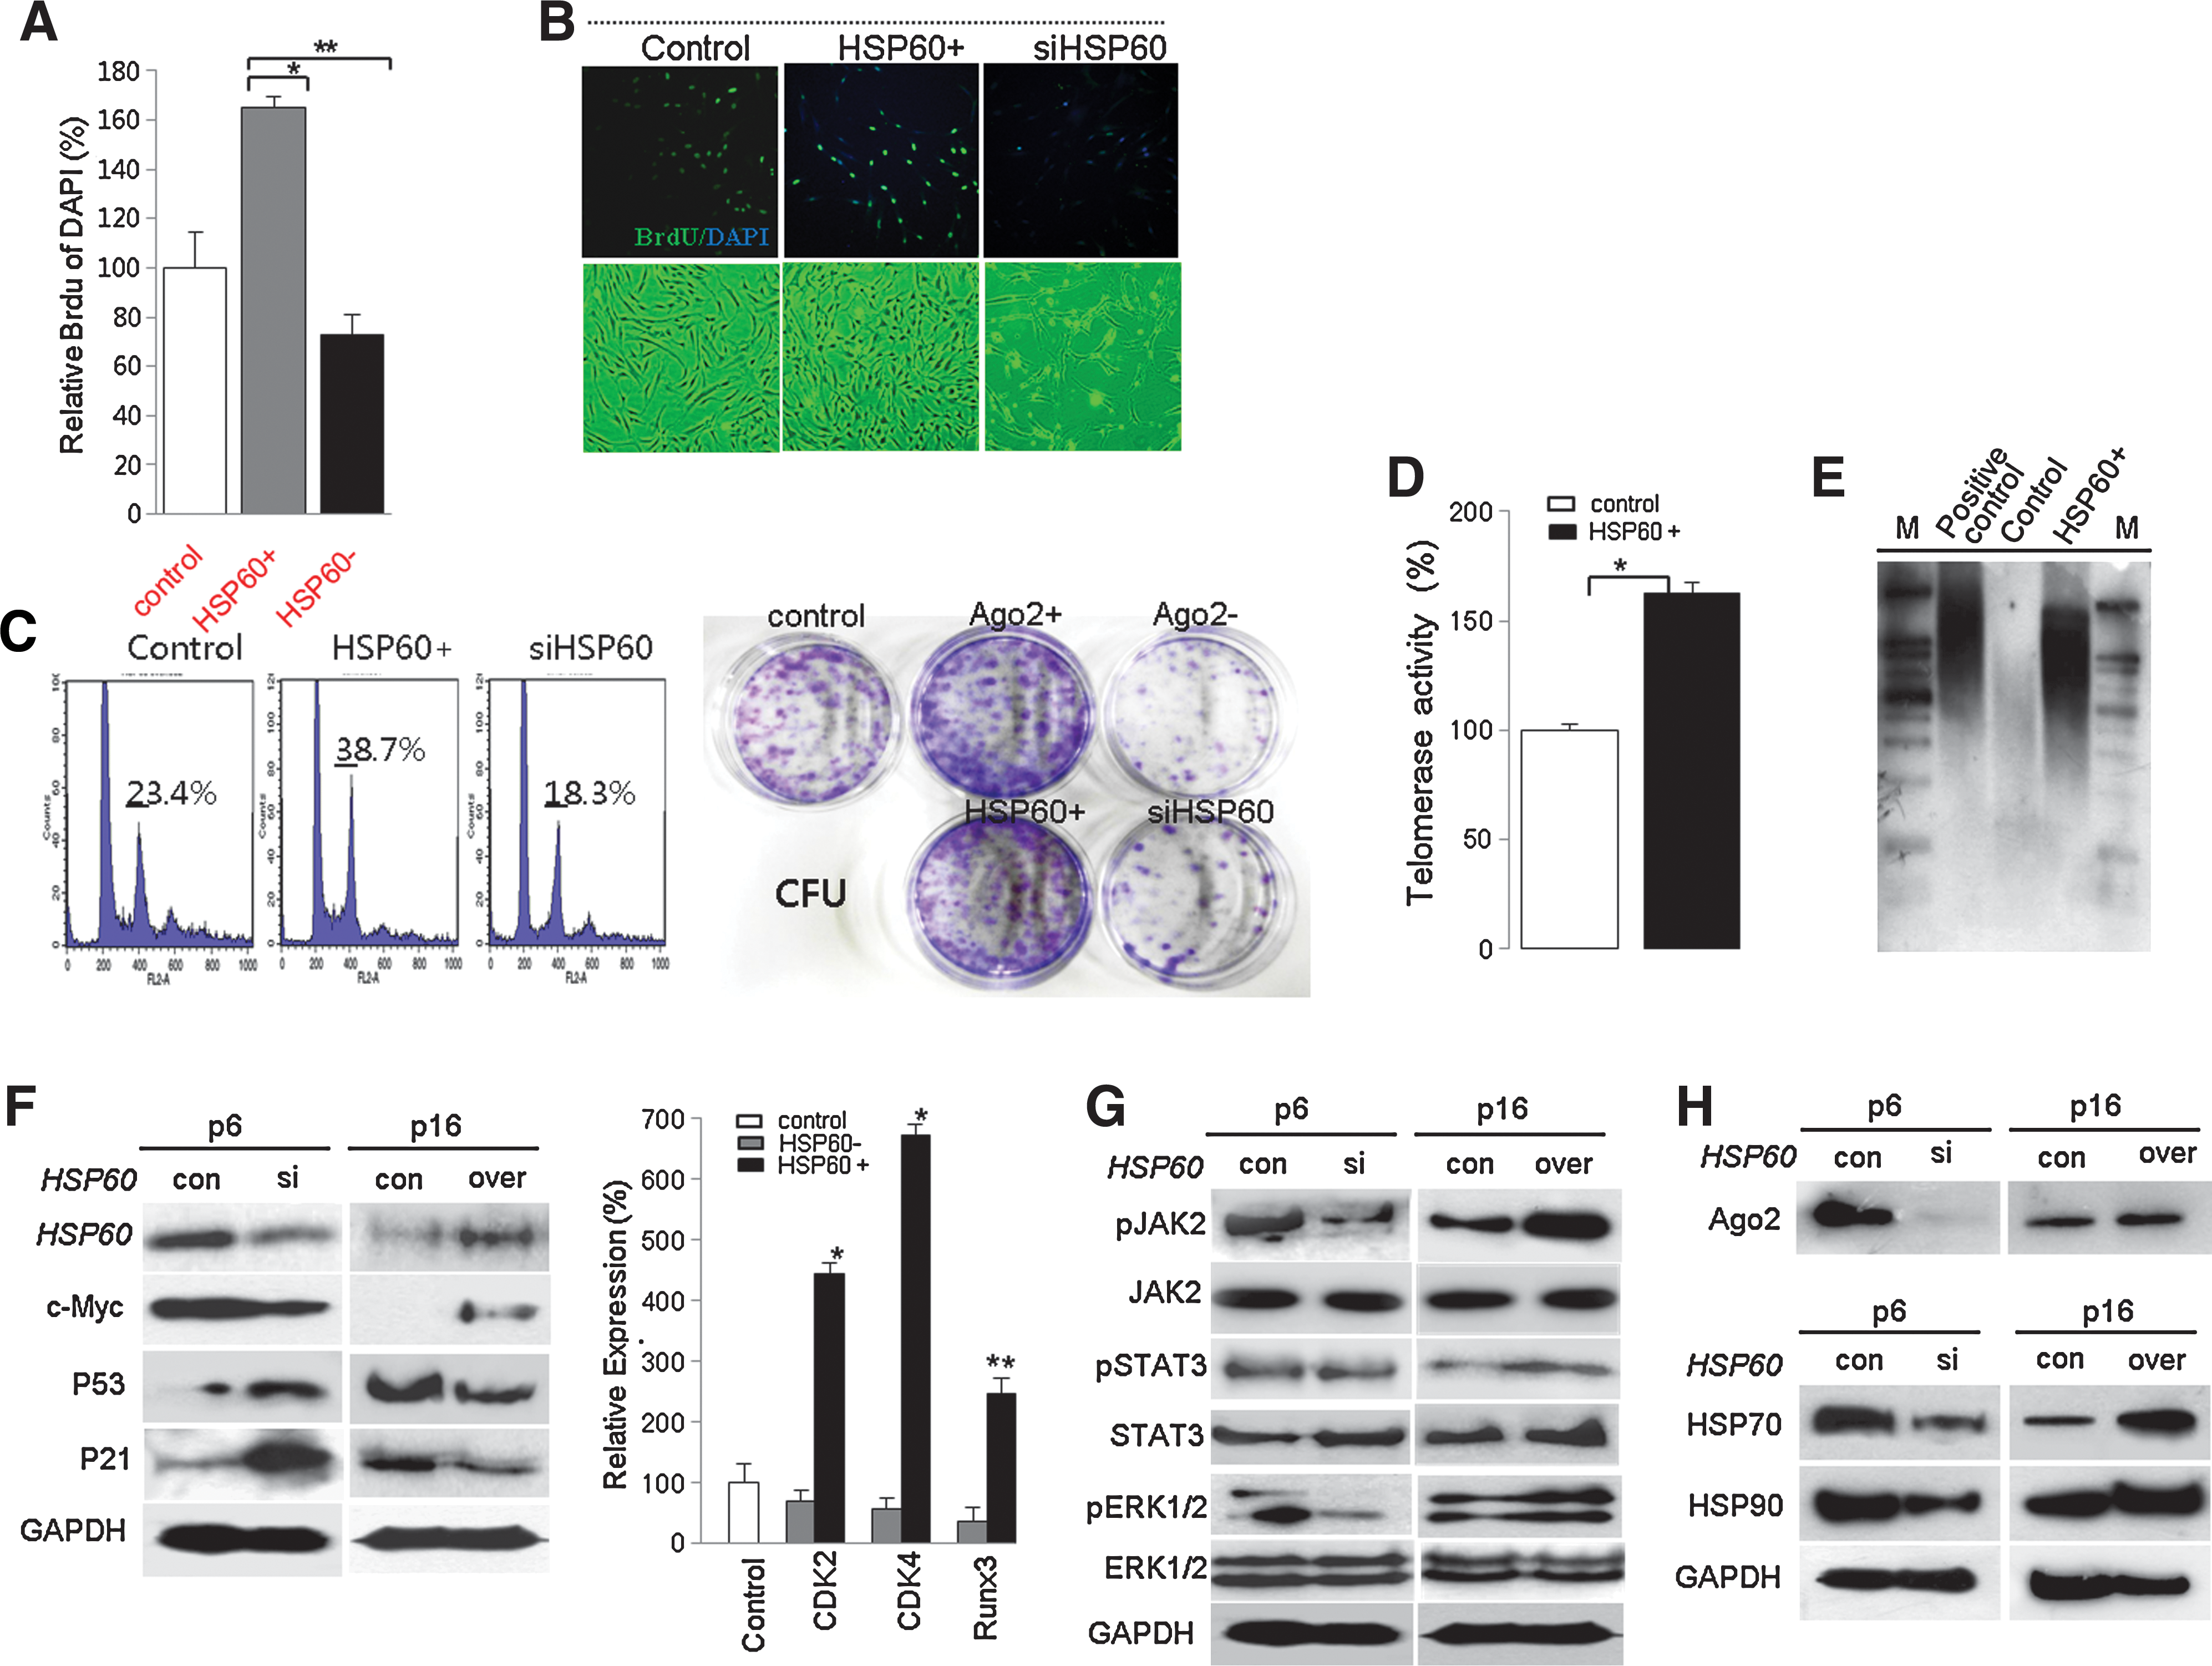
We next studied the Ago2 regulation of HSP expression and functional control of HSP60 for hATSC self-renewal. In addition, we determined the involvement of specific signal mediators during Ago2-mediated hATSC self-renewal (Fig. 2). Similar to our Ago2 CHIP/CHIP results, it is clear that Ago2 binds to specific regions of the HSP60 gene on chromosome 2 (chr2; red bars in black box) (Fig. 2A), and we confirmed the detailed Ago2 binding region on chr2 via CHIP/PCR and CHIP sequencing of the regulatory region of HSP60. The red-colored DNA base sequences show the binding site of Ago2 in the HSP60 promoter region (ch2,198364192–198364344, Fig. 2B). Additionally, immunofluorescence images of Ago2 and HSP60 co-localization in the nucleus indirectly revealed active regulation of specific functional genes in the nucleus after overexpression of HSP60 in ATSCs (Fig. 2C). As shown with RT-PCR and Western blotting, Ago2 directly controls HSP60 expression and hATSC self-renewal (Figs. 2D and 2E). When we disrupted Ago2 expression in cells, expression of HSP60 and HAP90 was significantly reduced (Figs. 2D and 2E). Ago2 knockdown induces p38/JUNK activation (Fig. 2E). To confirm the direct Ago2 regulation of HSP60 expression, we measured the luciferase activity of the HSP60 promoter in Ago2-overexpresing hATSCs or in cells with reduced Ago2 expression. HSP60 promoter luciferase activity was significantly increased by Ago2 overexpression (Fig. 2F). Additionally, when we transfected three types of Ago2 gene mutants into Ago2-overexpressing hATSCs, the level of HSP60 expression was significantly decreased (Fig. 2F). We also confirmed that HSP60 expression directly controls Ago2 expression via the Ago2 luciferase reporter/promoter assay method and transcript analysis (Figs. 2G and 2H). We then evaluated whether HSP60 is directly involved in hATSC self-renewal. To examine this, we first disrupted HSP60 gene expression in hATSCs. This resulted in a decrease of the self-renewal capacity of BrdU-positive hATSCs cells from 170% (control) to 88% (siHSP60). Compared to control cells, siHSP60 treatment induced a reduction in cells' self-renewal and proliferation activity of up to 64% and reduced S-phase DNA content with decreased CFU (colony forming unit) (Figs. 3A–3C). Moreover, hATSCs that overexpressed HSP60 showed increased TERT activity (163%) and extended telomere lengths along with increased phosphorylation of JAK2/STAT3, ERK1/2 and increased c-myc and decreased p53 and p21 expression (Figs. 3D–3G). In contrast, the disruption of HSP60 expression in hATSCs resulted in a more spread out cellular morphology compared to control cells, along with shorter telomere lengths and reduced levels of activated JAK/STAT3 (Figs. 3D–3G). Moreover, compared to early-passage (P6) cells, late-passage (P16) hATSCs showed a significantly lower level of HSP70, HSP90, and Ago2 expression, but HSP70 and HSP90 expression was rescued and positively controlled by the introduction of HSP60 into P16 hATSCs (Fig. 3H).
HSP60 directly controls ROS generation to allow an escape from senescence
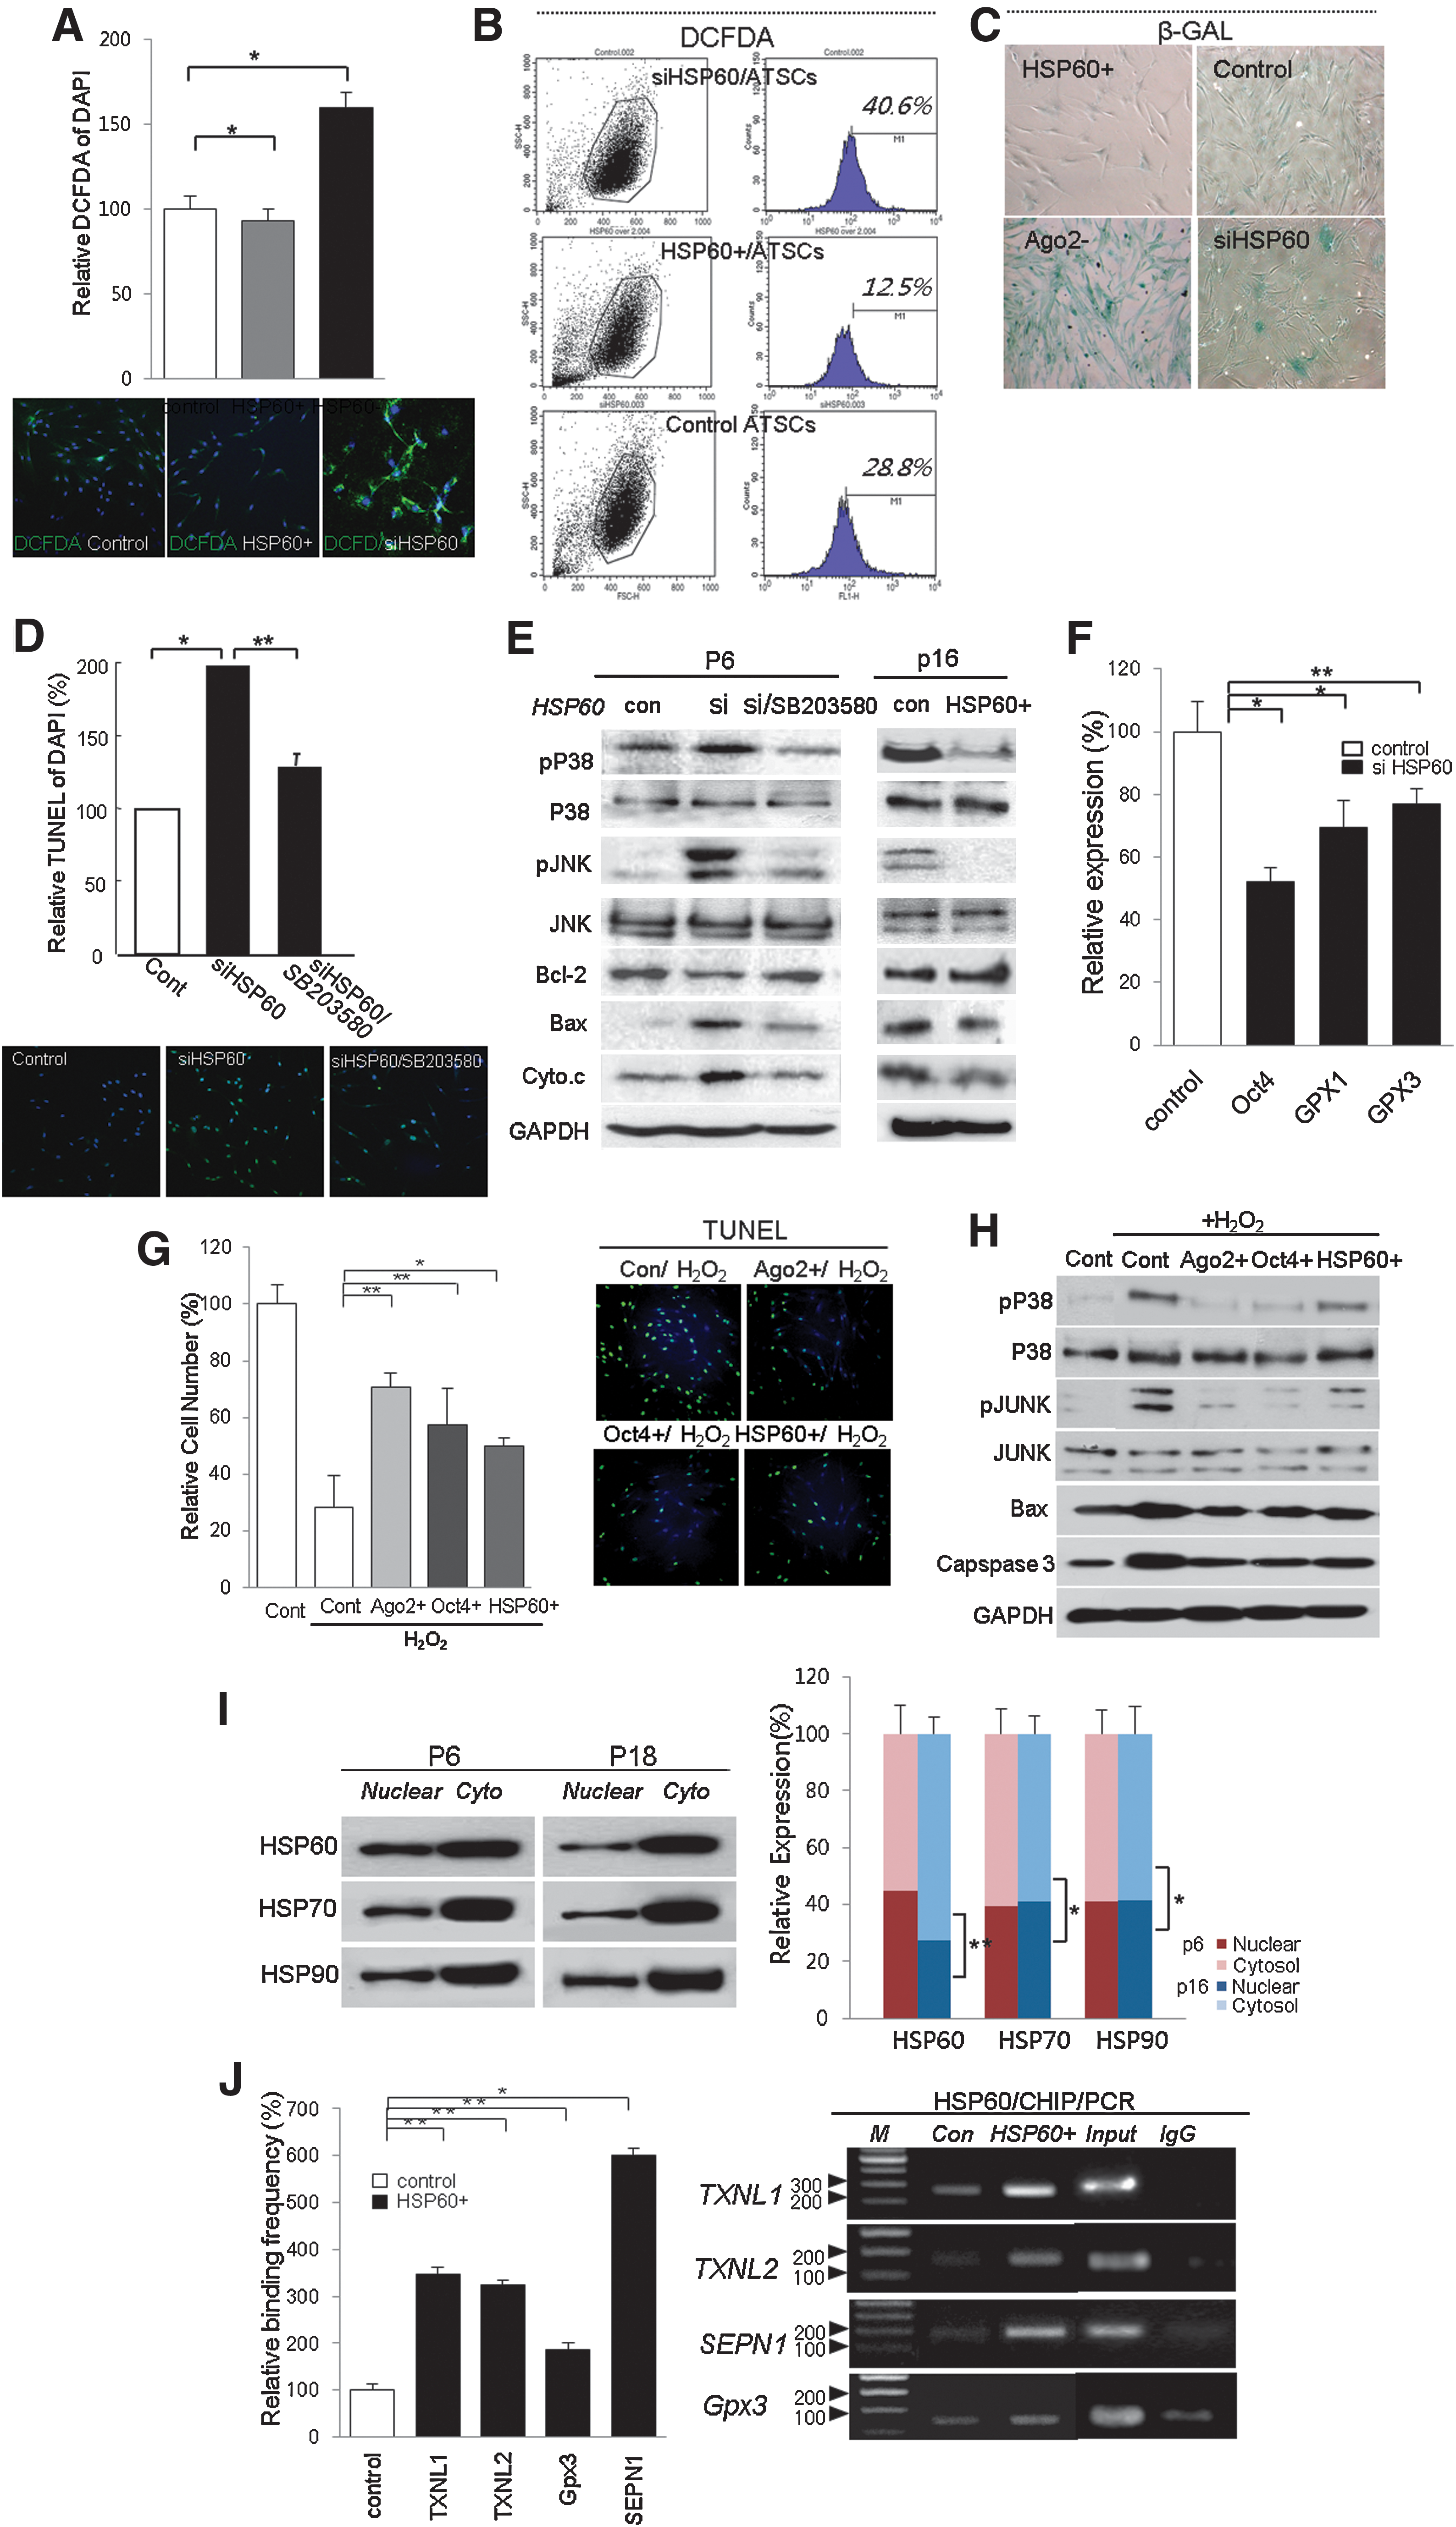
When we silenced HSP60 expression in hATSCs, DCFDA-positive ROS generation was significantly increased (Figs. 4A and 4B). In contrast, the overexpression of HSP60 effectively induced ROS scavenging (Figs. 4A and 4B). Cellular ROS levels were also highly affected by HSP60 expression as follows: interference with HSP60 expression in hATSCs effectively enhanced ROS generation by up to 40.6% compared to control cells (28.8%; Figs. 4A and 4B). We also detected β-galactosidase expression to identify whether HSP60 was involved in hATSC aging. The overexpression of HSP60 significantly increased effective ROS scavenging up to 12.5% (Fig. 4B). We also studied the involvement of HSP60 during hATSC senescence. Knockdown of HSP60 expression in hATSCs resulted in a more spread out cellular morphology along with strong β-galactosidase expression (Fig. 4C). We next examined whether the downregulation of HSP60 expression induces P-p38/JNK mediating apoptotic cell death in hATSCs. As shown in Figures 4D and 4E, the knockdown of HSP60 expression induced significantly increased TUNEL-positive apoptotic cells and upregulated the expression of apoptotic signal mediators, Bax, caspase3, and cytochrome C. siHSP60-induced cell death and related apoptosis signal activation could be rescued with the p38 inhibitor SB203580 (Figs. 4D and 4E). Moreover, real time RT-PCR showed that HSP60 positively controls the expression of ROS scavenging machinery, such as GPx1 and GPx3, and also downregulates Oct4 expression (Fig. 4F). Furthermore, CHIP-PCR experiments demonstrated that HSP60 mediates the control of Oct4, GPx1, and GPx3 expression by direct binding to regulatory regions of the GPx3 and Oct4 genes. To evaluate relative cell survival (%) induced by Ago2, Oct4, and HSP60 pretreatment against hydrogen peroxide (H2O2)-inducing apoptotic cell death in hATSCs, we counted viable cells and the TUNEL+ cell population before and after treatment with H2O2 alone or sequential exposure of Ago2, Oct4, or HSP60 and H2O2. Ago2, Oct4, or HSP60 pretreatment significantly protected cells against H2O2-mediated apoptotic cell death along with significantly decreased TUNEL+ cell population and downregulated p-p38/JUNK, Bax, and caspase 3 expression (Figs. 4G and 4H). We found that early-passage cultured ATSCs (p6) had increased levels of nuclear HSP60. In contrast, nuclear HSP60 was significantly decreased in late-passage cells (p18) (Fig. 4I). Additionally, we confirmed that HSP60 directly regulates the following ROS scavenging genes: GPx1, GPx3, SEPN1, and TXNL1. This was shown via HSP60 CHIP/PCR analysis in HSP60-overexpressing or control hATSCs. HSP60 was shown to significantly upregulate ROS scavenging gene expression after binding to the regulatory region of those genes in HSP60-overexpressing hATSCs. Control hATSCs showed limited HSP60 binding frequency on the promoters of those genes and led to a low expression level of ROS scavenging genes and thus limited self-renewal (Fig. 4J).
Involvement of HSP60 in direct control of Oct4 expression
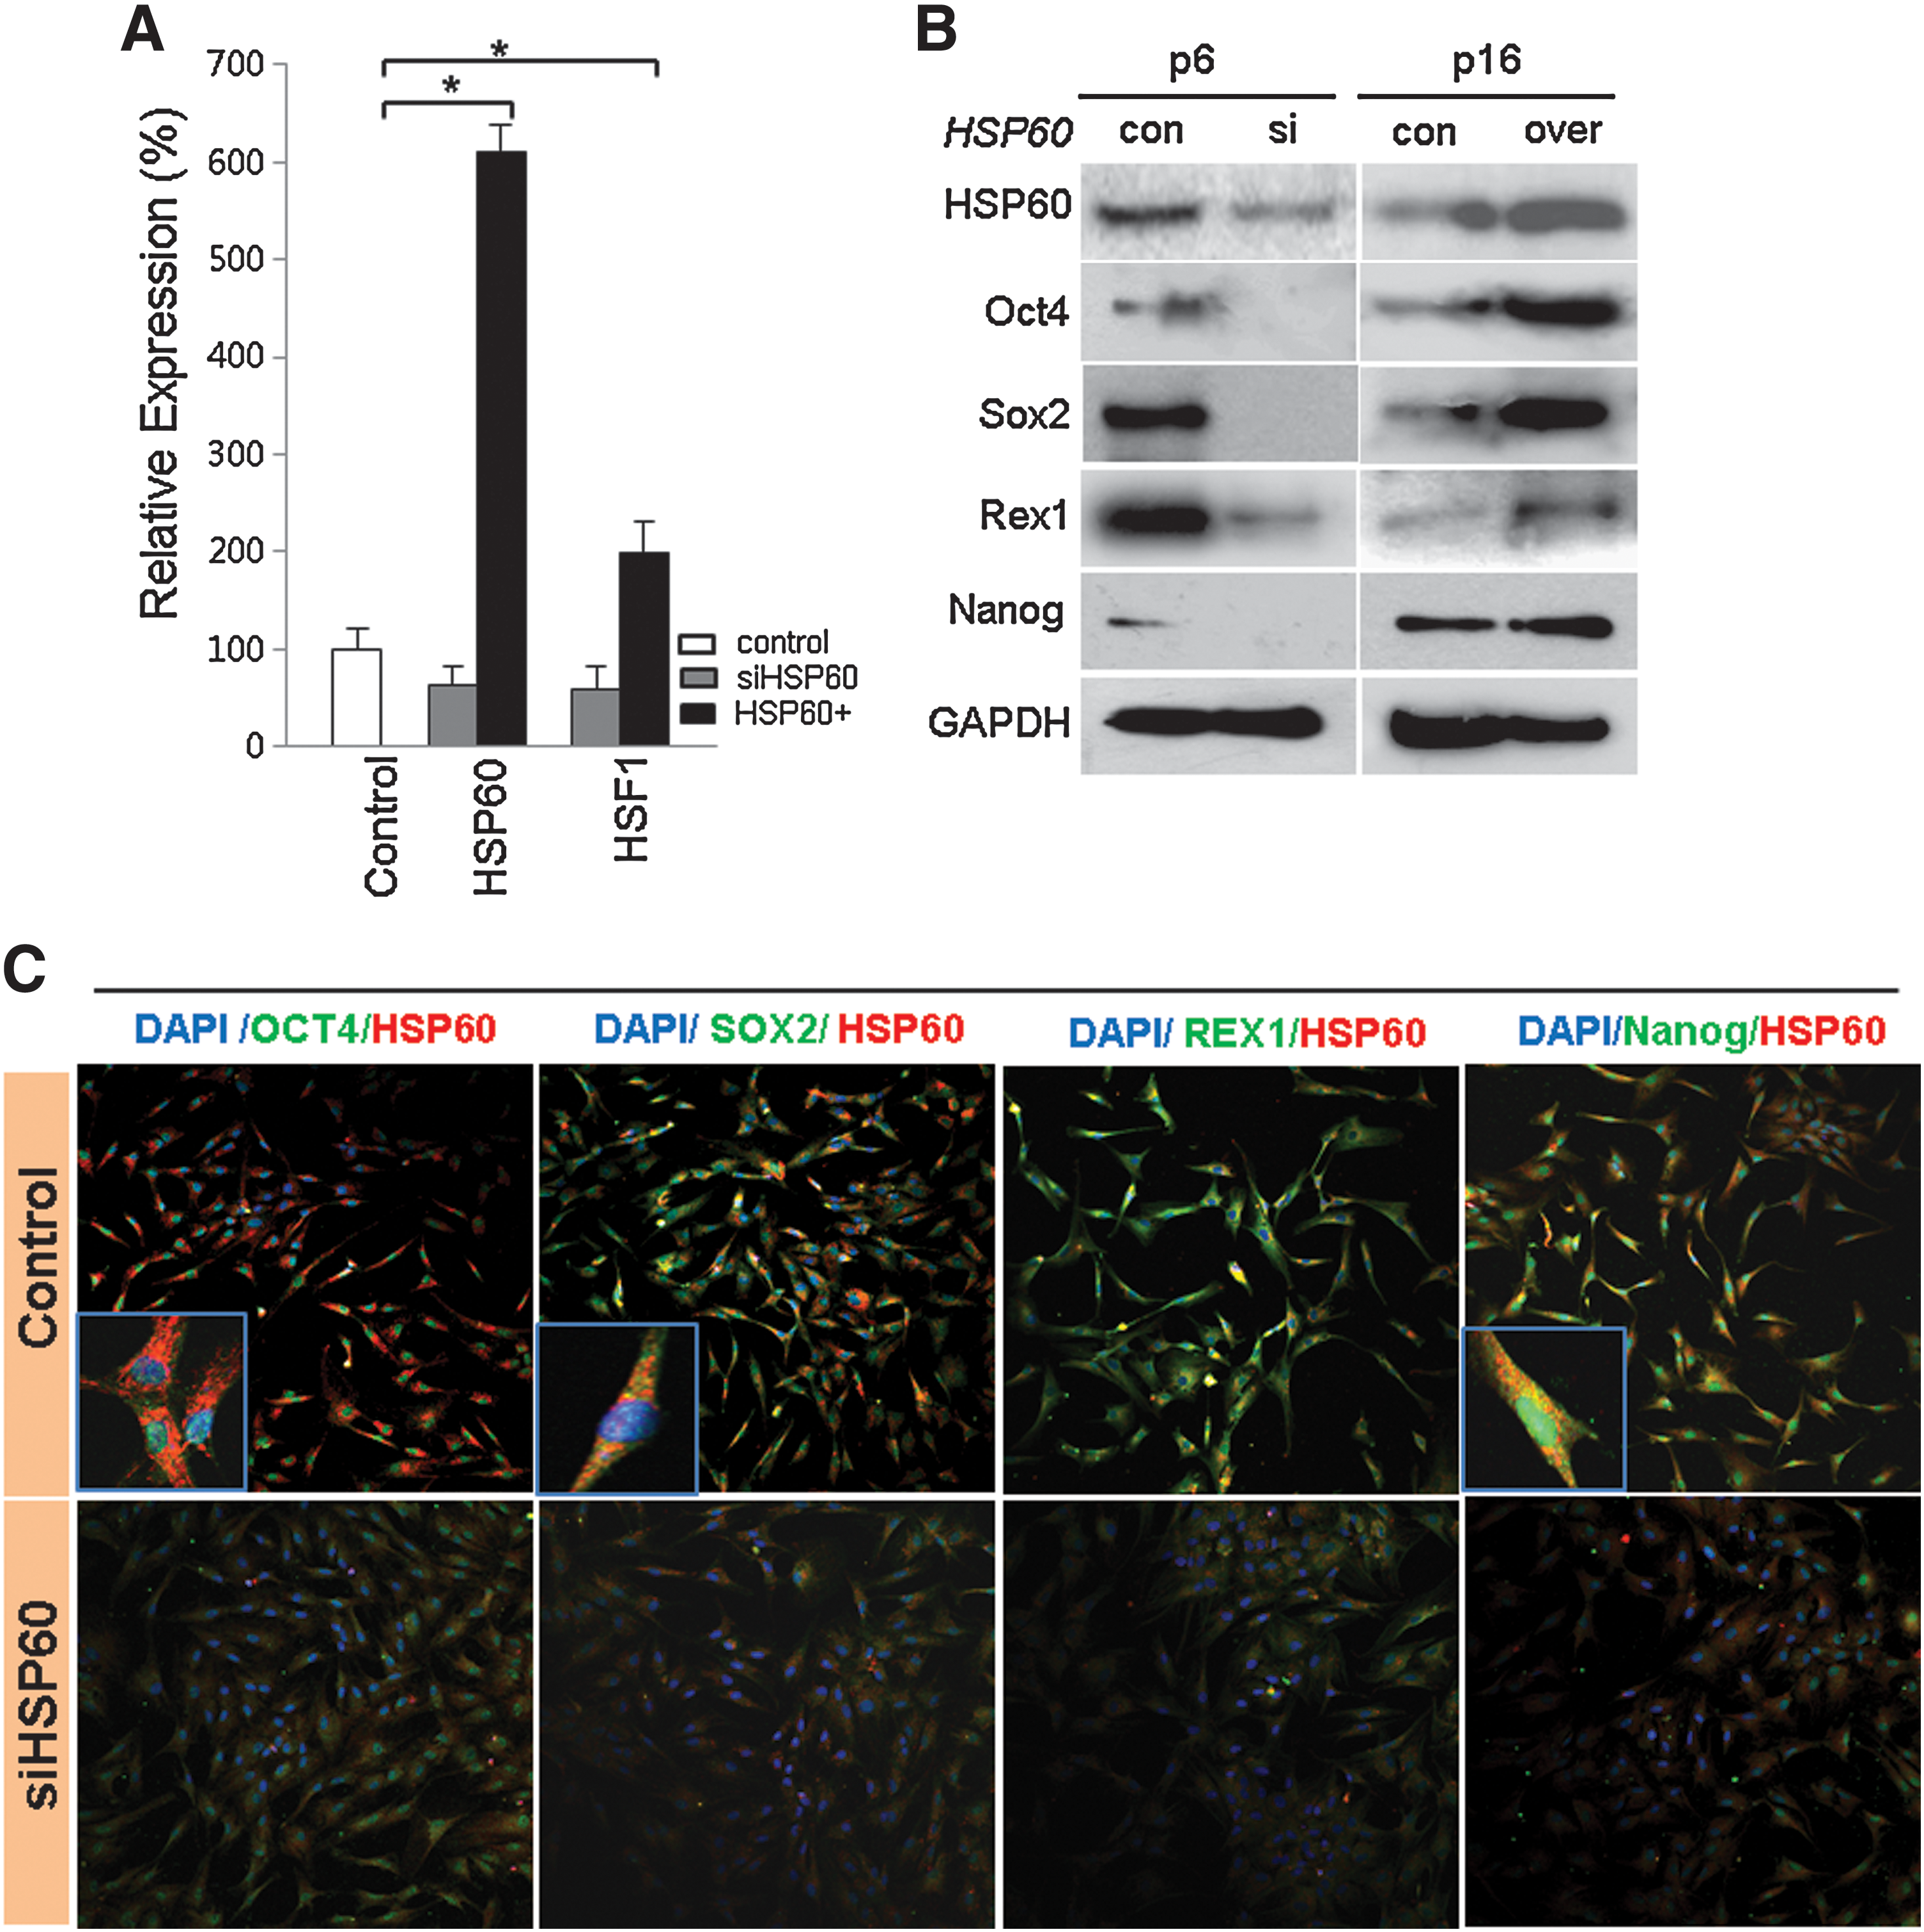
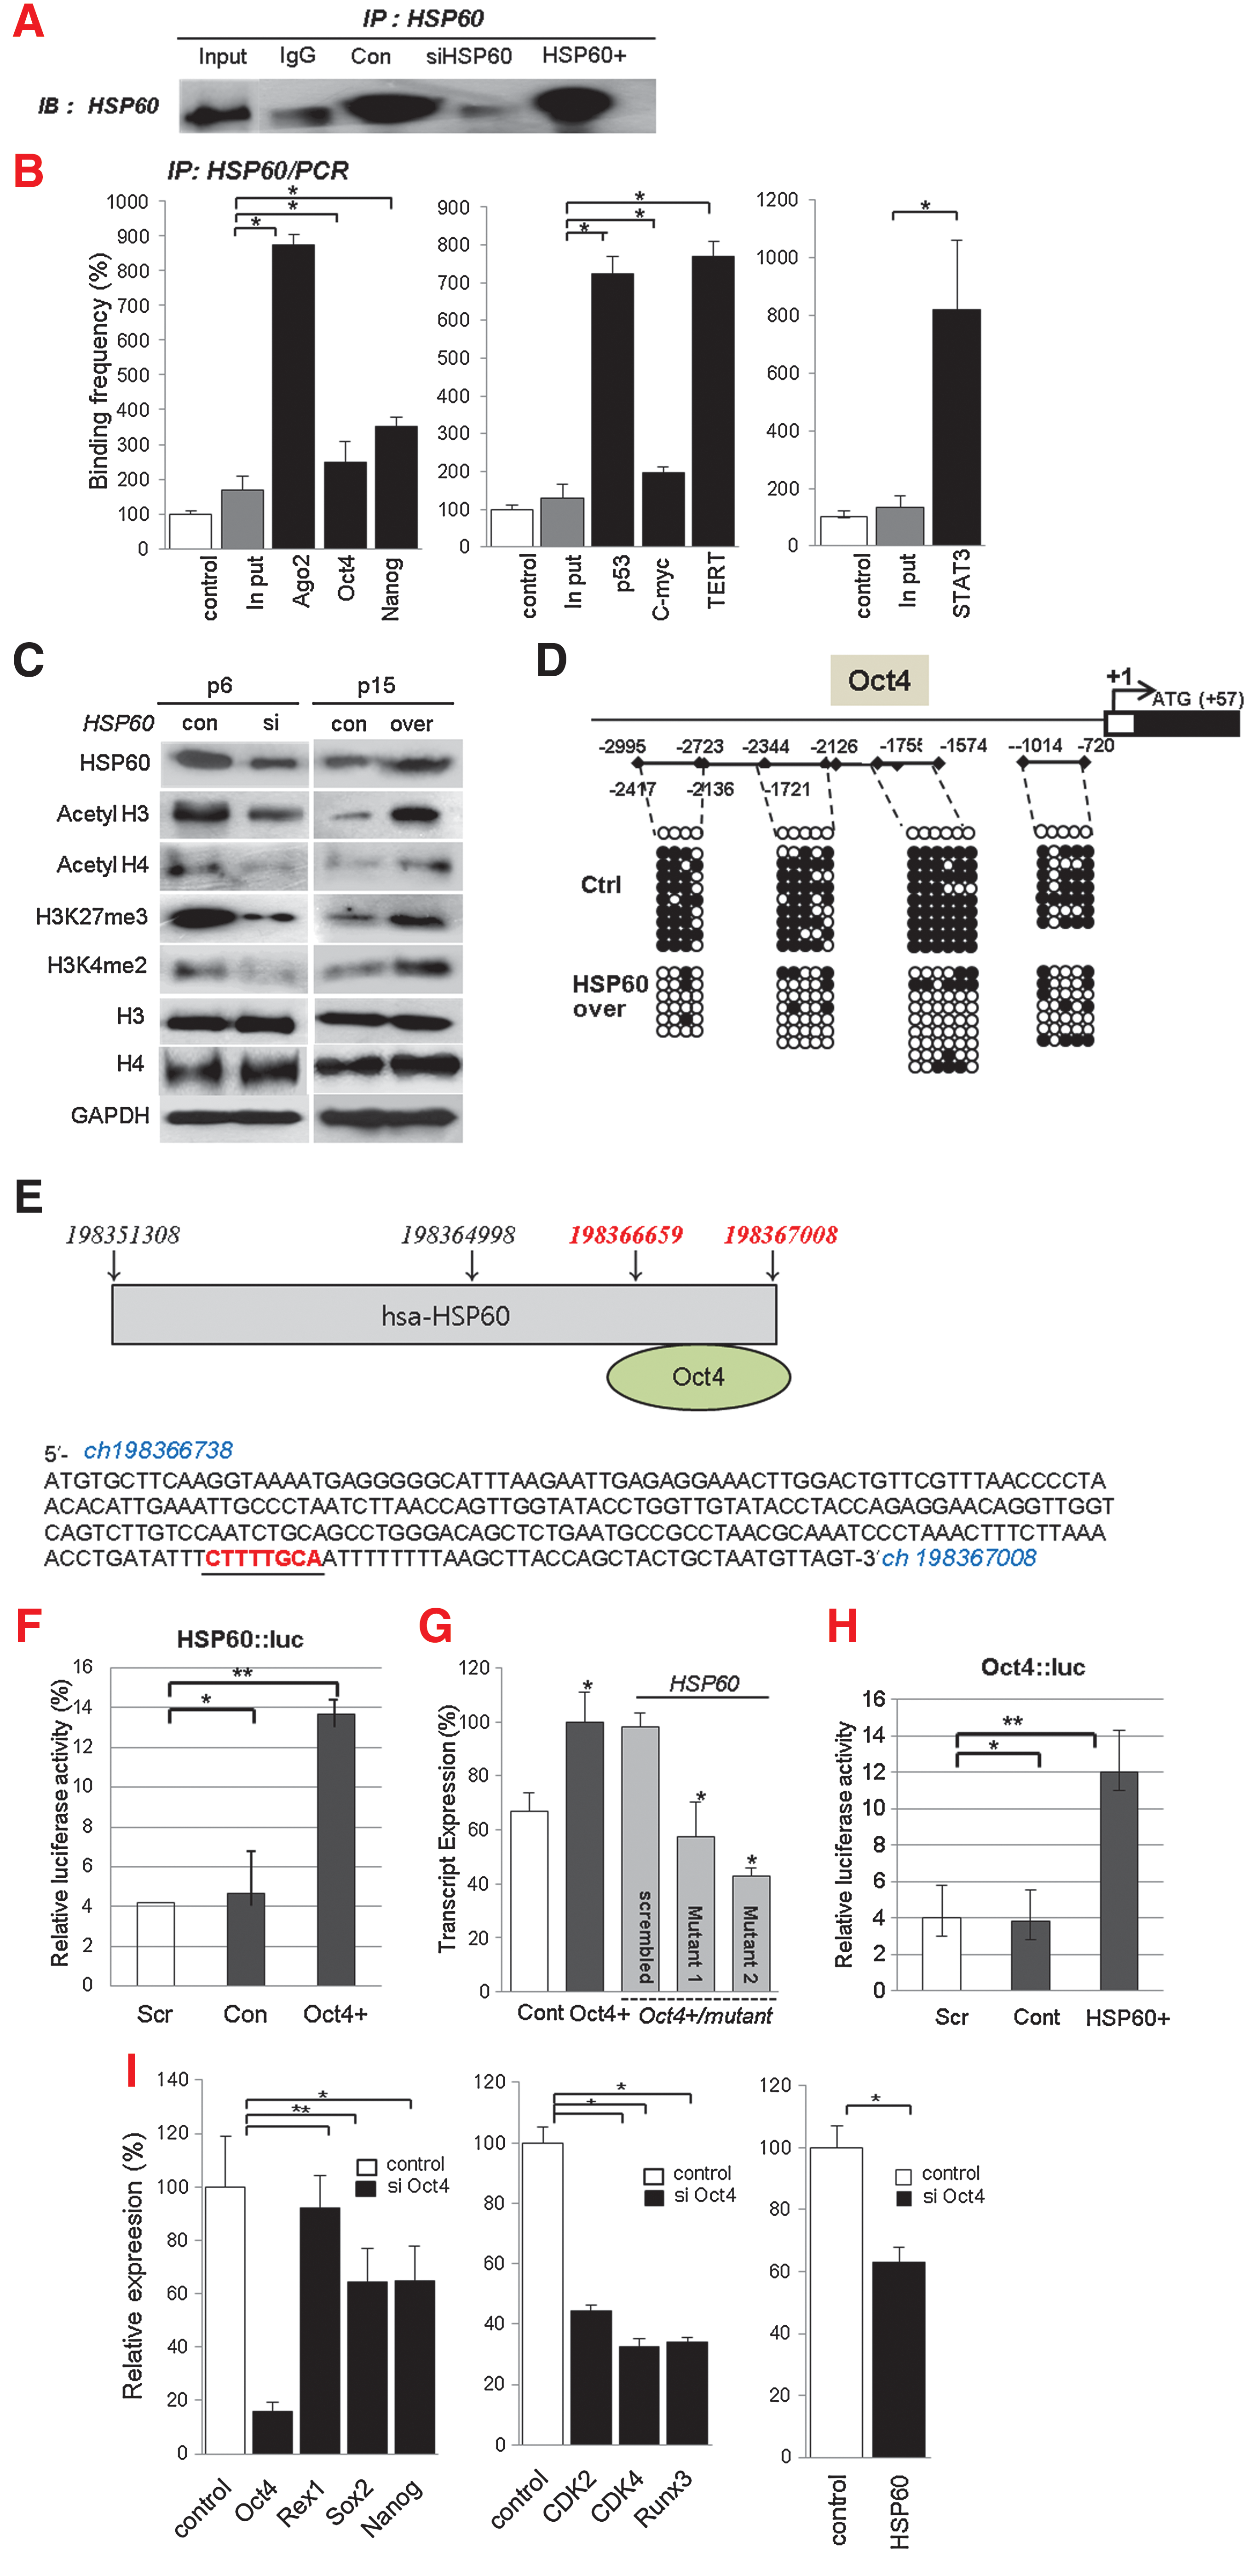
To determine the role of HSP60 on HSF1 and stemness expression, we reduced or increased the expression of HSP60 in hATSCs and detected functional gene expression by RT-PCR, Western blot, and immunocytochemistry. Early-passage (P6) hATSCs express considerable amounts of the stemness genes Oct4, Sox2, Rex1, and Nanog, as well as HSP60. However, late-stage ATSCs had prominently downregulated stemness gene and HSP60 expression at P16 (data not shown). When we disrupted HSP60 expression in P6 hATSCs, stemness expression was impaired; the overexpression of HSP60 in late passage hATSCs (P16) enhanced the expression of stemness genes (Figs. 5A and 5B). Immunocytochemical study of hATSCs also showed coexpression of Oct4 and HSP60 in the cytosol and nucleus (Fig. 5C). For a more detailed understanding of the molecular role of HSP60 in stemness gene expression, we performed CHIP-PCR analysis of HSP60. When we disrupted HSP60 expression in hATSCs, DNA binding affinity was highly decreased, but the overexpression of HSP60 enhanced gene-specific binding affinity (Fig. 6). To understand the molecular mechanism of HSP60 during hATSC self-renewal, we performed HSP60 CHIP-PCR analysis (Figs. 6A and 6B). HSP60 CHIP-PCR results showed that an increased HSP60 expression effectively bound to the promoter region of Ago2 and genes involved in self-renewal such as Oct4, Nanog, TERT, c-myc, p53, GPx3, and STAT3 (Fig. 6B). To obtain differential HSP60 binding frequency on each gene promoter, we quantified the CHIP-PCR product after running it on a gel both before (control ATSCs; 100%) and after HSP60 overexpression in hATSCs (HSP60/hATSCs; relative % compared to control) (Fig. 6B). Oct4 directly regulates HSP60 expression and thus hATSC survival and self-renewal. We also verified that the introduction of HSP60 induces positive Oct4 regulation via direct binding to Oct4 and epigenetic reprogramming of the Oct4 gene along with acetyl H3, acetyl H4, H3K27me3, and H3K4me2 upregulation (Figs. 6C and 6D). We detected that Oct4 directly regulates HSP60 expression by binding to specific regions of the HSP60 promoter. The Oct4-binding nucleotide sequence of the HSP60 promoter is indicated in red (Fig. 6E) (19). We also detected the function of Oct4 in hATSC self-renewal and stemness gene expression. The heat shock protein 60 promoter assay result showed that Oct4 directly controls HSP60 expression after binding to the HSP60 promoter region (Fig. 6F). To confirm HSP60 gene expression regulation by exogenic Oct4, we evaluated HSP60 expression level after transfection of two types of mutant Oct4 binding motif. Cells transfected with either mutant construct showed significantly decreased HSP60 expression in Oct4-overexpressing hATSCs (Fig. 6G). The Oct4 promoter assay result showed that HSP60 directly controls Oct4 expression via binding of the Oct4 promoter to HSP60 (Fig. 6H). The disruption of Oct4 expression in hATSCs finally resulted in the inhibition of cell growth along with the downregulation of HSP60 and the self-renewal genes CDK2, CDK4, RUNX3, and c-myc and stemness genes (Fig. 6I). Collectively, we confirmed that HSP60-induced hATSC self-renewal is mediated by Oct4.
HSP60 regulates meso- and endodermal differentiation of hATSCs via Oct4 control
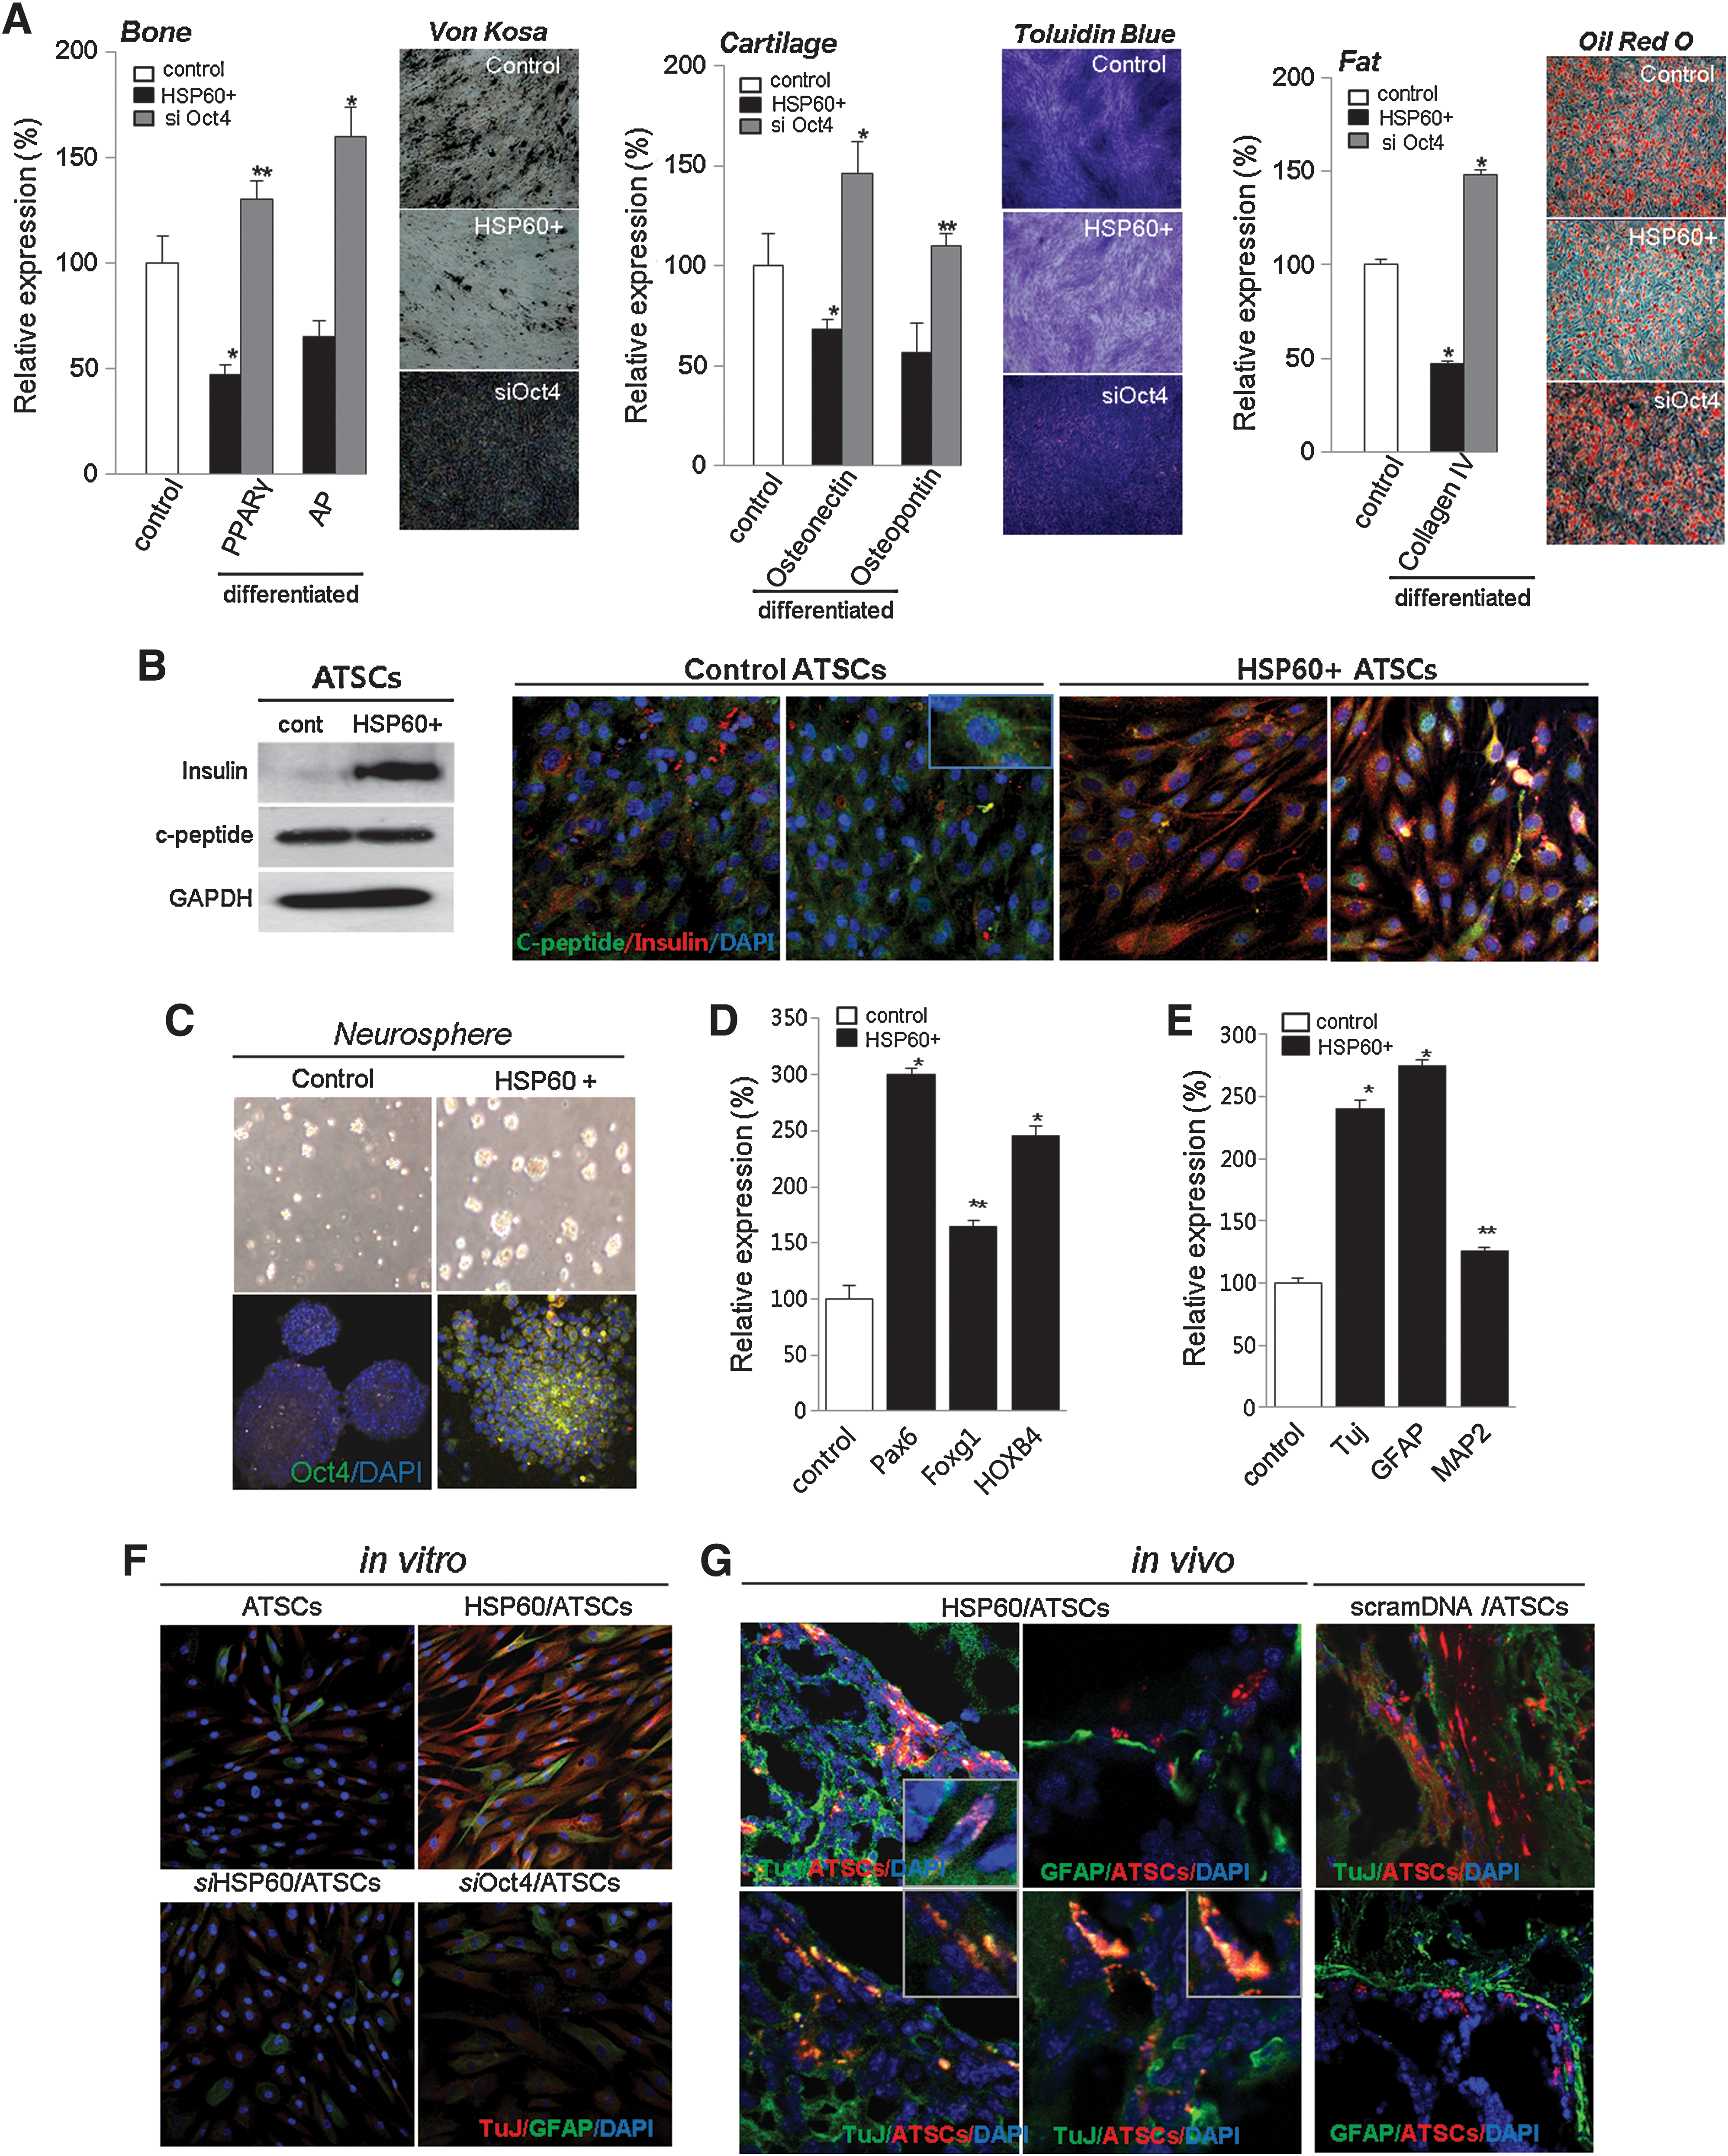
We studied the role of HSP60 in hATSC mesodermal differentiation into fat, bone, and cartilage. HSP60-overexpressing P16 hATSCs were shown to accumulate large quantities of calcium and lipid droplets, and we detected apparent differences in nodule and lipid droplet formation efficiency between naïve and HSP60-overexpressing hATSCs. Figure 6A shows that an almost 50%–70% decreased amount of lipid droplets and calcium nodules was detected in HSP60-overexpressing hATSCs compared to control cells (Fig. 7A). These staining results were exactly consistent with our findings regarding the downregulation of adipogenesis- and osteogenesis-related transcription factors including osteopontin, osteonectin, PPARγ (peroxisome proliferator-activated receptors γ), and AP (alkaline phosphatase) after HSP60 upregulation (Fig. 7A). Moreover, compared to controls, the disruption of Oct4 expression also induced significantly enhanced adipogenesis, chondrogenesis, and osteogenesis as well as the downregulation of lineage-specific gene expression (Fig. 7A). Our immunocytochemistry and Western blot results also revealed that differentiation into insulin-secreting β-cells increased from 5% to 23% in HSP60-overexpressing hATSCs compared to control cells (Fig. 7B).
HSP60 induces neural differentiation priority in vitro and in vivo via Oct4 control
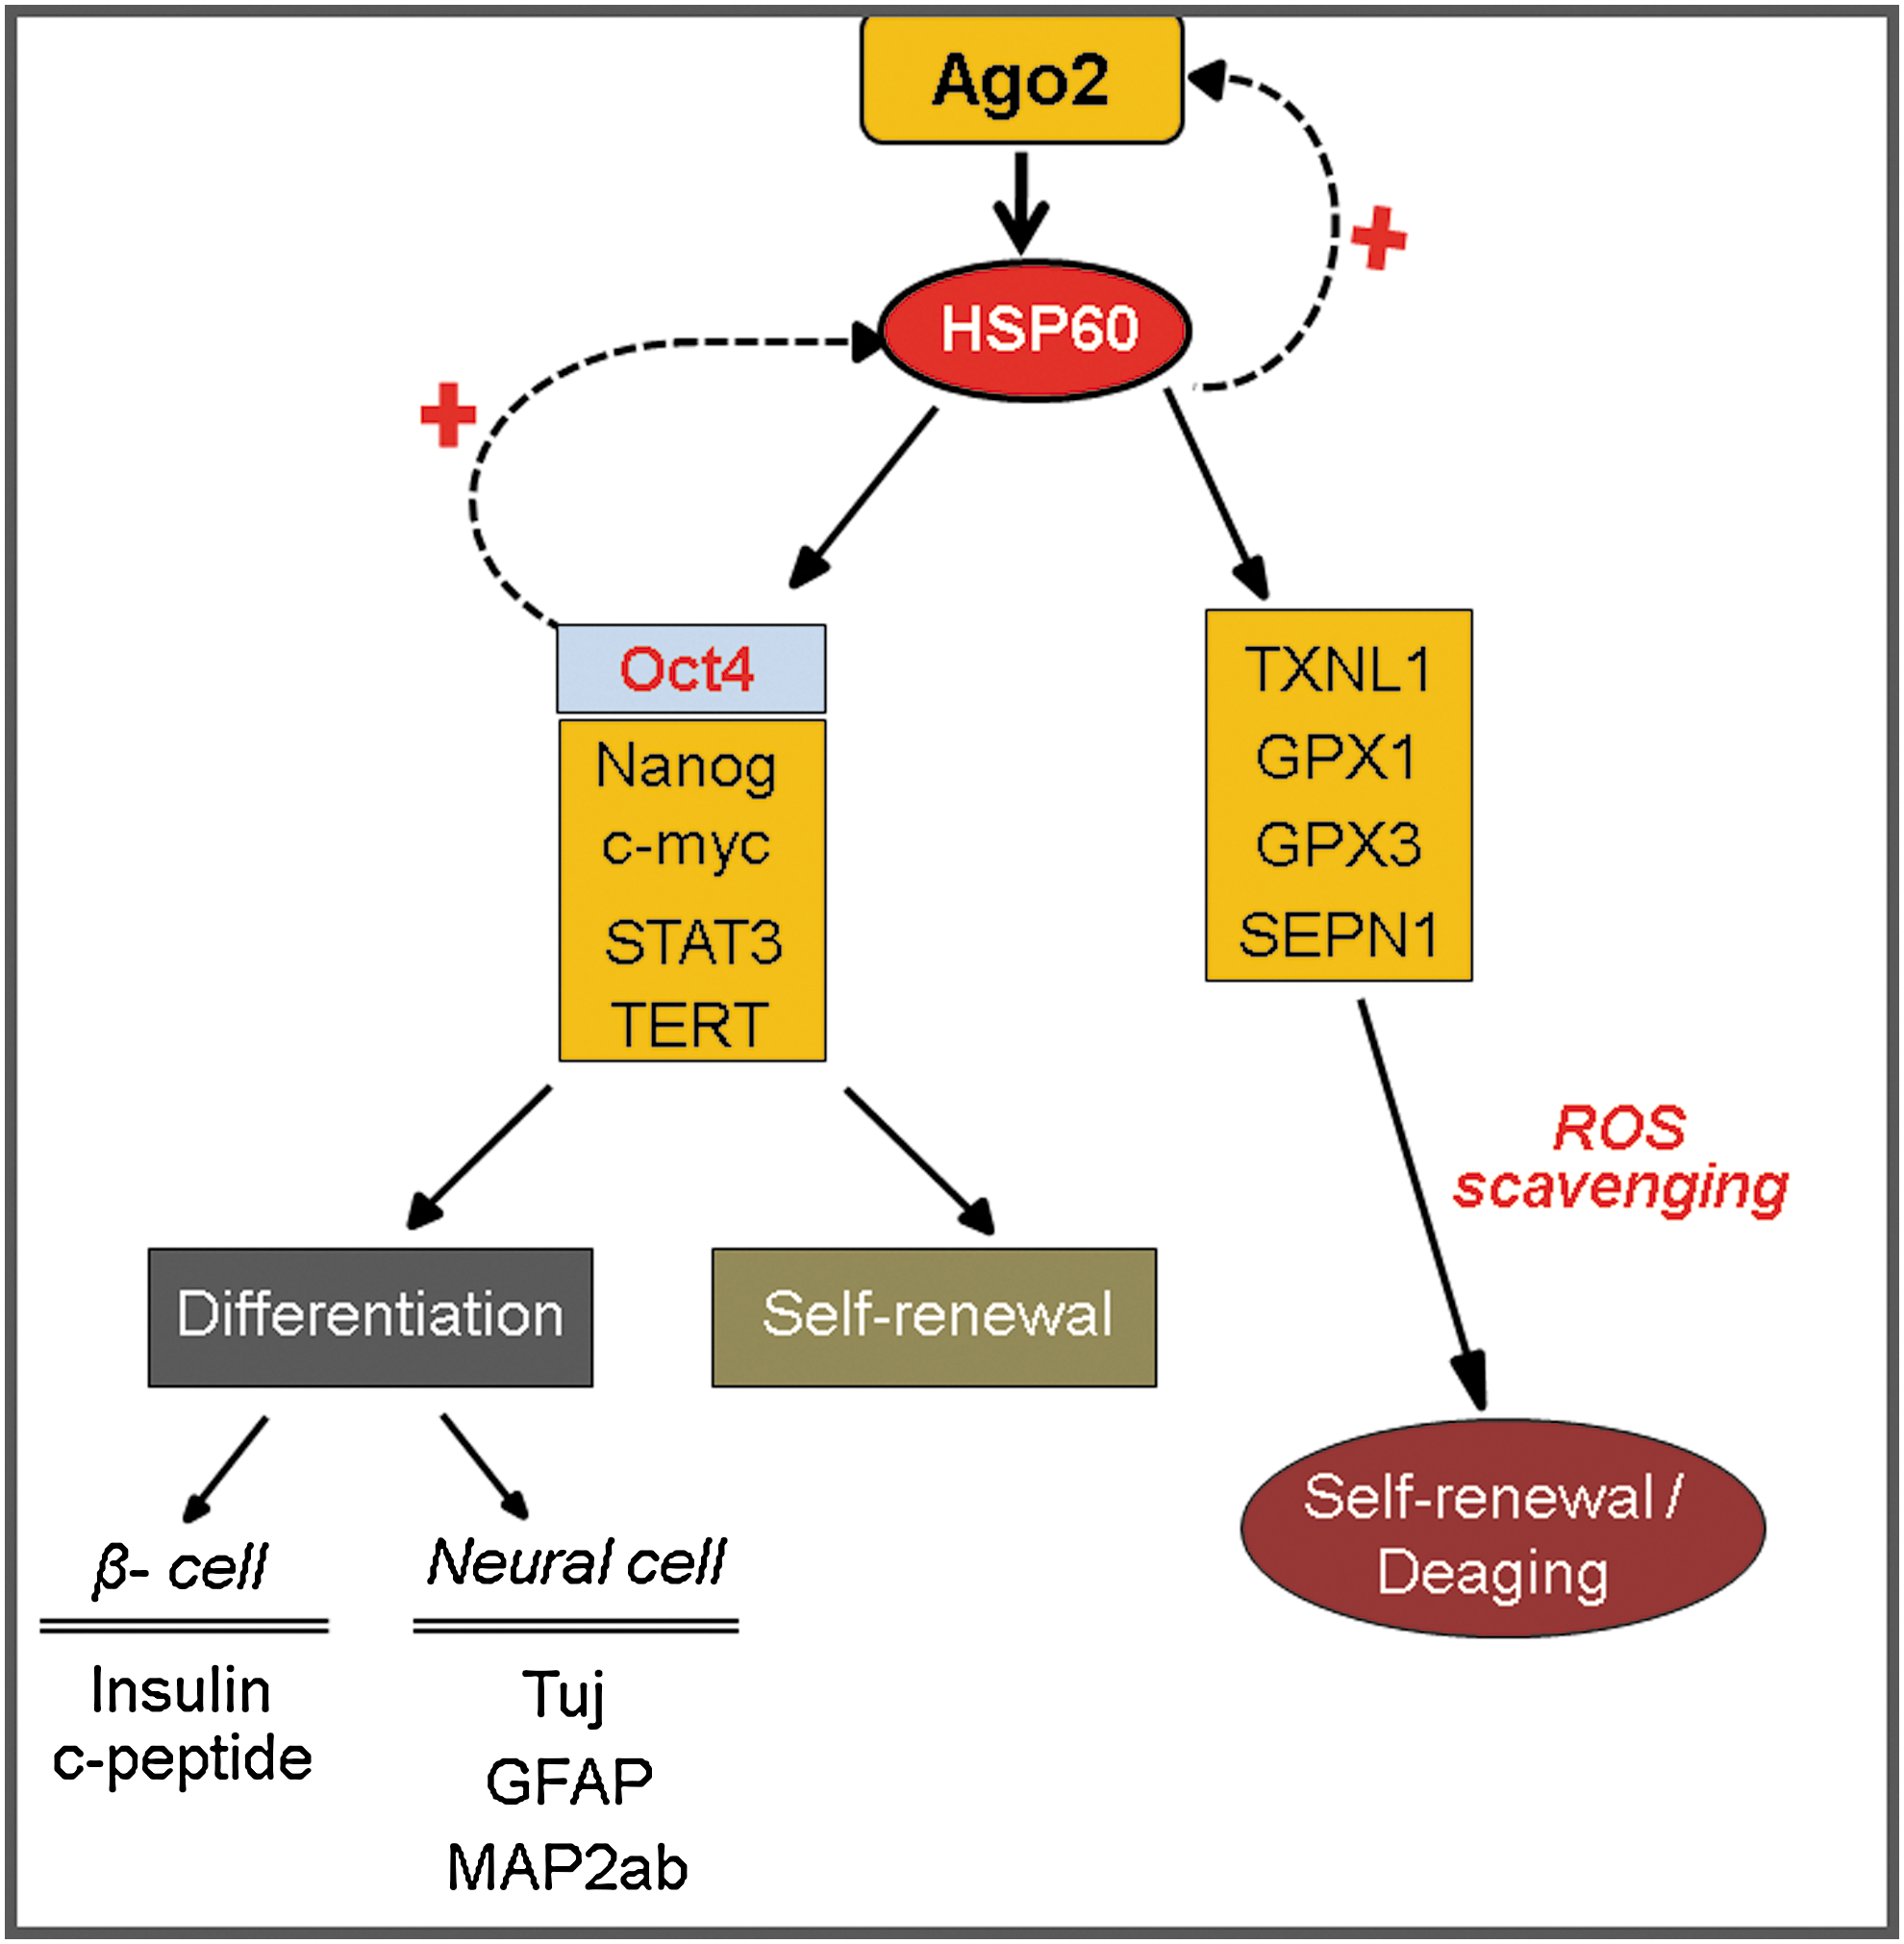
Next, we assessed the neurogenic potency of HSP60-overexpressing hATSCs compared to control cells. HSP60-overexpressing, hATSC-derived neurospheres showed prominently increased Oct4 expression (Fig. 7C). Additionally, we detected that neural development transcription factors such as Pax6, Foxg1, and HOXB4 in neurospheres were also upregulated in HSP60-overexpressing ATSCs-derived neurospheres. Pax6, for example, was increased by almost 300% (Fig. 7D). The transcription factors HoxB1 and FOXB4 were significantly upregulated by the third day of neurosphere culture in HSP60-overexpressing hATSCs compared to controls (Fig. 7D). After 7 days of differentiation induction, we evaluated mature neural differentiation potency of HSP60-overexpressing neurospheres by immunocytochemistry and Western blot using neural-specific antibodies such as TuJ and GFAP (Figs. 7E and 7F). HSP60-overexpressing hATSCs showed significantly upregulated numbers of TuJ+ neuronal cells (approximately 48%) compared to control cells (less than 5%–10%) (Fig. 7F). In addition, Nestin expression was significantly downregulated compared to control hATSCs in vitro (data not shown). We also confirmed the neural priority of HSP60-overexpressing hATSCs in traumatic injured mouse brains in vivo. Four to five weeks after cell grafting, engrafted HSP60-overexpressing hATSCs transdifferentiated more efficiently into TuJ+ neuronal cells (approximately 15%–20% of CM-Dil+ cells) compared to control hATSCs (approximately below 5% of CM-Dil+ cell) (Fig. 7G). Figure 8 presents the global regulation pathway of HSP60 for hATSCs self-renewal, survival, and multipotency.
Discussion
Ago2, also known as elF2C2, is a human-specific Ago protein with intrinsic endonuclease activity that plays a fundamental role in gene regulation. Ago2 provides RNase activity for the cleavage of target mRNAs that are complementary to the guiding siRNA or miRNA (30, 38). Recently, Grace et al. (49) found that the levels of pre-miRNAs associated with endogenous Ago2 are significantly higher in the cells that lack Dicer. They detected nuclear and cytoplasmic Ago2 in a HeLa cell immunofluoresence study, which was consistent with previous studies that reported nuclear Ago2 localization in human cell nuclear extracts and RISC activity in mammalian cell nuclear extracts, all of which indicate the presence of active Ago2/miRNA complexes in the nucleus (33, 40, 41). Nuclear Ago2 is colocalized with nuclear Oct4 or HSP60 at specific regulatory regions of functional genes and positively controls cell self-renewal and differentiation. Ago2 binding resulted in the overexpression of Oct4, Klf4, Sox2, Nanog, Rex1, and cell cycle-activating genes along with expansion of the number of cells in S-phase. Our preliminary studies revealed that most Ago2-occupied genes are functionally important and act in embryonic development to induce organ-specific cell proliferation processes (data not shown). Interestingly, nuclear HSP60 was prominently decreased in passage 15 hATSCs compared to passage 6 hATSCs, while the total HSP60 expression level was unchanged. This result revealed that nuclear HSP60 localization is crucial for hATSCs to escape from senescence and also affected their self-renewal and differentiation ability. When we overexpressed HSP60 in hATSCs, nuclear HSP60 localization was significantly increased and cells had improved self-renewal and ability to differentiate into neurons and beta-cells. Ago2 control of nuclear HSP60 has critical functions for stem cell behavior by controlling cells' stemness and self-renewal genes after binding to those genes' regulatory regions. To determine the effect of Ago2 depletion on hES cell pluripotency and self-renewal, we evaluated the growth and pluripotency of hES cells subjected to Ago2 interference. Compared to the hES cell controls, siAgo2-treated hES cells had significantly attenuated growth activity. Knockdown of Ago2 in hES cells also resulted in the downregulation of AP expression, expression of stemness genes such as Klf4, Sox2, Nanog, and Oct4 and the expression of several development-related genes, including HES1, Rest, SALL1, SALL4, FOXD3, STAT3, and CDK2 (data not shown). Ago2 expression in hES cells was crucial for their pluripotency and self-renewal. Analysis of the cell cycle profiles of cells with knocked-down Ago2 cells showed reduced numbers of cells in S-phase and CDK2 and CDK4 downregulation. Additionally, Ago2 knockdown effectively induced apoptotic cell death in cultured hATSCs along with the activation of caspases 3 and 9. These results suggest that Ago2 protein and its related miRNA regulatory functions are critical for enhancing the self-renewal and survival of hATSCs. Ago2 occupancy effectively facilitates hATSC self-renewal and differentiation potency through the direct or indirect regulation of miRNA or overexpression of functional stemness genes (data not shown). Ago2 disrupts the miRNA processing machinery and is crucial for reducing the differentiation and proliferation abilities of stem cells. Our results suggest that specific functional genes modulated by nuclear Ago2 play critical roles in stem cell self-renewal to permit differentiation.
Generally, HSPs are involved in a multitude of critical cellular functions that promote survival under normal and stressed conditions. The expression of HSPs has been correlated with cell survival in many neuronal injuries, and the mutation or deletion of HSPs is correlated with several neurodegenerative conditions. Additionally, the overexpression or disruption of HSP60 expression has a significant impact on cellular survival in the nervous system. Although HSP60 has a crucial role in the folding of many proteins, it also has additional important functions (44a). HSP60 is upregulated in stem cells (36) and is highly expressed in germ cells (35, 43). A previous study also reported that HSP60 is upregulated in mesenchymal cells during blastoma development and in regenerative cell propagation in damaged tissues. These cells have stem cell-like regenerative properties that are required for subsequent tissue regeneration via cell self-renewal. This report revealed that HSP60 function is crucial for cell survival from various kinds of stresses and apoptosis and also induces regeneration in damaged tissues or developing organs (32). Moreover, HSPs are diagnostic or prognostic markers for a variety of tumors including prostate cancer (13). In several cancer tissue types, it has been shown that the increased expression of HSP27, HSP60, and HSP70 and the overexpression of these factors induces cell survival, proliferation, and inhibited differentiation and is correlated with tumor malignancy (9, 11, 26 –28, 47, 48). In this study, we showed that exogenous Oct4 introduces neural transdifferentiation but prominently attenuates mesodermal differentiation. We had previously reported the effect of Oct4 overexpression on mesodermal differentiation into fat, bone, and chondrocyte from hATSCs. Oct4-downregulated hATSCs were shown to accumulate significant quantities of calcium nodules, lipid droplets, and cartilage (17, 23). When we induced mesodermal differentiation of Oct4-, Sox2-, and Nanog-overexpressing hATSCs, the differentiation efficiency of hATSCs overexpressing any of the genes was prominently decreased and a decline in the expression of lineage specific genes was seen. In contrast, the neurogenic potency of Oct4-overexpressing hATSCs was significantly upregulated via transdifferentiation into a neural lineage from mesoderm both in vitro and in vivo (17, 23). In this study, we found that HSP60 expression was positively regulated by Oct4 through Oct4 binding to the regulatory region of the HSP60 gene (Fig. 5E). Finally, HSP60 mediates Oct4, which controls hATSCs fate and their self-renewal or selective differentiation into specific lineage of cells or tissues. A recent study also reported that cytosolic HSP60 protects host cells against stressed conditions via their interaction with the IKK complex, promoting its activation (8). This signaling action of HSP60 affects the induction of one the NFκB target genes MnSOD, which induces cell survival because MnSOD effectively eliminates superoxide anions inside mitochondria.
Somatic cell aging increases the rate of apoptosis during senescence and allows DNA damage to accumulate. This eventually leads to activation of the proapoptotic factor p53. Mammalian organisms usually produce and remove ROS. The antioxidative defense system regulates ROS levels and minimizes cell damage caused by oxidative stress; ROS accumulation in cells directly or indirectly accelerates cellular senescence and apoptotic cell death. We previously reported that the ROS scavenging of the redox controlling enzymes GPx3 and GPx1 was controlled directly or indirectly by nuclear Ago2 in ATSCs (21). In this study, we report that HSP60 upregulates Ago2 via direct binding of Ago2 to the regulatory regions of the HSP60 gene. Ago2 and HSP60 expression both gradually decrease in late passage (old) hATSCs. HSP60 has the ability to control apoptosis by directly or indirectly interacting with a number of apoptotic proteins. HSP60 binds directly to the pro-apoptotic proteins Bax or Bak in the cytosol and inhibits their translocation to the mitochondria (14, 25). Our study also showed that downregulation of HSP60 expression was prominent before senescent and apoptotic behavior; ROS accumulation, P38/JNK activation, Bax, caspase3, and cytochrome C overloading increased with decreasing HSP60 expression and an increased number of TUNEL+ cells was seen. Adipose-derived stem cell senescence was obtained by serial passaging up to passages 20–25. Consistent with our preliminary study that examined cells beyond passage 10, over 50% of cultured hATSCs were SA-β-Gal positive (data not shown). When we overexpressed HSP60 in P15 hATSCs, cells changed to a spindle or spheroid morphology and self-renewal activity was significantly increased along with Oct4 upregulation. HSP60 in hATSCs has the ability to directly regulate cell aging, self-renewal, and differentiation by direct interaction with GPx1, GPx3, SEPN1, and TXNL1. The stemness genes c-myc, p53, and TERT, as well as STAT3 are also directly controlled by HSP60 and function in hATSC self-renewal and survival. Finally, HSP60 effectively improves differentiation ability via reprogramming cells into a younger cell phenotype.
In summary, we first demonstrated that nuclear Ago2 directly regulates HSP60 expression to promote hATSC self-renewal and differentiation. HSP60 also controls the expression of the ROS scavenging genes Oct4, c-Myc, p53, and STAT3 upon direct binding to their regulatory regions. Nuclear Ago2/HSP60 was crucial for the attenuation of stem cell senescence via the partial dedifferentiation of cultured hATSCs and may also play a vital role during regeneration in injury or disease models.
Materials and Methods
Isolation and culture of adipose tissue-derived stem cells
Human raw fat tissue obtained from patients' abdomens (following documented patient approval) was processed according to established methods to obtain stem cell vascular functions. To isolate the stem cells, the samples were digested with 0.075% collagenase IV (Sigma, St. Louis, MO) and centrifuged at 1200 g for 10 min to acquire a high density cell pellet. The pellet was then suspended in red blood cell (RBC) lysis buffer (Biowhittaker, Walkersville, MD) and incubated for 10 min at room temperature to lyse the contaminating RBCs. The stem cell pellet was then collected and incubated overnight at 37°C/5% CO2 in 10% FBS containing α-MEM medium (GIBCO BRL, CA). This work was approved by the Seoul National University Institutional Review Board (IRB No. 0603/001-002), and the ethics committee specifically approved the procedure.
Cell viability and proliferation assay
Cell viability was assessed by visual cell counts in conjunction with trypan blue exclusion. Mitochondrial activity was assessed by measuring the ability of the cortical cultures to reduce 3,4,5-dimethyl thiazol-2-yl-2,5-diphenyl tetrazolium bromide (MTT; Sigma) to a colored formazan using a plate reader. In all viability assays, triplicate wells were established under each experimental condition, and each experiment was repeated at least three times. The raw data from each experiment were analyzed via analysis of variance with Fisher's or t-tests. For flow cytometric analysis, cells were cultured in 100-mm dishes at densities that ensured exponential growth at the time of harvesting. Harvesting and processing protocols were used to detect DNA via flow cytometry with propidium iodide. The cells were analyzed with a BD Biosciences FACScan system (San Jose, CA). The percentages of cells in the G0/G1, S, and G2/M phases of the cell cycle were determined using a DNA histogram fitting program (MODFIT; Verity Software, Topsham, ME). A minimum of 104 events/samples was collected.
TUNEL assay
The death of apoptotic cells was estimated in terms of their ability to reduce the dye MTT to blue-purple formazan crystals. The effect of H2O2 on the induction of cell death was determined with the TdT in situ apoptosis detector kit (Roche, Indianapolis, IN), used according to the manufacturer's specifications. After fixation, cells with 4% paraformaldehyde were incubated in the TUNEL reaction mixture containing deoxynucleotidyl transferase (TdT) buffer with TdT and biotinylated dUTP, incubated in a humid atmosphere at 37°C for 90 min, and then washed with PBS. The cells were incubated at room temperature for 30 min with anti-horseradish peroxidase-conjugated antibody, and the signals were visualized with diaminobenzidine. The results were analyzed using a fluorescence microscope (Leica Microsystem, Exon, PA). TUNEL-positive apoptotic cells were quantified by counting of positively stained cells. Three digital microscopic images at a magnification of 100 were randomly captured at the areas where the positive cells and the number of positively stained cells in the three images were averaged.
Real time RT- PCR
One week after the initiation of culturing, the total cellular RNA was extracted with Trizol (Life Technologies, Frederick, MA) from cultured ATSC. Total RNA was reverse-transcribed into first-strand cDNA using an oligo-dT primer, then amplified via PCR using the indicated gene-specific primers (20 pM). The PCR reactions were conducted using an ABI 7700 Prism Sequence Detection System and SYBER green detection kit (Applied Biosystems, Foster, CA). The primer sequences were designed with Primer Express software (PE-Applied Biosystems, Warrington, UK) using gene sequences obtained from the GeneBank database.
Luciferase assay
To determine the activity of Ago2 and HSP60 promoters before and after Ago2, HSP60, or Oct4 overexpression in hATSCs, we performed a luciferase reporter gene assay. The firefly luciferase test reporter genes used in this study, pGL3-Ago2, pGL3-Oct4, and pGL3-HSP60 the luciferase reporter plasmid driven 2.9-kb AR promoter. As an internal control, phRL-SV40 was obtained from Promega (Madison, WI). Cells were seeded in 6-well plates until 70% confluence and transfected with Ago2, HSP60, or Oct4 using Lipofectamine™. Cells were transfected with a pair of reporter gene plasmids using Lipofectamine™ LTX and Plus™ Reagent, referring to the manufacturer's protocol (Invitrogen). After transfection of each plasmid, cells were incubated with DMEM containing 10% FBS. At 24–48 h post-transfection, medium was replaced with fresh phenol red-free RPMI plus 0.1% BSA with 10 nM DHT. Cells were harvested 24–48 h later for dual luciferase assays (Bright Glo, Promega) to determine the promoter activity of the test plasmid. Firefly luciferase expression from the test plasmid and Renilla luciferase expression from phRL-SV40 in a single sample were measured sequentially in a luminometer according to the Dual-Luciferase Reporter System protocol (Bright Glo, Promega).
Differentiation potencies of hATSC
In order to compare the multipotential differentiation abilities of hATSCs, the cells were subjected to differentiation under known conditions to induce adipogenic, osteogenic, and chondrogenic lineages in human cells. Prior to culturing in the induction media, the cultures were grown to confluence. For adipogenic differentiation, the hATSC were induced by the passaging of cells at a dilution of 1:10 in control media supplemented with 10 ng/ml of insulin and 10–9 M dexamethasone (Sigma). Adipogenic differentiation was visualized by the presence of highly refractory intracellular lipid droplets via phase-contrast microscopy. In order to induce osteogenic differentiation, the cultures were fed daily for 3 weeks with control medium to which 10 mM β-glycerophosphate, 50 ng/ml ascorbic acid, and 10–9 M dexamethasone had been added. The mineralization of the extracellular matrix was visualized by the staining of the cultures with von Kossa and Alizarin Red. Von Kossa staining was conducted using an aqueous 5% AgNO3 solution, followed by 2 min of fixation in 5% Na2S2O3 solution. For chondrocyte differentiation, a pellet culture system was utilized. Approximately 3 x 10⁶ ATSCs controls were placed in wells of a 96-well plate. The pellet was cultured at 37°C with 5% CO2 in 500 μl of chonodrogenic media containing 6.25 g/ml insulin, 10 ng/ml of transforming growth factor 1, and 50 ng of ascorbate-2-phosphate in control media for 2–3 weeks. The medium was replaced every 2 days for 15 days. For beta cell differentiation, cells were cultured in “N2 media+NA” containing DMEM/F12 (Gibco-Invitrogen) supplemented with 10 mM nicotinamide (Sigma-Aldrich), ITS (1:50), B27 media supplement (1:50; Invitrogen), and 15% FBS. After 24 h of culture, the medium was exchanged with high glucose (dextrose [3500 mg/L]) differentiation media for 2 weeks. After the induction of differentiation, we conducted immunocytochemistry using C-peptide and insulin antibodies. For the induction of neural differentiation, we cultured neurospheres in a neurobasal medium (NB; Invitrogen, Gaithersburg, MD), supplemented with B27 (Invitrogen), 20 ng/ml of bFGF, and 10 ng/ml of EGF (Sigma) for 4–7 days. Neurospheres derived from the cells were layered and cultured further on PDL-laminin double-coated well plates. To determine the expression of the neural markers, differentiated hATSC were fixed in 4% paraformaldehyde (PFA) fixative solution for 30 min at room temperature. After extensive washing in PBS, the cells were blocked for 30 min at room temperature with 1% normal goat serum. The cells were then incubated with primary antibodies against anti-TuJ 1 (1:500; Sigma) and anti-GFAP (1:1500; Dako, Carpinteria, CA). After extensive washing, the cells were incubated with FITC or Texas-Red conjugated secondary antibodies (1:250; Molecular Probes, Eugene, OR). Controls in which the primary antibodies were omitted or replaced with irrelevant IgG resulted in no detectable staining. The specimens were evaluated using a Leica fluorescence microscope (Leica Microsystems). We then analyzed the cells via fluorescence microscopy (Leica Microsystems). Adult ICR mice weighing 30 g (∼ 5 weeks of age) were housed in a controlled environment and provided with standard rodent chow and water. All animal experiments were approved and followed the regulations of the Institute of Laboratory Animals Resources (SNU-0504412-1, Seoul National University, Korea). For the brain trauma animal model, animals were subjected to a traumatic injury followed by a modified protocol as described in detail in Kang et al. (50) and Supplementary Material and Methods (Supplementary Data are available online at
Preparation of tissue whole extracts and Western blot
For the confirmation of differentially expressed proteins following the de-ATSC, the cultured cells were pooled and lysed in 500 μl of lysis buffer (20 mM Tris-HCl [pH 7.5], 150 mM NaCl, 1 mM EDTA, 1% Triton X-100, 2.5 mM sodium pyrophosphate, 1 mM EGTA, 1 mM glycerophosphate, 1 mM Na3VO4, and 1 mM PMSF). The lysates were clarified via 10 min of centrifugation at 15,000 g and the total protein content was determined using a Bio-Rad protein assay kit (Milan, Italy). For Western blotting, equal amounts (40 μg) of protein extracts in a lysis buffer were subjected to 10% SDS-PAGE analysis and transferred to nitrocellulose membranes. Anti-Tuj (1:500; Sigma), anti-C-myc (1:300; Chemicon), anti-p53 (1:1000; BD Science), anti-p21 (1:1000; Santa Cruz), anti-acetyl H3 (1:2000; Upstate, USA), anti-acetyl H4 (1:10000; Upstate), anti-GFAP (1:3000; Dako), pSAPK/JNK (1:1000; Cell Signaling), anti-pERK (1:1000; Cell Signaling), anti-Jak2 (1:1000; Cell Signaling), anti-pSTAT 3 (1:1000; Cell Signaling), anti-GAPDH (1:250; Chemicon), and anti-β-actin (1: 500; Sigma) antibodies were incubated with the membranes. The relative band intensities were determined using Quality-one 1-D Analysis software (Bio-Rad).
Histologic analysis
For immunohistochemical analysis of the frozen tissues, the sections were fixed for 30 min in 4% paraformaldehyde. The sections were then washed three times in PBS, and nonspecific binding was blocked with 10% normal horse serum. The sections were then incubated overnight at 4°C with the following antibodies; anti-GFAP (1:2000; Dako) and anti-Tuj (1:250; Sigma). After rinsing with primary antibodies, the sections were incubated for 1 hour. After extensive washing in PBS, the cells were incubated for 30 min with FITC or Texas–Red conjugated secondary antibodies (1:250; Molecular Probes; and 1:250; Jackson Laboratory, respectively). Controls in which the primary antibodies were omitted or replaced with irrelevant IgG resulted in no detectable staining. The specimens were evaluated using a Leica fluorescence microscope (Leica Microsystems). Immunocytochemical studies were repeated at least three times. The co-localization of CM-Dil with several neural lineage markers was performed via confocal microscopy using a Leica TCS sp2 laser scanning microscope (Leica Microsystems) equipped with three lasers. Double-labeled cells were verified via the collection of 1 μm sections through the slices. For the relative quantification of NF160- or TuJ-positive cells, area counts of the striatum were conducted. In each section, five adjacent fields were sampled, beginning where the upper and lower blades were joined. Error bars represent standard deviations.
Small interfering RNA inhibition experiment
For the knockdown experiment, siRNA duplexes against the HSP60 and OCT4 were synthesized. For transient transfection, cells about 60% confluent were transfected with 10 μM siRNA using Lipofectamine (Invitrogen). The cells were harvested after 24 h for RNA isolation. Silencer Negative Control siRNA (catalog number 4611; Ambion, Inc., Austin, TX) was utilized as a control for nonspecific gene silencing. The siRNA transfection was conducted using DharmaFECT siRNA transfection reagents in accordance with the manufacturer's instructions (Dharmacon RNA Technologies, Lafayette, CO). Two complementary hairpin siRNA template oligonucleotides harboring 21-nt sequences of the target human genes were employed for transient transfection using 50 nM siRNA. Furthermore, the quantity of siRNA was optimized in accordance with the manufacturer's instructions. siRNAs for each gene (Silencer® predesigned siRNAs; Ambion) and scrambled siRNAs with the same nucleotide contents were assessed. When compared with unrelated control siRNAs and scrambled siRNAs, the gene-specific siRNAs resulted in an 80%–90% reduction in the mRNA levels of each gene, as determined by real-time PCR. The siRNA that provided the most efficient inhibition (90%–95%) was utilized for the experiments. We transfected the siRNAs for each gene into ATSCs and counted dye-excluding viable cells for 6–10 days to evaluate the presence of negative regulation of ATSCs growth and differentiation.
Nonradioisotopic telomerase assay
Telomerase activity was assessed using a modified telomeric repeat amplification protocol (TRAP) assay in accordance with the manufacturer's instructions (BD Science). Protein extracts were prepared from control ATSCs and HSP60+/ATSCs. Protein extracts (0.5 μg) prepared from each cell line were incubated in the presence of a synthetic oligonucleotide (telomerase-specific primer, 5'-AATCCGTCGAGCAGAGTT-3') that can serve as a substrate for the addition of telomeric repeats by telomerase. If telomerase activity was present in the extracts, the oligonucleotide was elongated and could function as a template in subsequent polymerase chain reactions (PCR). PCR was conducted in the presence of nucleotides, and the formation of the amplification products was assessed by monitoring amplification of the telomerase repeat. The PCR reaction products were separated on 12.5% nondenaturing acrylamide gels and stained using Syber-Gold dye (Molecular Probes). The quantification of telomerase activity was conducted following the PCR enzyme-linked immunosorbent assay procedure suggested by the manufacturer (BD Science) (22).
Bisulfite modification and sequencing of genomic DNA
Genomic DNA was purified via phenol/chloroform/isoamylalcohol extraction, followed by one chloroform extraction, after which the DNA was ethanol-precipitated. The DNA was then dissolved in distilled water. Bisulfite conversion was conducted using the EZ DNA Methylation–Gold kit (Zymo Research, Irvine, CA) as described by the manufacturer. Briefly, unmethylated cytosines in the DNA were converted into uracil via heat-denaturation of the DNA with a specially designed CT conversion reagent. The DNA was then desulfonated and subsequently cleaned and eluted. The bisulfite-modified DNA was then immediately utilized for PCR or stored at or below −20°C. The converted DNA was amplified by the polymerase chain reaction (PCR) or designed with MethPrimer (
CHIP-on-chip analysis
Anti-HSP60 and Oct4 monoclonal antibodies were obtained from Santa Cruz Biotechnology, and a rabbit IgG (PP64B) antibody was obtained from Upstate. Cells were harvested and chemically cross-linked with 1% formaldehyde (Sigma) for 20 h at 4°C. Fixation was quenched by incubation in 2.5 M glycine for 5 min at room temperature. Cells were pelleted at 4°C (500 g), washed with ice-cold PBS and lysis buffer containing 0.5% GEPAL, 1 mM and fresh PMSF, pelleted and flash-frozen in liquid nitrogen. The pellets were resuspended in pre-IP dilution buffer containing 4% GEPAL, 1 mM PMSF, and 60 mL PMSF. The cells were sonicated using a Branson Sonifier 450D at 50% amplitude with 1 min rests in ice water. The sonicated fragments ranged in size from 200 to 1,000 bp. Post-sonication, the samples were centrifuged at 14,000 rpm for 10 min at 4°C and flash-frozen in liquid nitrogen. Sonicated cell extracts equivalent to 26,106 cells were used for the immunoprecipitations. Samples were pre-cleared with protein G Dynabeads (Dynal) in 1,000 ml dilution buffer (0.01% SDS, 1.1% Triton X-100, 1.2 mM EDTA, 16.7 mM Tris-HCl (pH 8.1), 167 mM NaCl, Upstate protease inhibitor cocktail II). Cell extracts were incubated with 1 mg antibody overnight at 4°C. The chromatin–antibody complexes were isolated with protein G Dynabeads and washed one time with low salt buffer (0.1% SDS, 1% Triton X-100, 2 mM EDTA, 20 mM Tris-HCl, 150 mM NaCl), one time with high salt buffer (same as low salt but with 500 mM NaCl) and twice with TE. Protein/DNA complexes were eluted from the beads in 10 ml 20% SDS, 20 ml 1 M NaHCO3, and 170 ml H2O at 65°C with occasional vortexing. The cross-linking was reversed by the addition of 8 ml 5 M NaCl and incubation overnight at 65°C. The extracts were then treated with RNase A and proteinase K, and the DNA was purified using an Upstate EZ ChIP kit. A total of 5 mg of purified DNA (Ago2-chip, c-Myc-chip, Sox2-chip, and Input) was amplified using a GenomePlexH Whole Genome Amplification (WGA) Kit (Sigma), then DNase treated and labeled with a GeneChipH WT Double-Stranded DNA Terminal Labeling Kit. The labeled DNA was hybridized to Affymetrix human promoter 1.0R tiling arrays for 16 h at 45°C in an Affymetrix GeneChipH Hybridization Oven 640, washed using a GeneChipH Fluidics Station 450, and scanned with a GeneChipH Scanner 7G at EMD SRI. Immunoprecipitated and nonimmune (IgG) control sample biological triplicates were used for the ChIP-on-chip analyses. The human promoter 1.0R DNA tiling arrays contained 4.6 million 25-mer oligonucleotide probes covering a distance of −6 kb to +2.5 kb relative to the transcriptional start site for 28,000 human promoter regions annotated from ENSEMBL genes, RefSeq mRNAs (NCBI GenBankH) and complete-CDS mRNAs (NCBI GenBankH). These tiling arrays provided a resolution of 35 bp with 10-bp gaps between probes. For analysis of peaks calculation was performed by a binomial estimation method.
Statistical analysis
Significance was tested by the t-test or ANOVA using GraphPad InStat 3.0 software. For Repeated Measures ANOVA and in vitro studies where Kaplan-Meier curves and log-rank analyses were performed, MedCalc software was used.
Footnotes
Acknowledgments
This work was supported by the 21st Century Frontier/Stem Cell Research Committee (SC5110) and was also supported by the National Research Foundation of Korea (NRF) grant funded by the Korea Government (MEST, 2010-0020265).
Author Disclosure Statement
No competing financial interests exist.
Abbreviations Used
References
Supplementary Material
Please find the following supplemental material available below.
For Open Access articles published under a Creative Commons License, all supplemental material carries the same license as the article it is associated with.
For non-Open Access articles published, all supplemental material carries a non-exclusive license, and permission requests for re-use of supplemental material or any part of supplemental material shall be sent directly to the copyright owner as specified in the copyright notice associated with the article.
