




Abstract
Introduction
Surprisingly few reviews, however, have looked beyond the exuberance and critically examined the field “warts and all.” In one seminal review, appropriately titled “Endogenous production of H2S in the gastrointestinal tract: still in search of a physiologic function,” Linden et al. (42) reviewed and modified Wang's five criteria for a gaseous signaling molecule; i.e., it must 1) be a gas, 2) be endogenously and enzymatically generated in a regulated manner, 3) with exogenous application, cause a well-defined physiologic effect at physiologically relevant concentrations that mimics the effect of the endogenously produced H2S on tissue activity, 4) act at specific cellular targets, as demonstrated by competitive antagonism, 5) employ a specific mechanism of inactivation. The authors then went on to show that (with emphasis on the gastrointestinal tract) H2S fulfills the first criterion, partially fulfills the second criterion (a mechanism for regulating H2S production has yet to be identified), partially fills the third criterion (the definition of “physiologically relevant concentrations” remains to be determined), partially fills the fourth criterion (competitive antagonism and receptor binding kinetics remain to be determined), and fulfills the fifth criterion since tissue oxidation of H2S is well known. The authors conclude that while H2S is a promising candidate as a gasotransmitter, a number of questions remain to be answered.
Innovation
H2S biology is an exciting field that is attracting an ever-increasing number of investigators with wide and varied interests. This review emphasizes a number of areas that have either become erroneously entrenched in the literature or are especially problematic in working with this gas.
“Man is so intelligent that he feels impelled to invent theories to account for what happens in the world. Unfortunately, he is not quite intelligent enough, in most cases, to find correct explanations.”—Aldous Huxley
The present review takes another critical look at H2S chemistry and biology. The intent is to examine areas that have either been overlooked, generated confusion, produced conflicting opinions, or raised interesting and pressing questions. Clearly, not all areas in this expanding field can be covered in detail in this brief review, and I apologize for topics or significant articles that are not covered.
H2S Chemistry
Hughes et al. (25) reviewed the practical aspects of preparing and working with H2S under a variety of conditions. The following paragraphs emphasize related aspects of H2S measurement and chemistry in physiological solutions and buffers (see also Table 1).
GC-FPD, gas chromatography with flame photometric detector; IC, ion chromatography; ISE, ion-selective electrode; MBB, monobrombimane; SSFD, sulfide-sensitive fluorescent dye; nd, not detectable.
Measuring H2S
A number of recent reviews have summarized the advantages and disadvantages of extant methods for measuring H2S in buffers, biological fluids, and tissue samples (25, 53, 72), and the reader is referred to these for further details. This section focuses on the half dozen methods most frequently used for H2S measurements in biological samples. Emphasis is placed on their limitations and potential for error.
The most commonly used method is the colorimetric generation of methylene blue by the reaction of H2S with N,N-dimethyl-p-phenylenediamine sulfate. This method was developed for measuring H2S in aqueous solutions and has more recently been adapted (generally inappropriately) to measuring H2S in plasma and biological fluids in which it produces spuriously high values (53). In addition, the methylene blue method lacks sensitivity at low H2S concentrations, and Hughes et al. (25) have recently shown that due to the formation of dimers and trimers of methylene blue, the absorption spectra of aqueous solutions of methylene blue do not obey Beer's law. In fact Beer's law only seems applicable at sulfide concentrations below 1 μM. These values are well below the 20–300 μM commonly reported in biological samples using this method. Because the methylene blue reaction proceeds under acidic conditions, it is not possible to separate free H2S from acid-labile H2S derived from iron–sulfur groups in cytochromes and other iron centers; the latter may be several thousandfold in excess of free H2S (cf. 37). This method requires that the sample is mixed with analyte 20 to 30 minutes before the color is fully developed and the color intensity changes with time. The methylene blue method may be suitable in experiments in which there is no free protein, such as buffer-perfused organs. However, it cannot be used for continuous measurement of H2S under physiological conditions, in real-time, or for simultaneous measurement of O2.
Sulfide-specific ion-selective electrodes (ISEs) that measure S2− have also been used on biological samples, but they too are not without error. Formation of S2− requires a strong (pH>11) alkaline solution, generally referred to as the “antioxidant buffer,” to drive the equilibrium between H2S, HS−, and S2− to favor S2−. These alkaline conditions appear to promote hydroxyl replacement of cysteine sulfur thereby producing erroneously high sulfide concentrations that continue to increase with time (76). Like the methylene blue method, the ISE cannot provide information in real-time on unadulterated samples nor can it be used for simultaneous measurement of H2S and O2. Furthermore, the sensitivity appears to be insufficient for most biological samples.
Ubuka et al. (73) developed a method for measuring H2S and acid-labile sulfide by initially trapping the evolved gas in an alkaline solution followed by gas chromatography with flame photometric detector and ion chromatography. They were able to measure acid-labile sulfide in tissues as low as 100 nmol/g tissue but did not detect free H2S. The method is more sensitive than either methylene blue or ISE but cannot provide real-time measurements of H2S in unadulterated samples.
The well-known method of measuring thiols by derivatization with excess monobromobimane (MBB) and subsequent measurement of the stable sulfide-diamine product with reverse phase high pressure liquid chromatography (HPLC) coupled with fluorescence detection has recently been used to measure plasma H2S (63, 77). This method is described as being “suitable for sensitive quantitative measurement of free hydrogen sulfide in multiple biological samples such as plasma, tissue and cell culture lysates, or media” (63). Reagents must be made up in deoxygenated solutions and MBB must be protected from light. Maximum yield is obtained at a pH of 9.5 and at 1% oxygen or lower. The limit of detection is 5 nM sulfide, and the reaction product is reported to be stable. Real-time measurements of H2S under normoxic, physiological conditions are not possible.
Analysis of H2S evolution into headspace gas and subsequent gas chromatography has been used to measure both tissue and plasma H2S in the nanomolar range (18, 37). By carefully controlling pH, Levitt et al. (37) were able to separate free sulfide (H2S gas and HS−) from acid-labile sulfide. Although this method can be used to measure H2S in unadulterated biological samples, it is not capable of measuring H2S in real-time. In addition, these determinations are usually performed under anoxic or severely hypoxic conditions with an extended period of time required for evolution of gas into the headspace.
The polarographic (amperometric) electrode, originally developed by Jeroschewski and Steuckart (29) and modified by Kraus and Doeller (34), operates similar to the standard Clark O2 electrode and uses a relatively H2S-gas–specific membrane and polarizing voltage. This method can be used with otherwise unadulterated samples of tissue homogenates or pieces of tissue, with cultured cells, and even in an extracorporeal loop for continuously monitoring plasma H2S in unanesthetized animals (76). The polarographic electrode directly measures the concentration of dissolved H2S gas in real-time and the electrode has a detection limit of 10 to 20 nM H2S gas or ∼100–200 nM total sulfide (76). Because this method only measures H2S gas, total sulfide must be calculated from concomitant pH measurements. Polarographic electrodes also consume sulfide, albeit slowly. However, this can become problematic when measurements are made in a small volume in which there is an increased probability of lowering the total sulfide concentration, or in unstirred conditions in which electrode consumption can reduce sulfide concentration in the immediate area surrounding the tip of the electrode. Amperometric electrodes are generally pressure and temperature sensitive and prone to drift, necessitating frequent calibration. They can be used in the presence of oxygen and offer the particular advantage of being able to simultaneously compare oxygen and H2S concentrations (56).
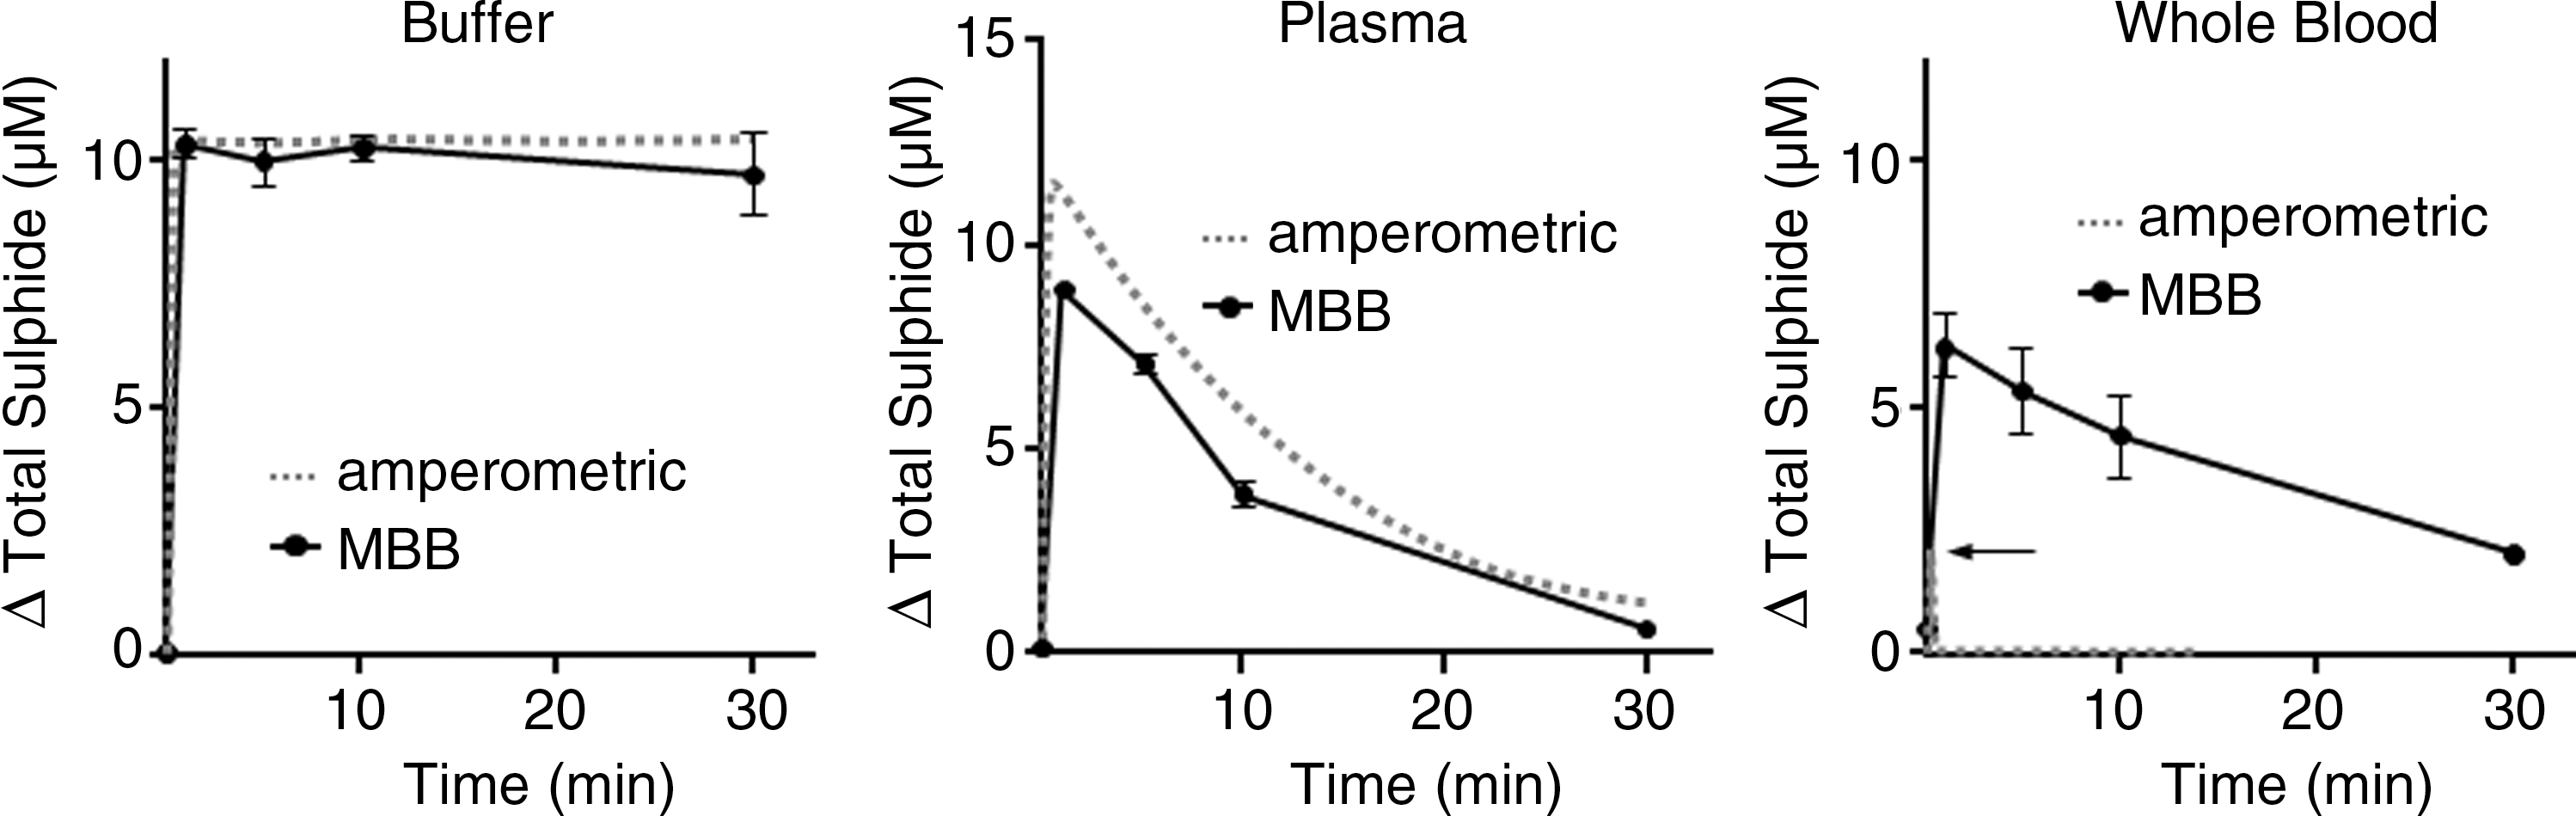
Wintner et al. (77) compared the amperometric response of the sensor to the MBB method. They observed that while both methods produced essentially identical responses when Na2S (10 μM final concentration) was added to either HEPES buffer or human plasma, the amperometric sensor only detected a brief, transient increase in total sulfide when Na2S was added to human whole blood, whereas the sulfide measured with the MBB method was more than three times that of the sensor and only slowly decreased over the following 30 minutes (Fig. 1). They attributed the differences between the two methods to the ability of the MBB method to detect a “reversible sulfide sink” in addition to free H2S. This sink was not due to H2S gas nor the common oxidation products of sulfide (sulfite, sulfate, or thiosulfate), and the authors proposed that it is a loosely bound moiety, still in the −2 oxidation state. They also suggested it was a form of a persulfide (RSnH) on the cysteine residues of one or more proteins. It is unlikely that this sulfide sink is either acid-labile sulfide or sulfane sulfur because neither of these appears to be released by H2S-doped whole blood (55). It remains to be determined whether or not this unknown sulfide can be released under physiological conditions and, if so, what mechanism is involved. If this is indeed a heretofore unidentified sulfide moiety it may help explain how the effects of exogenously administered H2S persist long after the gas has disappeared.
Sulfide-sensitive fluorescent dyes, similar to the well-known ion-sensitive dyes such as the calcium reporter Fura-2 are currently being developed (43, 60). These have the potential to resolve many of the key questions regarding H2S signaling mechanisms and effector pathways. To date, however, they appear to lack the sensitivity to measure endogenous H2S at submicromolar levels and in real-time.
Sources of H2S
The two most common sources of H2S are the sulfide salts, sodium hydrogen sulfide (NaHS), and sodium sulfide (Na2S). These compounds are frequently and erroneously called H2S “donating compounds” and it has been reported that they slowly release H2S when dissolved (47). However, other studies (13, 39) have shown that when either Na2S or NaHS is dissolved, H2S is formed essentially as fast as crystal solvation. The major difference between the study of Muzzaffar et al. (47) and those of DeLeon et al. (13) and Li et al. (39) was that the former measured sulfide with the methylene blue technique, whereas the latter two studies measured H2S gas in real-time with polarographic electrodes. Calcium sulfide (CaS) has also been used as a H2S “donor” (41), but this does not appear to convey any advantage over the other sulfide salts and, although not measured, CaS presumably forms H2S upon solvation at the same rate as NaHS and Na2S. H2S gas can also be passed through distilled water or buffers but this is far less convenient and often considerably more hazardous (25).
A number of true H2S “donating” drugs are also available (5, 45, 55, 59). These reportedly have the advantage of a slower and more sustained release of H2S than the sulfide salts, and they can be combined with other drugs to achieve multiple therapeutic effects. Some of these drugs also require an enzymatic process to liberate H2S, which should enhance H2S delivery to the target cells; i.e., ACS6 release of H2S is approximately four times greater when incubated with endothelial cells than in buffer (47). Rarely has the release of H2S from these compounds been measured in real-time. Li et al. (39) reported a slow release of H2S from GYY4137 [morpholin-4-ium 4 methoxyphenyl(morpholino) phosphinodithioate] in buffer when measured with the polarographic electrode; however, the release of H2S by GYY4137 in blood was inexplicably measured with the methylene blue method and not with the polarographic electrode. This makes any direct comparison difficult.
pH
Dissolved H2S is a weak acid in equilibrium: H2S ↔ HS− + H+ ↔ S2− + H+. Only the first reaction is relevant for biological samples because the pKa1 is in the physiological range. The pKa2 for the second reaction is over 12, with some reports suggesting it is as high as 19 (25). For all practical purposes, S2− is insignificant. Both pKs vary with temperature and salinity; the effect of temperature on pKa1 can be estimated from the equation: pKa1=3.122+1132/T, where T is degrees Kelvin (52). This is not insignificant because the pKa1 changes from 6.98 at 20°C to 6.77 at 37°C. A 1 mM solution of NaHS or Na2S at pH 7.0 will have 490 μM dissolved H2S at 20°C and at 37°C the dissolved H2S will be 372 μM, 25% less. A 1 mM NaHS or Na2S solution at pH 7.4 will have 277 μM dissolved H2S at 20°C and at 37°C the dissolved H2S will be reduced by 30% to 191 μM. Thus, failure to correct for temperature can account for as much as a 30% error in estimating the amount of dissolved H2S under physiological conditions.
H2S-forming salts require protons from the solvent, and their solvation can have a substantial effect on the pH as it alkalinizes the solution. This can become especially problematic for solutions of Na2S in which solvation requires two protons to produce H2S; NaHS only requires one proton. Dombkowski et al. (15) and DeLeon et al. (13) have shown that the buffering capacity of many physiological buffers begins to fail around 1 mM sulfide. In Krebs–Henseleit buffer, commonly used in mammalian preparations, 1 mM Na2S increases the pH by nearly one-half unit and 10 mM Na2S increases it by over 2 pH units. As expected, this is considerably greater than that produced by NaHS for which a 10 mM solution increases the pH by a little over 0.5 pH units. It is not always clear whether studies that employ millimolar concentrations of sulfide salts titrate their solutions prior to use.
Oxygen
It is well known that H2S is oxidized in solution especially in the presence of metal catalysts (9) and biological tissue (57) (discussed in a later section). Spontaneous H2S oxidation is also pH dependent (8). As shown in Fig. 2, the rate of spontaneous H2S oxidation increases nearly tenfold over the range of commonly encountered physiological pH (6.5–8.0). Since it appears that much of this spontaneous oxidation of H2S is due to metal catalysts, especially ferric iron, that exist as impurities in the water, removing them with a chelator such as diethylenetriaminepentaacetic acid (DTPA) will greatly delay spontaneous oxidation. Hughes et al. (25) found that in the absence of DTPA, HS− absorbance was halved in 3 hours, which argues against the rapid oxidation suggested by Wintner et al. (77); whereas, in the presence of 100 μM DTPA it did not change over this period. Of course ion chelation can also remove essential minerals when done in the presence of tissues. However, volatilization of H2S, as described in the following section, appears to contribute far more to spontaneous H2S loss than oxidation in a variety of biological experiments.

Volatilization
Because H2S is a gas, the concentration of H2S in solution can also be affected by volatilization, and the rate of H2S evolving from solution is proportional to the surface area at the air–liquid interface. This is especially problematic in most, if not all physiological experiments because the tissues require continuous oxygenation and carbon dioxide must be eliminated. In tissue culture this is usually accomplished with a large surface/volume ratio and a monolayer of cells. With isolated organs or tissues, additional gassing is required and this often entails bubbling the tissue with some mixture of air, oxygen, and carbon dioxide, or circulating the buffer through an oxygenator. Control studies on the rate of H2S volatilization as a function of the oxygenation process should be used to correct for H2S loss. While H2S volatilization is obvious to anybody working in this field, the impact of volatilization on the concentration of H2S in biological experiments seems to have been overlooked.
To examine the potential for H2S volatilization under typical laboratory conditions, we (13) measured the concentration of H2S gas in buffer in real-time with a polarographic electrode under three experimental conditions commonly used in cardiovascular studies, tissue culture well plates in which gases exchange passively across the well surface, muscle myograph baths that are bubbled via a glass frit, and the Langendorff perfused heart apparatus in which buffer drains down a long glass column that is gassed.
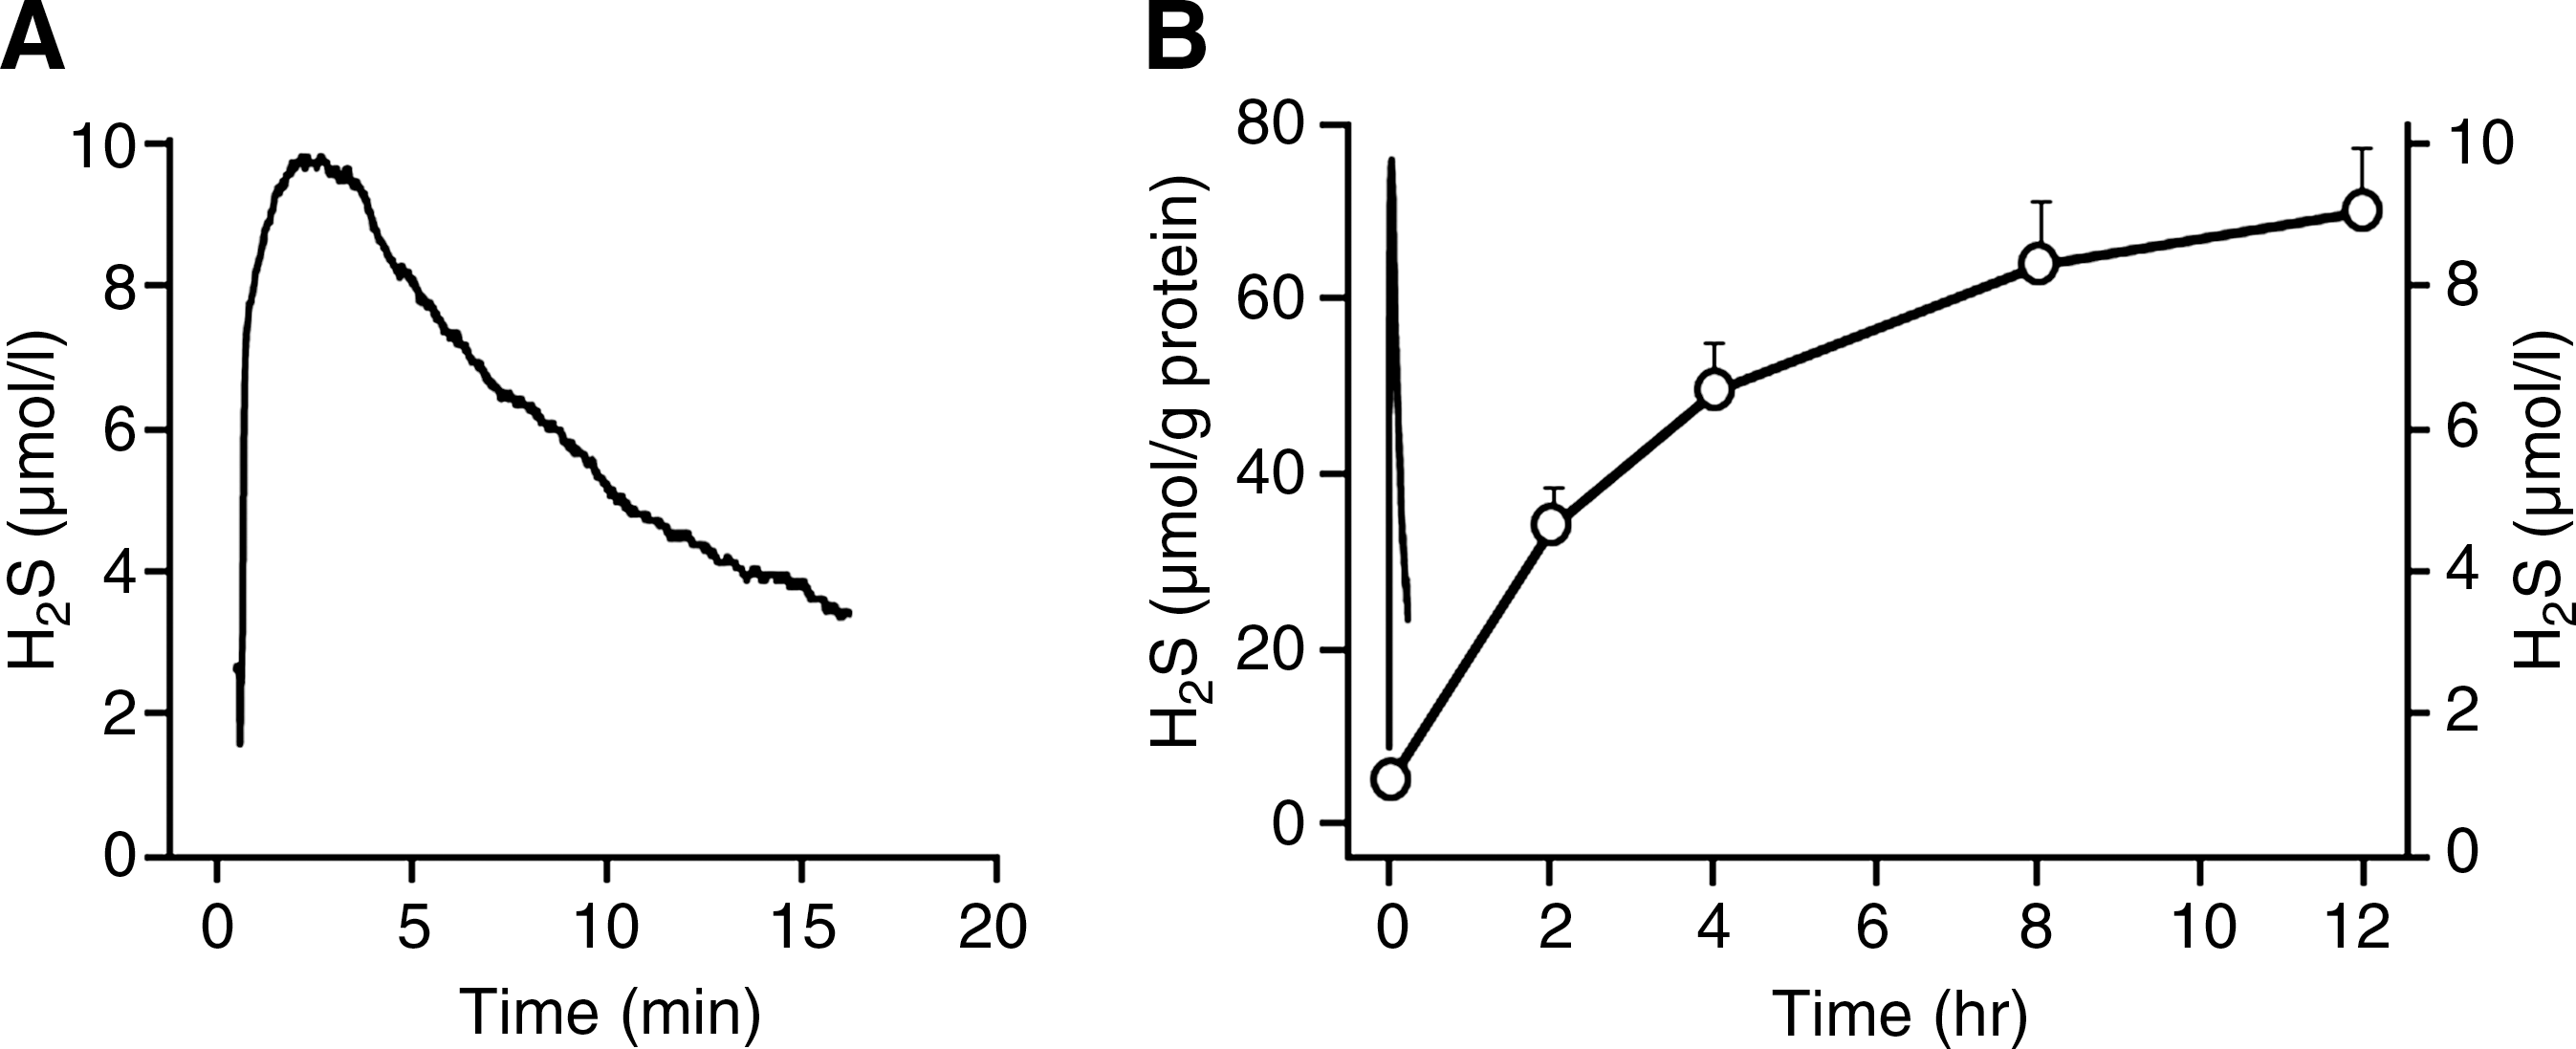
As shown in Fig. 3A, there is an exponential loss of H2S from 24-well tissue culture plates containing a physiological buffer. The rate constant (k) for H2S volatilization is 0.13 min−1 and the half time (t½, the time for H2S concentration to be halved) is 5 minutes (t½=0.693/k). Because this process is passive, the rate constant and half time are independent of the initial H2S concentration. This means that 13% of the H2S remaining in the well is lost every minute and after 30 minutes only 2% of the initial H2S will be left in the well. Thus, volatilization becomes problematic when exposing cells to H2S. Lee et al. (36) exposed THP-1 and U118 cells to 10 μM NaHS in 24-well plates in 1 mL of Dulbecco's modified Eagle medium nutrient mixture F12 containing 5% fetal bovine serum and hydroxylamine (to inhibit endogenous H2S synthesis). They measured H2S in the cells by the direct methylene blue method and reported continual H2S accumulation for 12 hours (Fig. 3B). According to the rate constants for H2S volatilization from our study, the predicted concentration of H2S after 12 hours should be around 4×10−43 μM. Although the methylene blue method liberates acid-labile as well as free sulfide, the amount of acid-labile sulfide is not expected to accumulate during the duration of the experiment. This raises the question of what is being measured with the methylene blue method. Clearly, Lee et al. (36) show something is increasing, as have numerous other experiments (reviewed by Olson [55]). It is doubtful if this is either endogenous or exogenous H2S. It remains to be determined if there is a different endogenous sulfide that is being measured with the methylene blue method, or if the molecule(s) being measured is some as yet unidentified storage form of H2S. It is also possible that this is merely an artifact.
H2S is lost from bubbled muscle myographs (k<0.2 min−1 and t½ <4 min) three times faster than from unbubbled myographs and also faster than from the 24-well tissue culture plates (Fig. 4A) (13). Presumably this is due to the additional air/liquid surface area from the fine bubbles. The rate of H2S lost from myographs bubbled with 100% pure oxygen was slightly but significantly slower than when bubbled with 100% nitrogen. This shows that H2S oxidation is insignificant within the typical 30-minute time frame of many experiments. It also suggests that there may be some, as yet unidentified, chemical or physical interaction between H2S and N2 or at the air–bubble interface. Because the response time of isolated blood vessels is typically 1–5 minutes, and H2S is added in 10- to 20-minute intervals in cumulative dose–response experiments, there is little chance that the vessels will ever experience the desired H2S concentration. In fact, when H2S is added to the myograph and monitored with the polarographic electrode, the peak H2S concentration measured is typically <90% of the predicted concentration. In a dose–response study on mouse aortas bubbled with 95% O2/5% CO2, Al-Magableh and Hart (2) only measured 91 μM H2S with a polarographic H2S sensor in myographs after cumulative additions of 10−6, 10−5, 10−4, and 10−3 M NaHS. They hypothesized that this discrepancy was due to differences between H2S measured by the sensor and the actual dissolved NaHS. However, it is likely that volatilization was a major factor in their observations.

H2S volatilization from the Langendorff perfused heart apparatus is the fastest (Fig. 4B). When injected into the pump effluent, H2S concentration transiently increases. However, in the time for one complete circulation (1 minute in this preparation) H2S concentration had fallen to <20% of the desired concentration, at 2 minutes it was <10%, and it continued to decline exponentially thereafter. Half-times for the transient spike were <6 seconds and the remaining H2S disappeared with half times of <3 minutes.
Rapid volatilization of H2S creates several problems in designing and interpreting experiments. First, it is evident that the desired H2S concentration is never attained because the outgassing process occurs immediately upon sample addition. Second, the rapid fall in H2S concentrations that results from bubbling renders H2S dose–response determinations rough estimates at best. Third, where the effects of H2S are demonstrated for hours (or days) after a single treatment it is not clear if this is an actual response to H2S. Furthermore, it is also unclear if a metabolite or decomposition product of H2S produces the observed response or if H2S initiates a long-lived signal cascade. Nevertheless, it seems likely that many of the dose- dependent effects of H2S and dose–response curves that have been published in the literature need to be revisited as they most likely overestimate the actual tissue exposure. These studies also help explain, in part, why the concentrations of exogenous H2S needed to produce biological responses are considerably greater than recent estimates of endogenous H2S in blood or tissue.
H2S as an oxidant/reductant
H2S is often regarded as a strong antioxidant (38, 62). Exogenous H2S has been shown to reduce hypochlorous acid (48) and is likely to reduce peroxynitrite (75), superoxide (7), and hydrogen peroxide (19), and H2S has been proposed to effectively prevent oxidant injury in the brain (reviewed by Kimura [33]). While there is little doubt that H2S is a reductant, how effective it is intracellularly remains to be determined. In order to demonstrate antioxidant activity in biological preparations the concentrations of H2S typically are (or exceed) 100 μM in vitro (cf. 80). In vivo, an intraperitoneal injection of 5 mg/kg NaHS (20) and assuming distribution throughout the entire body water, will raise intracellular H2S to ∼140 μM. It remains to be determined if endogenous H2S is sufficiently concentrated in cells to have a similar physiological effect. Furthermore, Kabil and Banerjee (30) point out that H2S is a relatively weak reducing agent, especially when compared with other intracellular thiols such as glutathione, and Carballal et al. (6) suggest that the protective effects H2S cannot be completely accounted for by direct reactions with oxidants.
H2S has also been suggested to increase oxidative activity in cells by inhibiting oxidative phosphorylation and thus favoring superoxide formation. For instance, Eghbal et al. (16) showed that exogenous H2S (200–400 μM) dose-dependently stimulated the formation of reactive oxygen species (ROS) in isolated hepatocytes. This concentration is considerably greater than that required to inhibit oxidative phosphorylation, which is usually reported to be ∼20–40 μM (3, 11). It will be necessary to determine if these concentrations are approached under physiological conditions. It is also important to note that the H2S concentrations used in most experiments are considerably greater than 40 μM and these may either provide excessive reductant or superoxide to the cellular milieu making it difficult to separate H2S-specific effects from general metabolic depression or pharmacological reducing and/or antioxidant actions.
This also raises an interesting conundrum, if endogenous H2S production increases to the point of inhibiting oxidative phosphorylation and stimulating ROS production, can these ROS then oxidize the H2S? Could this be a cellular feedback mechanism for limiting H2S concentration?
Alternative “forms” of H2S
In addition to dissolved H2S and HS−, reduced sulfide can be associated with iron-sulfur clusters in an acid-labile form and as persulfides, i.e., sulfane sulfur (RS-S). The term acid-labile is derived from the observation that sulfide can be released from these clusters when pH falls below 5.4 (27). Sulfane sulfur appears to be the only product of the tandem enzyme pathway involving the enzymes cysteine aminotransferase and 3-mercaptopyruvate sulfur transferase (3-MST) (30) and has been proposed to be the major pathway for sulfane sulfur (and potentially H2S production) by the brain (27, 64). H2S can be liberated from 3-MST–sulfane sulfur by the ubiquitous reductant, thioredoxin, and by dihydrolipoic acid, both present in cells (46). Both acid-labile and sulfane sulfur have been suggested to serve as a relatively stable form of H2S for intracellular storage and as a site from which H2S can be readily mobilized. These possibilities are considered in the following sections.
H2S biology
H2S in blood
At present there is no consensus regarding the concentration of H2S in either blood or tissues, and this must be resolved in order to differentiate between physiological and toxicological effects of exogenous H2S. The overwhelming majority of H2S concentrations reported in blood of vertebrates since 2000 are in the range of 20–40 μM, and there are at least a half dozen reports of plasma H2S in excess of 100 μM. Arguments against plasma H2S in the micromolar range have been summarized in several recent reviews (53, 55) and include the following. First, high blood H2S concentrations are generally associated with methods that were not developed for use with biological tissue, most often methylene blue method and sulfide ISEs. A good example of this is the revision of plasma H2S concentration in mice which the original study (78) reported to be 40 μM H2S in plasma when measured with the methylene blue method. This was subsequently revised down to 1.6 μM by the same group using the MBB method (63). However, even micromolar concentrations are not typically observed when measuring H2S with polarographic electrodes or with some of the more modern methods employing gas chromatography and HPLC. Whitfield et al. (76) observed barely to nondetectable levels of H2S in blood plasma from a variety of animals using the polarographic electrode and Levitt et al. (37) reported 0.07 μM H2S in mouse blood using HPLC analysis of headspace gas. Novel methods or refinements of existing ones will be needed to measure H2S in blood or plasma, if it exists at all. Second, there is no odor of H2S in plasma even though the human nose can smell 1 μM in buffer (Table 2). In fact, 45 μM H2S in plasma would be equivalent to breathing 100 ppm H2S (Table 2) and this should cause eye and lung irritation and even begin to paralyze the olfactory system. Pulmonary edema appears at 100 μM H2S. Clearly, these concentrations are unphysiological. Third, H2S readily equilibrates across respiratory surfaces and, if it existed in plasma, should be readily exhaled. Rapid appearance of H2S during administration of Na2S (IK-1001) has been observed in exhaled air from rats (26) and humans (71). As shown in Fig. 5, H2S began to appear in exhaled air within 5 seconds after initiation of intravenous H2S infusion in rats and H2S concentration oscillated with each breath. When infusion was stopped H2S concentration began to fall by the second breath and was halved within 3 seconds. Similar results were observed when a bolus of H2S was injected in humans, although with a longer circulation time and longer onset and recovery periods. Toombs et al. (71) also observed that H2S in exhaled air from humans prior to Na2S injection was some 20 ppb greater than room air (6 ppb) indicative of continuous H2S excretion. If this is the case, and with efficient transpulmonary H2S exchange, this would imply that plasma H2S is ∼6 nM, clearly well below the resolution of blood H2S assays. Fourth, with the assumption that H2S equilibrates across respiratory membranes, Furne et al. (18) calculated that there is not enough sulfur in the body to sustain H2S production for even 24 hours. Fifth, H2S is rapidly removed from the circulation by tissues. Norris et al. (51) have shown that the buffer-perfused rat liver removes nearly 97% H2S at a perfusate concentration of 150 μM H2S and 50% clearance at 300 μM H2S. Sixth, H2S has been shown to be rapidly consumed by tissues in the presence of oxygen (Fig. 6A) (35, 56, 57). Thus, it is unlikely that there is even enough H2S escaping from normoxic tissue to contribute to plasma levels. If H2S does exist in the plasma, especially at levels sufficient to be considered physiologically relevant, which seems doubtful, there has yet to be a method that is sensitive enough to detect it.

This table shows that the majority of plasma and tissue H2S concentrations reported in the literature (20–300 μM) would range from noxious to fatal and all would be malodorous.
All except equivalent total plasma sulfide column modified from Guidotti (22). Equivalent plasma sulfide is the theoretical sulfide concentration in plasma calculated after Whitfield et al. (76) (supplemental information) with the following assumptions: 1) H2S freely equilibrates across the alveolar membranes (26, 71), 2) Henry's Law constant for H2S at 37°C and 140 mM NaCl is 0.0649 M·atm−1 (12), 3) 20% of total sulfide exists as H2S gas (52), and 4) there is no H2S metabolism in blood or tissues. Table modified from Olson (55), with permission.
It has been suggested that H2S may be transported in the blood either as acid-labile sulfide, sulfane sulfur, or some other reversible “sink” (77), and Levitt et al. (37) reported ∼1 μmol acid-labile sulfide in mouse blood. However, blood pH must fall below 5.4 to release H2S from an acid-labile pool (27), which is highly unlikely. Furthermore, because blood is an oxidizing environment (50), it is difficult to imagine reducing conditions sufficient to release sulfide from a persulfide. Experiments designed to examine these possibilities have not supported either sulfur store. Acidifying mouse blood below 5.5 with trichloroacetic acid only produced 2.5 μM/kg whole blood measured with gas chromatography of headspace gas (37) and addition of 1 or 10 mM dithiothreitol to trout blood did not generate H2S either in fresh blood or from blood primed with 10–100 μM H2S (55). There are other possibilities as well; H2S may be conveyed in the plasma in some other as yet unidentified form as proposed by Wintner et al. (77), although there is no evidence for this at present. It is also possible that H2S is produced in blood. Searcy and Lee (61) demonstrated low levels of H2S production by human red blood cells upon addition of elemental sulfur (S8), but it is doubtful if this has physiological significance. Both cystathionine β-synthase (CBS) and cystathionine γ-lyase (CSE) have recently been shown to be secreted by the liver and endothelial cells, circulate in an active form in human plasma, and are able to generate H2S from cysteine or homocysteine plus cysteine (4). These authors (4) suggested that local H2S production could protect the endothelium from elevated homocysteine. It remains to be determined if these plasma enzymes could also contribute to plasma H2S.
H2S in tissue
The vast majority of studies reporting the concentration of H2S in tissues, or the rate of H2S production by tissues, have also employed either the methylene blue method or ISEs and have been performed under relatively unphysiological conditions. Arguments can be made against these findings on both experimental and theoretical grounds (18, 37, 55).
First, there is the potential that the acidic conditions required for the methylene blue assay generate additional sulfide from acid-labile stores, as described for blood. In fact, one recent study suggested that acid-labile stores in a variety of mouse issues may be anywhere from 10,000 to 40,000 times the concentration of free H2S (37). Second, these experiments are routinely conducted under anoxic or very hypoxic conditions. This not only prevents the rapid and effective oxidation that normally occurs under physiological conditions but also increases the reducing potential of the milieu and can potentially liberate sulfane sulfur. Third, these assays are generally conducted with unphysiologically high cysteine concentrations (typically 1 or 10 mM). This excess cysteine could artificially increase the rate of H2S production by shuttling sulfur metabolism through normally minor metabolic pathways (66). Fourth, other important substrates for H2S production, such as homocysteine, are not typically provided in the reaction mixture and, under physiological conditions, these may be more important than, or as necessary as, cysteine for H2S production (Fig. 7). For example, the condensation of cysteine and homocysteine may account for 25%–70% of the H2S generated under more physiological conditions (10, 30, 65). Failure to have sufficient homocysteine in the medium can also bias interpretation of the enzymes involved in H2S biosynthesis. H2S generation from cysteine is primarily catalyzed by CSE, whereas H2S production from the condensation of cysteine and homocysteine is accomplished by CBS. In a recent study, Kabil et al. (31) further demonstrated the effect of substrate concentration on H2S production by liver; at saturating cysteine and homocysteine concentrations (20 mM) H2S production was similar for CBS and CSE, whereas at physiological levels of substrate and enzymes, CSE activity accounted for 97% of the H2S produced. Furthermore, CBS activity can be regulated by a variety of factors that are not included in the medium such as S-adenosylmethionine, a well-known allosteric regulator of CBS. This can also bias both the rate and pathways of H2S biosynthesis. It should also be noted that these enzymatic studies are generally performed under anoxic conditions (cf. 31). Thus, while providing valuable information on enzymatic activity and important substrates for H2S production, they do not provide information on tissue H2S production under truly physiological conditions. Clearly additional studies that replicate the cellular environment are necessary to both determine the rate of H2S biosynthesis as well as the enzymes involved. Fifth, compounds frequently employed to inhibit either CSE (propargyl glycine and β-cyanoalanine), CBS (aminooxyacetate), or both (hydroxylamine) and thus used to distinguish the rate and/or pathway of H2S production are not specific for these enzymes and they are often poorly absorbed by tissues (67). Sixth, although limited in number, a number of studies have suggested that free H2S in tissues is under 50 nM (18, 37) or undetectable (73). Some of the potential sources for error in H2S chemistry and blood/tissue measurements are summarized in Fig. 8.


Tissue H2S metabolism
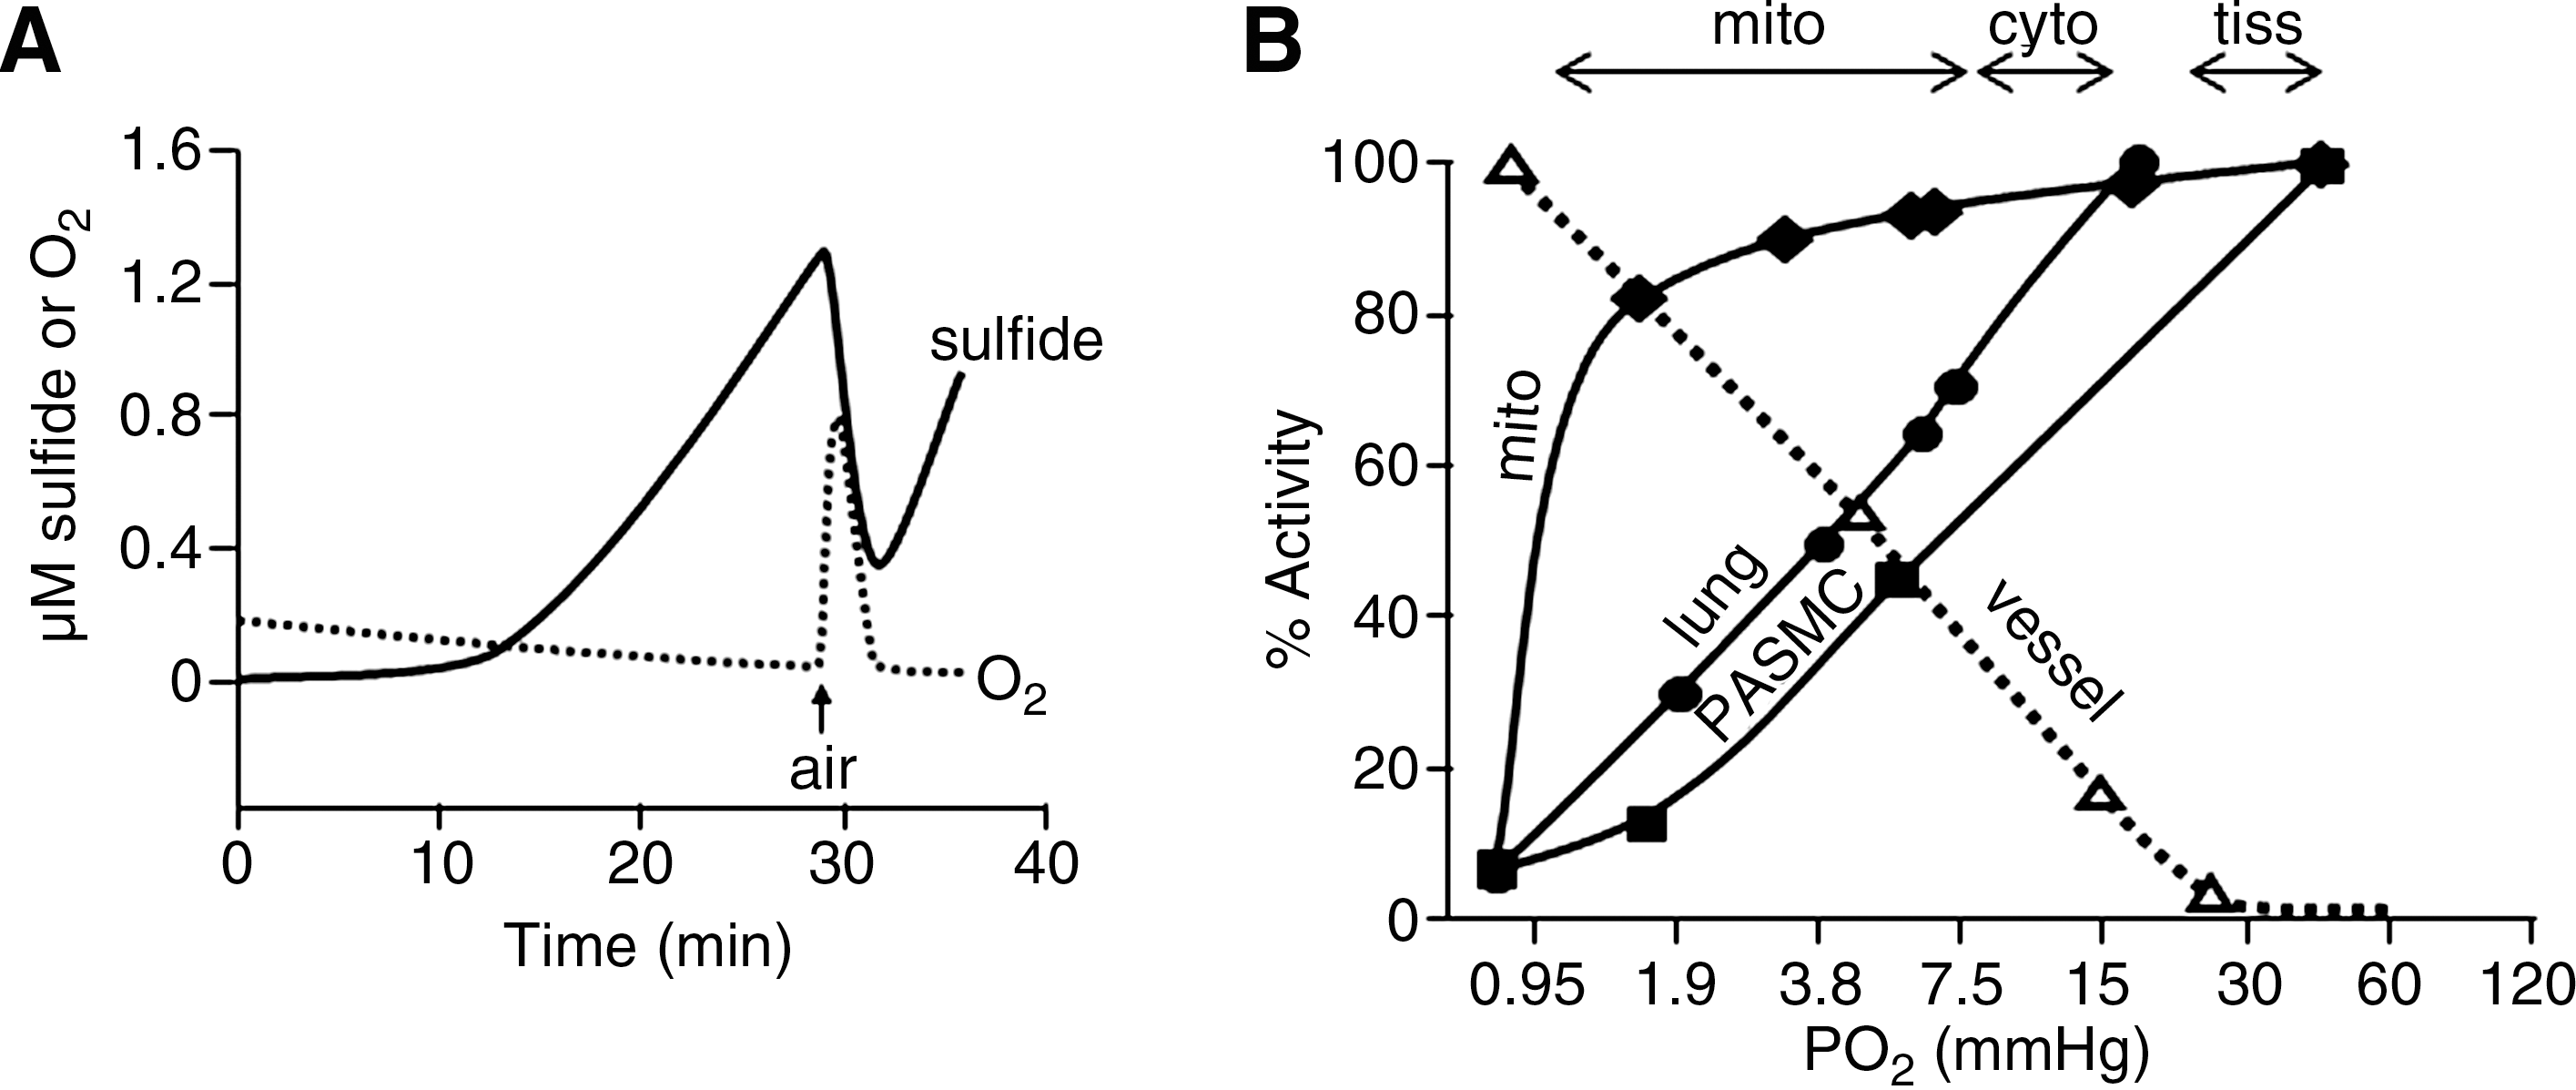
Tissue H2S oxidation also argues against high blood and tissue H2S concentrations. Essentially all measurements of H2S production using the methylene blue, MBB, headspace gas methods, or S2− ISEs have been performed in closed containers under anoxic or very hypoxic conditions. A number of studies have noted that H2S production is increased or enhanced under hypoxic or anoxic conditions (14, 18) or that oxygen (O2) consumption is increased by H2S (21, 35). In fact, when measuring H2S in headspace gas, Furne et al. (21) not only observed very low concentrations of H2S in tissues when measured under hypoxic conditions, but they also observed that there was net consumption of H2S by tissues in the presence of O2. To my knowledge only one study has simultaneously measured H2S and O2 concentrations in tissues in real-time, and this study (57) demonstrated that H2S is consumed by tissues in the presence of oxygen and H2S production is only observed under anoxic or severely hypoxic conditions (Fig. 6A). In fact, even exogenous H2S is quickly and efficiently consumed by tissues at oxygen partial pressures (Po2) >10 mm Hg (Fig. 6B) (57). By comparison, water or tissue samples in equilibrium with room air typically have a Po2 >140 mm Hg. Furthermore, tissue hypoxia is expected to increase the reducing conditions in the cell; this could liberate H2S from persulfides (27), or the acidosis that routinely accompanies hypoxia could release acid-labile sulfur.
H2S in tissue and H2S infusion, a quantitative approach
It is instructive to examine concentration in tissues and relative infusion rates as both a self-check of reliability and as an indicator of tissue metabolic capacity. Several constants and/or assumptions are useful: 1 mol of H2S is equivalent to 32 g/L of sulfur, cells are typically 10%–20% protein and 70% water, plasma volume of most mammals is ∼4% of body weight (bwt), extracellular fluid volume is 20% of bwt, and total body water is 60% of bwt. A few simple calculations allow the reader (or investigator) to determine the feasibility (and credibility) of reported values.
H2S (or sulfide) is often measured in tissue or cells in culture and expressed as moles or weight of H2S or sulfide per gram protein. Assuming cells are 15% protein, 70% water (cytosol), and 1 g of water equals 1 mL, then every gram of cell protein is equivalent to 4.7 mL of water (70/15=4.66). Therefore, 1 μmol H2S/g protein=1 μmol/4.7 g water. Normalizing to 1 L of cytosol, 1 μmol H2S/g protein=214 μM (6.85 mg/L sulfur) in cytosol. When H2S is reported in micromoles per milligram of protein, 1 μmol of H2S/mg protein=214 mM H2S in cytosol. Tissue H2S concentrations based on a protein range from 6 nmol/L cytosol in liver (0.03 μmol/kg protein) (37) to tens of millimoles per liter of cytosol (36). Looking at this from a different perspective, if 40 μmol/L H2S is toxic to cells, this is equivalent to 0.19 μmol/g protein (0.19 nmol/mg protein) or 6.1 μg sulfur/g protein (6.1 ng sulfur/mg protein). Lee et al. (36) measured H2S in cultured U118 cells exposed to a single treatment of 10 μM H2S and 12 hours later measured 71 μmol/g protein H2S (Fig. 3). Based on the preceding calculations, this is equivalent to 15,123 μM H2S in the cytosol. Space does not permit compilation of other values from the literature and the reader is encouraged to evaluate these with the above calculations in mind.
H2S is also injected as a single bolus or infused over extended periods and the dose is expressed per kilogram of body weight. If 1 μmol/kg bwt H2S was injected, the H2S concentration would be 25 μmol/L if it was retained in the plasma, 5 μmol if retained in the extracellular compartment, and 1.7 μmol/L if distributed throughout body water. These values would increase to 1500, 300, and 102 μmol/L if the H2S was infused for 1 hour and retained within the respective compartment. Bolus injections are typically administered in as small a volume as practicable to minimize volume disturbances and the concentration of H2S is often quite high; e.g., Wintner et al. (77) injected 70 mM Na2S in 10 seconds. These concentrations are undoubtedly toxic until the H2S is diluted and metabolized.
H2S as a signaling molecule
The development of mutant mice lacking CSE (CSE−/−) and subsequent observations that plasma H2S concentration and aortic and heart H2S production in these mice was less than that of the wild-type mice and that the CSE−/− mutant developed hypertension more frequently compared to the wild type led the authors to conclude that “These findings provide direct evidence H2S that is a physiologic vasodilator and regulator of blood pressure” (78). However, this conclusion seems a bit premature. First, as already described, plasma H2S concentrations measured in this study were unrealistically high (40, 32, and 18 μmol/L for wild type, CSE−/+, and CSE−/−, respectively). Second, Ishii et al. (28) also developed CSE−/− mutant mice that exhibited hypercystathioninemia and hyperhomocysteinemia but these mice remained normotensive. Third, the only physiologically relevant stimulus that has thus far been demonstrated to affect H2S production or concentration in tissues is the inverse correlation between H2S and Po2 described above and this mechanism hardly seems applicable in the study by Yang et al. (78).
The inverse correlation between Po2 and H2S, the similarity of tissue responses to H2S and hypoxia, and the ability of inhibitors of H2S synthesis to inhibit hypoxic responses and of sulfur donors to augment it, have led to the hypothesis that H2S production/metabolism functions as an oxygen sensor in vascular and nonvascular smooth muscle and in chemoreceptor cells (reviewed by Olson and Whitfield [56]). Recent studies of the mammalian carotid body (40, 58, 69, 70) have provided additional support for this mechanism. However, this too has been called into question. Haouzi et al. (23) injected rats with sodium nitrite to produce methemoglobin in blood, which is a well-known scavenger of H2S. They observed that while intravenous injection of H2S stimulated ventilation in control rats it did not stimulate ventilation in nitrite-treated rats, thus confirming the H2S-scavenging effect of methemoglobin They also observed that hypoxic hyperventilation was unaffected by nitrite injection and concluded that H2S was not involved in H2S sensing by the carotid body. Key to this conclusion is the ability of methemoglobin to create a sink for H2S in blood that would prevent buildup of H2S in the glomus cells of the carotid body. Olson (54) argued against this reasoning based on observations that plasma H2S is already so low that methemoglobin would not be expected to significantly change the gradient of H2S between the carotid body and blood, and therefore methemoglobin would not be expected to affect intracellular H2S signaling. Obviously, this is another conundrum of H2S biology remaining to be resolved.
It is generally assumed that the metabolic fate of H2S is mitochondrial oxidation, first to thiosulfate and then sulfate. Thus, once formed, H2S proceeds inexorably to its fate. However, a recent study by Mikami et al. (46) suggested that this might not be always the case. They found that thiosulfate formed from H2S oxidation in the mitochondria could be reduced by mitochondrial 3-MST or rhodanase in the presence of physiological levels of dihydrolipoic acid (the reduced form of lipoic acid), thereby again forming H2S. This is an intriguing possibility because it allows recycling of H2S without consuming additional cysteine or other sulfur-donating biomolecules. This may have special significance in oxygen sensing in which the proposed increase in H2S as a result of decreased mitochondrial oxidation (56) may be augmented by H2S production from preformed thiosulfate, especially since the latter would also be expected to be increased by the hypoxia-driven increased reducing conditions in the cell.
Footnotes
Acknowledgments
The author's work has been supported by National Science Foundation Grants IBN 0235223, IOS 0641436, and IOS 1051627.