




Abstract
Introduction
G
We implicate the elevated O2 -:H2O2 ratio as a tumor cell proliferation signal in glioma-propagating cell self-renewal and growth. Depletion of this ratio confers sensitivity to apoptotic triggers and extends survival in an orthotopic mouse model. The reactive oxygen species (ROS) Index, a measure of normalized O2 -:H2O2 ratio, provides quantification of O2 -:H2O2-mediated chemosensitivity, an advancement in a previously qualitative field. Importantly, glioma patients with a reduced ROS Index correlate with longer survival and the Proneural molecular classification, a feature frequently associated with tumors of better prognosis. These data emphasize the feasibility of manipulating the O2 -:H2O2 ratio as a therapeutic strategy.
Reactive oxygen species (ROS) is implicated in signaling mechanisms of normal and cancer cells, and in oxidative damage-induced cell death. Although low levels of ROS regulate cellular signaling and normal cell proliferation, recent studies have indicated that tumor cells exhibit a persistent elevation of ROS (specifically the superoxide anion [O2 −]) and show prosurvival advantage via a redox-based mechanism (52). Such opposing roles of ROS seem paradoxical, yet detailed understanding of the roles of individual ROS molecules is lacking. Little is known about the redox status in cancer stem-like cells that initiate and sustain tumors in mouse models, and are purportedly enriched in human derived stem-like cultures (20). Recently, Naka et al. showed that the ability of leukemia-initiating cells (LICs) to cause disease was significantly decreased by FoxO3a deficiency, a critical mediator of hematopoietic stem cell resistance to oxidative stress (43, 65). Further, the TGFβ-PI3K/AKT signaling axis was implicated, illustrating for the first time how LICs utilize redox-based mechanisms to feed into well-established oncogenic pathways. In addition, work by Diehn and colleagues described ROS as a critical mediator of radioresistance in breast cancer stem cells (CSCs), defined by CD44+ CD24−/low Lin−(16). Specifically, the authors showed that reduced ROS, measured as hydrogen peroxide (H2O2), conferred breast CSCs their prosurvival advantage. Further elevation of ROS rendered them susceptible to death by oxidative damage.
The redox status of a cell can have dual effects—effete tumor cell removal by oxidative stress, or survival via a slight prooxidant microenvironment that does not trigger oxidative stress (50). Both seemingly diverse mechanisms have a central theme; redox levels control cell fate, and the avoidance of apoptosis can be harnessed by cancer cells to transform. Clement and Pervaiz previously implicated specifically O2 − and H2O2, the main species in the cytosolic milieu, as central modulators of chemoresistance (11). These two species are interconvertible via the superoxide dismutase 2 (SOD2) enzyme, a potent source of ROS generation in the mitochondrial electron transport chain (26). An elevated O2 −:H2O2 ratio confers tumor cells their prosurvival advantage, while a reduced ratio triggers apoptosis (52). By inference, these findings present the exciting notion that cancer cells can be eradicated simply by depleting the O2 −:H2O2 ratio, a process termed as reductive stress (11). Intriguingly, a most recent study implicated an elevated O2 −:H2O2 ratio as the mechanism effecting angiopoietin-4-mediated tumor cell anoikis resistance in several cancer types (73). Collectively, these findings suggest that the O2 −:H2O2 ratio may play a more-significant central modulator role in mediating the tumor phenotype.
We ask if heterogeneity in GPC chemoresistance correlates with differences in the O2 −:H2O2 ratio. We hypothesize that an elevated O2 −:H2O2 ratio confers GPC prosurvival advantage against chemotherapeutic agents, while the inverse triggers sensitivity, thus suggesting a therapeutic strategy based on the redox status. We formulate a quantitative and reproducible ROS Index to reflect this ratio and predict the propensity of GPCs to undergo drug-induced apoptosis. Importantly, we ask if the ROS Index has a significant impact in patient disease progression and clinical outcome, and identify patient cohorts showing patterns of association with the ROS Index. This represents a novel effort to translate the ROS Index in a clinical setting; further, our data highlight the molecular heterogeneity of the disease and implicate the ROS resistance gene signature as a novel prognostic indicator.
Results
Chemoresistance correlates with increased O2 −:H2O2 ratio
GPCs demonstrate greater resistance to common chemotherapeutic agents than non-GPCs, likely due to the overexpression of genes such as the DNA repair enzyme (O(6)-methyl guanine–DNA methyltransferase [MGMT]) and antiapoptosis genes such as B-cell lymphoma 2 (BCL-2), B-cell lymphoma-extra large (BCL-XL), and survivin (18, 37). We chose complementarity determinant 133 (CD133) as the initial marker to focus on as it defines tumor-initiating capacity in a subset of GBM GPCs (3). Further, the molecular profile of our CD133(+) cell fractions correlated with stemness gene sets identified in GPCs (3) and hematopoietic stem cells (30) (Supplementary Fig. S1A; Supplementary Data are available online at

To determine the O2 − and H2O2 levels, we utilized a well-established flow cytometry-based method with MitoSOX™ Red or Amplex® Red dyes, respectively (70, 74). This method is necessary to interrogate individual ROS levels in independent fractions of a heterogeneous cell mix. We determined that the flow-based method has a similar sensitivity to the conventional lucigenin-based method (Supplementary Fig. S2A–D). We observed that in NNI-4, 8, and 11, CD133(+) cells exhibited ∼10%–20% higher O2 − levels than CD133(−) cells (Fig. 1C, top panel). Again, the trend was reversed in NNI-1 cells, where the CD133(−) O2 − level was ∼10% higher than that of the CD133(+) fraction. In contrast, the H2O2 levels were ∼10%–20% lower in the CD133(+) fractions of NNI-4, 8, and 11 compared to their respective CD133(−) fractions; and CD133(−) of NNI-1 compared to its CD133(+) fraction (Fig. 1C, bottom panel). Figure 1D reflects an elevated O2 −:H2O2 ratio in the more-resistant CD133(+) cells of NNI-4, 8, and 11, and CD133(−) cells of NNI-1, while a reduced ratio correlated with the more-sensitive CD133(−) cells of NNI-4, 8, and 11, and CD133(+) cells of NNI-1, consistent with our hypothesis that an elevated O2 −:H2O2 ratio confers prosurvival advantage and resistance to chemotherapeutic agents.
Pharmacological manipulation of redox status results in either sensitivity to drug-induced apoptosis (reduced O2 −:H2O2) or resistance (elevated O2 −:H2O2)
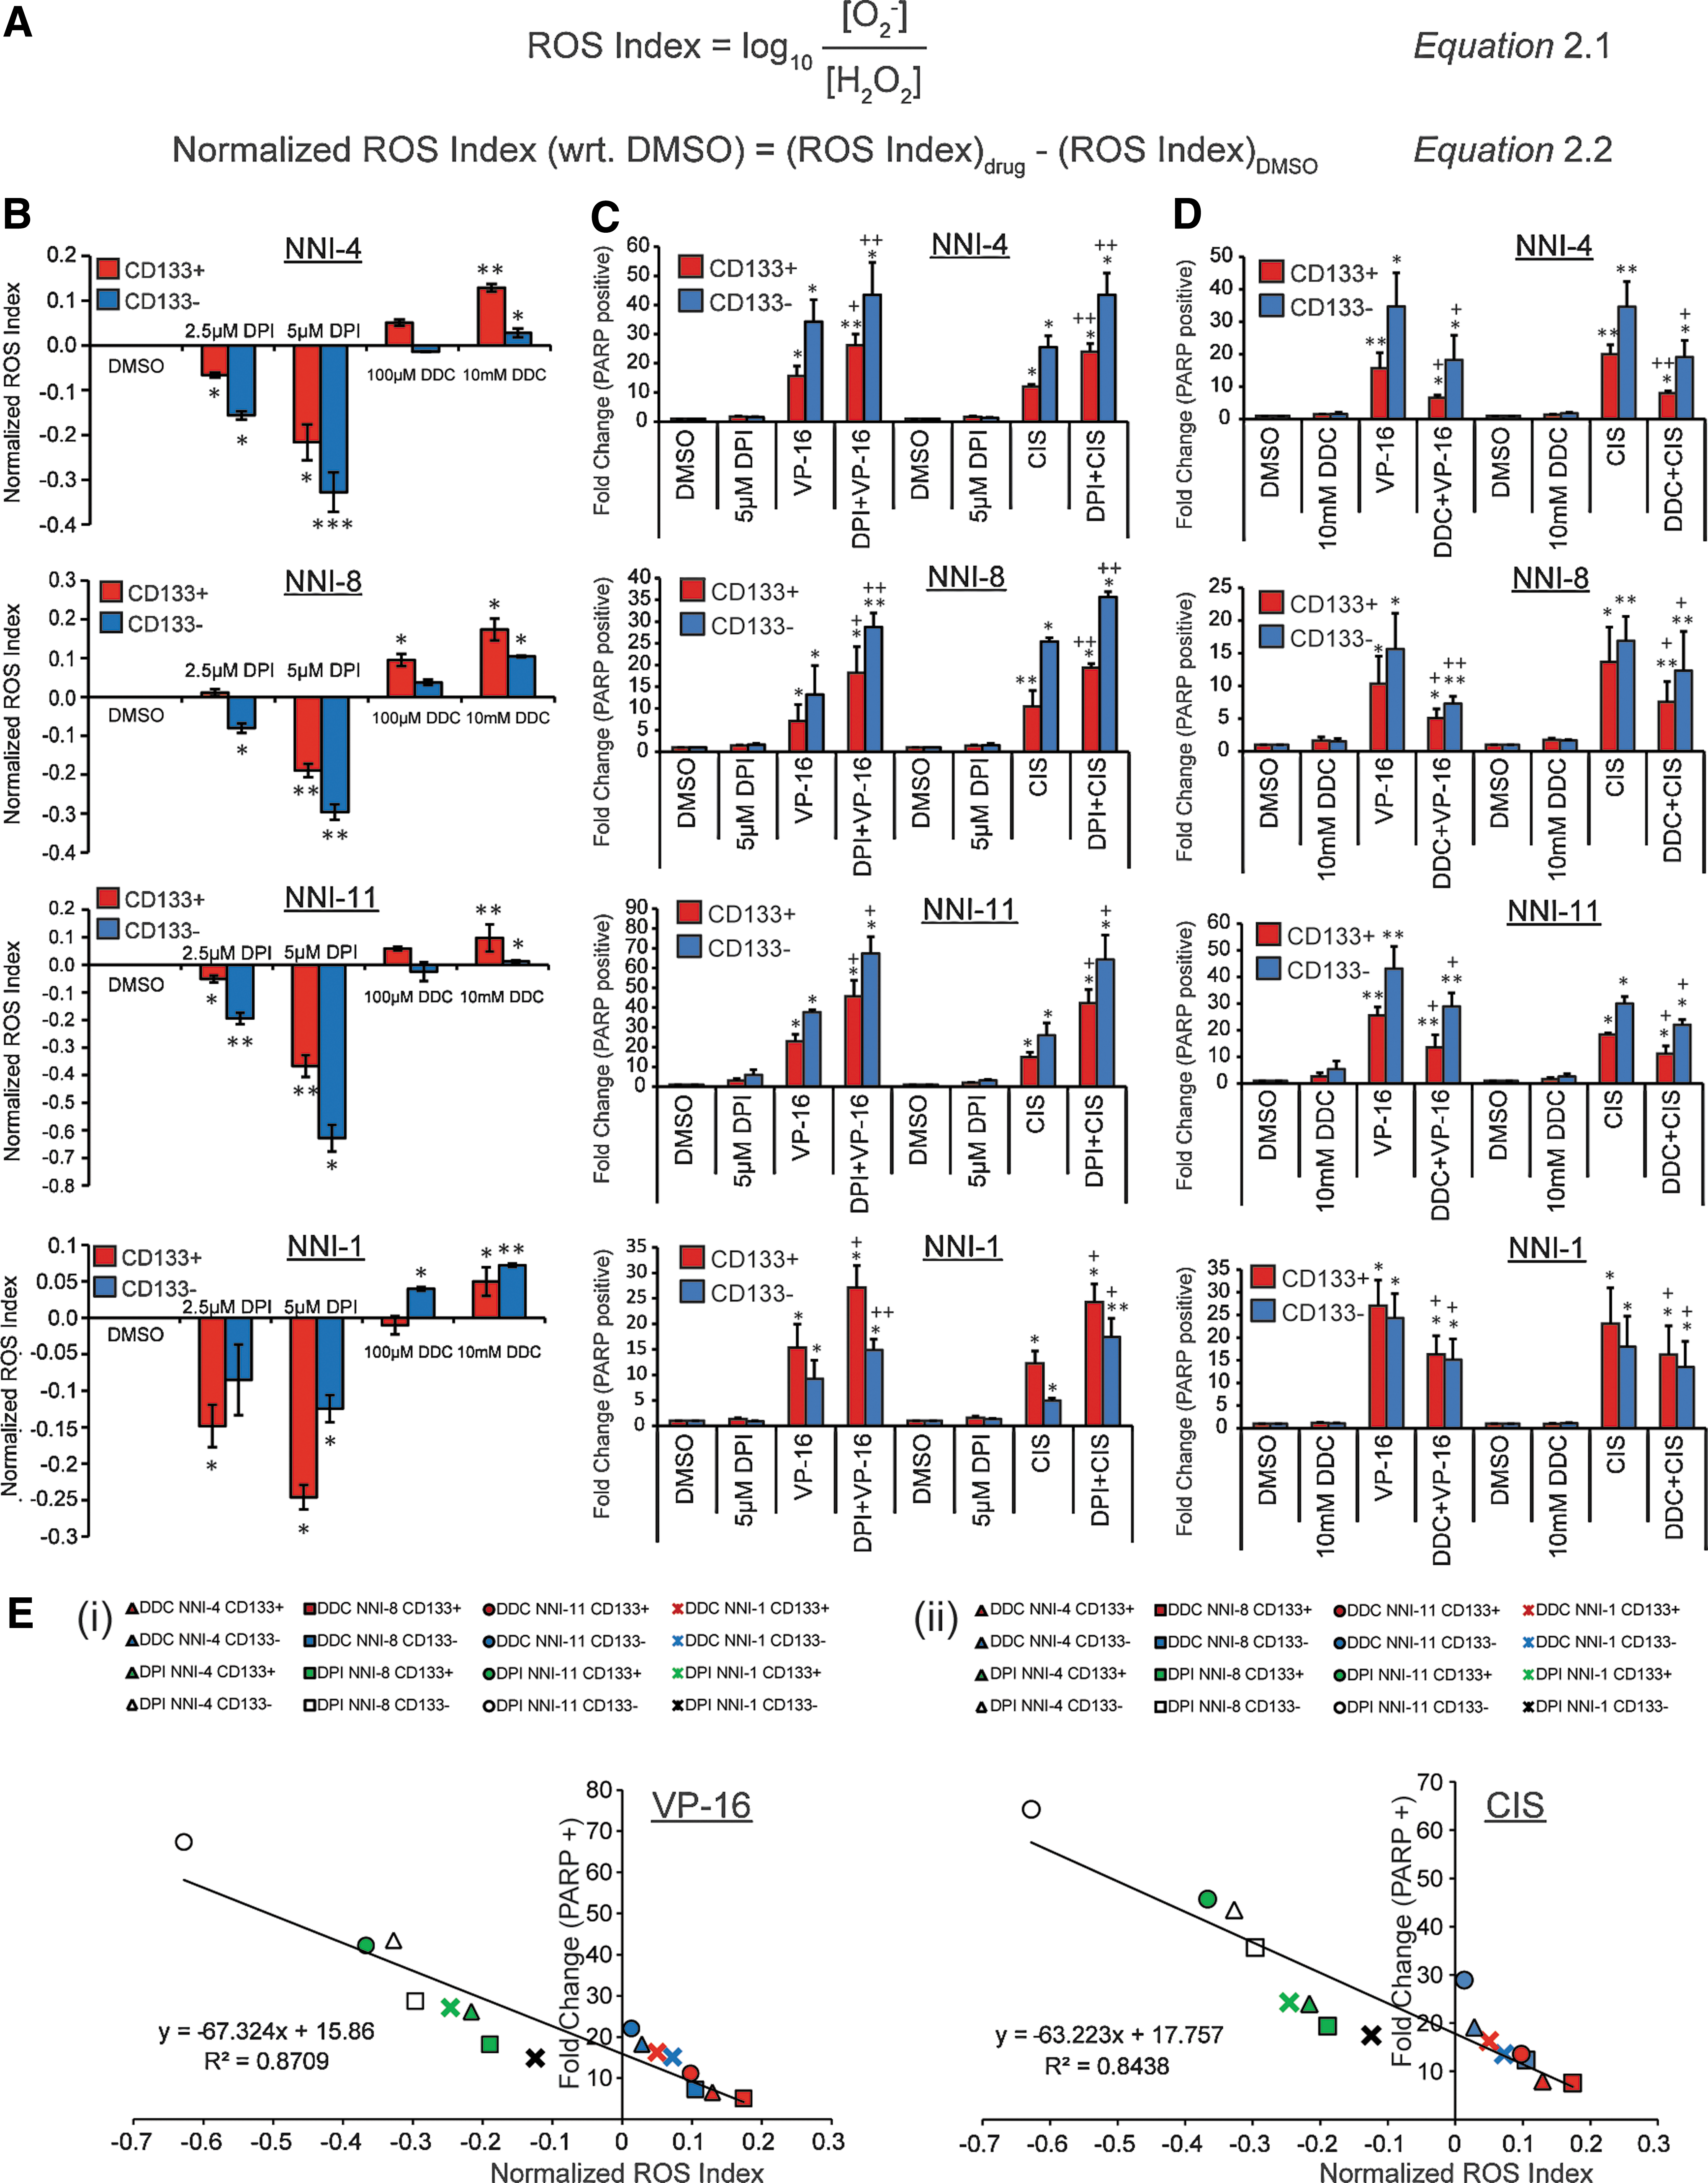
To quantify the O2 −:H2O2 ratios of various drug-treated GPCs, we introduced the ROS Index, a log transformation of absolute values of O2 −:H2O2 as measured by the MitoSOX™ Red:Amplex® Red percentages (Fig. 2A, Equation 2.1). The normalized ROS Index is represented by Equation 2.2 (Fig. 2A). To specifically implicate O2 −:H2O2-mediated chemoresistance, we utilized two well-established pharmacological agents: diphenylene iodonium (DPI) to deplete intracellular O2 −, thereby decreasing the ROS Index to below zero; or diethyl dithiocarbamate (DDC) to elevate intracellular O2 −, thereby increasing the ROS Index to above zero. DPI has frequently been used to inhibit ROS production mediated by flavoenzymes, particularly reduced nicotinamide adenine dinucleotide phosphate (NADPH) oxidase. At concentrations that inhibit NADPH oxidase (this study), DPI diminishes the production of O2 − by mitochondrial respiration (34). We confirmed this mechanism by measuring the O2 − levels in the presence of mitochondrial respiratory chain inhibitors—antimycin, carbonyl cyanide 4-(trifluoromethoxy)phenylhydrazone (FCCP), pyruvate, or rotenone (Supplementary Fig. S2E). DDC is an efficient inhibitor of the O2 − scavenger SOD (28). Consistent with the formula we proposed in Figure 2A, increasing DPI treatment dose-dependently decreased the ROS Index, while increasing DDC treatment dose-dependently increased the Index of both the CD133(+) and CD133(−) fractions (Fig. 2B). As cell death by reductive stress (reduction of ROS Index) occurs primarily through apoptosis (50), we also assessed the levels of cleaved poly(ADP-ribose) polymerase (PARP)-expressing cells after treatments with DPI or DDC, followed by CIS or VP-16. DPI or DDC treatments alone did not affect cell viability (<5%), thus ruling out nonspecific toxicity (Supplementary Fig. S2F). Depletion of the O2 −:H2O2 ratio sensitized both the CD133(+/−) fractions to drug-induced apoptosis, compared to the drug-alone treatment (Fig. 2C). Conversely, DDC treatment provided additional protection against drug-induced apoptosis, compared to drug-alone treatment, although reduction in apoptotic cell levels did not reach those in the dimethyl sulfoxide (DMSO) cells, likely because tumor cell resistance may involve other signaling pathways in addition to redox modification (Fig. 2D). Finally, the ROS Index correlated with the level of drug-induced apoptosis in a linear manner (Fig. 2E), suggesting that the extent of drug-induced apoptosis could possibly be predicted by the relative O2 −:H2O2 ratio within the tumor cells. Figure 2E also demonstrates that this redox mechanism affected both CD133(+) and CD133(−) cells equally, suggesting the targeting of both GPCs and bulk tumor cells.
Mitochondrial SOD2 lentiviral overexpression and knockdown correlate with DPI and DDC treatments, respectively
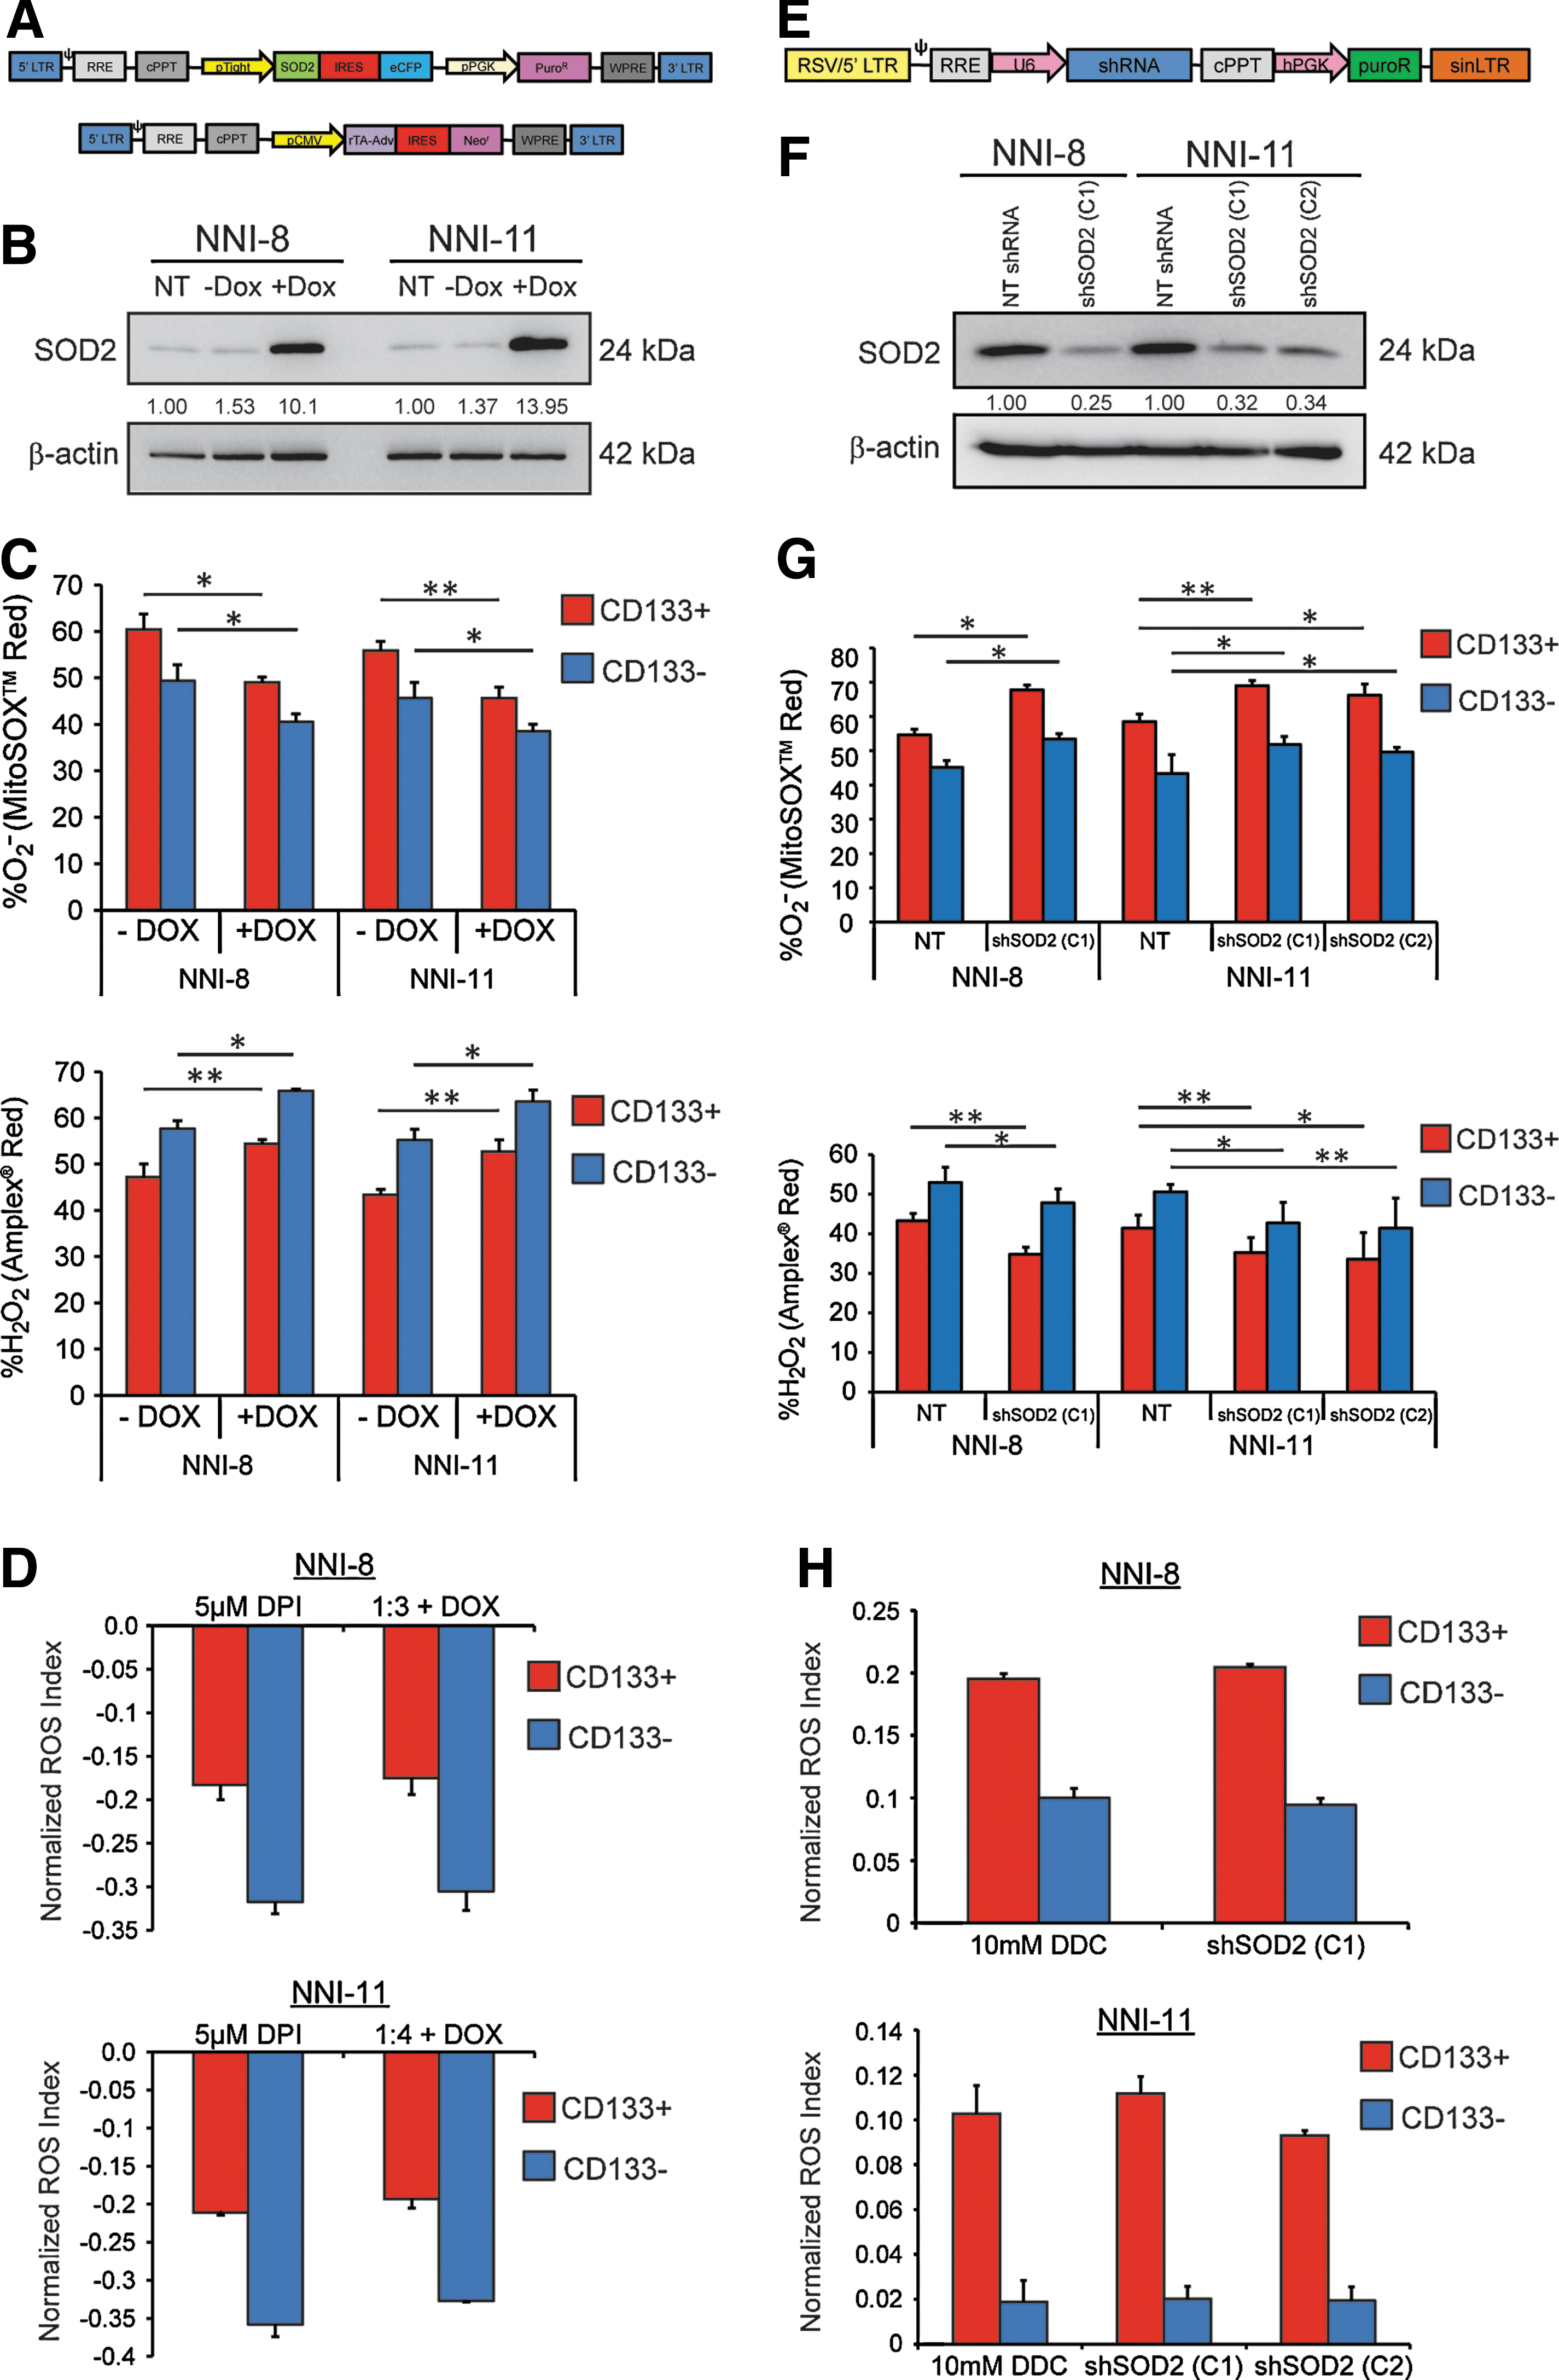
A potent source of ROS generation is the mitochondrial electron transport chain, where O2 − and H2O2 are the major species, and interconvertible via the MnSOD (SOD2) enzyme (7). Coupled to SOD2 is the large body of work highlighting its tumor suppressor activity where lower expression and the inability to induce its expression upon oxidant challenge are invariably observed in tumor cells (14, 47, 69, 72). The obvious consequence of the deficiency/imbalance in the enzymatic activity of SOD2 is the build-up of the O2 − anion, thereby altering the cellular redox status and favoring tumor cell survival. Further, re-expression of SOD2 reverses the invasive phenotype (15, 47, 69, 72). We thus focused on the genetic manipulation of SOD2 to specifically implicate its role in the interconversion between O2 − and H2O2. We constructed a doxycycline (dox)-inducible SOD2 lentiviral vector for overexpression (Fig. 3A), or utilized pLKO.1-based lentiviral shSOD2 knockdown vectors (Fig. 3E). Parameters for SOD2 overexpression or knockdown were earlier optimized by verifying the effects on the normalized ROS Index (Supplementary Fig. S3A–C). Overexpression or knockdown of SOD2 in two GPC lines after stable clone selection was verified by immunoblot analyses and SOD2 activity assay (Figs 3B, F and Supplementary Fig. S3D). NNI-8 and NNI-11 were chosen to profile, as they formed orthotopic tumors at experimentally feasible timelines (∼3–6 months). As expected, SOD2 overexpression resulted in depletion of O2 − in both the CD133(+) and CD133(−) fractions (Fig. 3C, top panel), while H2O2 levels were elevated, consistent with the role of SOD2 as the interconverting enzyme between the two species (Fig. 3C, bottom panel). Conversely, SOD2 knockdown led to elevation of O2 − levels (Fig. 3G, top panel), while H2O2 levels were reduced (Fig. 3G, bottom panel). The resulting normalized ROS Indices were calculated in Figure 3D and H, compared to the values derived from DPI and DDC treatments, respectively. No significant variation was observed between pharmacologically generated O2 −:H2O2 ratios and the SOD2-mediated ratios. These data confirm that lentiviral-mediated dox-inducible SOD2 overexpression and pLKO.1-based knockdown occurred at levels representing earlier DPI and DDC treatments, respectively, for which variations in chemoresistance were observed.
SOD2 overexpression sensitizes GPCs to drug-induced apoptosis, while SOD2 knockdown confers a prosurvival signal
To mimic the effects of DPI treatment, we lentivirally overexpressed SOD2, which would deplete O2 −. We then subjected the cells to CIS or VP-16 treatments. As expected, both NNI-8 and NNI-11 GPCs, regardless of the CD133 status, exhibited enhanced sensitivity to the chemotherapeutic agents (Fig. 4A). GPC sphere-forming capacity was decreased, with concomitant reduction in sphere size (Fig. 4B). Enhanced apoptotic levels were detected by measuring cleaved PARP-expressing cells (Fig. 4C). This suggests that GPCs can be sensitized to drug-induced apoptotic triggers by tilting the redox status balance toward H2O2 production (i.e., depleting the O2 −:H2O2 ratio).
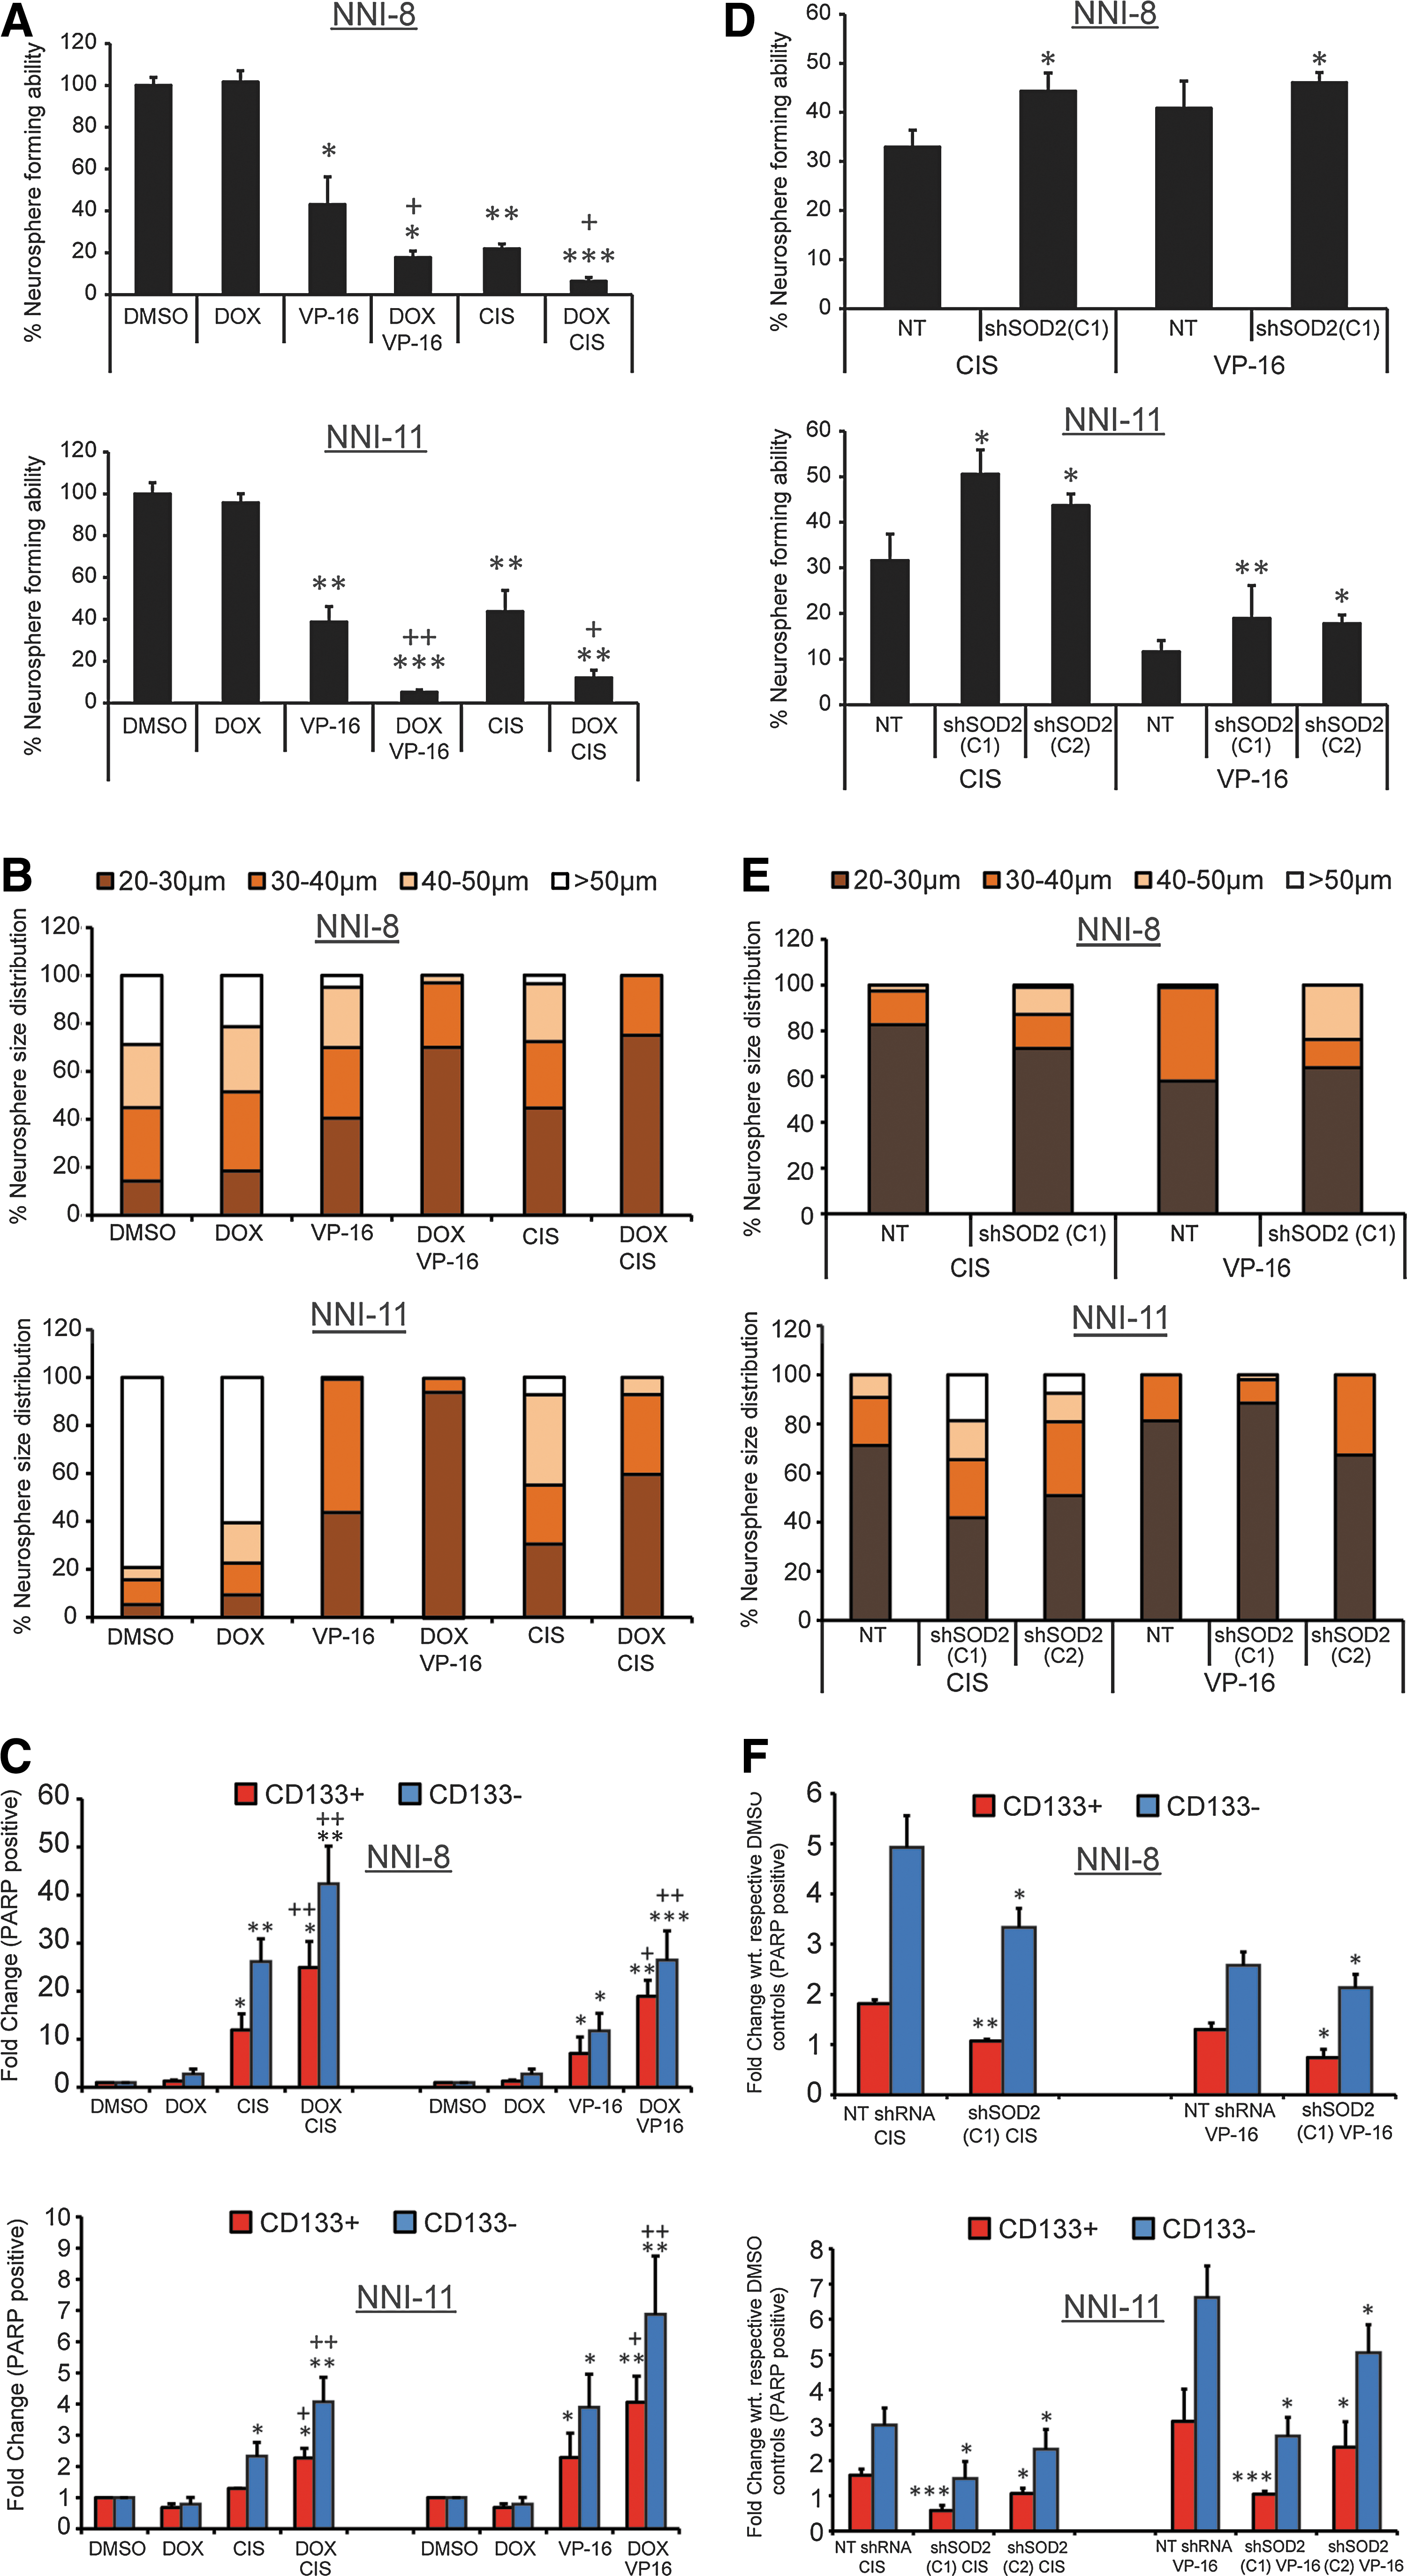
We next assessed the outcome of SOD2 knockdown that would shift the balance from H2O2 toward O2 − production. The sphere-forming capacity was increased in both GPC lines regardless of the CD133 status (Fig. 4D). GPC proliferation was increased (Fig. 4E), and the level of apoptosis (Fig. 4F) was reduced. Our data indicate that SOD2 knockdown results in the production of O2 −, resulting in prosurvival/elevated O2 −:H2O2. We implicate mitochondrial SOD2 as a mediator of intracellular O2 − and H2O2 production.
A reduced cellular redox status and intracellular pH implicate reductive stress and PI3K/AKT signaling
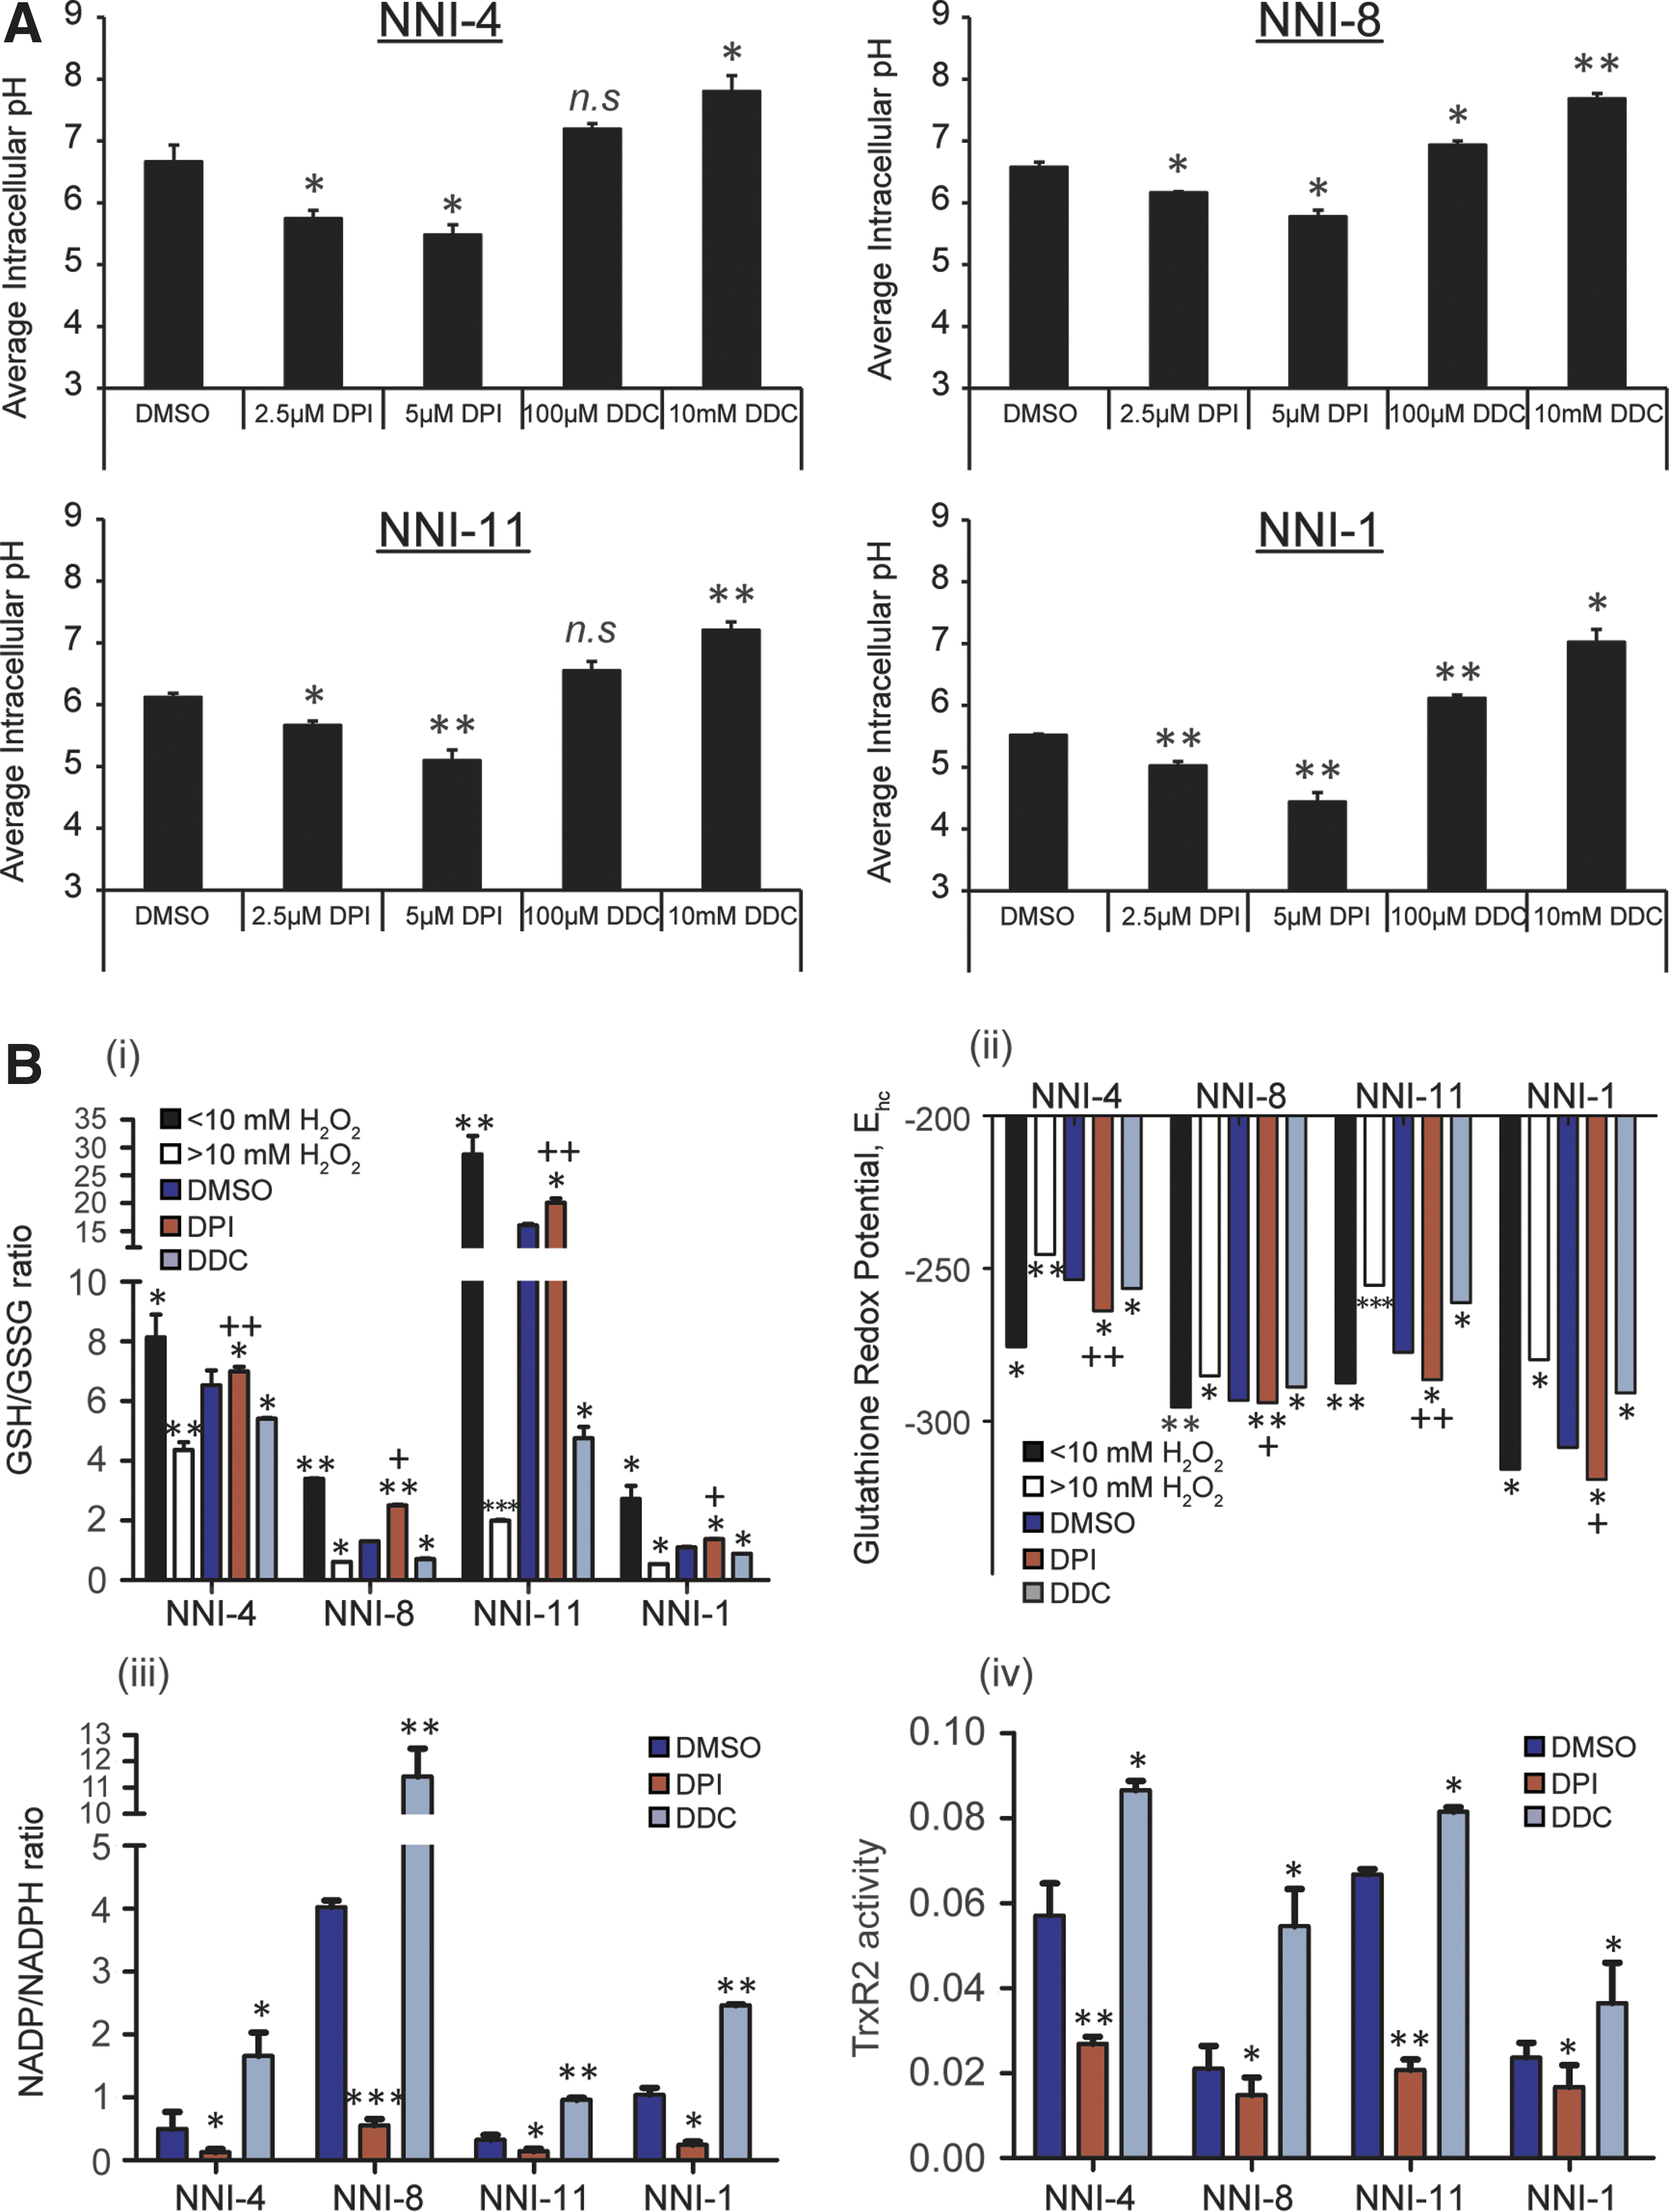
Earlier work elucidated the mechanism of H2O2-induced apoptosis (12). Cells exposed to apoptotic concentrations of H2O2 displayed a significant decrease in intracellular O2 −, which was associated with a reduction of the cytosolic milieu, as defined by an increase in the reduced glutathione (GSH)/oxidized glutathione disulfide (GSSG) ratio and a decrease in intracellular pH. In contrast, cells exposed to necrotic H2O2 concentrations exhibited a significant reduction of the GSH/GSSG ratio accompanied by cytosolic alkalinization. Accordingly, to distinguish the mechanism of reductive stress from oxidative damage in our GPCs, we assessed three parameters: intracellular pH, cellular redox potential, and the redox status [measured by GSH/GSSG, nicotinamide adenine dinucleotide phosphate (NADP)/NADPH ratios, and thioredoxin reductase activity]. We observed in all GPC lines that DPI treatment resulted in cytosolic acidification (pH∼4.5–6.0) with a concomitant increase in the GSH/GSSG ratio, an environment conducive for apoptosis, in contrast to necrotic concentrations of H2O2 (>10 mM H2O2) (Fig. 5A, Bi) (12). Upon DDC treatment, the intracellular pH rose to ∼7.0–7.5 with a reduced GSH/GSSG ratio. The enzyme glutathione disulfide reductase catalyzes an equilibrium that greatly favors formation of reduced GSH (40). Thus, the intracellular microenvironment is normally in a reducing state, with most GSH present in the cell in the thiol form. Any situation that leads to the depletion of intracellular O2 −:H2O2 may be expected to augment the baseline cellular reducing state and therefore the GSH/GSSG ratio. Conversely, metabolic changes that result in enhanced O2 − production will lower the GSH/GSSG ratio (24). The reduced cellular redox environment upon DPI treatment was further corroborated by the determination of the half-cell reduction potential of the 2GSH/GSSG couple using the Nernst Equation (Fig. 5Bii) (56). To further affirm the intracellular redox system, two additional independent redox systems, namely, the NADP/NADPH ratio and the thioredoxin reductase 2 (TrxR2) activity, were ascertained. Our data showed that DPI treatment significantly reduced, while DDC treatment significantly elevated the NADP/NADPH ratio (Fig. 5Biii), consistent with cell death through reductive stress. TrxRs have been implicated in playing a role in protecting against oxidative injury, cell growth, and transformation (2, 61). We now observe that DDC treatment elevated TrxR2 activity, consistent with its tumor cell prosurvival role, while DPI diminished TrxR2 activity (Fig. 5Biv). Collectively, our data strongly suggest that depleting the O2 −:H2O2 ratio creates a reduced environment conducive for drug-induced apoptosis.
Elevated O2 −:H2O2 status has been associated with activation of phosphatidylinositol-3-kinase (PI3K) signaling in tumors (36, 38, 73), and may play a role here in GPC chemoresistance. Further, our subsequent ROS gene signature significantly enriched for the PI3K/AKT signaling module by GeneGo analysis (Supplementary Fig. S5). A constitutively active AKT2 lentiviral vector was constructed for overexpression, while pLKO.1-based lentiviral shAKT2 vectors were utilized for knockdown experiments. We observed that Akt2 overexpression partially restored viability, sphere-forming activity, and sphere size in DPI-treated cells compared to DMSO Akt2 (Fig. 6A and Supplementary Fig. S4A); conversely, AKT2 knockdown partially reduced viability, sphere formation, and sphere size in the presence of DDC (Fig. 6B and Supplementary Fig. S4B). To further strengthen our finding that an elevated O2 −:H2O2 ratio activates the PI3K/AKT signaling axis, we determined intracellular PI3K activity upon DPI or DDC treatments. We observed that cells treated with DDC displayed significantly elevated PI3K activity compared to cells treated with DPI (Fig. 6C). These data demonstrate a link between the redox status specified by the O2 −:H2O2 ratio and GPC chemoresistance, by implicating a key pathway in gliomagenesis and PI3K-AKT signaling axis (1).

Depletion of intracellular O2 −:H2O2 sensitizes GPCs to drug-induced apoptosis, consequently extending survival
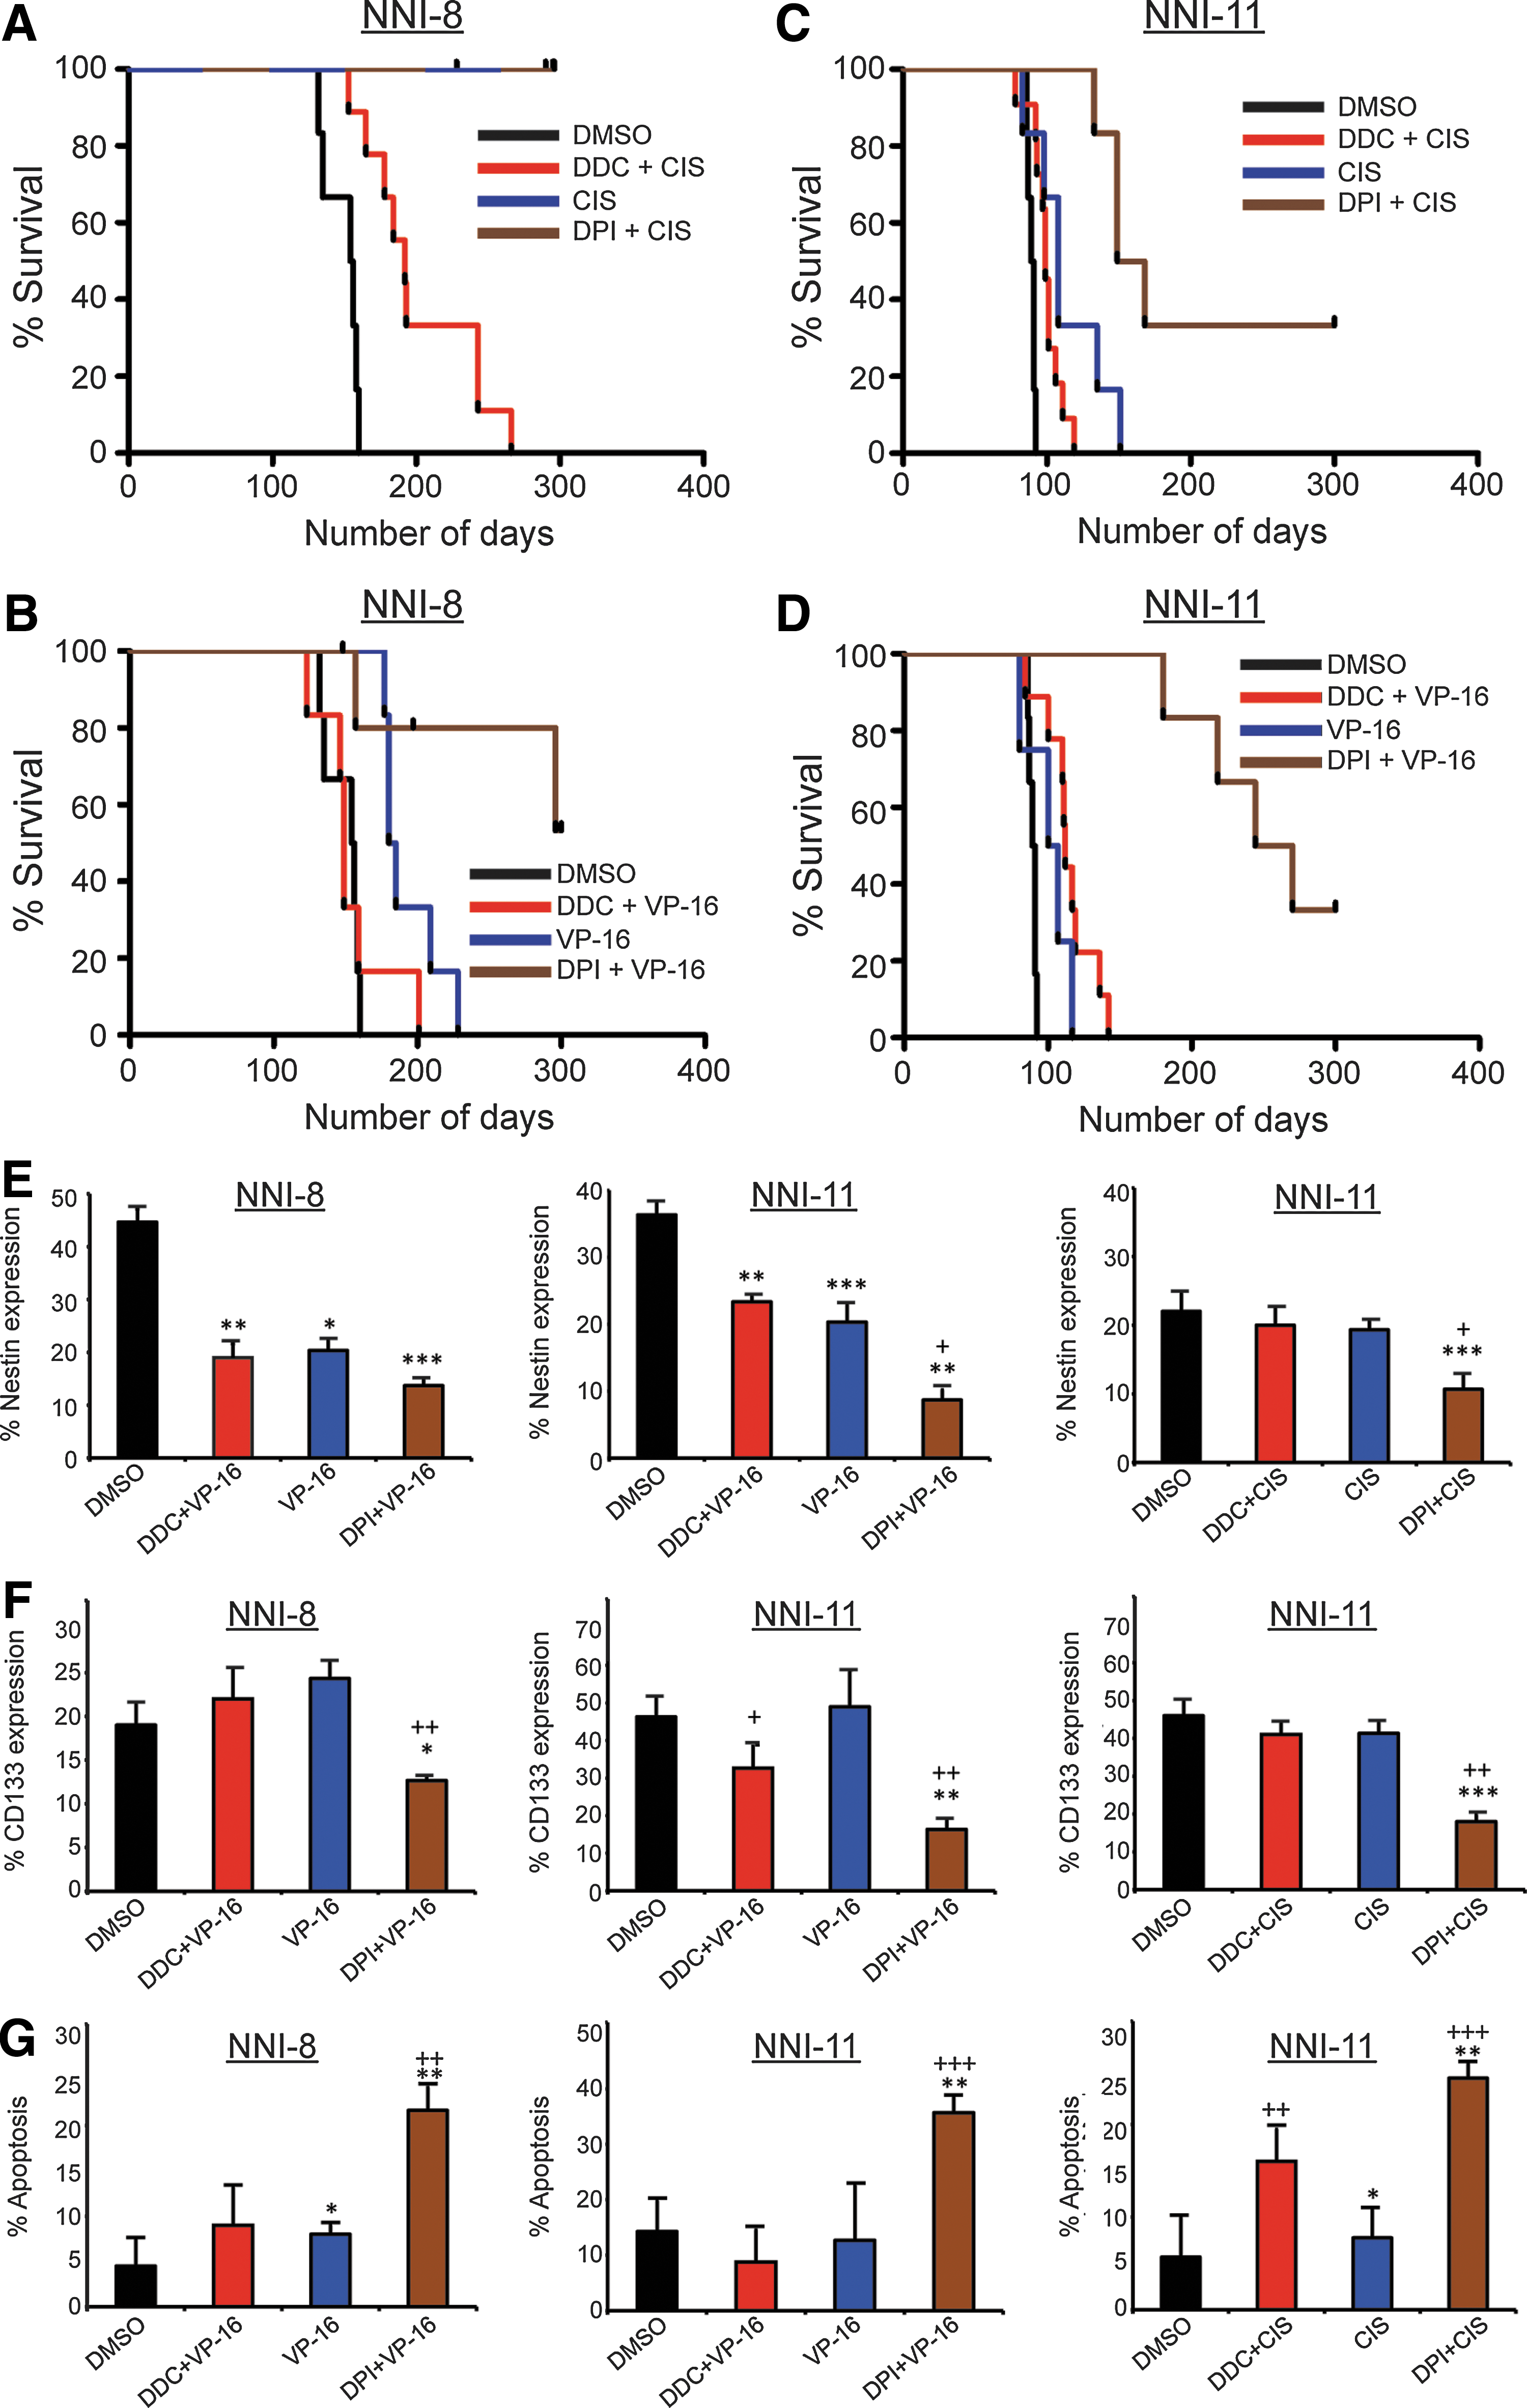
We utilized an orthotopic mouse model of glioma implanted with the following cell groups treated with various chemotherapeutic drugs at their respective IC50 values: CIS, CIS+DPI, CIS+DDC, VP-16, VP-16+DPI, VP-16+DDC, and DMSO control. Significant extension of survival was observed in all mice implanted with NNI-8 treated with DPI+VP-16 (Fig. 7B, p=0.0347), and NNI-11 treated with either DPI + CIS (Fig. 7C, p=0.0173) or DPI+VP-16 (Fig. 7D, p=0.0011), compared to drug-alone (i.e., either CIS or VP-16). No survival advantage was observed in mice implanted with NNI-8 treated with CIS + DPI compared to CIS alone at the time of termination, 300 days (Fig. 7A). In contrast, no consistent trend was observed in mice implanted with CIS/VP-16 + DDC, compared to drug-alone mice, likely because tumor cell proliferation advantage and consequently enhanced in vivo growth involve additional signaling mechanisms other than O2 −:H2O2 elevation alone. We further observed that Nestin- and CD133-expressing cells were significantly diminished in DPI-treated tumors compared to drug-alone tumors (Fig 7E, F), supporting that GPC-like cells were effectively targeted via induction of apoptosis (Fig. 7G).
Elevated O2 −:H2O2 ratio identifies patients with poor prognosis, correlating with a higher tumor grade and the mesenchymal molecular subtype
We utilized the Connectivity Map (31) to interrogate the strength of association between an in vitro derived ROS gene signature, and individual patient's gene expression profile in two large, independent glioma datasets. We previously successfully used the Connectivity Map to correlate the tumor suppressor function of Parkin with patient survival outcome (71), as well as associated GPC subtypes with major glioma variants (44). Differentially regulated genes from the union of resistant CD133 fractions and DDC versus DPI fractions (ROS-resistance gene signature) were mapped onto REMBRANDT (39) and Gravendeel (25) (Supplementary Table S1 and Supplementary Fig. S6, additional clinical databases—Freije and Nutt). The ROS signature stratified patient survival independently of the current clinical indicators, age and histology (Fig. 8Ai, Bi and Supplementary Tables S2–S4), suggesting that ROS activation pathways contribute to glioma molecular heterogeneity. ROS(+) patients correlated with higher tumor grade (mainly GBM) and the Mesenchymal molecular classification with predominance of astrocytic cells, a molecular feature consistent with GBM recurrence (8, 53) (Fig. 8Aii, Bii; Supplementary Tables S5 and S6). In contrast, ROS(−) patients displayed lower tumor grades (mainly oligodendroglioma) and the proneural feature (oligodendroglial and neuronal cells). Gene Set Enrichment Analysis (GSEA) revealed that ROS(+) patients were enriched in Myc and embryonic stem cell (ESC) programs, while ROS(−) patients showed features of oligodendrocytes and neurons (Fig. 8Aiii, Biii; Supplementary Fig. S7 and Supplementary Table S7). Interestingly, oligodendroglial cells were implicated as the more sensitive cells to temozolomide (TMZ) compared to astrocytes or neural stem cells (NSCs) in a mouse model of oligodendroglioma (49). Our data provide clinical evidence for the ROS hypothesis.

Discussion
ROS molecules mediate different roles in cancer and stem cell biology. Diehn et al. demonstrated that breast CSCs possess reduced H2O2 levels, thereby mitigating their response to oxidative damage (16). Additionally, work in oligodendrocyte precursor cells showed that the more reduced cells exhibited enhanced self-renewal properties, whereas cells that were relatively oxidized had a higher probability of differentiating into nondividing oligodendrocytes (46). The common central theme of ROS till then is that at excessive levels, and it is harmful and is associated with oxidative damage, a rather nondiscriminatory event between different cell types. In contrast, recent work by Le Belle et al. has illuminated the seemingly reverse, prosurvival role of ROS in normal NSCs (32). Accordingly, exogenous agents that elevated ROS levels increased production of neurospheres, a key assay for NSC activity. Such findings emphasize that analysis of cell signaling function purely in terms of phosphorylation cascades, transcriptional regulation etc. provides only partial understanding of the means by which signaling regulates the cellular precursor function, and indicate that the roles of redox modulation are quite specific, lending support to the idea that ROS molecules may not just act as mere cofactors, but rather the redox state can act as a specific regulator of stem/progenitor cell function. We have specifically implicated an elevated O2 −:H2O2 ratio, both pharmacologically and by genetically overexpressing/knocking down SOD2, as a GPC tumor cell prosurvival signal, while depleting this ratio sensitizes cells to apoptotic triggers, thus lending support to its role in mediating the tumor phenotype (73). We recognize that there may be other intracellular sources such as NADPH oxidase contributing to varying the O2 −:H2O2 ratio that remains to be explored (50). In addition, the prosurvival O2 −:H2O2 ratio may trigger the proliferative pathways such as extracellular signal-regulated kinase (ERK) in addition to AKT, supported by our GeneGo analysis enriched for the V-Ki-ras2 Kirsten rat sarcoma viral oncogene homolog (KRAS) network. Our study does not contradict previous work, but instead extends on the roles of different ROS molecules—oncogenic O2 − versus the apoptotic H2O2 at a slight prooxidant intracellular microenvironment where oxidative damage has not yet come into play. Importantly, the linear correlation between the normalized ROS Index and the extent of apoptosis we observed, regardless of patient cell line, marker expression, or drug [further, the NNI-1-resistant fraction was CD133(−)], strongly supports that heterogeneity in chemoresistance is a manifestation of differing O2 −:H2O2 ratios. This is a significant advance to a previously largely qualitative ROS field. The utility of this quantitative and reproducible ROS Index for drug screening thus holds promise for the evaluation of drug candidates targeting the O2 −:H2O2 ratio.
Although we did not detect tumor cell proliferation advantage due to an elevated O2 −:H2O2 ratio (DDC treatment) in vivo, and many reasons could have contributed to this, such as the inadequacy of xenograft models in immune-compromised mice to model the tumorigenic process, nevertheless, the significance of the ROS Index was further validated in a clinical setting when we mapped ROS pathway activation scores in two large, public glioma databases, REMBRANDT (N=298) (39) and Gravendeel (N=276) (25). We recognize that these glioma databases consist largely of patients treated with TMZ concomitant with radiotherapy and adjuvant TMZ as the standard care for initial treatment of GBM—the Stupp regimen (59). In some cases, the supplemental regimen included platinum/thalidomide/tamoxifen/CPT11/vincristine/cyclophosphamide. The high in vitro concentrations of TMZ (250–2000 μM) preclude their use in our earlier analyses (4). CIS and etoposide are clinically relevant investigational tools because of their expanded roles in the TMZ and bevacizumab era (9), and their mechanism as radiomimetics, that is, induce DNA double-strand breaks (57, 67). Our ROS gene signature enriched for the KRAS and PI3K/AKT signaling networks, both of which are implicated as central pathways mutated in ∼88% of GBM patients (1). This provides clinical evidence for our in vitro observations that demonstrated that the interconversion between the O2 − and H2O2 species involved at least in part the PI3K/AKT signaling axis, a key pathway in gliomagenesis (1). Previous efforts by others have uncovered a role for NAPDH oxidase enzymes in the regulation of normal NSC proliferation and self-renewal in a PI3K-AKT-FoxO-dependent manner (32, 48). Our work extends by providing evidence that other major mitochondrial-based mechanisms can exert specific tumor-proliferative, and, in this case, GPC survival effects by acting on core signaling pathways such as PI3K/AKT. Other convincing evidence linking a slight prooxidant intracellular milieu with tumor promotion comes from studies linking cell survival pathways, such as the PI3K/AKT (54) and RAS (29, 51) circuits, with an increase in intracellular ROS generation.
Strikingly, patients who demonstrate strong concordance with an elevated O2 −:H2O2 ratio fared poorly, while patients with the inverse correlation tended to have a better prognosis. To shed more light into possible target pathways of the ROS Index-driven mechanism, we utilized genome-wide transcript profiles of ROS-resistant patient classes from REMBRANDT and Gravendeel to determine enrichment for the NFκB and HIF1α molecular gene sets identified from the Molecular Signatures DataBase (MSigDB), for the reason that these transcription factors are frequently regulated by the redox status (6), and whose expression of dependent genes promotes the glioma phenotype (35, 66). We identified that, from Supplementary Table S8, indeed, the NFκB- and HIF1α-related pathways are enriched in ROS(+) patients (poorer prognosis), implying that these master transcription factors could also possibly influence the generation of the malignant phenotype. Further, these regulatory modules are also enriched in the CD133(+) class of patients compared to the CD133(−) group (as defined by the CD133 signature), lending support to the importance of CD133 as a negative prognostic marker in glioma (Supplementary Table S9) (5).
The ROS(+) class of patients was enriched in the Myc and ESC programs. Clement et al. recently implicated an ESC signature in the progression and malignancy of glioblastoma tumors (13). Additionally, Shats et al. showed that the core ESC programs defined poor prognosis in patients with breast cancer, lung adenocarcinoma, and medulloblastoma (58). Further, c-Myc has been shown to promote the survival of CD133(+) GPCs and consequently tumorigenic growth (68). These findings highlight that Myc and ESC core modules play essential roles in mediating the O2 −:H2O2-driven chemoresistance of GPCs. Interestingly, our Cox regression analysis indicated that the gene signature prognosticated survival better than the current clinical indicators, age and grade, implying that a combination of stem-like traits and redox status is vital to disease progression and survival outcome, and importantly, contribute to the molecular heterogeneity of the disease. These findings highlight the ROS resistance gene signature as a novel molecular predictor of glioma disease outcome that cannot be accounted for by histology alone, and thus underscores the limitation of relying solely on morphology-based methods to diagnose and subsequently treat patients. Further, we are now able to identify patient cohorts (with their corresponding genetic, transcriptomic patterns, and clinical history) most likely to benefit from ROS Index-related small-molecule therapeutics. Although our ROS gene signature came from a limited number of GPC lines as with all studies till date, we leveraged the unavoidable small sample size with cross-validation in four large, independent patient databases. Thus, clinically amenable applications may be developed by profiling unsorted bulk tumor cells, because chemoresistance and disease progression are manifestations of the activation of redox–GPC pathways.
In summary, our work provides strong evidence for the clinical relevance of the ROS Index. We further suggest that redox-based therapies in brain tumors can be designed to favor a reduced O2 −:H2O2 ratio, thereby sensitizing tumor cells, and especially GPCs, to apoptotic triggers (proposed model, Supplementary Fig. S8).
Materials and Methods
Tissue collection and primary GPC culture
Graded brain tumor specimens were obtained with informed consent, as part of a study protocol approved by the SingHealth Centralised Institutional Review Board A. GPC lines were described in our previous work (10, 19, 44). All experiments were conducted with low-passage GPCs (within 20 passages) for which we previously demonstrated maintenance of the phenotypic, transcriptomic, and karyotypic features similar to the primary tumor.
Viability and sphere assays; antibodies used
Viability and sphere assays were carried out as previously described (10). Antibodies used for immunoblot analyses included anti-pan-Akt (11E7, 1:1000; Cell Signaling, #4685), anti-MnSOD (1:1000; Upstate, Millipore, 06-984), and anti-β-actin (AC-15, 1:10,000; Sigma-Aldrich, A5441). Antibodies for flow cytometric analyses included anti-CD133/2-allophycocyanin (Clone 293C, 1:10; Miltenyi MACS, 130-090-854); and anti-cleaved PARP conjugated to phycoerythrin (Asp214, 1:5; BD Pharmingen, 552933). Dead cells were distinguished by 7-aminoactinomycin D (7-AAD; BD Pharmingen, 559925) staining. Flow analyses were carried out on the FACSCalibur (BD Biosciences); flow sorting was carried out using the FACSAria (BD Biosciences). Data were plotted using FlowJo software (Treestar).
Detection of O2 − and H2O2
Cells treated with DPI or DDC for 1 h (viability unaffected; Supplementary Fig. S2E) were dissociated with Accutase (eBioscience) and stained with the Amplex® Red (Invitrogen) and MitoSOX™ Red (Invitrogen) reagents, which measure H2O2 and O2 −, respectively. Amplex® Red and MitoSOX™ Red dyes were both detected using the FL-2 channel on FACSCalibur (BD Biosciences), with excitation of 488 nm and emission wavelengths of 585 nm for Amplex® Red and 580 nm for MitoSOX™ Red.
Measurement of intracellular pH with 2′,7′-bis(2-carboxyethyl)-5,6-carboxyfluorescein
Intracellular pH (pHi) was measured by loading cells with a membrane-impermeant dye 2′,7′-bis(2-carboxyethyl)-5,6-carboxyfluorescein (BCECF; Sigma-Aldrich) as described elsewhere (42). Cells were analyzed on FACSCalibur (BD Biosciences) with excitation of 488 nm. A minimum of 10,000 events was analyzed, and the ratio of BCECF fluorescence at 525 and 610 nm was used to obtain the pHi from a pH calibration curve. To generate a pH calibration curve, GPCs were loaded with BCECF as above, washed once with HBSS, and then resuspended in a high K+ buffer (135 mM KH2PO4, 20 mM NaCl, and 110 mM KH2PO4, and 20 mM NaCl with a range of pH between 6.0 and 8.0). Immediately before flow cytometry, cells were loaded with 20 mM nigericin (1 mM stock in absolute ethanol; Sigma-Aldrich), and the fluorescence ratio measurements (525 nm/610 nm) of cells in nigericin-containing buffers of a range of pH were then used to relate the histogram channel numbers to pHi.
Determination of the cellular redox state—GSH/GSSG measurement
Analysis of cellular GSH after manipulation of intracellular redox state was determined using the recycling assay of the Glutathione Assay kit (Cayman Chemical Co.). The reduced/oxidized glutathione ratio (GSH/GSSG) was calculated using the formula [(GSHt − GSSG)/GSSG].
Determination of the cellular redox state—NADP/NADPH measurement
Colorimetric NADP/NADPH assays were performed after manipulation of the intracellular redox state using a commercially available kit from Abcam (ab65349), according to the manufacturer's protocols. The NADP/NADPH ratio was quantified using the sample's OD450nm reading after 4 h using the formula, [(NADPtotal − NADPH)/NADPH].
Determination of the cellular redox state—TrxR2 measurement
TrxR2 activity in redox-manipulated GPCs was determined using the Thioredoxin Reductase Colorimetric Assay Kit (Cayman Chemical Co.), which is based on the reduction of 5,5′-dithiobis-2-nitrobenzoic acid (DTNB) by NADPH to yield thionitrobenzoate (TNB) that is detectable at 412 nm.
SOD2 overexpression and shSOD2 vector construction
The pLVX-Tight-puro-SOD2-IRES-eCFP overexpression vector was generated using the Lenti-X™ Tet-On® Advanced Inducible Expression System (Clontech). The full-length SOD2 cDNA was PCR-amplified, digested with Bglll and BamHI, and subsequently ligated into the pYIC vector (45) (Addgene plasmid 18673). Blunt ends of the resultant SOD2-IRES-eCFP fragment into the pLVX-Tight-puro vector (Clontech) were ligated, and resultant plasmids were fully sequenced. Lentiviral particles were generated as per the manufacturer's protocol. Inducibility and viral cotransduction ratio between the regulator pLVX-Tet-On Advanced vector and the response pLVX-Tight-Puro-Luc vector were optimized using the luciferase assay system (Promega) (Supplementary Fig. S3B, top panel). A range of ratios was selected, and GPCs were cotransduced with the pLVX-Tet-On Advanced vector and the pLVX-Tight-Puro-SOD2-IRES-eCFP vector (X:Y ratio, respectively). The ratio that best mimicked that of the DPI ROS Index was determined by flow cytometry (Supplementary Fig. S3B, middle and bottom panels). Cotransduced GPC lines were maintained under 2 μg/ml puromycin and 250 μg/ml geneticin (Gibco) selection. The overexpression efficiency of SOD2 was verified by immunoblot analysis (Fig. 3B) and the superoxide dismutase assay kit (Supplementary Fig. S3D, left panel) (Cayman Chemical).
Lentiviral-compatible shRNA clones were obtained from the Open Biosystems pLKO.1 shRNA library against SOD2 (TRCN0000005941 [shSOD2 (C1)] and TRCN0000005943 [shSOD2 (C2)]). Lentiviral particles were generated as described above. GPCs were transduced with the shRNA-bearing lentiviral particles and analyzed via flow cytometry to establish the ratio that best mimicked that of the DDC ROS Index (Supplementary Fig. S3C). The knockdown efficiency was determined by immunoblot analysis (Fig. 3F) and the superoxide dismutase assay (Supplementary Fig. S3D, right panel). Briefly, SOD2 activity was determined using the commercially available Superoxide Dismutase Assay kit (Cayman Chemical), according to the manufacturer's instructions. A tetrazolium salt was utilized for the detection of superoxide radicals generated by xanthine oxidase and hypoxanthine. As this assay measures all 3 forms of SOD (namely, Cu/Zn, Mn, and FeSOD), 3 mM potassium cyanide was incorporated into the assay mixture to inhibit both Cu/Zn-SOD and extracellular SOD, thereby resulting in the sole detection of MnSOD activity. After transduction, cells were harvested and sonicated in a cold buffer containing 20 mM HEPES, (pH 7.2), 1 mM EGTA, 210 mM mannitol, and 70 mM sucrose. The supernatant was then collected after centrifugation at 1500 g for 5 min at 4°C. Twenty microliters of xanthine oxidase was added to each of the wells to initiate the reactions and incubated for 20 min at room temperature. Absorbance of each standard and sample was analyzed spectrophotometrically at 450 nm using the Sunrise™ microplate reader (Tecan). SOD activity of the samples was subsequently determined using the equation obtained from the linear regression of the standard curve. One unit is defined as the amount of enzyme needed to exhibit 50% dismutation of the superoxide radical.
AKT2 overexpression and shAKT2 vector construction
The pLenti6mCWmyrHAAkt2IRESmCherry overexpression vector was constructed from a modified pLenti6/V5-D-TOPO vector (ViraPower™ Lentiviral Expression Systems; Invitrogen), named pLenti6mCW. Full-length AKT2 cDNA was PCR-amplified, digested with EcoRV and EcoRI, and subsequently ligated into the pLenti6mCW vector. After, the myrHA tag was PCR-generated, digested with EcoRV and SalI, and ligated into the resultant pLenti6mCWAKT2IRESmCherry plasmid. The consequent plasmid was sequenced. Lentiviral particles were generated as per above. The overexpression efficiency was determined by immunoblot analysis (Fig. 6A). GPCs were transduced with either the pLenti6mCWmCherry vector lentiviral particles or the pLenti6mCWmyrHAAkt2IRESmCherry overexpression vector lentiviral particles at the optimal MOI of 50 for 144 h before cell viability assays and sphere assays and maintained under 1 μg/ml blasticidin selection.
Lentiviral-compatible shRNA clones were obtained from the Open Biosystems pLKO.1 shRNA library against AKT2 (TRCN0000009820 [shAKT2 (C1)] and TRCN0000039971 [shAKT2(C2)]). Lentiviral particles were generated as per above. GPCs were transduced with the shRNA-bearing lentiviral particles, and the knockdown efficiency was determined by immunoblot analysis (Fig. 6B).
PI3-K p85-fast activated cell-based ELISA assay
PI3 Kinase activity of redox-manipulated GPCs was assessed using the fast activated cell-based ELISA (FACE™) PI3 Kinase p85 ELISA Kit (Active Motif), according to the manufacturer's protocols. Total/phosphorylated PI3 kinase levels were determined via a colorimetric readout at OD450 and normalized to the relative cell number in each well through the use of crystal violet absorbance at OD595.
Stereotaxic intracranial implantations of NOD-SCID-gamma mice
Animal experimentation was performed according to the protocols approved by the Institutional Animal Care and Use Committee. Implantation was carried out as previously described (10). NOD.Cg-Prkdcscid Il2rgtm1Wjl /SzJ mice were used (The Jackson Laboratory). Coordinates were anteroposterior=+1.0 mm; mediolateral=+2 mm; dorsoventral=−2.5 mm. Mice were euthanized by means of transcardiac perfusion with 4% paraformaldehyde upon presentation of neurological deficits with ataxia, cachexia, lethargy, or seizure. Animal survival was assessed using the log-rank test in GraphPad Prism software (GraphPad Software, Inc.). Hematoxylin and eosin staining and immunohistochemistry were performed on 5-μm-thick paraffin sections. Tissue sections were stained with mouse monoclonal anti-Nestin antibody (1:500; Chemicon, MAB5326) or rabbit polyclonal anti-CD133 antibody (1:500; Abcam, ab19898) according to the manufacturer's protocol. The extent of apoptosis was determined via terminal deoxynucleotidyl transferase dUTP nick-end labeling (TUNEL) assay using the ApopTag® Peroxidase in situ apoptosis detection kit (Millipore) according to the manufacturer's protocols. A minimum of 200 cells were scored in each of 3 separate fields of view for each specimen.
Statistical analysis
Data are expressed as means±standard error of the mean of at least 3 independent experiments. Student's t- or Mann–Whitney U test was used where appropriate. The one way analysis of variance across multiple groups was evaluated using Kruskal–Wallis test. p≤0.05 was accepted as statistically significant.
Microarray data processing
Raw files from the Illumina BeadScanner were converted to text files using GenomeStudio software, and all downstream processing were conducted using R statistical software and the Bioconductor packages (23, 62). In this study, data from the Human Ref-8v2 beadchips were processed using the Lumi package (17). To process the raw data, a variance-stabilizing transformation was applied, and then probes with the following criteria were removed: (i) detection call ≥0.01 in all samples and (ii) nonexonic probes. After that, the data were quantile normalized, and an ExpressionSet was created using the Biobase package (23) for further analysis in R.
Signature generation and validation
Differentially expressed genes between positive ROS index samples (DDC-treated) and negative ROS index samples (DPI-treated) were generated using the Limma package (22). Probes with a p-value of 0.01 were considered significant, and an ROS index signature was obtained by further filtering of the fold change value >1.3. Subsequently, this set of genes was tested using a supervised classification method (Prediction Analysis of Microarrays) to predict the DDC-treated and DPI-treated samples. The pamr package (27) was utilized to cross-validate the ROS index signature using a leave-one-out method. On the other hand, microarray data of CD133+ and CD133- fractions were used to generate the second gene signature—the CD133 signature. Differentially expressed genes between resistant (NNI-1 CD133−, NNI-4 CD133+, and NNI-8 CD133+) and sensitive (NNI-1 CD133+, NNI-4 CD133−, and NNI-8 CD133−) samples were generated using the samr package (64). Probes with a fold change of 1.3 were considered significant (FDR 0.1). The same cross-validation method mentioned above was applied to the CD133+/− dataset using the CD133 signature. Finally, a combined ROS resistance gene signature was obtained by merging the above 2 optimized gene signatures. All array platform gene annotation was derived from Biomart (
Pathway analysis
Pathway and biological process enrichment analysis were carried out in MetaCore from GeneGo, Inc. The combined ROS signature was used as input for the analysis, and significant pathways (p-value≤0.05) were reported.
Connectivity map analysis
The Connectivity Map analysis (31) was adapted to score the patient samples in glioma gene expression databases according to the extent of pathway activation associated with the ROS signature. Public glioma datasets with clinical data, in terms of survival length, histology, age, and sex, were obtained from either GEO or the database Website. The following datasets were used in this analysis: REMBRANDT (
The ROS resistance gene signature (union of ROS index signature and CD133 signature) was compared to each sample in the reference profiles, and an activation score was calculated using the Connectivity Map approach. This method uses a nonparametric, rank-based pattern-matching procedure to score gene expression profiles based on the strength of association to the ROS signature. The activation scores are then sorted in descending order and two groups of patients identified: (+) and (−), where a positive activation score indicates that the sample is positively associated to the gene signature and vice versa. To assess the significance of the activation scores, two-tailed test p-values were estimated by permutation as described in Lamb et al. (31). p-values≤0.05 were considered significant.
Reference profile generation for Connectivity Map analysis
Public glioma datasets with clinical data, in terms of survival length, histology, grade, and age, were obtained from the REMBRANDT database (
Survival analysis
Kaplan–Meier and Cox regression analysis of (+) and (−) groups were done in R using the survival package (63). For the REMBRANDT dataset, only survival ranges were available. Hence, the lower limit of the range was used in this analysis.
Subtype analysis
Differentially expressed genes in cell types relevant to brain development were obtained from Cahoy et al. (8). Mouse gene sets that are differentially expressed in cultured astroglia, neurons, oligodendrocytes, and astrocytes were converted to human genes using Ensembl. The extent of enrichment of these signatures in the ROS(+) and ROS(−) samples was scored using GSEA (60). In addition, we preselected 181 stem cell-related gene sets and performed GSEA to identify the significantly enriched modules.
Prediction of Phillips classification in REMBRANDT and Gravendeel datasets
To classify the REMBRANDT and Gravendeel samples according to the Phillips et al.'s classification (53), the Affymetrix U133A probes for the Phillips molecular subtypes were extracted from the publication. A shrunken centroid model was trained and tested on the Phillips dataset using the R package pamr (27). Next, the REMBRANDT and Gravendeel datasets were classified using the trained model.
Footnotes
Acknowledgments
The authors acknowledge financial support from competitive grants awarded by the Biomedical Research Council, A*STAR to C.S.L. Tang (07/1/33/19/530, 09/1/33/19/611), and institutional grant funding to B.T. Ang at the Singapore Institute for Clinical Sciences, A*STAR. We are grateful to A/Professor Kah Leong Lim and Dr. Chou Chai, National University of Singapore (Department of Physiology), and Duke-NUS Graduate Medical School, for the generous gift of pLenti6mCWmyrHAAkt2IRESmCherry and pLenti6mCWmCherry vectors. We thank the laboratory members, N.S. Tan of Nanyang Technological University, and Jonathon D. Sedgwick of Lilly Singapore Centre for Drug Discovery for critical review of the manuscript.
Author Disclosure Statement
No competing financial interests exist.
Abbreviations Used
References
Supplementary Material
Please find the following supplemental material available below.
For Open Access articles published under a Creative Commons License, all supplemental material carries the same license as the article it is associated with.
For non-Open Access articles published, all supplemental material carries a non-exclusive license, and permission requests for re-use of supplemental material or any part of supplemental material shall be sent directly to the copyright owner as specified in the copyright notice associated with the article.
