
Abstract
Introduction
M
In mammalian cells, mitochondrial biogenesis is regulated by several key factors, including peroxisome proliferator-activated receptor gamma coactivator-1 alpha (PGC-1α). PGC-1α acts as a cardinal transcriptional regulator of mitochondrial biogenesis by activating nuclear respiratory factor-1 (NRF-1) and nuclear respiratory factor-2 (NRF-2/GA-Binding protein-A). PGC-1α and NRF-1 co-activate the mitochondrial transcription factor-A (TFAM), which, in turn, regulates the transcription of nuclear genes encoding mitochondrial proteins. Among the latter are included mitochondrial proteins that are involved in the regulation of mitochondrial transcription and translation, mitochondrial DNA (mtDNA) repair pathways, and in the maintenance of mitochondrial structural integrity (18, 34).
In the current study, we demonstrate that the induction of mitochondrial biogenesis in hepatocytes by nitric oxide (NO) involves a signaling pathway requiring endogenous carbon monoxide (CO). We have also shown here that natural antioxidants such as resveratrol can induce mitochondrial biogenesis through a complex cascade involving stimulation of endogenous NO and CO production. Natural antioxidants may be exploited as potential therapeutics to maintain mitochondrial populations and preserve mitochondrial homeostasis in diseases such as sepsis.
Nitric oxide (NO), a small gaseous mediator, can regulate mitochondrial biogenesis in a wide variety of mammalian cell types, which, in turn, promotes mitochondrial function and ATP production (29, 30). NO arises endogenously as the product of constitutive and inducible nitric oxide synthase (NOS) enzymes (46). Similar to other physiological effector functions of NO, such as vasodilatation, stimulation of mitochondrial biogenesis by NO is dependent on activation of soluble guanylate cyclase (sGC) and the formation of guanosine 3′,5′-monophosphate (cGMP) (29). Activation of mitochondrial biogenesis by NO also depends on PGC-1α, though the upstream signaling pathways remain incompletely characterized (29). Administration of cGMP analogs can enhance mitochondrial biogenesis and prevent mitochondrial dysfunction and reactive oxygen species (ROS) production in the setting of insulin resistance (27).
Another small gaseous mediator, carbon monoxide (CO), similar to NO, can also act as an agonist of sGC, albeit with a lower affinity than NO (14, 40). CO can be produced endogenously by heme oxygenase (HO, E.C. 1:14:99:3) enzymes, which exist in constitutive (i.e., HO-2) and inducible (i.e., HO-1) isozymes (26, 39, 45). CO, when applied exogenously in gaseous form, or delivered from CO-releasing molecules (CORMs), has been shown to act as an effector of mitochondrial biogenesis in cultured cells (22, 23, 44). CO has also been described as exerting other cytoprotective functions when applied at low concentrations, including inhibition of inflammatory pathways, and apoptosis (6, 32). Similarly, activation of HO-1, the enzyme responsible for endogenous CO production, also stimulates mitochondrial biogenesis and related cytoprotective effects (36, 43). The effects of HO-1/CO on mitochondrial biogenesis, such as NO, are mediated by PGC-1α and NRF-1/NRF-2-dependent activation of TFAM (36, 43, 44).
The transcriptional regulation of HO-1 responds to a broad spectrum of chemical and physical inducing agents, which include NO (via cGMP) (12, 37), and natural antioxidants, which activate transcription factor NF-E2-related factor-2 (Nrf2), a master regulator of the stress response (17). Among the latter include resveratrol (3,5,4′-trihydroxy-trans-stilbene), a polyphenolic antioxidant compound derived from grape skin, that is present at high concentrations in red wine. Several studies have reported that treatment with resveratrol can promote oxidative phosphorylation and mitochondrial biogenesis via activation of PGC-1α in endothelial cells (10), and in vivo (4, 21). Resveratrol stimulates HO-1 expression through the Nrf2 axis, and this activation is related to the anti-inflammatory and antioxidant effects (19, 49).
In the current study, we have examined the role of the HO-1/CO system in mediating mitochondrial biogenesis induced by NO, and by the antioxidant resveratrol. An understanding of the mechanisms underlying mitochondrial biogenesis may facilitate the development of therapeutics in diseases involving mitochondrial dysfunction (e.g., sepsis, metabolic syndrome).
Results
NO induces mitochondrial biogenesis through the induction of HO-1
NO can induce mitochondrial biogenesis in cells through the increased activation of sGC and subsequent production of cGMP, which leads to the enhanced expression of PGC-1α (16). Consistent with these observations, treatment of HepG2 cells with the NO donor compound S-nitroso-N-acetylpenicillamine (SNAP, 10–100 μM, 12 h) dose dependently increased the expression of PGC-1α, NRF-1, and TFAM mRNA in HepG2 cells (Supplementary Fig. S1A; Supplementary Data are available online at
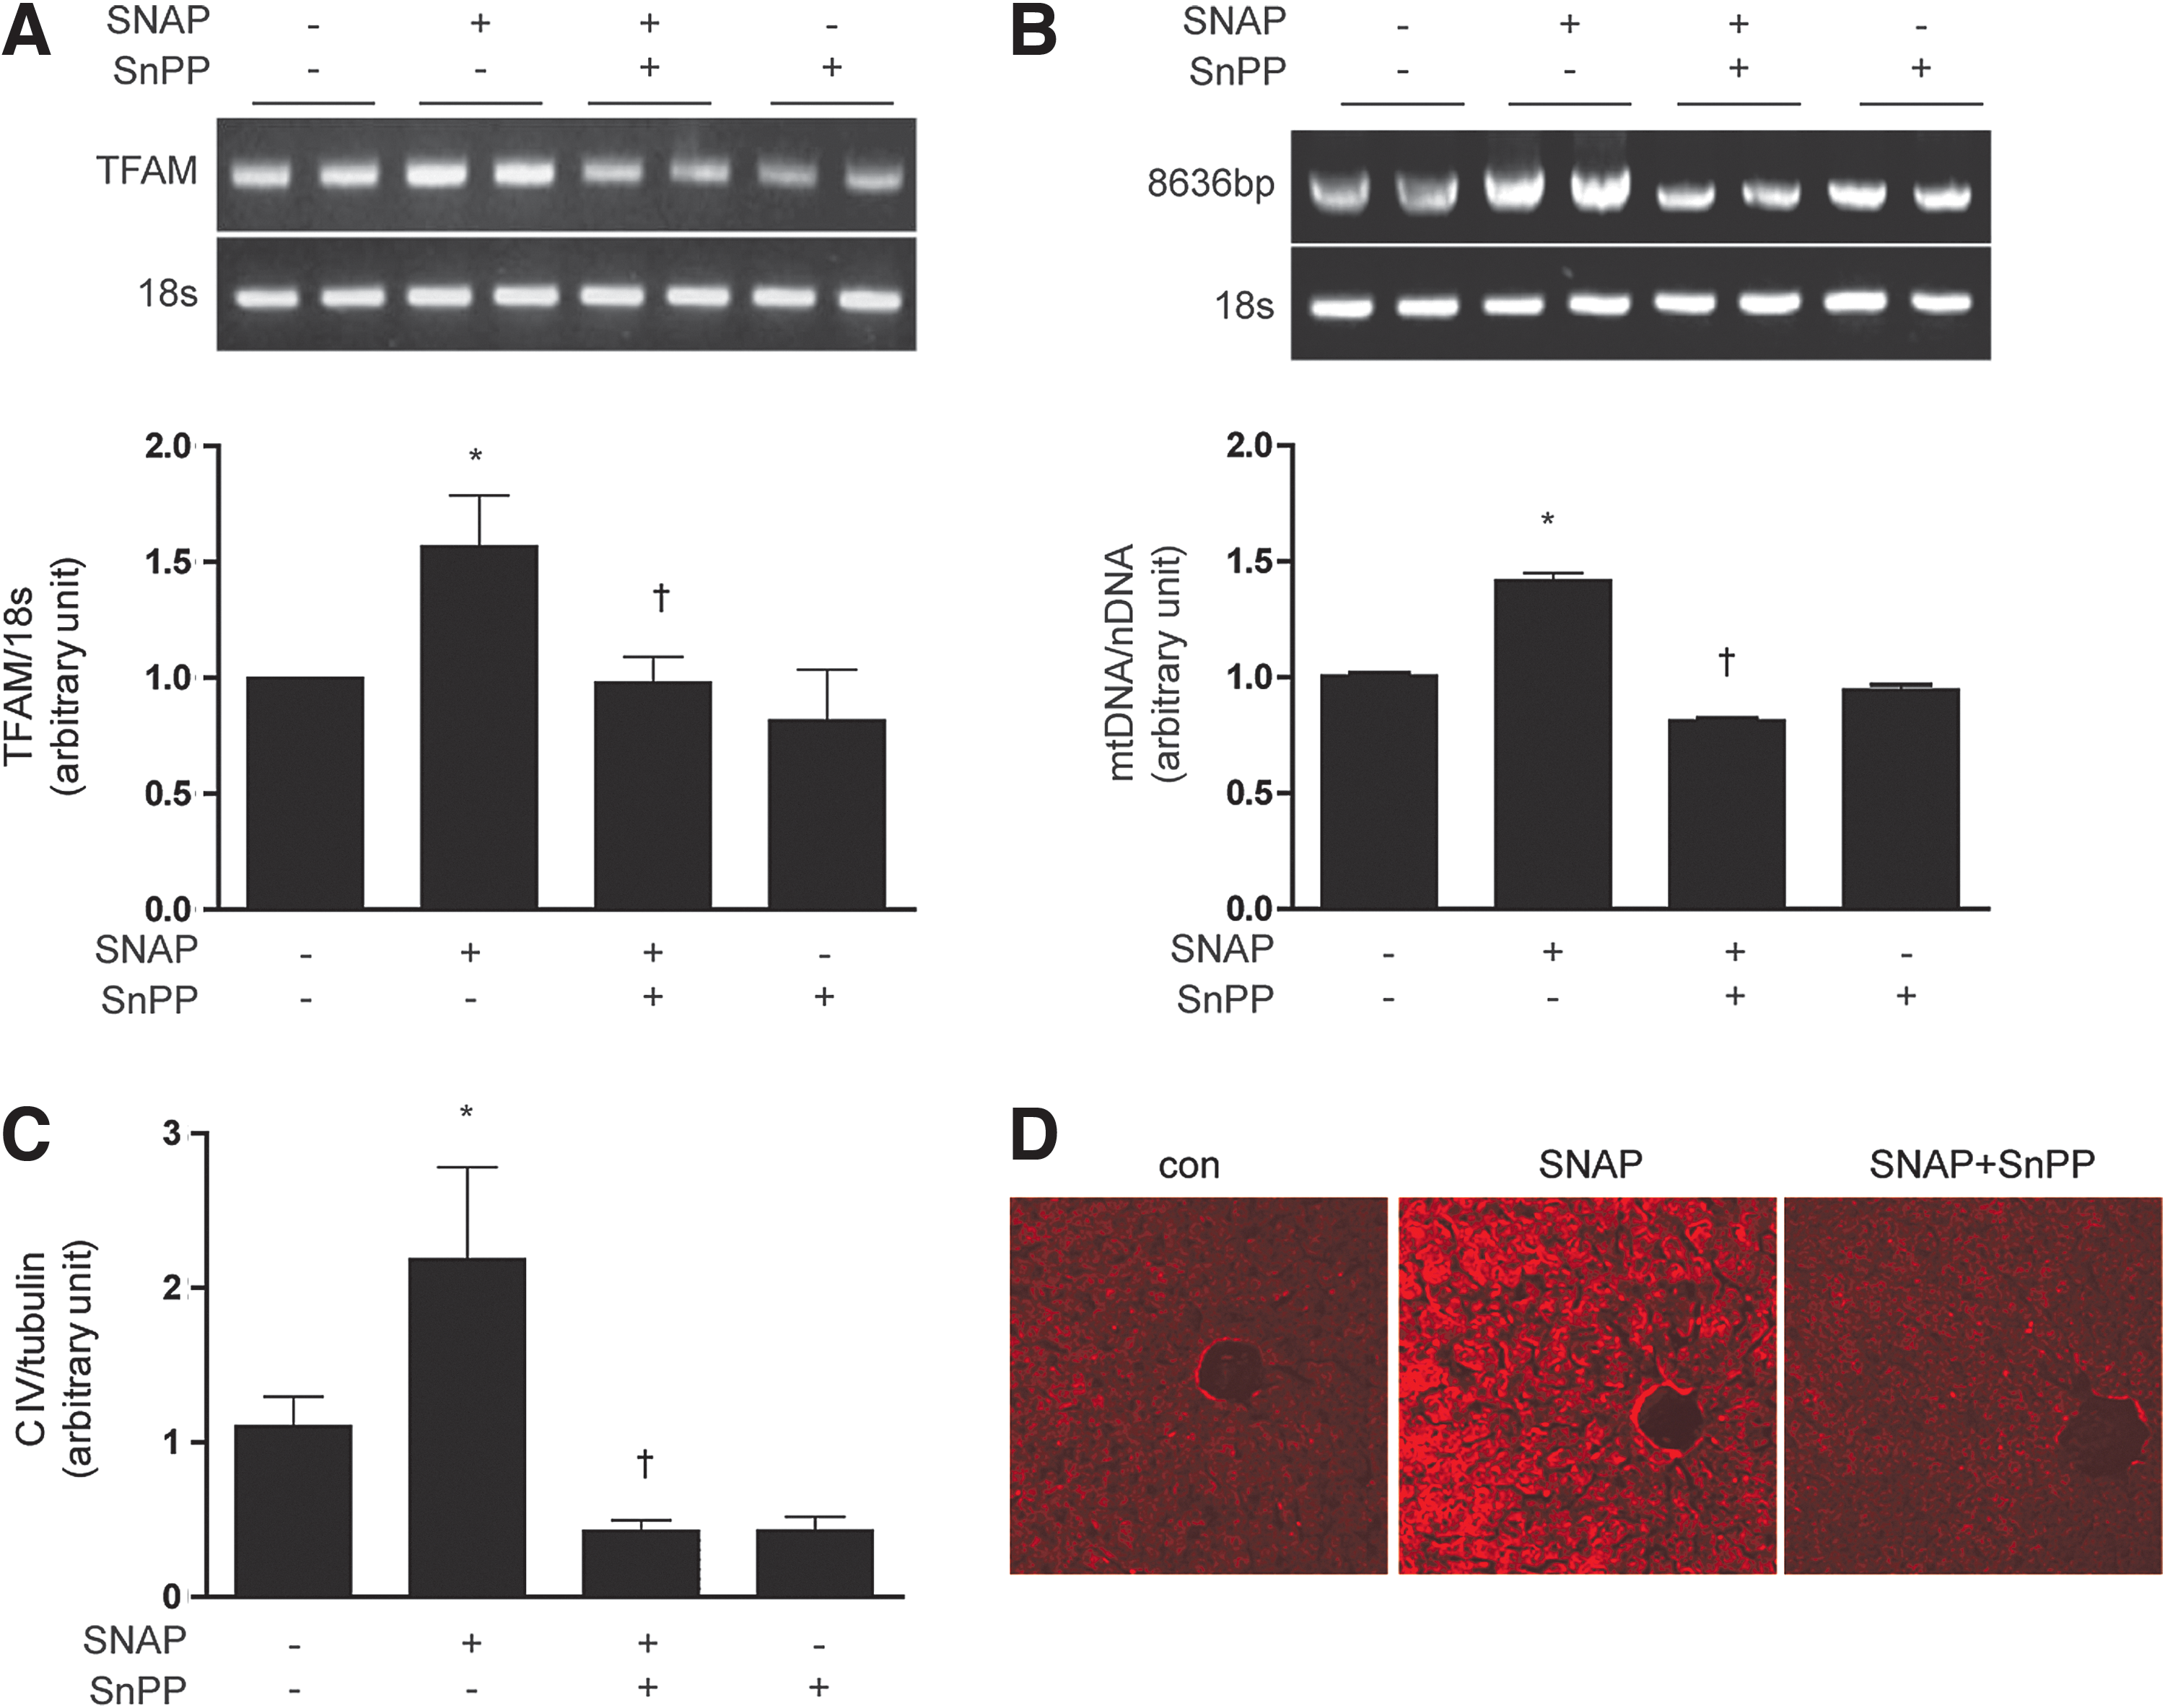
We tested the hypothesis that HO-1 exerts an intermediate role in the induction of mitochondrial biogenesis by NO. As expected, SNAP treatment (12 h) dose dependently increased the expression of HO-1 mRNA and protein in HepG2 cells (Supplementary Fig. S1E, F). Pretreatment of HepG2 cells with tin-protoporphyrin-IX (SnPP, 20 μM), a competitive inhibitor of HO activity, for 30 min before the addition of SNAP (100 μM, 12 h), reduced SNAP-induced PGC-1α, NRF-1, and TFAM mRNA expression (Fig. 1A). Consistent with inhibition of NO-dependent mitochondrial biogenesis, SnPP pretreatment (20 μM) also significantly reduced mtDNA content (Fig. 1B), 10-nonyl acridine orange (NAO) strained cells (Fig. 1C), Complex I, III, IV expression (Fig. 1D), and ATP production (Fig. 1E), which were induced by SNAP treatment. To further verify the effect of SNAP on the mitochondrial morphology and biogenesis via HO-1, mitochondria were detected by the MitoTracker stained or electron microscopy study in Supplementary Figure S1G. In order to confirm the effect of NO on mitochondria in normal hepatocytes, a normal mouse hepatocyte cell line, AML12 was incubated with SNAP after SnPP pretreatment. Similar results were obtained as HepG2 cells (Supplementary Fig. S1H–J). To evaluate that HO-1 specifically, and not HO-2 or secondary targets of SnPP, participated in NO-dependent mitochondrial biogenesis, HepG2 cells were transfected with small interference RNA (siRNA) which were specific for HO-1 or with control (scramble) siRNA before treatment with SNAP (Fig. 1F–H). The siRNA-dependent knockdown of HO-1 expression was confirmed by reverse transcriptase-polymerase chain reaction (RT-PCR) (Fig. 1F) and by western immunoblot analysis (Fig. 1H). Consistent with results observed with SnPP pre-treatment, HO-1 siRNA treatment down-regulated the mRNA levels of PGC-1α, NRF-1, and TFAM (Fig. 1F) and reduced mtDNA content (Fig. 1G) that were up-regulated by SNAP treatment. Furthermore, HO-1 siRNA transfection abrogated the induction of Complex I, III, and IV expression after SNAP treatment (Fig. 1H). To investigate the effects of NO on mitochondrial biogenesis in vivo, C57BL/6 mice were injected with various doses of SNAP (1.5, 3, or 6 mg/kg, intraperitoneally [i.p.]). Markers of mitochondrial biogenesis were assessed in mouse liver at 24 h post-injection. SNAP dose dependently increased the expression of PGC-1α, NRF-1, and TFAM mRNA in mouse liver (Supplementary Fig. S1K). SNAP treatment induced mitochondrial biogenesis in mouse liver as evidenced by dose-dependent increases in total mtDNA content (Supplementary Fig. S1L), and the increased expression of COX IV (Supplementary Fig. S1M), with maximal responses occurring at doses of 3–6 mg/kg. Next, we confirmed the requirement for HO activity in NO-induced mitochondrial biogenesis in vivo. C57BL/6 mice were injected with SnPP (50 μmol/kg), before an injection with SNAP. The effects of SNAP on mitochondrial biogenesis in the liver were completely blocked by a pre-injection with SnPP, as evidenced by the inhibition of PGC-1α, NRF-1, and TFAM mRNA expression (Fig. 2A), reduction of mtDNA content (Fig. 2B), reduced expression of COX IV (Fig. 2C), and the decrease of mitochondria stained with MitoTracker (Fig. 2D). These results suggest that mitochondrial biogenesis augmented by NO is regulated in an HO-1 activity-dependent manner in vivo. In conclusion, these results support an intermediate role for HO-1 expression in NO-induced mitochondrial biogenesis.

NO induces mitochondrial biogenesis through a cGMP-dependent pathway
The up-regulation of sGC resulting in the subsequent increased production of cGMP is a primary target of NO action (46). We, therefore, investigated whether mitochondrial biogenesis induced by NO and the associated increase in HO-1 would be dependent on cGMP. HepG2 cells were pretreated with 1H-[1,2,4]oxadiazolo[4,3-a]quinoxalin-1-one (ODQ) (1 μM), an inhibitor of sGC, before exposure to SNAP (100 μM, 12 h). ODQ antagonized the effects of SNAP on mitochondrial biogenesis in HepG2 cells, as evidenced by a reduction in PGC-1α, NRF-1, and TFAM mRNA expression (Fig. 3A), total mtDNA content (Fig. 3B), MitoTracker stained mitochondria (Fig. 3C), the levels of Complex I, III, IV (Fig. 3D), and ATP production (Fig. 3E). ODQ also antagonized the inducing effects of SNAP on HO-1 mRNA and protein expression in HepG2 cells (Supplementary Fig. S2A, B). The cGMP analog, 8-bromoguanosine 3′,5′-cyclic monophosphate (8-Br-cGMP) (10 μM, 12 h), increased mitochondrial biogenesis in HepG2 cells, in a fashion similar to that induced by SNAP, as evidenced by increased PGC-1α, NRF-1, and TFAM mRNA expression (Supplementary Fig. S2C), and COX IV expression (Supplementary Fig. S2D). In addition, 8-Br-cGMP induced HO-1 mRNA and protein in HepG2 cells (Supplementary Fig. S2C, D).
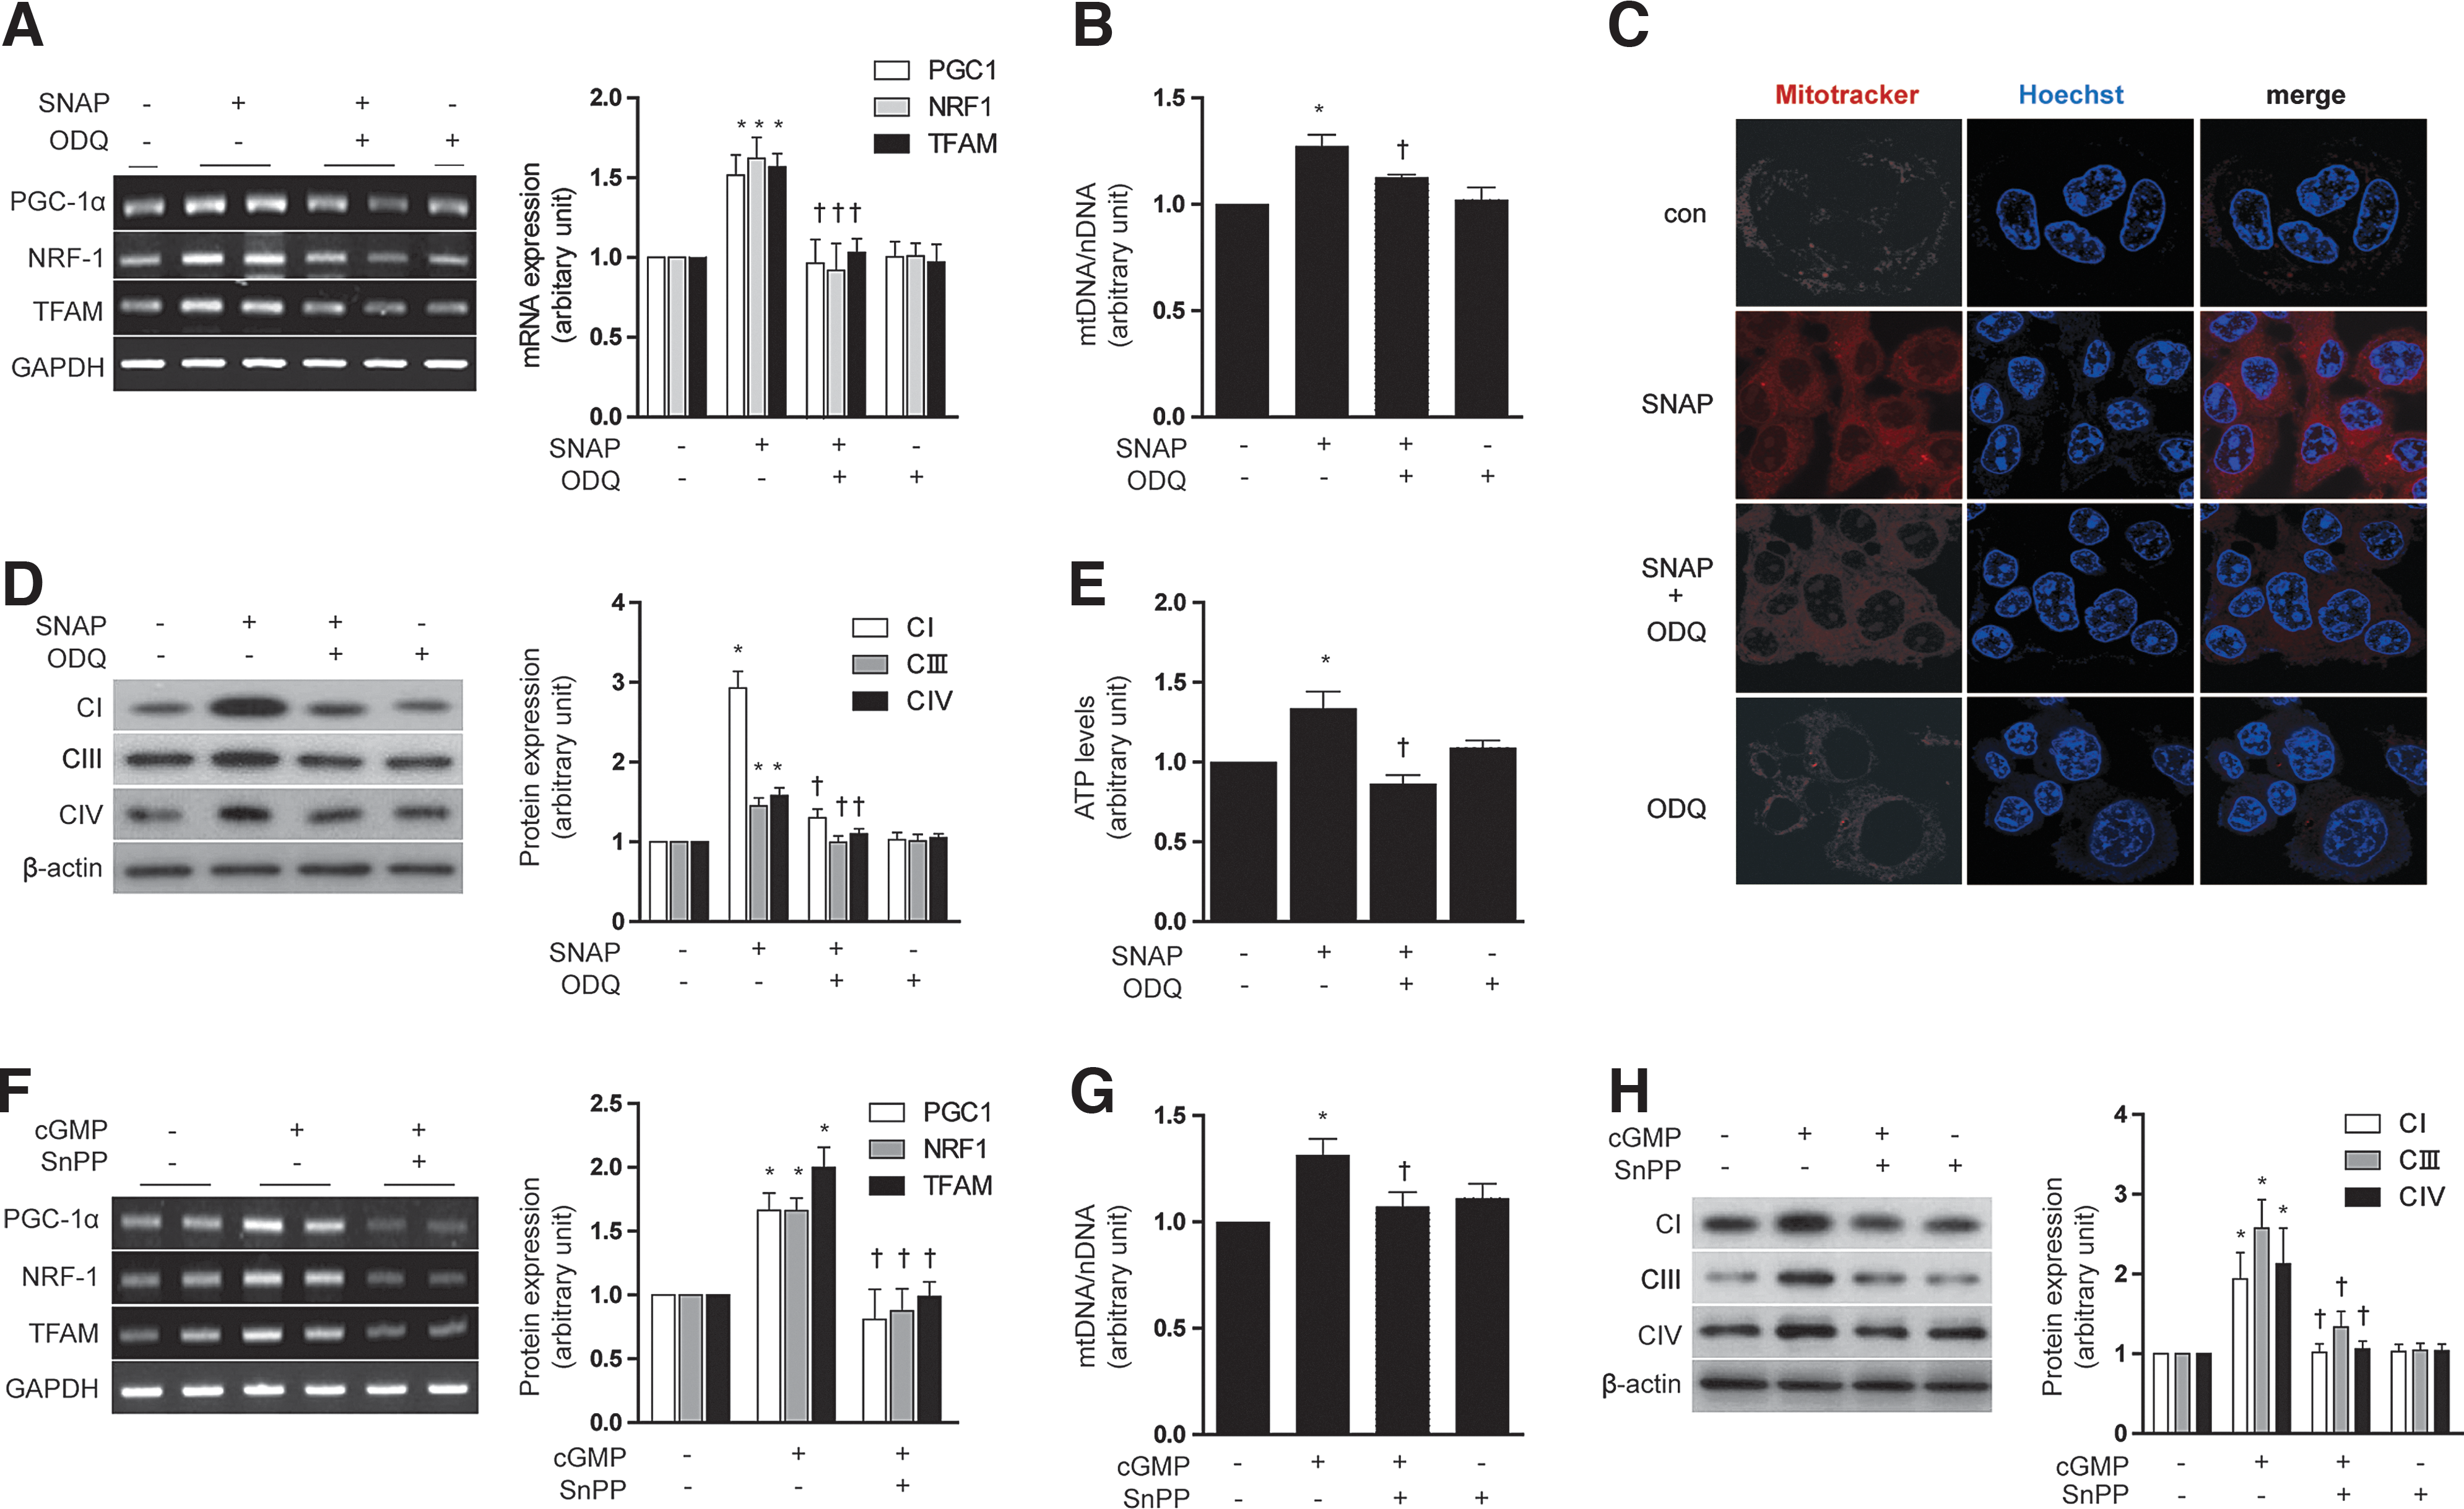
To investigate the involvement of HO activity in mediating cGMP-induced mitochondrial biogenesis, HepG2 cells were pre-treated with SnPP (20 μM). SnPP antagonized the effects of 8-Br-cGMP (10 μM) on mitochondrial biogenesis in HepG2 cells, as evidenced by a reduction in PGC-1α, NRF-1, and TFAM mRNA expression (Fig. 3F), total mtDNA content (Fig. 3G), and the levels of Complex I, III, IV (Fig. 3H).
These data taken together indicate that stimulation of mitochondrial biogenesis by SNAP was associated with activation of the sGC/cGMP axis, and the cGMP-dependent induction of HO activity.
Resveratrol induces mitochondrial biogenesis through the sequential production of NO and CO
Next, the effect of the natural antioxidant resveratrol on mitochondrial biogenesis was evaluated in HepG2 cells. Treatment of HepG2 cells with resveratrol (1 μM) time dependently increased the expression of PGC-1α, NRF-1, and TFAM mRNA in HepG2 cells, with apparent maxima at 12–18 h, followed by a decay to control values after 24 h of exposure (Supplementary Fig. S3A). Resveratrol treatment (0.1–10 μM) also dose dependently affected the expression of these transcripts, with an apparent maximum at 0.1 μM (Supplementary Fig. S3B). Resveratrol (0.1–10 μM) induced mitochondrial biogenesis in HepG2 cells as represented by increases in total mtDNA content (Supplementary Fig. S3C) and COX IV expression (Supplementary Fig. S3D).
Resveratrol is a known natural inducer of HO-1 expression, which, in turn, mediates the anti-inflammatory and antioxidant effects of this compound (19, 49). Therefore, we hypothesized that HO-1 could play an intermediate role in mitochondrial biogenesis induced by resveratrol. Resveratrol treatment time dependently and dose dependently induced HO-1 mRNA accumulation (Supplementary Fig. S3E), and markedly induced HO-1 protein expression in HepG2 cells (Supplementary Fig. S3F).
To investigate the involvement of HO-1 in mediating resveratrol-induced mitochondrial biogenesis, HepG2 cells were pre-treated with SnPP (20 μM), or transfected with HO-1-specific siRNA or corresponding control siRNA. Pre-treatment with SnPP (20 μM) antagonized the effects of resveratrol (1 μM) on mitochondrial biogenesis in HepG2 cells and AML12 cells, as shown by reductions in PGC-1α, NRF-1, and TFAM mRNA expression (Fig. 4A and Supplementary Fig. S3G, M for AML12), total mtDNA content (Fig. 4B and Supplementary Fig. S3N for AML12), Complex I, III, IV expression (Fig. 4C and Supplementary Fig. S3H, O for AML12), NAO-stained mitochondria (Fig. 4D), and ATP levels (Fig. 4E). To further verify the resveratrol-induced mitochondrial morphology and biogenesis, MitoTracker staining or an electron microscopy study was performed (Supplementary Fig. S3I). We also tested the potential for resveratrol to modulate mitochondrial biogenesis in vivo. Resveratrol augmented the expression of mitochondrial biogenesis factors such as PGC-1α, NRF-1, and TFAM mRNA, whereas in the presence of SnPP, these responses were partially ameliorated (Fig. 4F and Supplementary Fig. S3J). Resveratrol treatment also induced hepatic mtDNA content (Fig. 4G and Supplementary Fig. S3K), Complex I, III, IV expression (Fig. 4H and Supplementary Fig. S3L), and mitochondria stained with MitoTracker (Fig. 4I) in vivo, responses that were inhibited by pretreatment with SnPP.
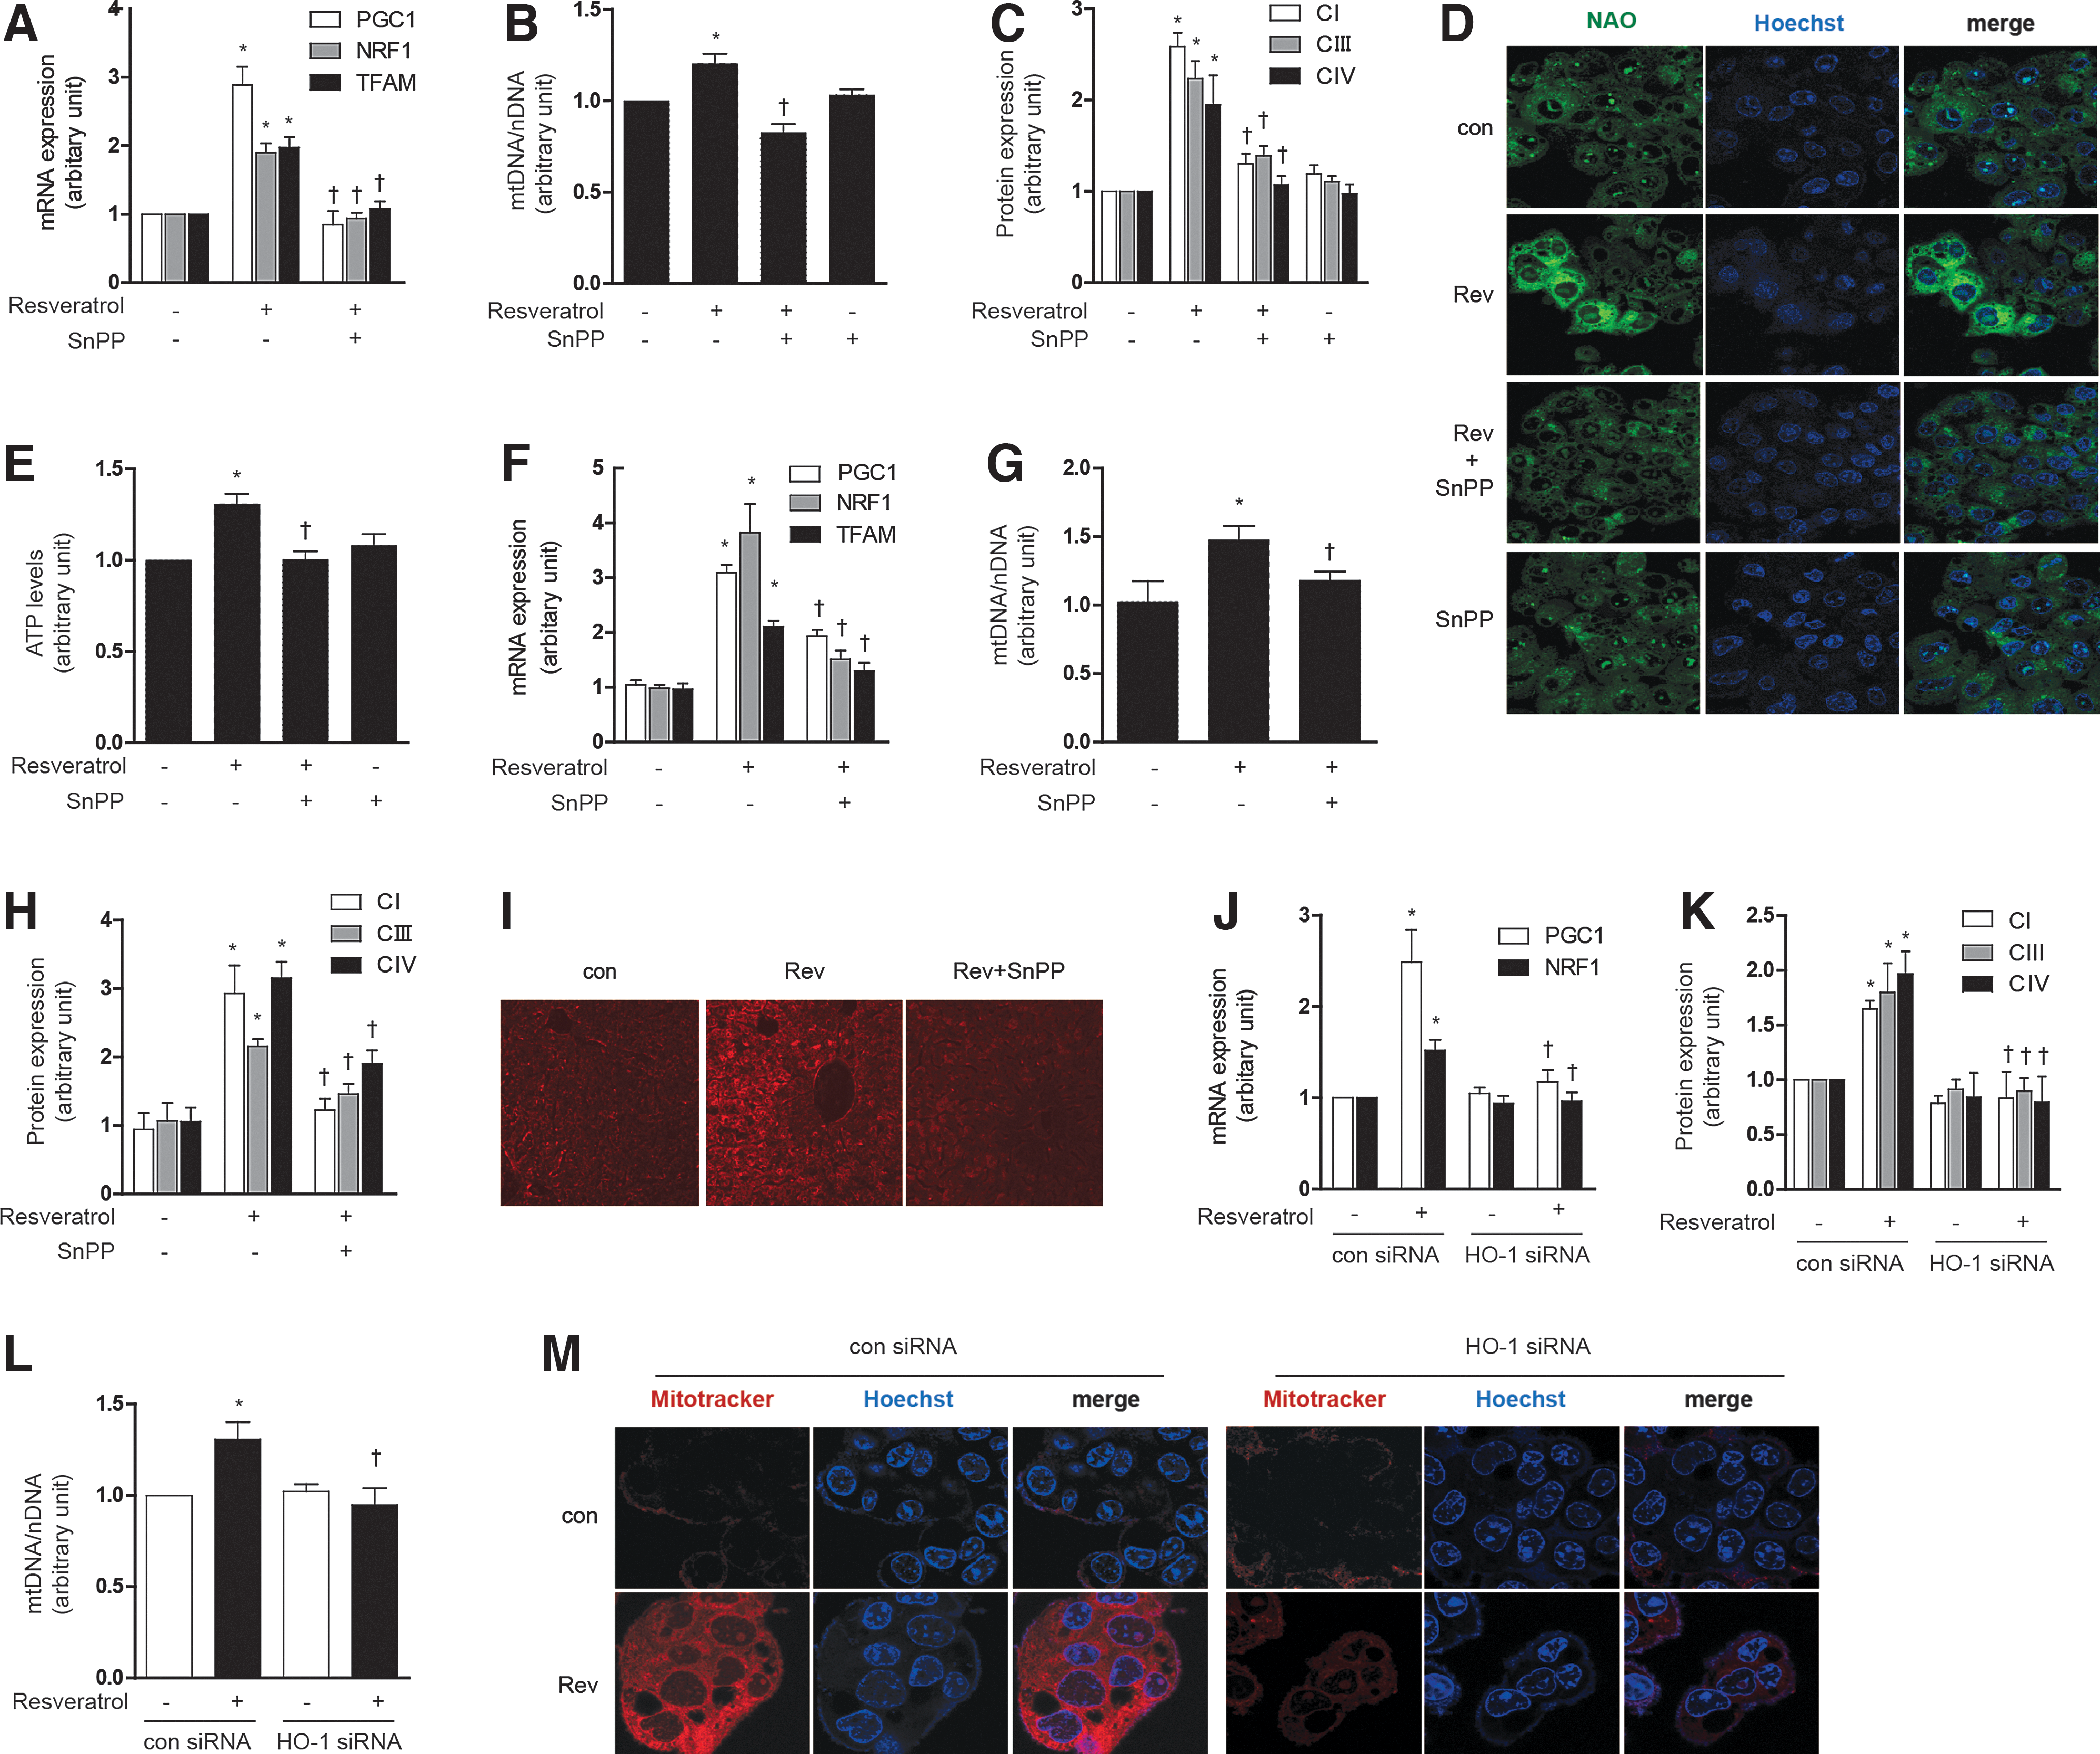
Similarly, HO-1 siRNA treatment down-regulated PGC-1α and NRF-1 mRNA expression (Fig. 4J and Supplementary Fig. S3P), Complex I, III, IV expression (Fig. 4K and Supplementary Fig. S3Q), mtDNA content (Fig. 4L), and MitoTracker-stained mitochondria (Fig. 4M), after resveratrol treatment. These experiments suggest that HO-1 plays an intermediate role in the effects of resveratrol on mitochondrial biogenesis in hepatocytes.
Resveratrol can induce mitochondrial biogenesis in endothelial cells via a pathway involving the up-regulation of endothelial nitric oxide synthase (eNOS) (10). In hepatocytes, resveratrol can increase the expression of both iNOS and eNOS and regulate NO production (31). Therefore, we hypothesized that the stimulation of mitochondrial biogenesis in HepG2 cells by resveratrol would require the eNOS/NO/cGMP pathway.
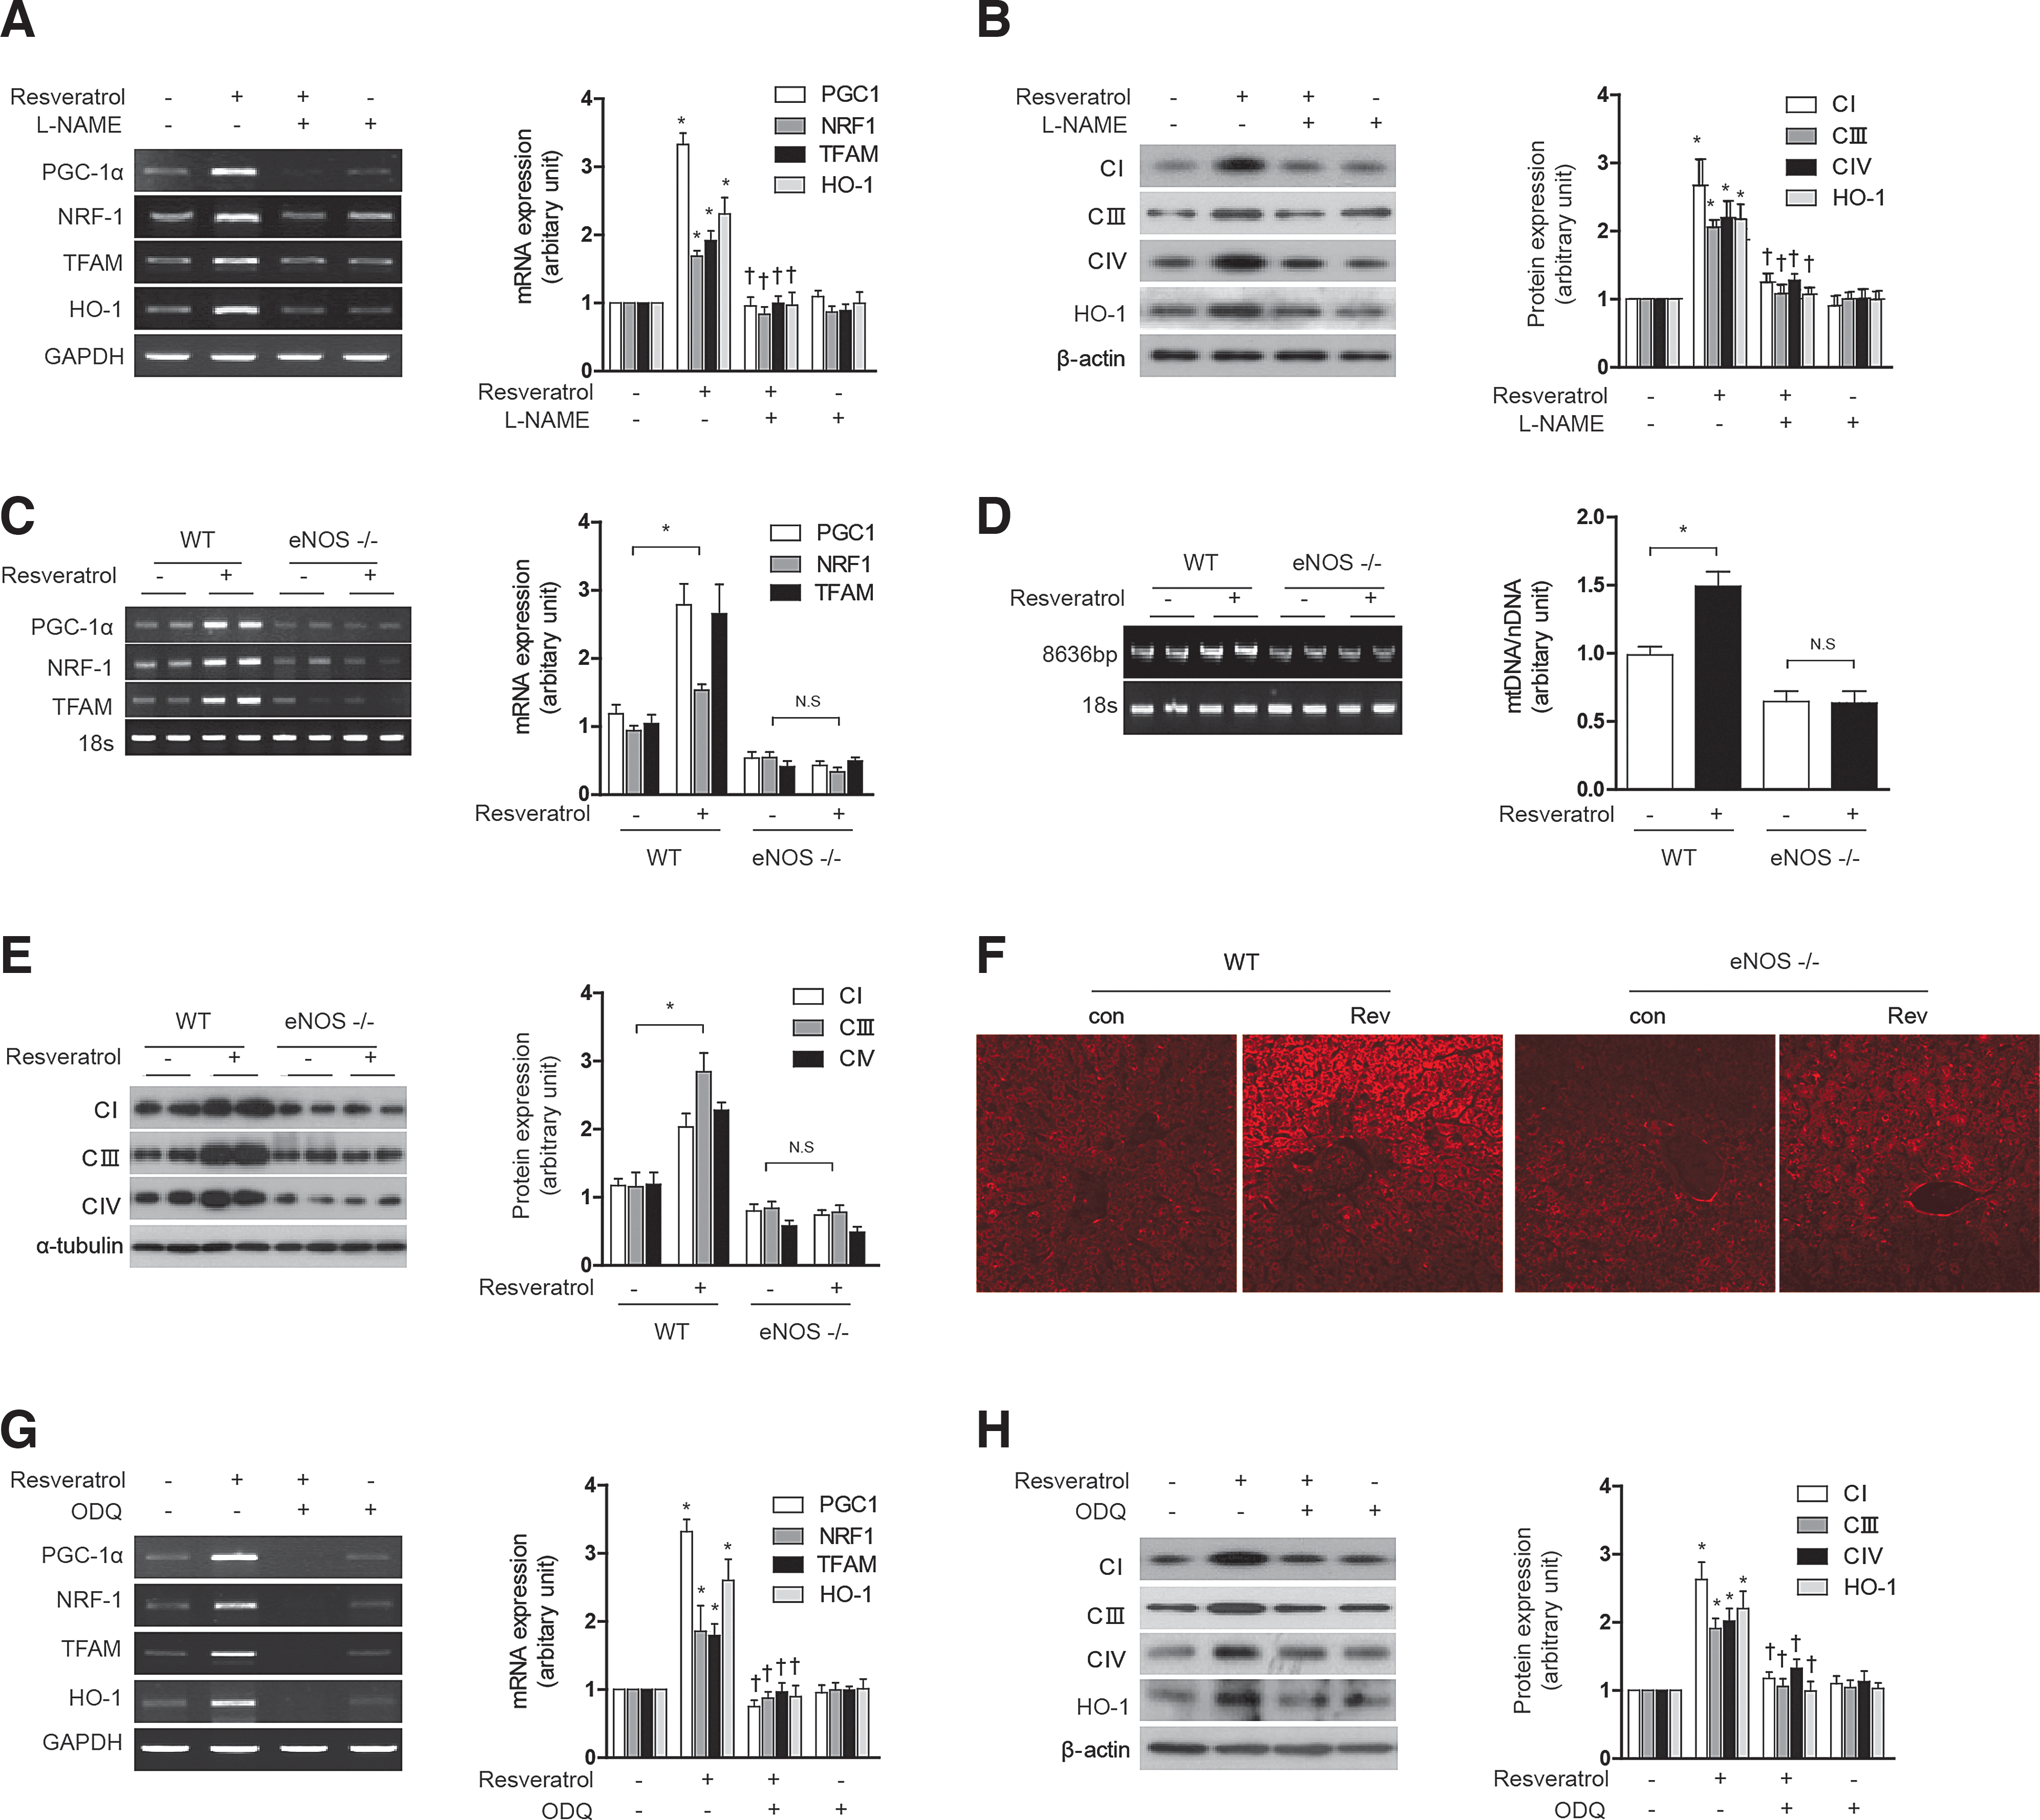
Resveratrol increased the time- and concentration-dependent expression of eNOS mRNA, protein expression, and nitrite production in HepG2 cells (Supplementary Fig. S4A–C). Pretreatment of HepG2 cells and AML12 with N-nitro-
CO directly activates mitochondrial biogenesis-associated transcriptional coactivators and increases mtDNA and protein
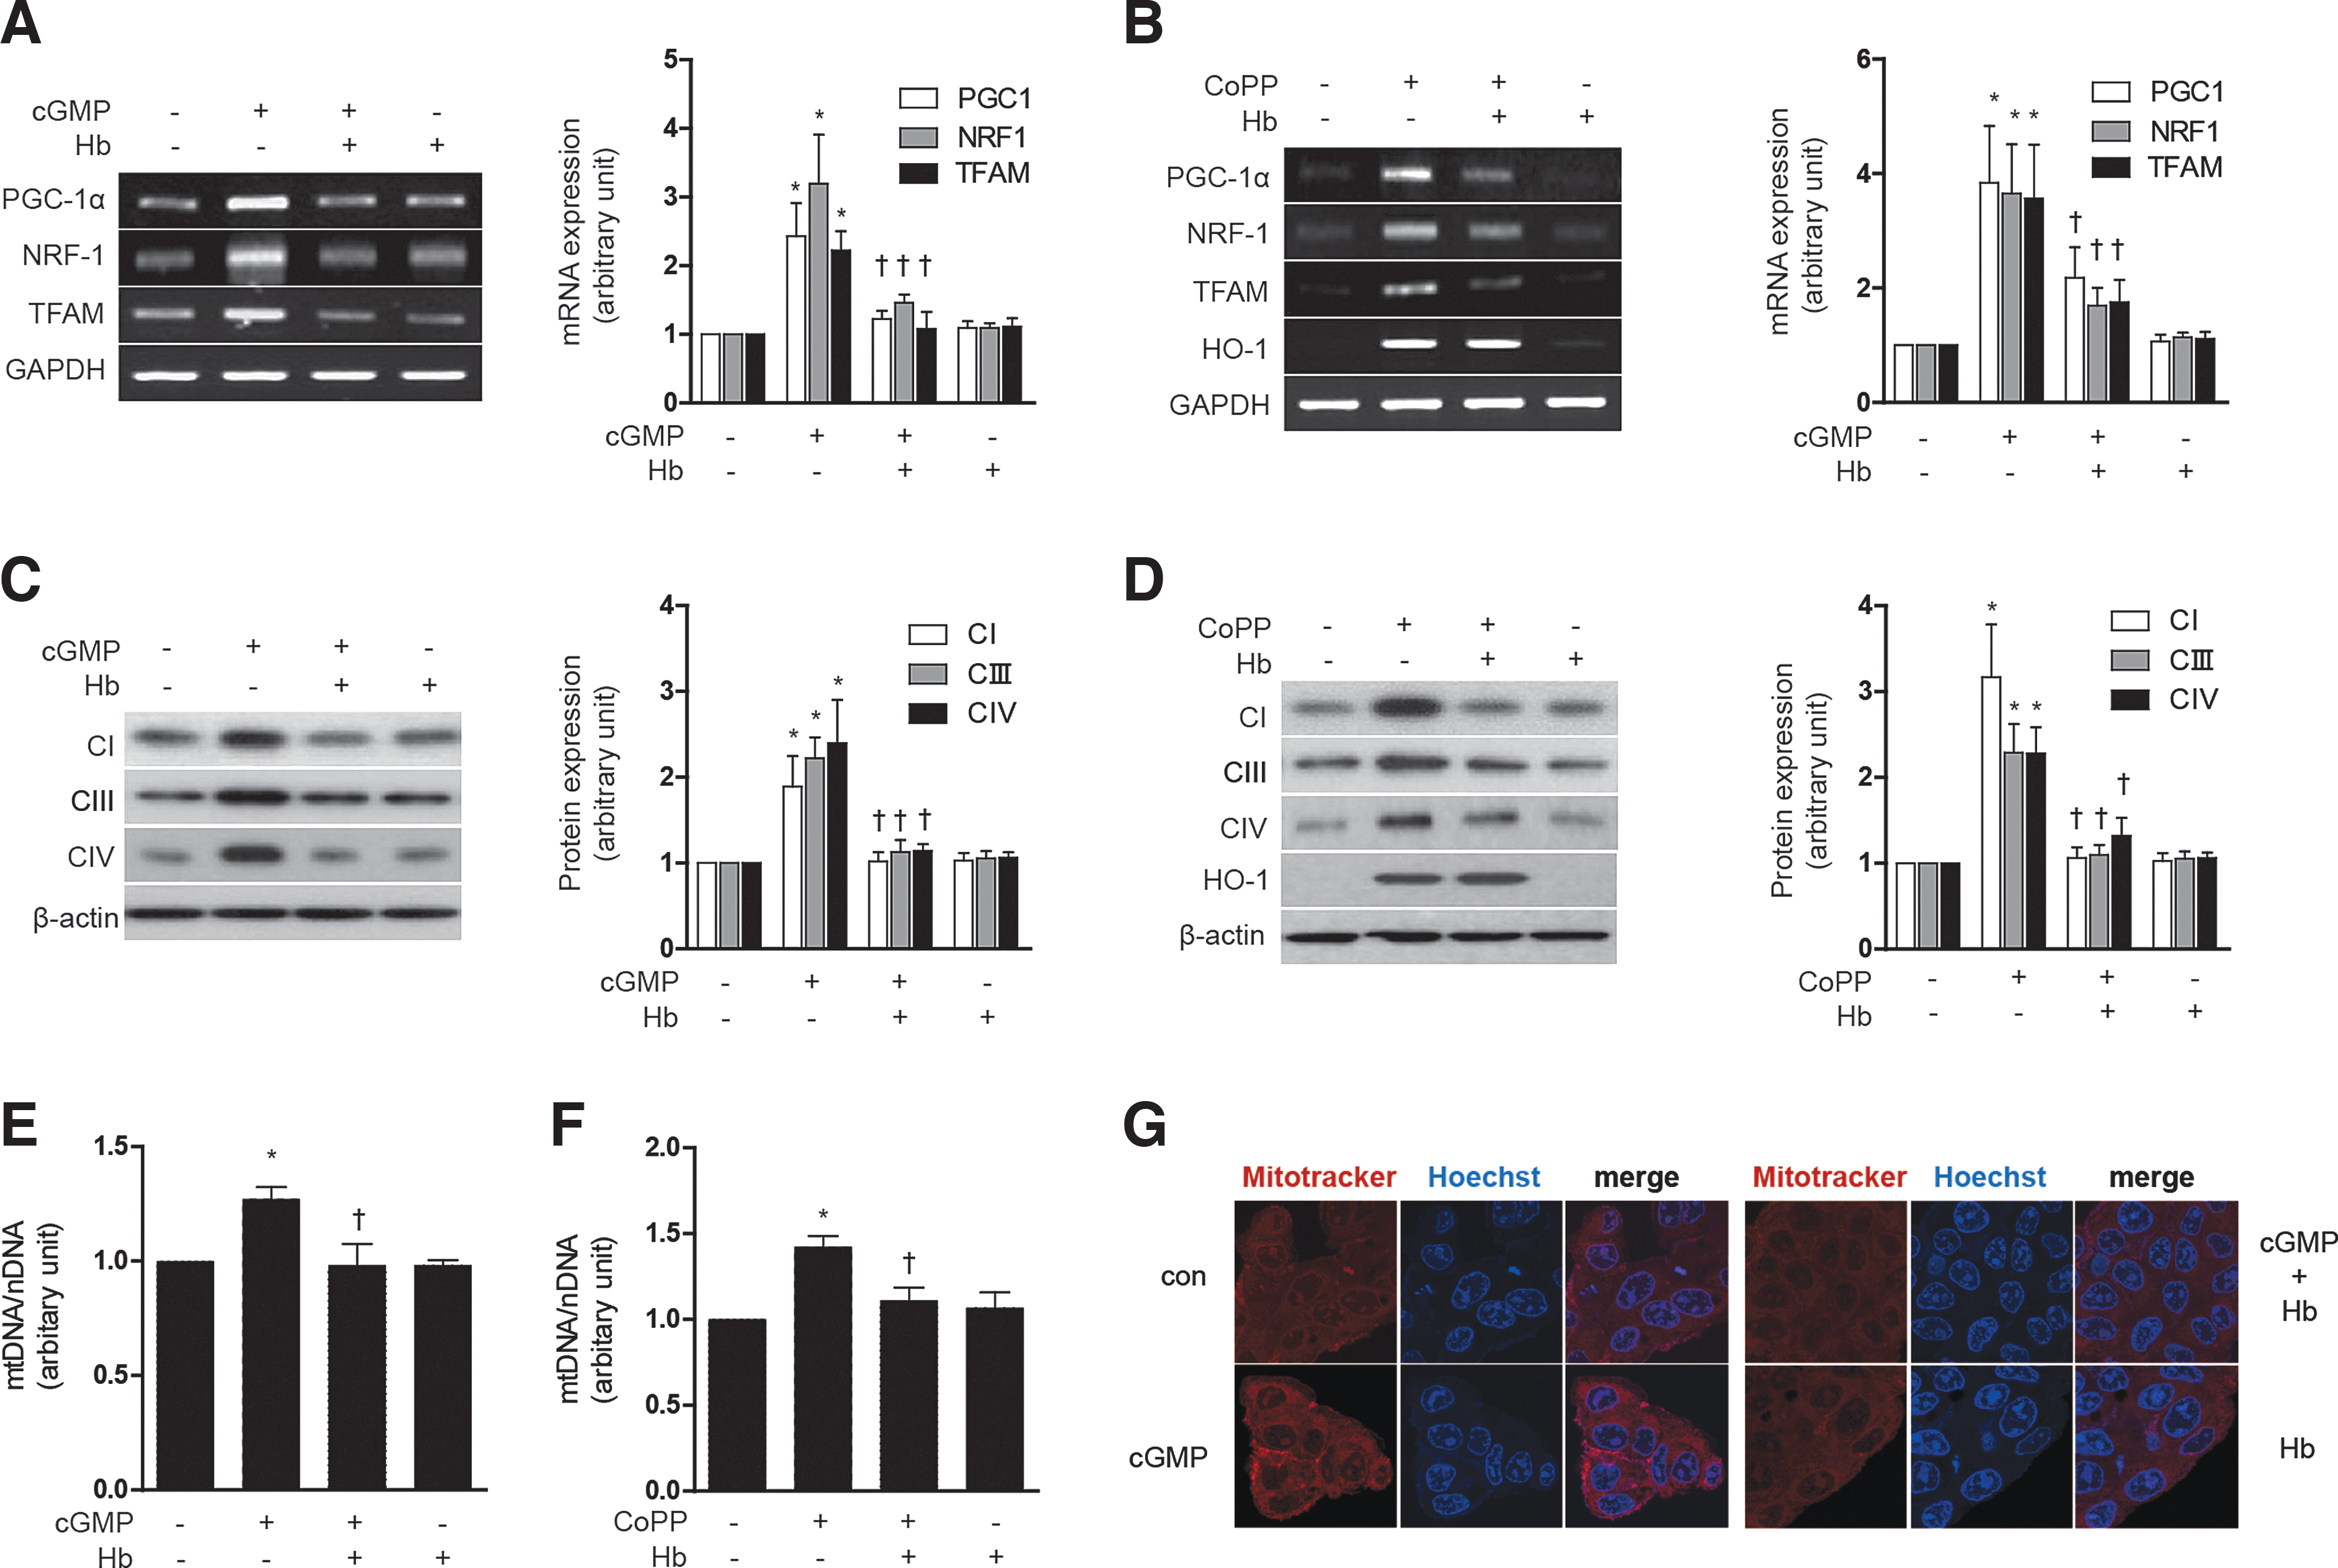
Since HO-1 enzymatic activity is required for mitochondrial biogenesis, we hypothesized that this effect is mediated through the products of HO-1-dependent heme catalytic activity (i.e., CO). First, we identified whether CO could directly activate mitochondrial biosynthesis in HepG2 cells, by exposing these cells to CORM-3, a CO-releasing molecule. CORM-3 (20 μM) increased PGC-1α, NRF-1, and TFAM mRNA expression, as well as HO-1 mRNA levels. Similarly, HO-1 induction with cobalt protoporphyrin (CoPP) treatment (20 μM) also increased the mRNA expression of these transcription factors for mitochondrial biogenesis (Supplementary Fig. S5A). Mitochondrial biogenesis induced by either CORM-3 or CoPP was confirmed by the dose-dependent induction in the expression of COX IV (Supplementary Fig. S5B). Given that HO-1 expression occurs as the result of treatment with either 8-Br-cGMP or CoPP (Supplementary Figs. S2C, D and S5B), we hypothesized that the downstream production of CO mediates mitochondrial biogenesis in response to these agents.
To scavenge CO in our experimental setting, we have utilized hemoglobin (Hb) as previously described (32). Treatment with Hb (20 μM) antagonized the effects of either 8-Br-cGMP or CoPP on mitochondrial biogenesis in HepG2 cells, as evidenced by inhibition of PGC-1α, NRF-1, and TFAM mRNA expression (Fig. 6A, B), as well as a reduction in Complex I, III, IV protein expression (Fig. 6C, D) and total mtDNA content (Fig. 6E, F). Mitochondrial biogenesis was confirmed by MitoTracker staining after treatment with Hb and 8-Br-cGMP (Fig. 6G). Collectively, these data demonstrate that induction of mitochondrial biogenesis can be elicited by agents which induce HO-1, or directly deliver CO, and furthermore that the effects of HO-1 were likely dependent on CO.
Modulation of the HO-1/CO system induces mitochondrial biogenesis through Akt/Nrf2 activation
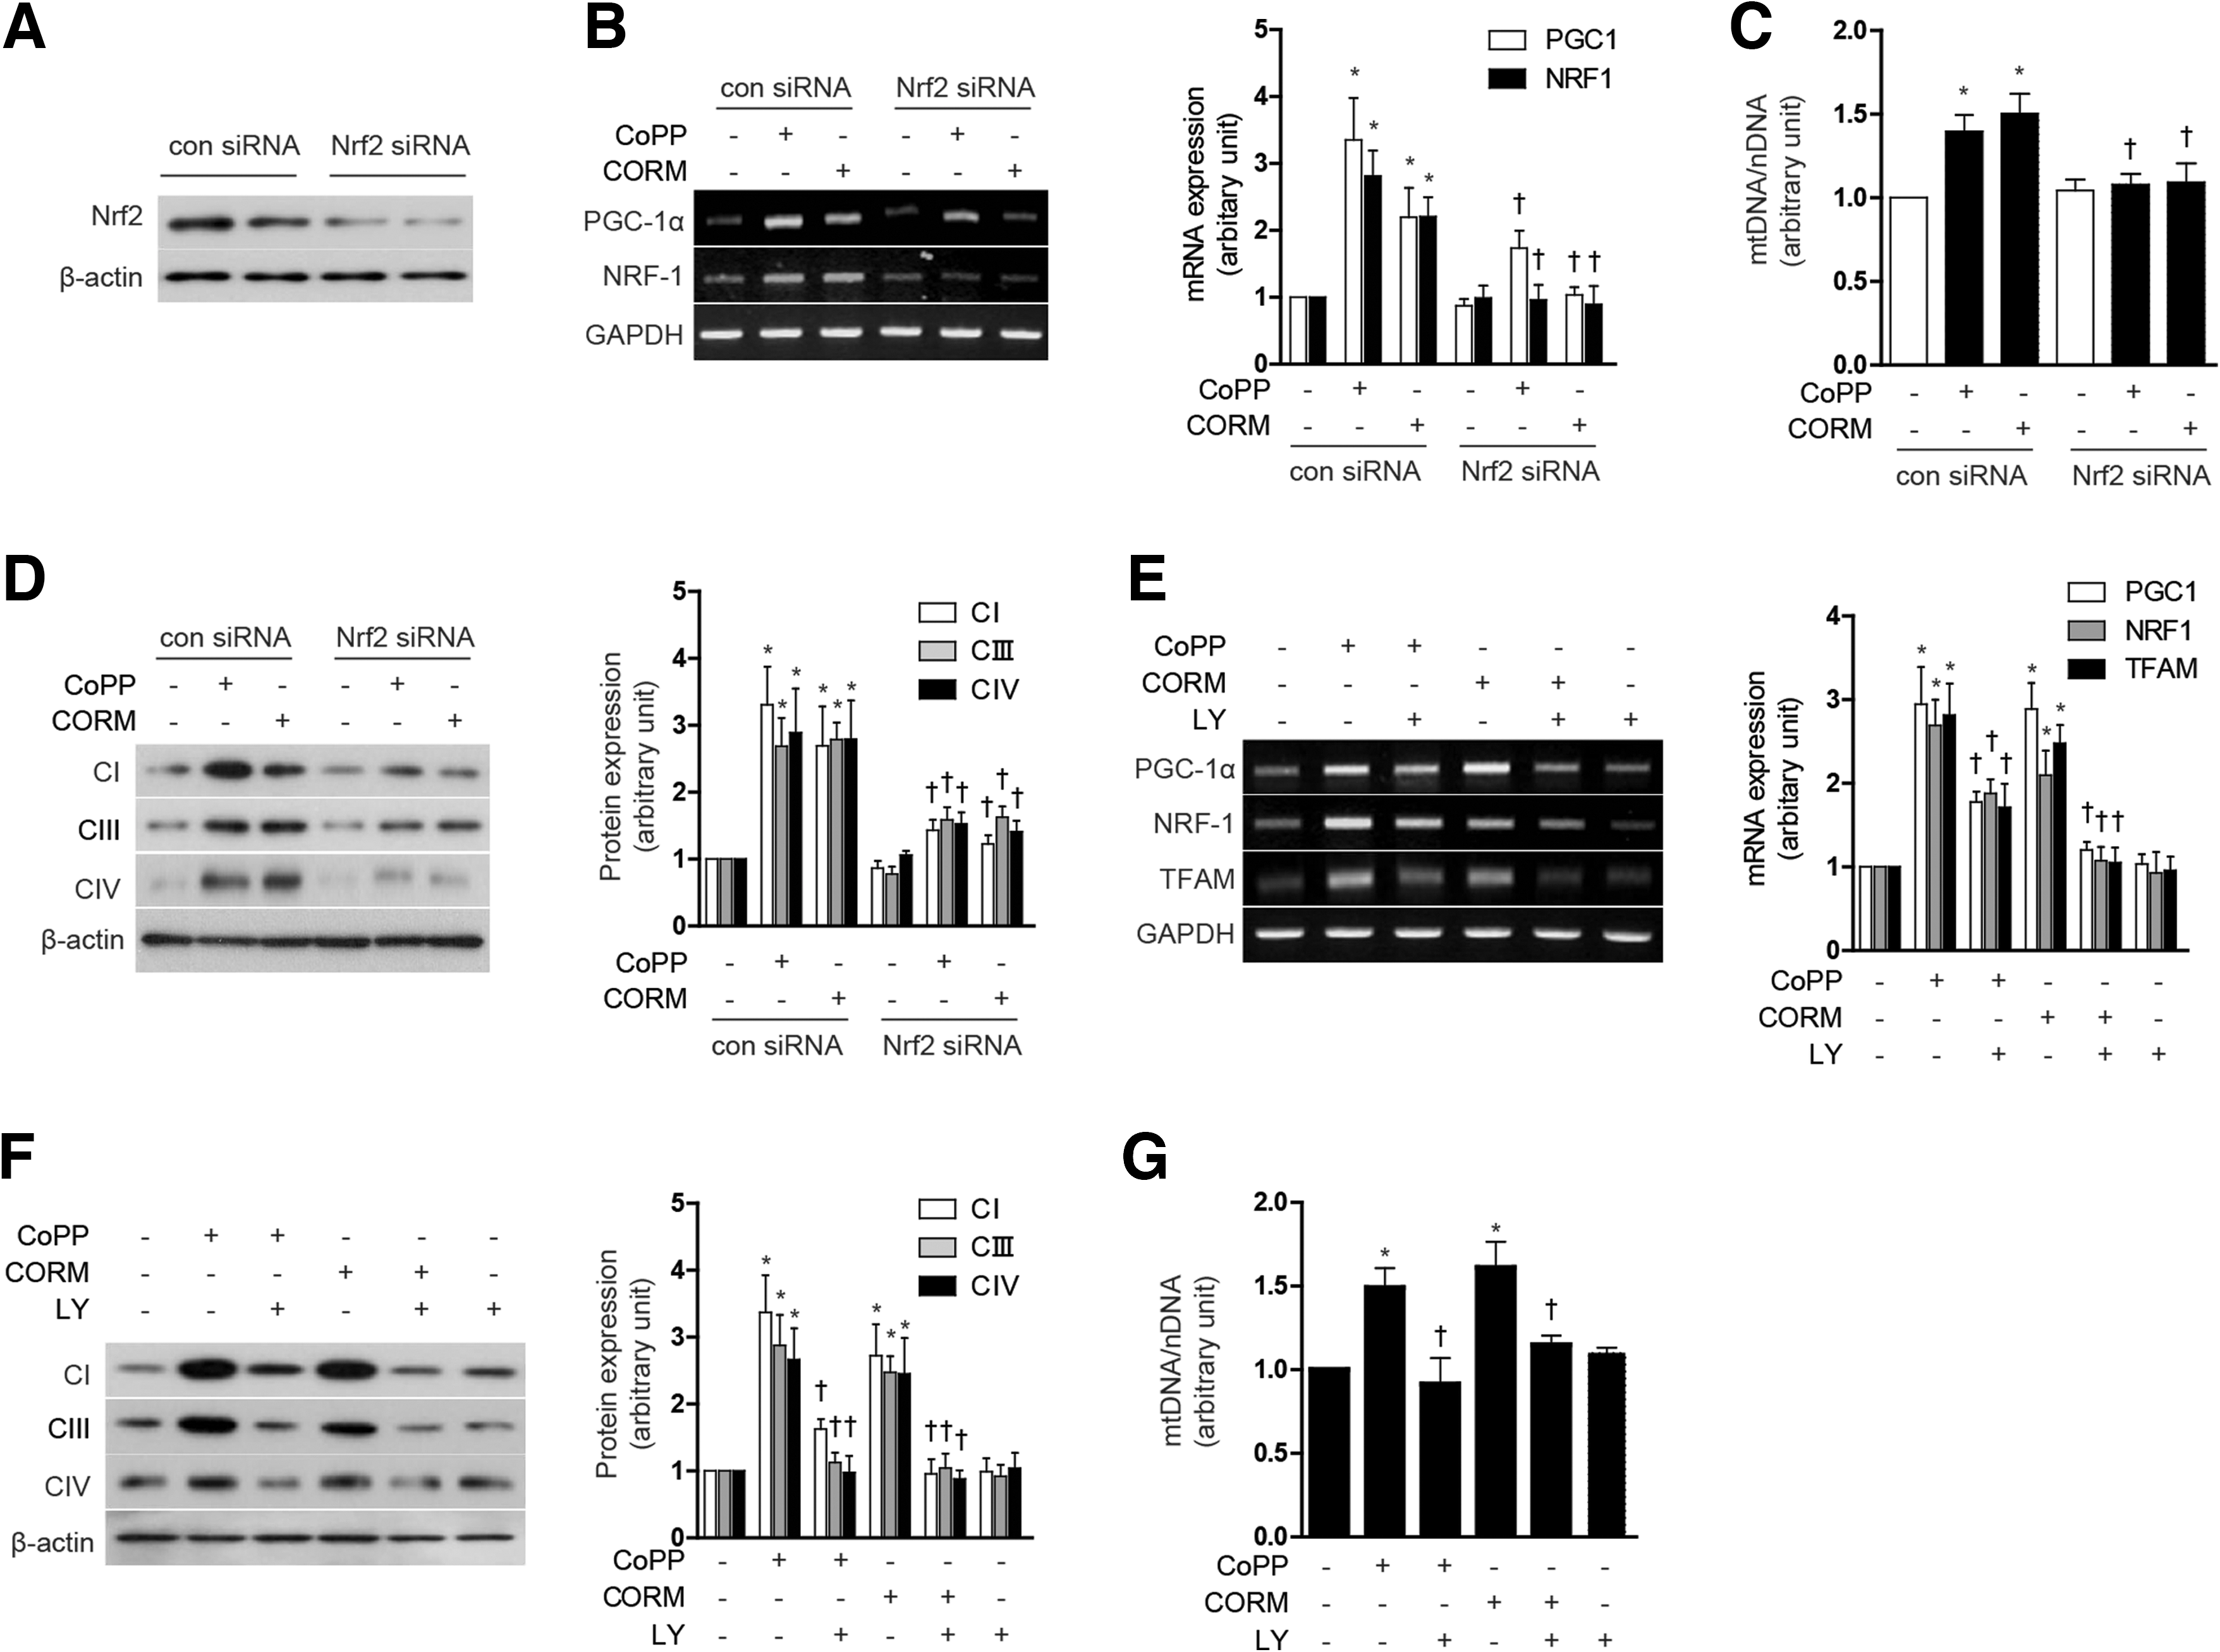
CO has been previously shown to promote mitochondrial biogenesis through a mechanism dependent on Akt phosphorylation at S473, and downstream Nrf2 activation (35). We further investigated whether the Akt/Nrf2 axis was involved in the regulation of mitochondrial biogenesis by modulation of the HO-1/CO system. First, to confirm whether nuclear translocation of Nrf2 could be induced by modulation of the HO-1/CO system, we measured Nrf2 levels in the cytoplasmic and nuclear fractions after treatment of HepG2 cells with either CoPP or CORM-3. Treatment with CoPP or CORM-3 for 12 h dose dependently increased nuclear localization of Nrf2 and concomitantly decreased cytosolic levels of Nrf2 (Supplementary Fig. S6A). To evaluate the requirement for Nrf2 in mitochondrial biogenesis in response to CoPP or CORM-3, HepG2 cells were transfected with Nrf2-specific siRNA or control (scramble) siRNA. The effectiveness of Nrf2 knockdown on Nrf2 protein levels was confirmed by western immunoblot analysis (Fig. 7A). Suppression of Nrf2 by siRNA knockdown abolished the inducing effect of CoPP (20 μM) and CORM-3 (20 μM) on mitochondrial biogenesis. In Nrf2 knockdown cells, there was a significant reduction in nuclear regulation of PGC-1α and NRF-1 mRNA expression (Fig. 7B), reduction in total mtDNA content (Fig. 7C), Complex I, III, IV protein expression (Fig. 7D), and MitoTracker-stained mitochondria (Supplementary Fig. S6B), elicited by either agent. Next, we analyzed the involvement of the phosphatidylinositol-3-kinase (PI3K)/Akt pathway in the induction of mitochondrial biogenesis by agents that modulate the HO-1/CO system. Treatment with CoPP and CORM-3 induced phosphorylation of Akt in a dose-dependent manner (Supplementary Fig. S6C). To determine whether Akt regulates mitochondrial biogenesis in response to CoPP or CORM-3 (20 μM), cells were pre-treated with LY294002 (25 μM), an inhibitor of PI3K. The suppression of Akt activity by LY294002 treatment significantly reduced PGC-1α, and NRF-1 mRNA expression (Fig. 7E), total mtDNA content (Fig. 7F), Complex I, III, IV protein expression (Fig. 7G), and MitoTracker-stained mitochondria (Supplementary Fig. S6D) elicited by either CoPP or CORM-3. These results suggest that Nrf2-Akt activation is important for the stimulation of mitochondrial biogenesis by activation of the HO-1/CO axis.
Resveratrol induces mitochondrial biogenesis through the induction of HO-1/CO system in septic model
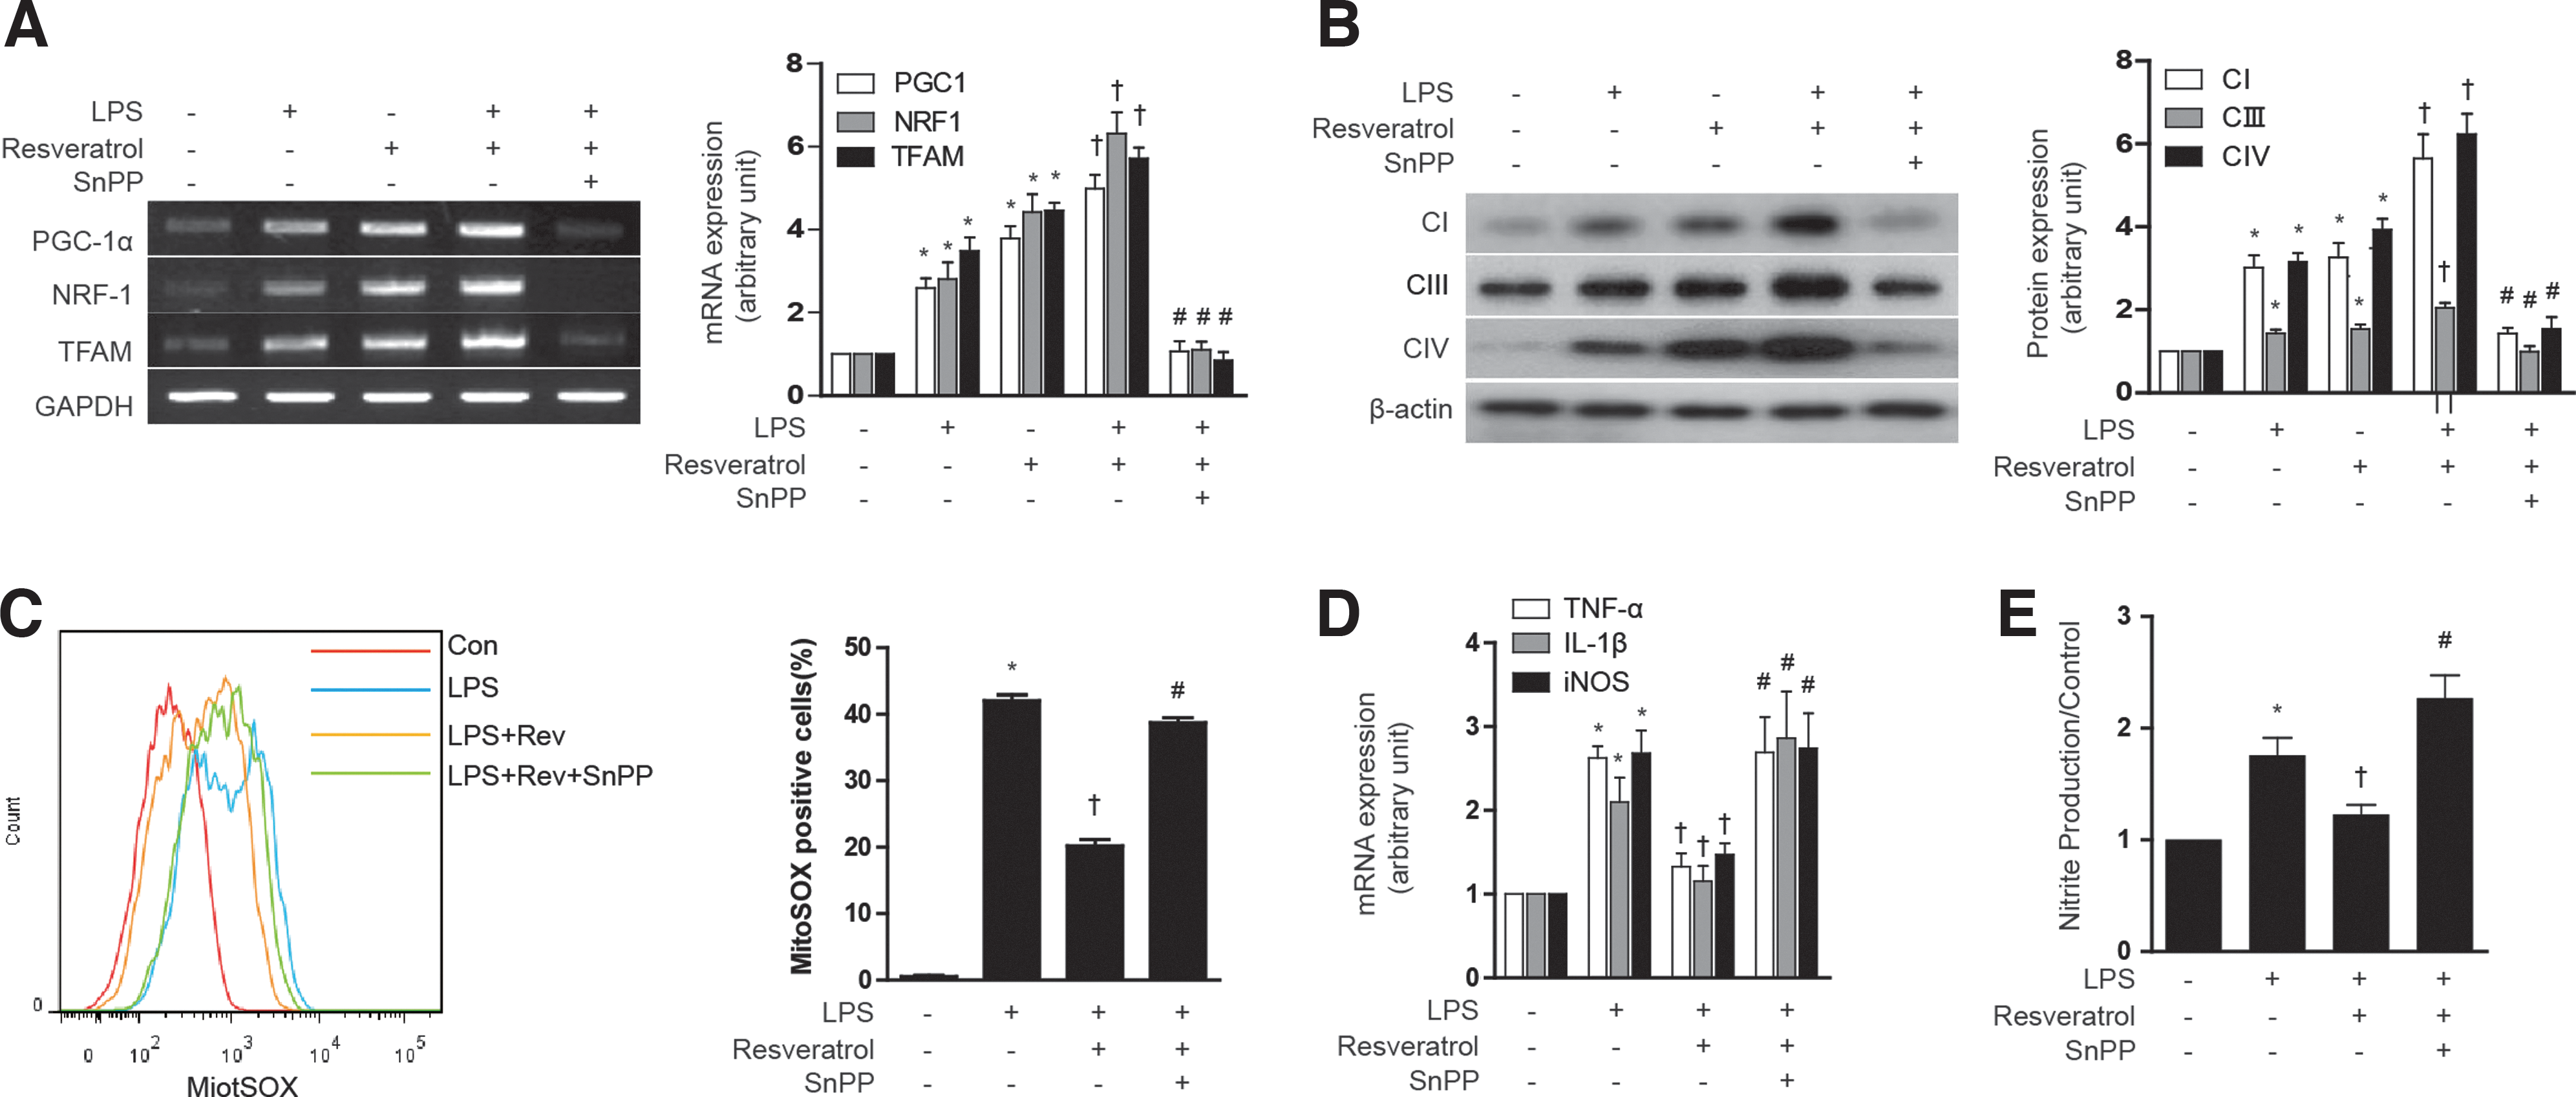
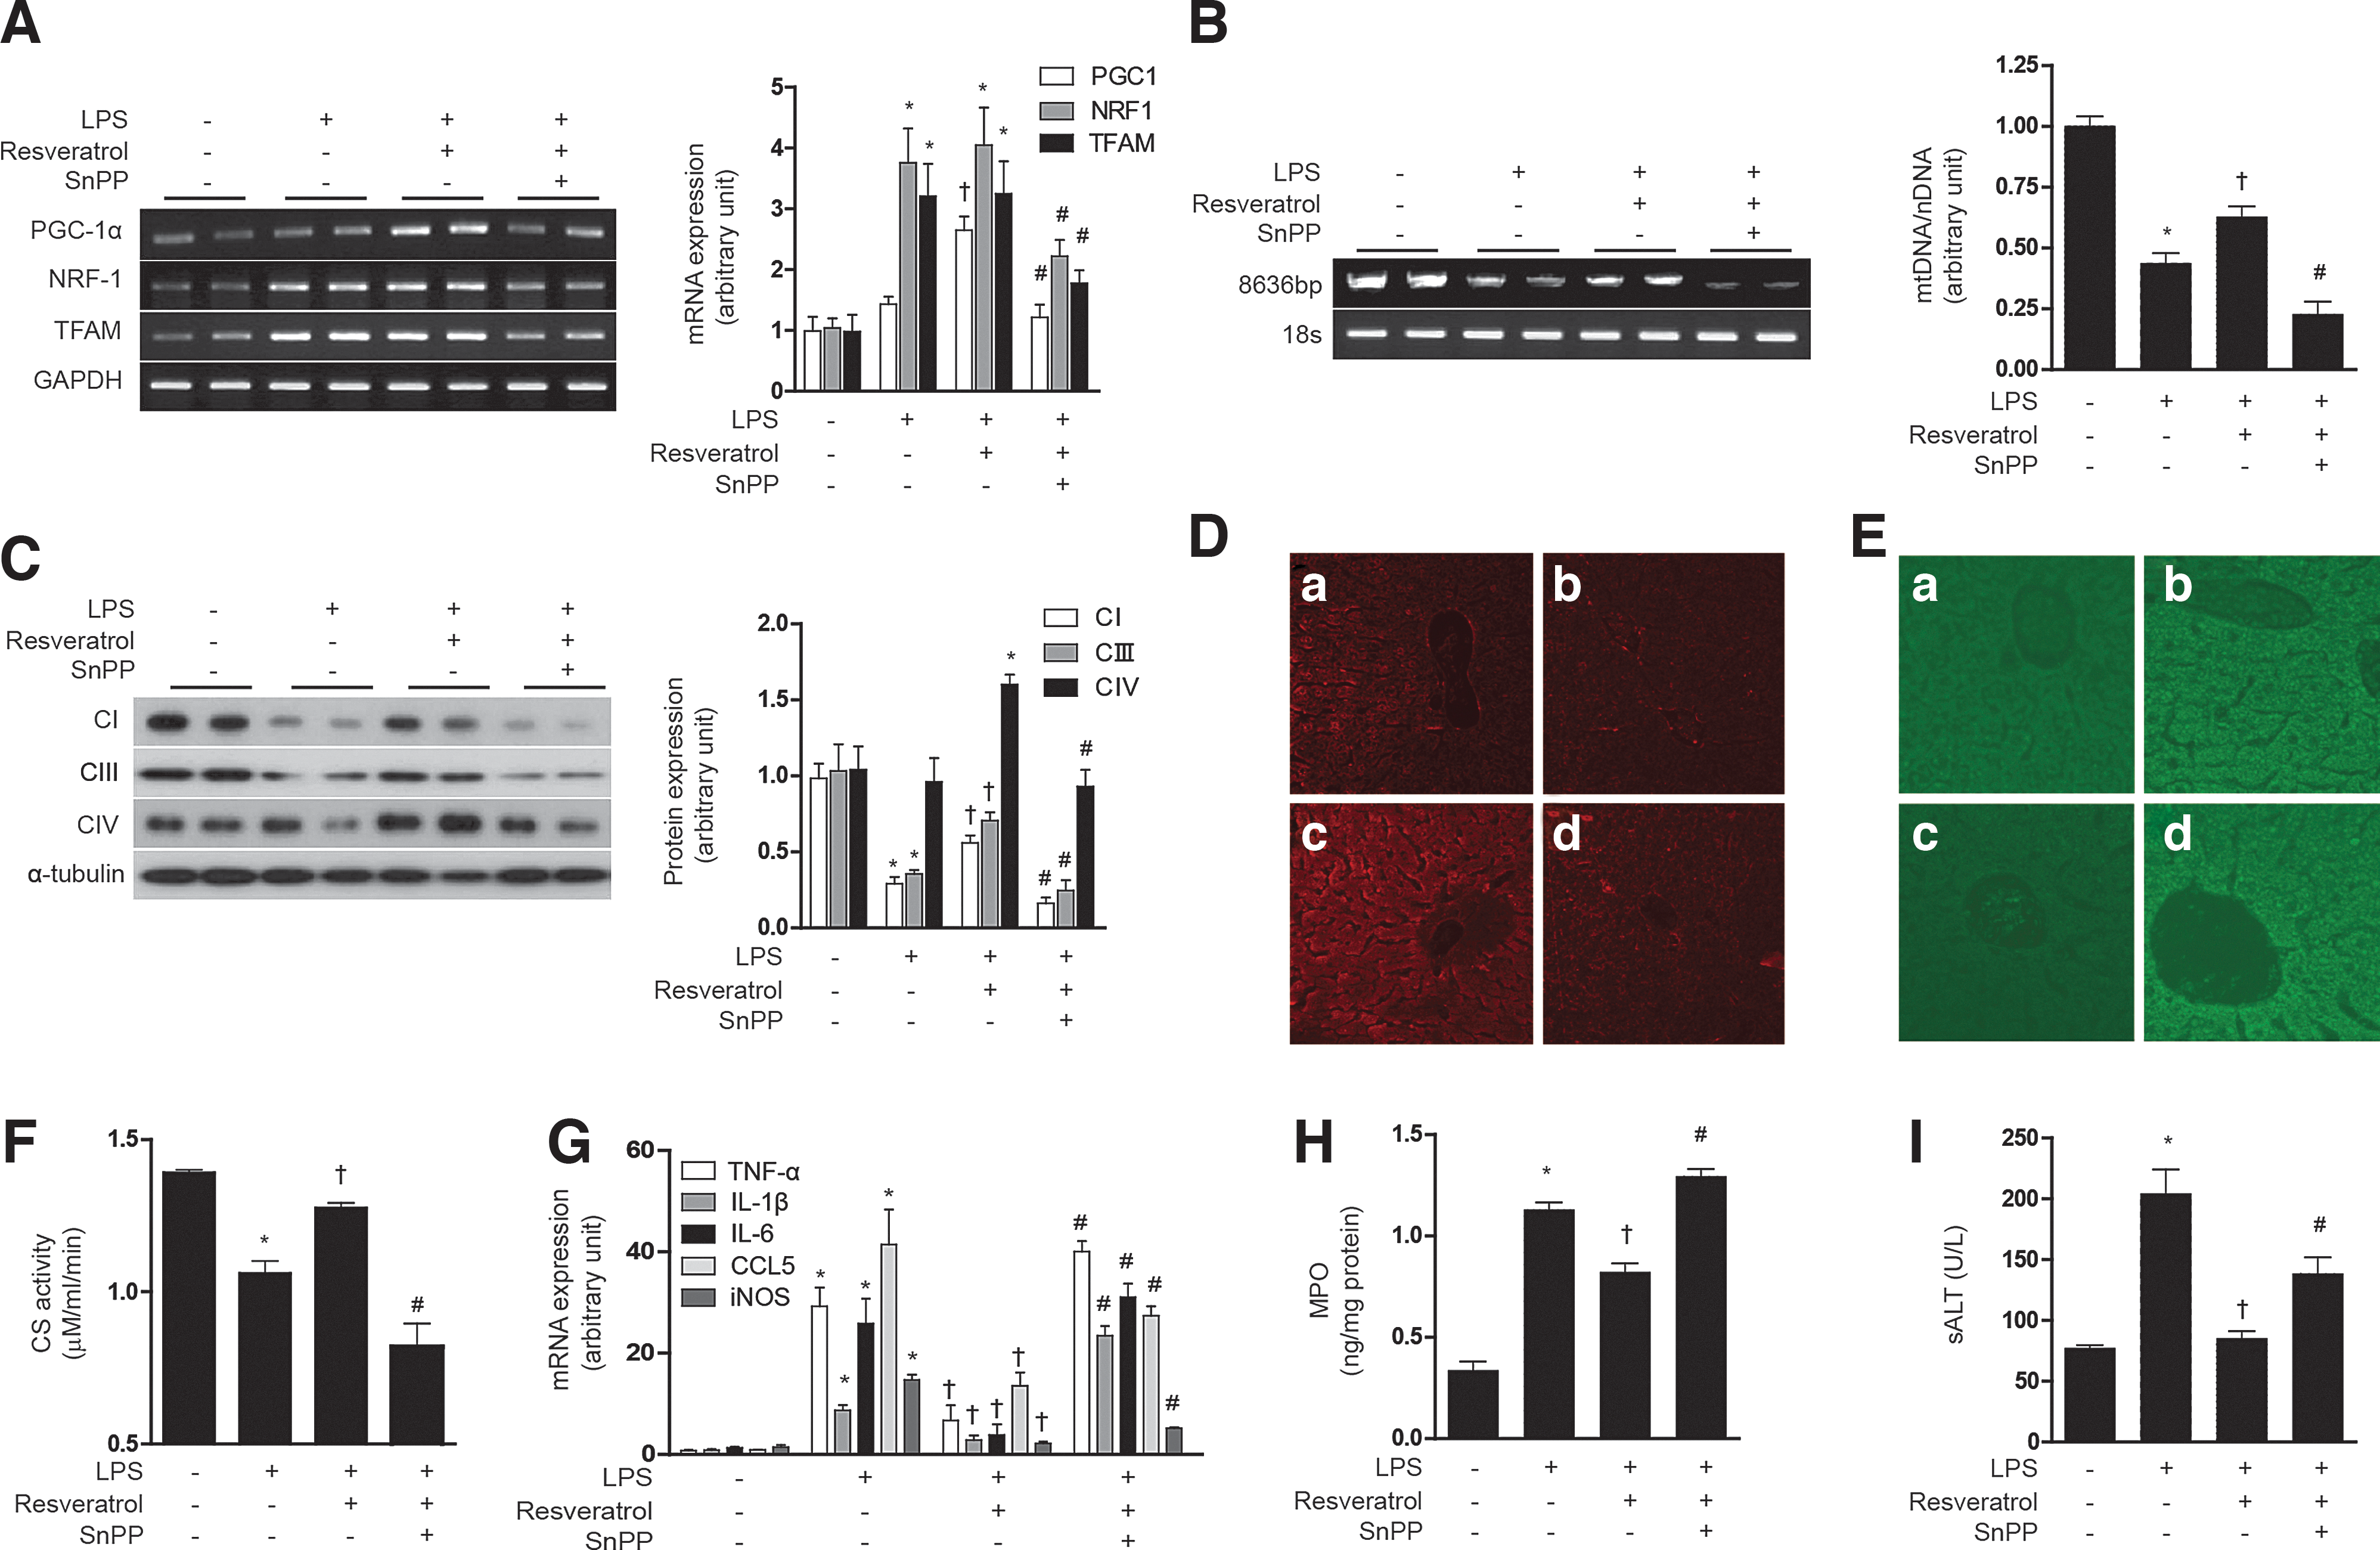
Next, we examined the responses to resveratrol in the context of a lipopolysaccharide (LPS)-induced model of sepsis. First, we tested the effect of resveratrol on the mitochondrial biogenesis in LPS-treated HepG2 cells. Though LPS slightly increased PGC-1α, NRF-1, and TFAM mRNA expression, resveratrol had a greater effect on the expression of mitochondrial biogenesis transcription factors than LPS treatment. Furthermore, resveratrol increased mitochondrial biogenesis in LPS-treated HepG2 cells, as shown in PGC-1α, NRF-1, and TFAM mRNA expression (Fig. 8A) and Complex I, III, IV protein expression (Fig. 8B). To evaluate the antioxidant and inflammatory effect of resveratrol, ROS levels, inflammatory cytokines, and NO production were detected. The LPS-induced ROS levels were suppressed by resveratrol treatment, and the protective effect of resveratrol was antagonized with SnPP treatment (Fig. 8C). In addition, the anti-inflammatory effects of resveratrol were blocked by SnPP as shown by inhibition of LPS-induced cytokine production such as TNF-α, IL-1β, and iNOS gene expression (Fig. 8D), as well as nitrite production (Fig. 8E) in HepG2 cells. Subsequently, we investigated the effect of resveratrol on LPS induced in normal mice and eNOS knockout mice. LPS treatment increased the expression NRF-1 and TFAM mRNA in mouse liver, with little effect on PGC-1α expression (Fig. 9A). In contrast, resveratrol treatment increased the expression of PGC-1α after LPS treatment. LPS treatment clearly diminished hepatic mtDNA content (Fig. 9B). In contrast, resveratrol protected against the loss of mtDNA content in LPS-treated animals. SnPP antagonized the protective effects of resveratrol with regard to hepatic PGC-1α, NRF-1, and TFAM mRNA and mtDNA content (Fig. 9A, B). Consistent with these findings, resveratrol also protected against Complex I, III, IV protein expression and MitoTracker-stained mitochondria depletion caused by LPS treatment, and this effect was also antagonized by SnPP (Fig. 9C, D). Resveratrol also exerted an anti-inflammatory effect as shown by inhibition of LPS-induced cytokine (i.e., TNF-α, IL-1β, IL-6), chemokine (i.e., CCL5), and iNOS gene expression in the liver, effects that could be blocked by SnPP (Fig. 9G). To investigate the effect of resveratrol on mitochondrial function in a septic model, we measured ROS levels and citrate synthase activity. Similar to results observed for mitochondrial biogenesis, the production of ROS by LPS was inhibited by resveratrol (Fig. 9E). Furthermore, resveratrol protected against the decrease of citrate synthase activity by LPS treatment (Fig. 9F). SnPP treatment protected against the mitochondrial dysfunction caused by LPS (Fig. 9E, F). To detect liver injury, we examined the concentration of MPO and ALT. As expected, resveratrol recovered liver damage caused by LPS, and these effects were blocked by SnPP (Fig. 9H, I). We also confirmed the effects of NO on resveratrol-induced mitochondrial biogenesis using LPS-induced septic eNOS knockout mice (Supplementary Fig. S7A–H). In contrast to effects of resveratrol on hepatic mitochondrial biogenesis in wild-type mice, LPS-induced mitochondrial biogenesis and dysfunction could not be recovered by resveratrol in eNOS-deficient mice (Supplementary Fig. S7A–H). These results verify that, in a septic model, resveratrol-induced mitochondrial biogenesis was mediated by an eNOS-dependent pathway. These results suggest that LPS treatment impairs hepatic mitochondrial biogenesis and mitochondrial function by a pro-inflammatory mechanism which can be reversed by resveratrol treatment, in a fashion dependent on HO activity.
Discussion
An emerging concept is that natural antioxidants may preserve long-term tissue homeostasis by stimulating networks of genes (vitagenes) involved in cellular defense during stressful conditions. Such protective networks include HO-1, heat shock proteins (e.g., Hsp70), and the thioredoxin and the sirtuin protein systems. Dietary antioxidants, such as carnosine, carnitines or polyphenols, and resveratrol, have recently been demonstrated to exert protection, in part through activation of cellular defense mechanisms and mitochondrial preservation. Induction of such adaptive responses by dietary antioxidants may have a broad impact on a variety of processes, including aging, neurodegeneration, and susceptibility to disease (7, 8).
Mitochondrial dysfunction plays a central role in a number of pathological processes and disease states. Among these are included ischemia/reperfusion injury and cardiomyopathies, neurodegenerative diseases (e.g., Parkinson's disease), metabolic syndrome, type II diabetes, and sepsis (11). Increased mitochondrial ROS production has been implicated in pathogenic changes associated with compromised mitochondrial function (11).
Mitochondrial biogenesis represents an important mechanism by which cells maintain a healthy mitochondrial population. Previous studies have shown that small gas mediators such as NO, and, more recently, CO, can activate mitochondrial biogenesis in cultured cells (29, 30, 44). Although elevated levels of ROS are implicated in mitochondrial dysfunction, physiological levels of ROS may also be involved in signaling to mitochondrial biogenesis (24). In addition, it is known that increasing levels of cytosolic Ca2+ can trigger mitochondrial biogenesis, through a pathway involving Ca2+/calmodulin and activation of p38 MAPK (47).
In the current study, we show that the stimulation of mitochondrial biogenesis by NO in HepG2 cells requires not only cGMP production, but also the activation of endogenous HO-1 expression and activity, as shown by inhibition of the response by genetic interference or chemical inhibition using SnPP, respectively. Similarly, application of 8-Br-cGMP activated mitochondrial biogenesis in a fashion dependent on HO-1 expression and activity. These experiments, taken together, suggest that NO triggers mitochondrial biogenesis through cGMP production, which also requires downstream activation of HO-1 in a feed-forward pathway. These conclusions were confirmed using an in vivo model, in which we have shown that SNAP injection causes hepatic mitochondrial biogenesis in an HO-activity dependent manner. In contrast, recent studies have shown that the NO metabolite nitrite can also stimulate mitochondrial biogenesis, but unlike NO, the mechanism of action involves a pathway involving sirtuin-1, independent of the sGC/cGMP pathway (28).
HO-1, an inducible stress protein, can exert cytoprotective and anti-inflammatory effects through enzyme activity-dependent generation of heme catabolites, including biliverdin-IXα, ferrous iron, and CO, which may act individually or in concert to mediate the biological effects of this protein (39). Recently, we have reported that the HO-1/CO system can mediate mitochondrial biogenesis during activation of the endoplasmic reticulum stress pathway (48). In the current study, mitochondrial biogenesis was effectively induced by application of CORM-3, a CO-donor, to HepG2 cells. The application of Hb, an effective CO scavenger, antagonized the stimulation of mitochondrial biogenesis by cGMP, and by the synthetic HO-1-inducing compound CoPP. Thus, the endogenous production of CO likely acts as a key effector of HO-1 in the role of this enzyme in activating mitochondrial biogenesis downstream of the NO/cGMP axis. However, a possible role for other HO metabolites cannot be completely excluded.
The Nrf2/Keap1 system is a major regulator of HO-1 induction elicited by many inducing compounds (1). In this study, we found that Nrf2 is required for the effects of CoPP on mitochondrial biogenesis. Interestingly, Nrf2 was also required for CORM3-dependent stimulation of mitochondrial biogenesis. These experiments also confirm that feed-forward amplification by the Nrf2/HO-1 axis may also be required for activation of mitochondrial biogenesis by exogenous CO introduced by CORMs. Akt phosphorylation has been shown to occur as an intermediate step in HO-1/CO induced mitochondrial biogenesis, downstream of Nrf2 activation. Nrf2 and PI3K/Akt signal to NRF-1 and TFAM activation in cardiomyocytes (36). In the current study, we show that both CORM-3 and CoPP induced Akt phosphorylation, and promoted mitochondrial biogenesis in HepG2 cells, the latter effect that could be blocked by a PI3K inhibitor LY294002.
CO, when applied by inhalation or pharmacological application of CORMs, has been found to confer protective effects in a wide variety of tissue injury models in mice (39). It should be noted that chronic low-level exposure to CO has also been associated with pathological outcomes in the heart (38). CORMs have recently been shown to provide protection in sepsis, and preserve cardiac function during metabolic syndrome in mouse models. These effects of CORMs in these models were related to stimulation of mitochondrial biogenesis through the Nrf2/Akt axis (22, 23).
Natural antioxidants derived from plants have received much recent attention as candidate therapeutics. In particular, plant-derived polyphenolic compounds such as curcumin, caffeic acid phenethyl ester, and resveratrol have been shown to induce HO-1 through the Nrf2 axis (3). Resveratrol has been shown to induce mitochondrial biogenesis in mice (4, 5, 21). In the context of obese mice or mice on high-fat diets, the physiological improvements induced by resveratrol prevented insulin resistance, improved insulin sensitivity, and enhanced mitochondrial number (4, 21). Resveratrol also promoted cardiac mitochondrial biogenesis and protected against angiotensin-II induced cardiac remodeling (5). These effects were shown to be mediated by resveratrol-dependent activation of the cytosolic deacetylase Sirt1 (5, 21). It should be noted that dietary antioxidants (Vitamin E and α-lipoic acid) inhibited mitochondrial biogenesis in skeletal muscle of sedentary and exercising rats, possibly through prevention of mitochondrial dysfunction or inhibition of ROS production (42).
In the current study, we show that resveratrol induced mitochondrial biogenesis in HepG2 cells and in mouse liver in vivo, which depended on a complex sequential interplay of signaling mediators, beginning with stimulation of the eNOS/cGMP axis, followed by feed-forward activation of HO-1 expression, HO activity, and CO production (Supplementary Fig. S8). Although examination of Ca2+ flux was beyond the scope of the current study, we cannot exclude the possibility that the effects of resveratrol on mitochondrial biogenesis may include intracellular Ca2+ perturbation.
Mitochondrial biogenesis has been previously shown to play an important role in protection against the lethal effects of Staphylococcus aureus-induced sepsis and pneumonia (2, 16). CO inhalation during S. aureus-induced sepsis promoted mitochondrial biogenesis in a fashion that required the Nrf2/HO-1 axis and Akt activation (25). In an in vivo LPS injection model, we have shown here that resveratrol exerts beneficial effects with regardt to hepatic mitochondrial biogenesis. LPS caused an apparent decrease in hepatic mitochondrial biogenesis, as determined by decreases in mtDNA levels, and COX IV expression, and these effects were reversed by resveratrol injection. Curiously, despite a phenotype of impaired mitochondrial biogenesis, as detected by assessment of mtDNA levels, and COX IV expression, LPS treatment was associated with the dramatic induction in hepatic expression of two principle upstream regulators of mitochondrial biogenesis (e.g., NRF-1 and TFAM), though PGC-1α was not induced. Resveratrol injection in the presence of LPS caused a selective up-regulation of PGC-1α, in association with the preservation of hepatic mitochondrial biogenesis. These results are in agreement with previous studies which have shown that resveratrol can protect against LPS-induced hepatitis in part through upregulation of HO-1 and downregulation of iNOS (13).
These experiments suggest that resveratrol is an effective therapeutic compound in mice with regard to preserving mitochondrial biogenesis under pro-inflammatory conditions. Strategies aimed at improving mitochondrial biogenesis, including CO delivery, or natural antioxidants, may be developed as therapeutics for the treatment of sepsis and other diseases that involve mitochondrial dysfunction.
Materials and Methods
Chemicals and reagents
SNAP, resveratrol, 8-Br-cGMP, CoPP, L-NAME, ODQ, Hb, LY294002, and bacterial LPS from (Escherichia coli 055:B5) were purchased from Sigma-Aldrich. SnPP was purchased from Porphyrin Products, Inc. Tricarbonylchlor-(glycinate) ruthenium (II) (CORM-3) was kindly contributed by Dr. Haksung Kim (Wonkwang University). CORM-3 was first synthesized by Motterlini and colleagues and its properties are well documented (9). CORM-3 is a novel water-soluble ruthenium-based carbonyl CO carrier that was developed for in vivo applications. CORM-3 is stable in water at 37°C and at acidic pH for more than 24 h, and liberates CO rapidly in physiological solutions and biological fluids. Moreover, in vivo studies have demonstrated that CORM-3 specifically delivers CO to cells and tissues, mimicking the biologic activities associated with CO gas inhalation (41).
Antibodies against eNOS, Nrf2, lamin, and β-actin were purchased from Santa Cruz Biotechnology, and antibodies against complex IV (cyclooxygenase [COX] IV), Ser473-phospho-Akt, and α-tubulin were purchased from Cell Signaling. Antibodies directed against components of respiratory complex I (NDUFB8) and complex III (UQCRC1) were purchased from MitoSciences. Antibody against HO-1 was purchased from Assay Designs. HO-1 siRNA was purchased from Qiagen, and scrambled siRNA and Nrf2 siRNA were purchased from Santa Cruz Biotechnology. All other chemicals were obtained from Sigma-Aldrich.
Cell culture
Cell cultures were grown at 37°C in humidified incubators containing an atmosphere of 5% CO2. The human hepatocellular carcinoma cell line, HepG2 cells were maintained in DMEM supplemented with 10% fetal bovine serum (FBS), and 1% penicillin/streptomycin solution. AML12 cells (CRL-2254) were cultured in DMEM/F12 medium with 0.005 mg/ml insulin, 0.005 mg/ml transferring, 5 ng/ml selenium, 40 ng/ml dexamethasone, 10% FBS, and 1% penicillin/streptomycin solution. Both cells were purchased from ATCC.
Animals
All experiments with mice were approved by the Animal Care Committee of the University of Ulsan. Seven-week-old male C57BL/6 wild-type mice were purchased from Orient and 6- to 8-week-old eNOS and iNOS knockout mice were obtained from Jackson Laboratory. The mice were maintained under specific pathogen-free conditions at 18°C–24°C and 40%–70% humidity, with a 12-h light-dark cycle and food and drinking water were available ad libitum. C57BL/6 were injected i.p. with SnPP (50 μmol/kg) at 6 h before SNAP injection. SnPP was dissolved in 0.1 N NaOH and diluted with phosphate-buffered saline (PBS) (pH 7.4). Mice were injected i.p. with SNAP (1.5, 3, or 6 mg/kg) dissolved in 0.5% DMSO/PBS solution. The control group of mice received the same amount of 0.5% DMSO/PBS. Mice were sacrificed under anesthesia at 24 h after SNAP injection.
To investigate the effects of resveratrol on mitochondrial biogenesis through the induction of HO-1 in C57BL/6 mice, resveratrol (20 mg/kg/day) was given once daily for 7 days by i.p. injection. To explore the role of HO-1 plays in resveratrol-induced mitochondrial biogenesis, SnPP (50 μmol/kg) was administered 6 h before resveratrol injection. In another experiment, the knockout mice were used to investigate the effects of eNOS or iNOS.
For the LPS-induced model of sepsis, on day 8, mice were injected with LPS (10 mg/kg, i.p.). Mice were sacrificed under anesthesia at 24 h after LPS injection, and liver tissue was harvested for RNA, mtDNA, protein measurements, and mitochondrial staining with MitoTracker.
Western immunoblotting
Following experimental treatments, cells were harvested, washed twice with ice-cold PBS, lysed with lysis buffer (0.14 M Tris, pH 6.8, 0.21 M sodium dodecyl sulfate (SDS), 2.4 M glycerol, and 0.3 mM bromophenol blue) containing protease and phosphatase inhibitors, and boiled for 5 min. Protein concentration was measured with BCA protein assay reagent (Pierce). The samples were diluted with lysis buffer containing 1.28 M β-mercaptoethanol, and equal amounts of protein (20 μg) were separated on 8% or 15% SDS-PAGE followed by transfer to polyvinylidene difluoride membranes (Thermo Scientific). The membranes were blocked with 5% nonfat milk in PBS containing 0.1% Tween 20 (PBS-T) for 1 h, and incubated with antibodies against various primary antibodies in PBS-T containing 3% nonfat milk overnight. After washing thrice, the membranes were hybridized with horseradish peroxidase-conjugated secondary antibodies (Santa Cruz Biotechnology) for 1 h. The blots were detected using ECL Plus Western Blotting Substrate (Thermo Scientific). The relative signal intensity of bands was determined and standardized using ImageJ software (U.S. National Institutes of Health).
siRNA transfection
Pre-designed siRNAs against HO-1 were purchased from Santa Cruz Biotechnology. Cells were transfected with double-stranded siRNAs (50 nM) for 12 h by the Lipofectamine method according to the manufacturer's protocol (Invitrogen; Life Technologies) and allowed to recover in fresh media containing 10% FBS for 24 h. The interference of HO-1 expression was confirmed by immunoblotting using anti-HO-1 antibodies. Scrambled siRNA was used as a control.
Reverse transcription PCR
Total RNA was isolated from HepG2 cells or liver tissue of mice using TRIzol reagent (Invitrogen), according to the manufacturer's instructions. The forward and reverse primers used in the present study are shown in Table 1. In brief, cDNA was synthesized from total RNA (2 μg) by reverse transcription using M-MLV reverse transcriptase, RNase inhibitor, 10 mM dNTP mixture, M-MLV reverse transcription buffer and oligo(dT) adaptor as a primer (Promega). Total RNA and oligo(dT) 15 primer were incubated at 70°C for 5 min. All other components were added and the mixture was incubated at 42°C for 1 h, then terminated at 95°C for 5 min. PCRs were conducted using the following conditions for 30 cycles: denaturation at 94°C for 0.5 min, annealing at 55°C for 0.5 min, and elongation at 72°C for 0.5 min. Band intensities of the amplified DNAs were compared after visualization on an UV transilluminator. The relative signal intensity of bands was determined and standardized using ImageJ software (U.S. National Institutes of Health).
Real-time quantitative RT-PCR
Reactions were performed with SYBR Green qPCR Master Mix (2×, USB Production; Affymetrix) on an ABI 7500 Fast Real-Time PCR System (Applied Biosystems). The primers used in the present study are shown in Table 1. glyceraldehyde 3-phosphate dehydrogenase (GAPDH) served as the standard.
mtDNA analysis
Total DNA was extracted from HepG2 cells and liver tissue using a Blood and Cell Culture DNA Mini Kit (Qiagen). mtDNA copy number was measured by real-time PCR. The following primers for mtDNA were used: Human Complex II (succinate-ubiquinone oxidoreductase): forward primer 5′-CAAACCTACGCCAAAATCCA-3′ reverse primer 5′-GAAATGAATGAGCCTACAGA-3′. Mouse cytochrome b (Mus musculus domesticus mitochondrion): forward primer 5′-CCACTTCATCTTACCATTTA-3′ reverse primer 5′-ATCTGCATCTGAGTTTAATC-3′. The following primers for nuclear DNA (nDNA) were used: human β-actin: forward primer 5′-TCACCCACACTGTGCCCATCTACGA-3′ reverse primer 5′-CAGCGGAACCGCTCATTGCCAATGG-3′ and mouse 18S rRNA: forward primer 5′-GGGAGCCTGAGAAACGGC-3′ reverse primer 5′-GGGTCGGGAGTGGGTAA TTT-3′. Relative amounts of mtDNA and nDNA copy numbers were compared. mtDNA copy number from mice liver tissue was measured using Expand Long Template PCR system. This long PCR technique is based on the amplification of a long (8636-bp) fragment of mtDNA. Forward primer 5′-TACTAGTCCGCGAGCCTTCAAAGC-3′ (nt 4964–4987) and backward primer 5′-GGGTGATCTTTGTTTGCGGGT-3′ (nt 13599–13579) amplified an 8636-bp mtDNA fragment. PCR was performed with the Expand Long Template PCR system (Roche Applied Science) according to the manufacturer's instructions, using 50 pmol of primers. The thermocycler profile included initial denaturation at 94°C for 2 min; 30 cycles of 93°C for 10 s, 61°C for 30 s, and 68°C for 8 min; and final extension at 68°C for 7 min. PCR product (5 μl) was separated on 1.6% agarose gels stained with ethidium bromide. Photographs were taken under UV transillumination. The relative data of band were analyzed by using ImageJ software (U.S. National Institutes of Health).
ATP measurements
Cellular ATP content was determined by means of the CellTiter-Glo Luminescent Cell Viability Assay (Promega) according to the manufacturer's instructions. In brief, cells were incubated with SNAP or resveratrol for 12 h. For inhibition experiments, cells were preincubated for 30 min in the absence or presence of SnPP, an HO-1 inhibitor. After incubation, cells were mixed with test reagents, and luminescence was read according to the manufacturer's instructions.
Electron microscopy
After experimental treatment, cells were fixed with PBS containing 2.5% glutaraldehyde at 4°C overnight and postfixed with 1% osmium tetroxide in PBS for 2 h. Cells were washed and dehydrated in a graded series of alcohol and embedded. The semi-thin sections (0.5–1 μm) and ultra-thin sections (60–90 nm) were cut. The ultra-thin sections were double stained with uranyl acetate and lead citrate. Analysis of sections was performed on Technai 12 electron microscope at 120 kV.
Measurement of nitrite production
Nitrite concentration in culture medium was measured by using the Griess reaction (1% sulfanilamide in 5% phosphoric acid and 0.1% naphthylethylenediamine dihydrochloride in distilled water). The nitrite contents were determined by mixing 100 μl of medium with an equal volume of Griess reagent. The absorbance of the mixture at 530 nm was determined using a microplate reader, and the concentration of nitrite concentration was calculated by comparison to a standard curve prepared using dilution of sodium nitrite. Results were divided by the corresponding control.
Citrate synthase activity
Citrate synthase activity in liver tissue of mice was measured using Citrate Synthase Assay Kit (Sigma-Aldrich), according to the manufacturer's instructions. To prepare tissue extracts, mouse livers were homogenized using CelLytic MT Cell Lysis Reagent (Sigma-Aldrich). Protein concentration was measured with BCA protein assay reagent. Twenty microliters of extract protein mixed with reaction mixture. A microplate reader set at 412 nm made measurements at 10 s intervals for a 1.5-min duration. CS activity was measured by calculating the difference between baseline and OAA-treated samples according to manual.
Analysis for ROS
Mitochondrial superoxide levels were measured using MitoSox Red (Invitrogen). Cells were washed with PBS, incubated with PBS containing 5 μM MitoSOX at 37°C for 10 min, and then washed thrice with PBS. Cells were transferred to polystyrene tubes with cell-strainer caps (Falcon; Becton Dickinson) and analyzed with flow cytometry. Intracellular ROS were measured using FACS Canto II flow cytometer (BD Biosciences). For ROS levels in liver tissue, 2′7′-dichlorodihydrofluorescein diacetate (carboxy-H2DCFDA) (Invitrogen) was used. Data were measured by using an FV1000 Confocal Laser Scanning Biological Microscope.
Mitochondrial staining and confocal microscopy
To assess changes in mitochondrial mass, mtochondrial staining was performed by incubating cells with MitoTracker® Red CMXRos (Invitrogen) or acridine orange 10-nonyl bromide (NAO; Invitrogen). After experimental treatment, cells were incubated with MitoTracker Red CMXRos (500 nM) or NAO (2.5 μM) for 30 min at 37°C in dark, then subsequently washed twice in PBS and fixed with 4% paraformaldehyde in PBS at 37°C for 30 min. Cells were analyzed by using an FV1000 Confocal Laser Scanning Biological Microscope at excitation wavelength 579 nm and emission wavelength 599 nm.
For detection of mitochondrial mass in liver sections, portions of liver were fixed in 10% neutral-buffered formalin solution and then dehydrated in graded alcohol, embedded in paraffin. Paraffin-embedded liver tissues were sliced into 4-μm-thick section. Tissue sections were mounted on regular glass slides, deparaffinization in xylene and rehydration through graded ethanol, and stained with MitoTracker Red CMXRos.
Statistical analysis
All values are expressed as mean±SEM. Student's t-test was used to evaluate differences between samples of interest and the corresponding controls. Differences between groups were assessed by one-way ANOVA. Data were analyzed and presented with Image J software (U.S. National Institutes of Health). A p-value<0.05 was considered statistically significant.
Footnotes
Acknowledgments
This study was supported by the Bio & Medical Technology Development Program of the National Research Foundation (NRF) funded by the Ministry of Science, ICT & Future Planning (2012M3A9C3048687).
Author Disclosure Statement
The authors declare that they have no financial conflicts of interest.
Abbreviations Used
References
Supplementary Material
Please find the following supplemental material available below.
For Open Access articles published under a Creative Commons License, all supplemental material carries the same license as the article it is associated with.
For non-Open Access articles published, all supplemental material carries a non-exclusive license, and permission requests for re-use of supplemental material or any part of supplemental material shall be sent directly to the copyright owner as specified in the copyright notice associated with the article.