




Abstract
Introduction
B
Manganese superoxide dismutase (MnSOD) is a major regulator of cellular redox metabolism. Although earlier reports highlighted a tumor suppressor role for MnSOD, recent evidence indicates increased expression in a variety of human cancers. To that end, our data provide evidence to link increased expression of MnSOD with the aggressive basal subtype of breast cancer, and underscore the judicious use of peroxisome proliferator-activated receptor gamma ligands for specifically down-regulating MnSOD to induce mitochondrial oxidative stress-dependent increase in chemosensitivity of this sub-type of breast cancer with limited treatment options.
Among the many aberrations in the regulation of cell growth and fate signaling associated with the process of carcinogenesis or cancer progression is a significant change in the overall cellular metabolism (2, 35, 42). The increases in the energy demand and metabolic activity result in a change in cellular redox milieu, which is further compounded by alterations in the anti-oxidant defense capacity (63, 69). While the reported evidence implicates a reduced anti-oxidant capacity in the initiation of carcinogenesis, the high metabolic flux in the settings of an established tumor may result in a robust induction of cellular anti-oxidant enzymes to cope with the increase in oxidative stress. Along these lines, our recent work has unraveled distinct redox signaling in cancer cell fate decisions (1, 8, 55, 56).
Since mitochondrial respiration is an important source of superoxide (O2 −) generation in the cells apart from NADPH oxidases, manganese superoxide dismutase (MnSOD) plays an importance role in maintaining redox balance and mitochondrial integrity (49). There is compelling evidence that cancer cells are heavily reliant on the activity of the various SODs (25) to deal with the acquired oxidative stress (23). Of note, while an earlier body of work demonstrated a tumor suppressor function of MnSOD (4, 43, 50), other reports demonstrated significantly higher expression of MnSOD in human tumors than their normal counterparts (9, 27, 39, 51). Not only has MnSOD overexpression been reported in cancers of the thyroid, brain, gastric, and colon (9, 28, 48), but also, more importantly, recent data indicate that in lung, gastric, and liver cancer patients, high MnSOD gene expression correlates with poorer prognosis, lower overall survival rates, and lower relapse-free survival (5, 34, 61).
Interestingly, more recent studies provide a plausible explanation for the high variability in MnSOD gene expression in cancers. The authors show that MnSOD gene expression decreases in vivo as cells transit to early-stage cancer, reiterating its tumor suppressor function. However, MnSOD gene expression increases when cells acquire a more aggressive and invasive phenotype, a phenotype that is typically observed in basal subtype of breast tumors (10, 11, 13, 15). Relevant to this study, studies have also reported higher levels of MnSOD expression in invasive basal-like breast cancer cell lines (MDA-MB-231 and BT-549), compared with the noninvasive (MCF-7 and T47D) or nontumorigenic cell lines (MCF-12A and MCF-12F) (33, 47). These data provide testimony that targeting MnSOD could be an attractive therapeutic strategy against basal-type breast tumors, which would render cells susceptible to oxidative stress-induced cell death. To that end, increased mitochondrial reactive oxygen species (MitoROS) generation has been proposed as an effective anti-cancer strategy (54, 68).
We recently reported that the human MnSOD promoter region contains peroxisome proliferator response element (PPRE) binding motifs and that activation of the peroxisome proliferator-activated receptor-γ (PPARγ) in invasive basal-like breast cancer cells (MDA-MB-231 and MDA-MB-468) resulted in a significant decrease in MnSOD mRNA and protein levels (64). We and others have previously shown that breast cancer cells express higher levels of PPARγ compared with normal breast epithelial cells (14, 37, 40), and that PPARγ activation inhibited proliferation of liposarcoma (62), breast adenocarcinoma (14, 37, 40), prostate carcinoma (36), and colorectal carcinoma (12). Furthermore, ligand activation of PPARγ produces ROS that play critical roles in regulating cell proliferation, apoptosis, and transformation. Thus, upsetting the intracellular ROS balance to activate apoptotic pathways is closely associated with PPARγ-induced cytotoxicity. However, the mechanism(s) by which PPARγ agonism induces ROS production were never clearly elucidated. Several possible mechanisms are suggested in Table 1, but none of these has been experimentally proven. Since MnSOD is a direct target of PPARγ, we hypothesize that repression of MnSOD accounts for the known changes in intracellular ROS levels in tumor cells treated with PPARγ ligands.
ROS, reactive oxygen species; PPARγ, peroxisome proliferator-activated receptor gamma.
Here, we provide evidence in vitro and in vivo that activation of PPARγ induces tumor-specific down-regulation of MnSOD in basal sub-type of breast cancer, which significantly increases chemosensitivity via an increase in intracellular ROS. These findings suggest a novel way to exploit the use of synthetic agonists of PPARγ for the selective targeting of MnSOD in combination with ROS-producing drugs in a unique antitumor strategy against basal breast carcinoma coined “tumor-specific oxidative stress therapy.”
Results
MnSOD expression is significantly higher in the basal-like and claudin-low breast carcinoma subtypes
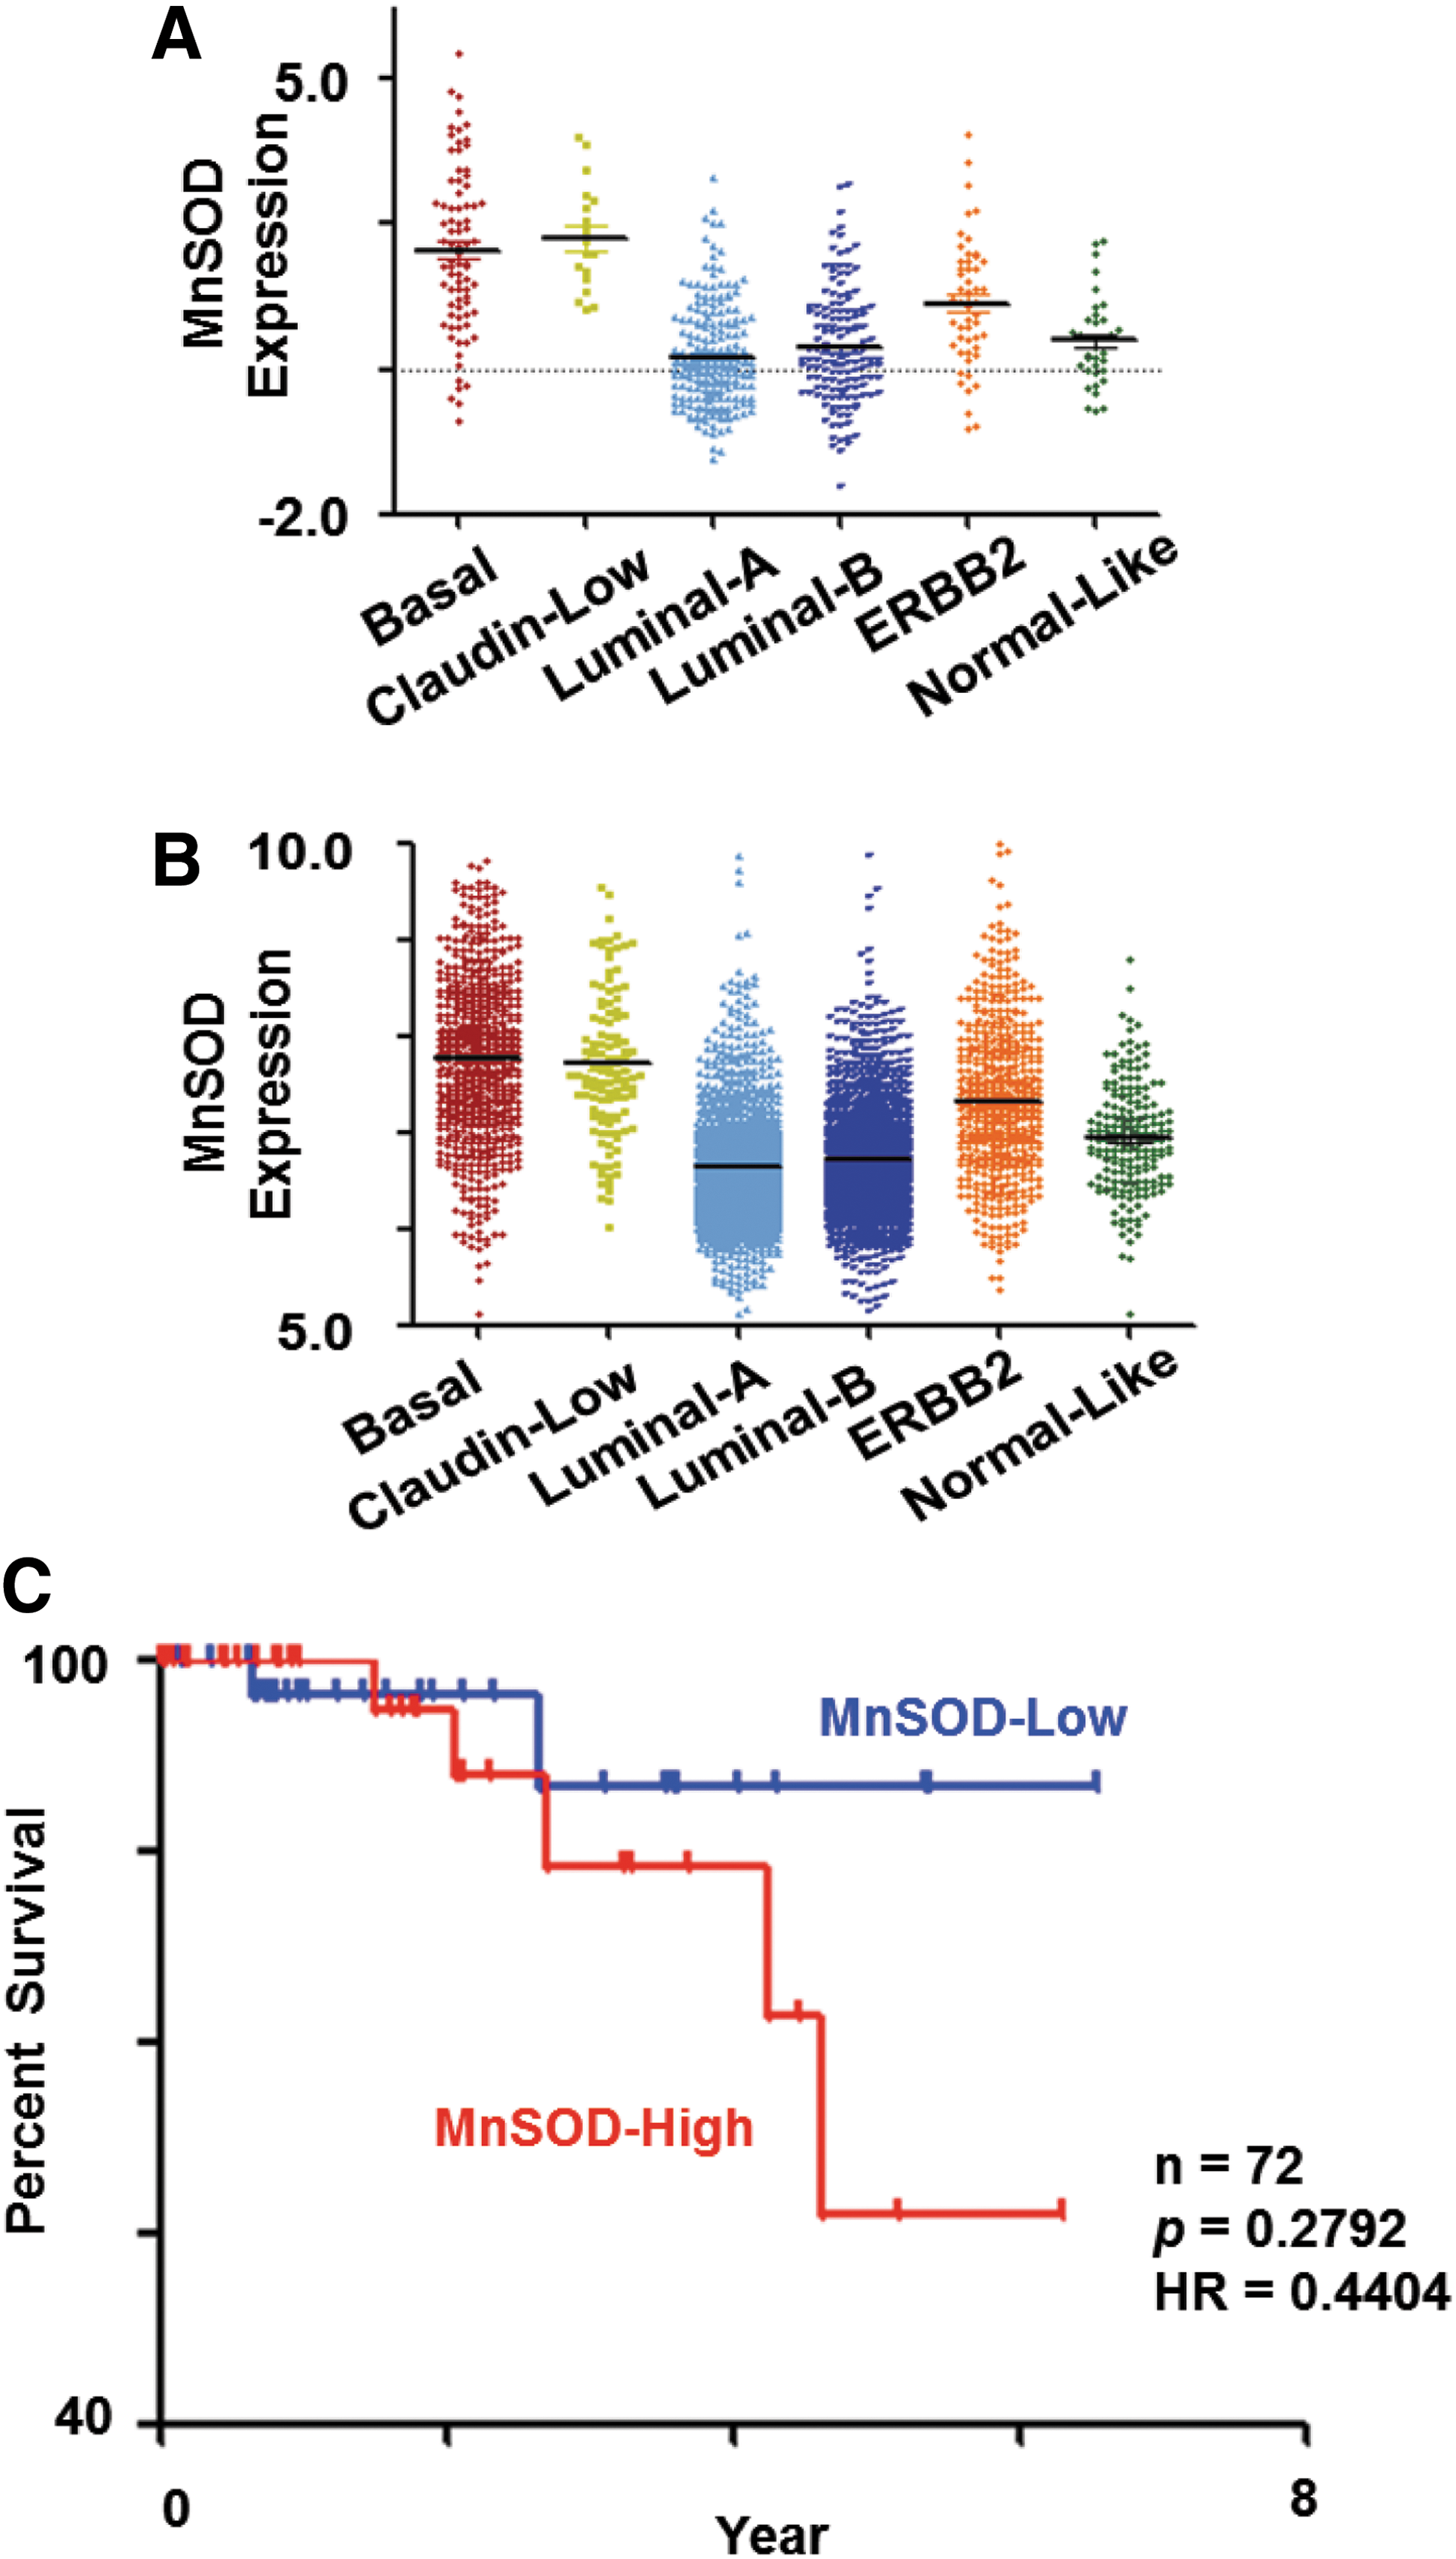
Taking advantage of publicly available microarray data, we assessed the expression of MnSOD in relation to the subtype of breast carcinoma. Five hundred and thirty six invasive ductal breast carcinomas microarray profiles were downloaded from The Cancer Genome Atlas (TCGA). The subtypes of these 536 breast cancer tumors were then predicted using Single-Sample Geneset Enrichment Analysis (ssGSEA; Verhaak et al. 65) and breast cancer subtype signature (57). Interestingly, when comparing each subtype against the others, the mean MnSOD expression was significantly higher in the basal and claudin-low breast carcinoma subtypes (Mann-Whitney test, p=8.93e-20 and p=1.3e-7, respectively), whereas the mean MnSOD expression was significantly lower in Luminal A and B subtypes (Mann–Whitney test, p=6.8e-13, and p=6.5e-4 respectively) (comparing each luminal subtype against the other subtypes) (Fig. 1A). Of note, an identical pattern of expression for MnSOD was observed using a second collection of 3992 breast carcinomas on Affymetrix U133a or U133 Plus2 platform collated from Gene Expression Omnibus (GEO) database (Fig. 1B); a binary comparison of mean MnSOD expression values in each subtype against others revealed that basal, claudin-low, and ERBB2 subtypes have significantly higher expression levels (Mann–Whitney test, p=2.95e-128, p=2.33e-22, and p=1.41e-31, respectively) compared with luminal A, luminal B, and normal-like subtypes; whereas the mean expression was significantly lower in Luminal A and Luminal B subtypes (Mann–Whitney test, p=4.53e-76, and p=7.56e-37, respectively) compared against the other subtypes.
High MnSOD expression correlates with poor survival in the basal subtype
Intrigued by the higher MnSOD expression in the basal subtype of cancers using two independent datasets, we set out to investigate whether a higher MnSOD expression could be a poor prognostic indicator in this particular subtype of breast carcinoma. To do so, we analyzed the association of MnSOD gene expression level with survival of patients within the basal breast tumor subtype over a period of 90 months (∼7.5 years). Kaplan–Meier analysis on 72 basal-like breast cancer patients with available survival information from the TCGA database was performed. In this Kaplan–Meier analysis, patients within the basal subtype were classified into MnSOD-high or -low group based on the median of MnSOD expression levels (Fig. 1C). Subsequently, the survival curves for the MnSOD-high and MnSOD-low groups were compared. Although there was no significant difference in terms of p-value, due to the relatively small number of samples, a separation in survival curves was observed between the MnSOD-high and -low groups (log-rank test, p=0.2792; hazard ratio=0.4404). Hence, this result strongly supports the fact that low MnSOD expression in patients with basal breast cancer type could have a better survival as compared with those in the MnSOD-high group (Fig. 1C).
Down-regulation of MnSOD enhances chemosensitivity of basal-like breast carcinoma cell lines
Based on our data suggesting a relatively poorer prognosis for the patients in the high MnSOD group within the basal subtype of breast cancers, we hypothesize that MnSOD could be an attractive therapeutic target in the management of this particular subtype of tumor. To test this hypothesis, we used two human breast cancer cell lines (MDA-MB-231 and BT549) that were recently shown to closely resemble the clinical basal-like tumors (32). Our results show that gene knockdown of MnSOD using specific small-interfering ribonucleic acid (siRNA) impaired long-term colony-forming ability (Fig. 2A, B and Supplementary Fig. S1A, B; Supplementary Data are available online at

PPARγ activation down-regulates MnSOD expression in basal-like breast carcinoma cell lines
Our results so far indicated that targeting MnSOD expression could have potential implications in enhancing the chemosensitivity of basal-like subtype of breast tumors. However, for this approach to have therapeutic applications, there is a need to find a clinically relevant protocol to selectively decrease MnSOD expression in these cells. Interestingly, we recently showed that human MnSOD gene is a target of the PPARγ. A functional PPRE was identified in the upstream/promoter region of the human MnSOD gene. Of note, activation of PPARγ by its endogenous ligand, 15-deoxy Δ12,14-PGJ2 (15d-PGJ2), significantly decreased MnSOD promoter activity and mRNA level in the basal-like tumor cell lines MDA-MB-231 and MDA-MB-468 (64). In the present article, these results were reproduced using BT549 cells and confirmed in the MDA-MB-231 cell line. Exposure of MDA-MB-231 and BT549 cells to 15d-PGJ2 induced the activation of PPARγ (Supplementary Fig. S2A), which correlated with a dose-dependent decrease in MnSOD mRNA level and protein expression (Fig. 3A, B and Supplementary Fig. S2B, C). Moreover, the down-regulation of MnSOD mRNA and protein expression with 15d-PGJ2 was inhibited by the selective and irreversible PPARγ antagonist GW9662 (Fig. 3A, B, Supplementary Fig. S2B, C) or on transfection of the cells with a dominant negative form of PPARγ, PPARγC126A/E127A (Fig. 3C and Supplementary Fig. S2D). On the contrary, exposure of the nontumorigenic breast cell lines 184A1 and MCF10A to 15d-PGJ2 neither induced PPARγ activation nor resulted in a decrease in MnSOD mRNA and/or protein expression (Supplementary Figs. S2A and S3A, B).
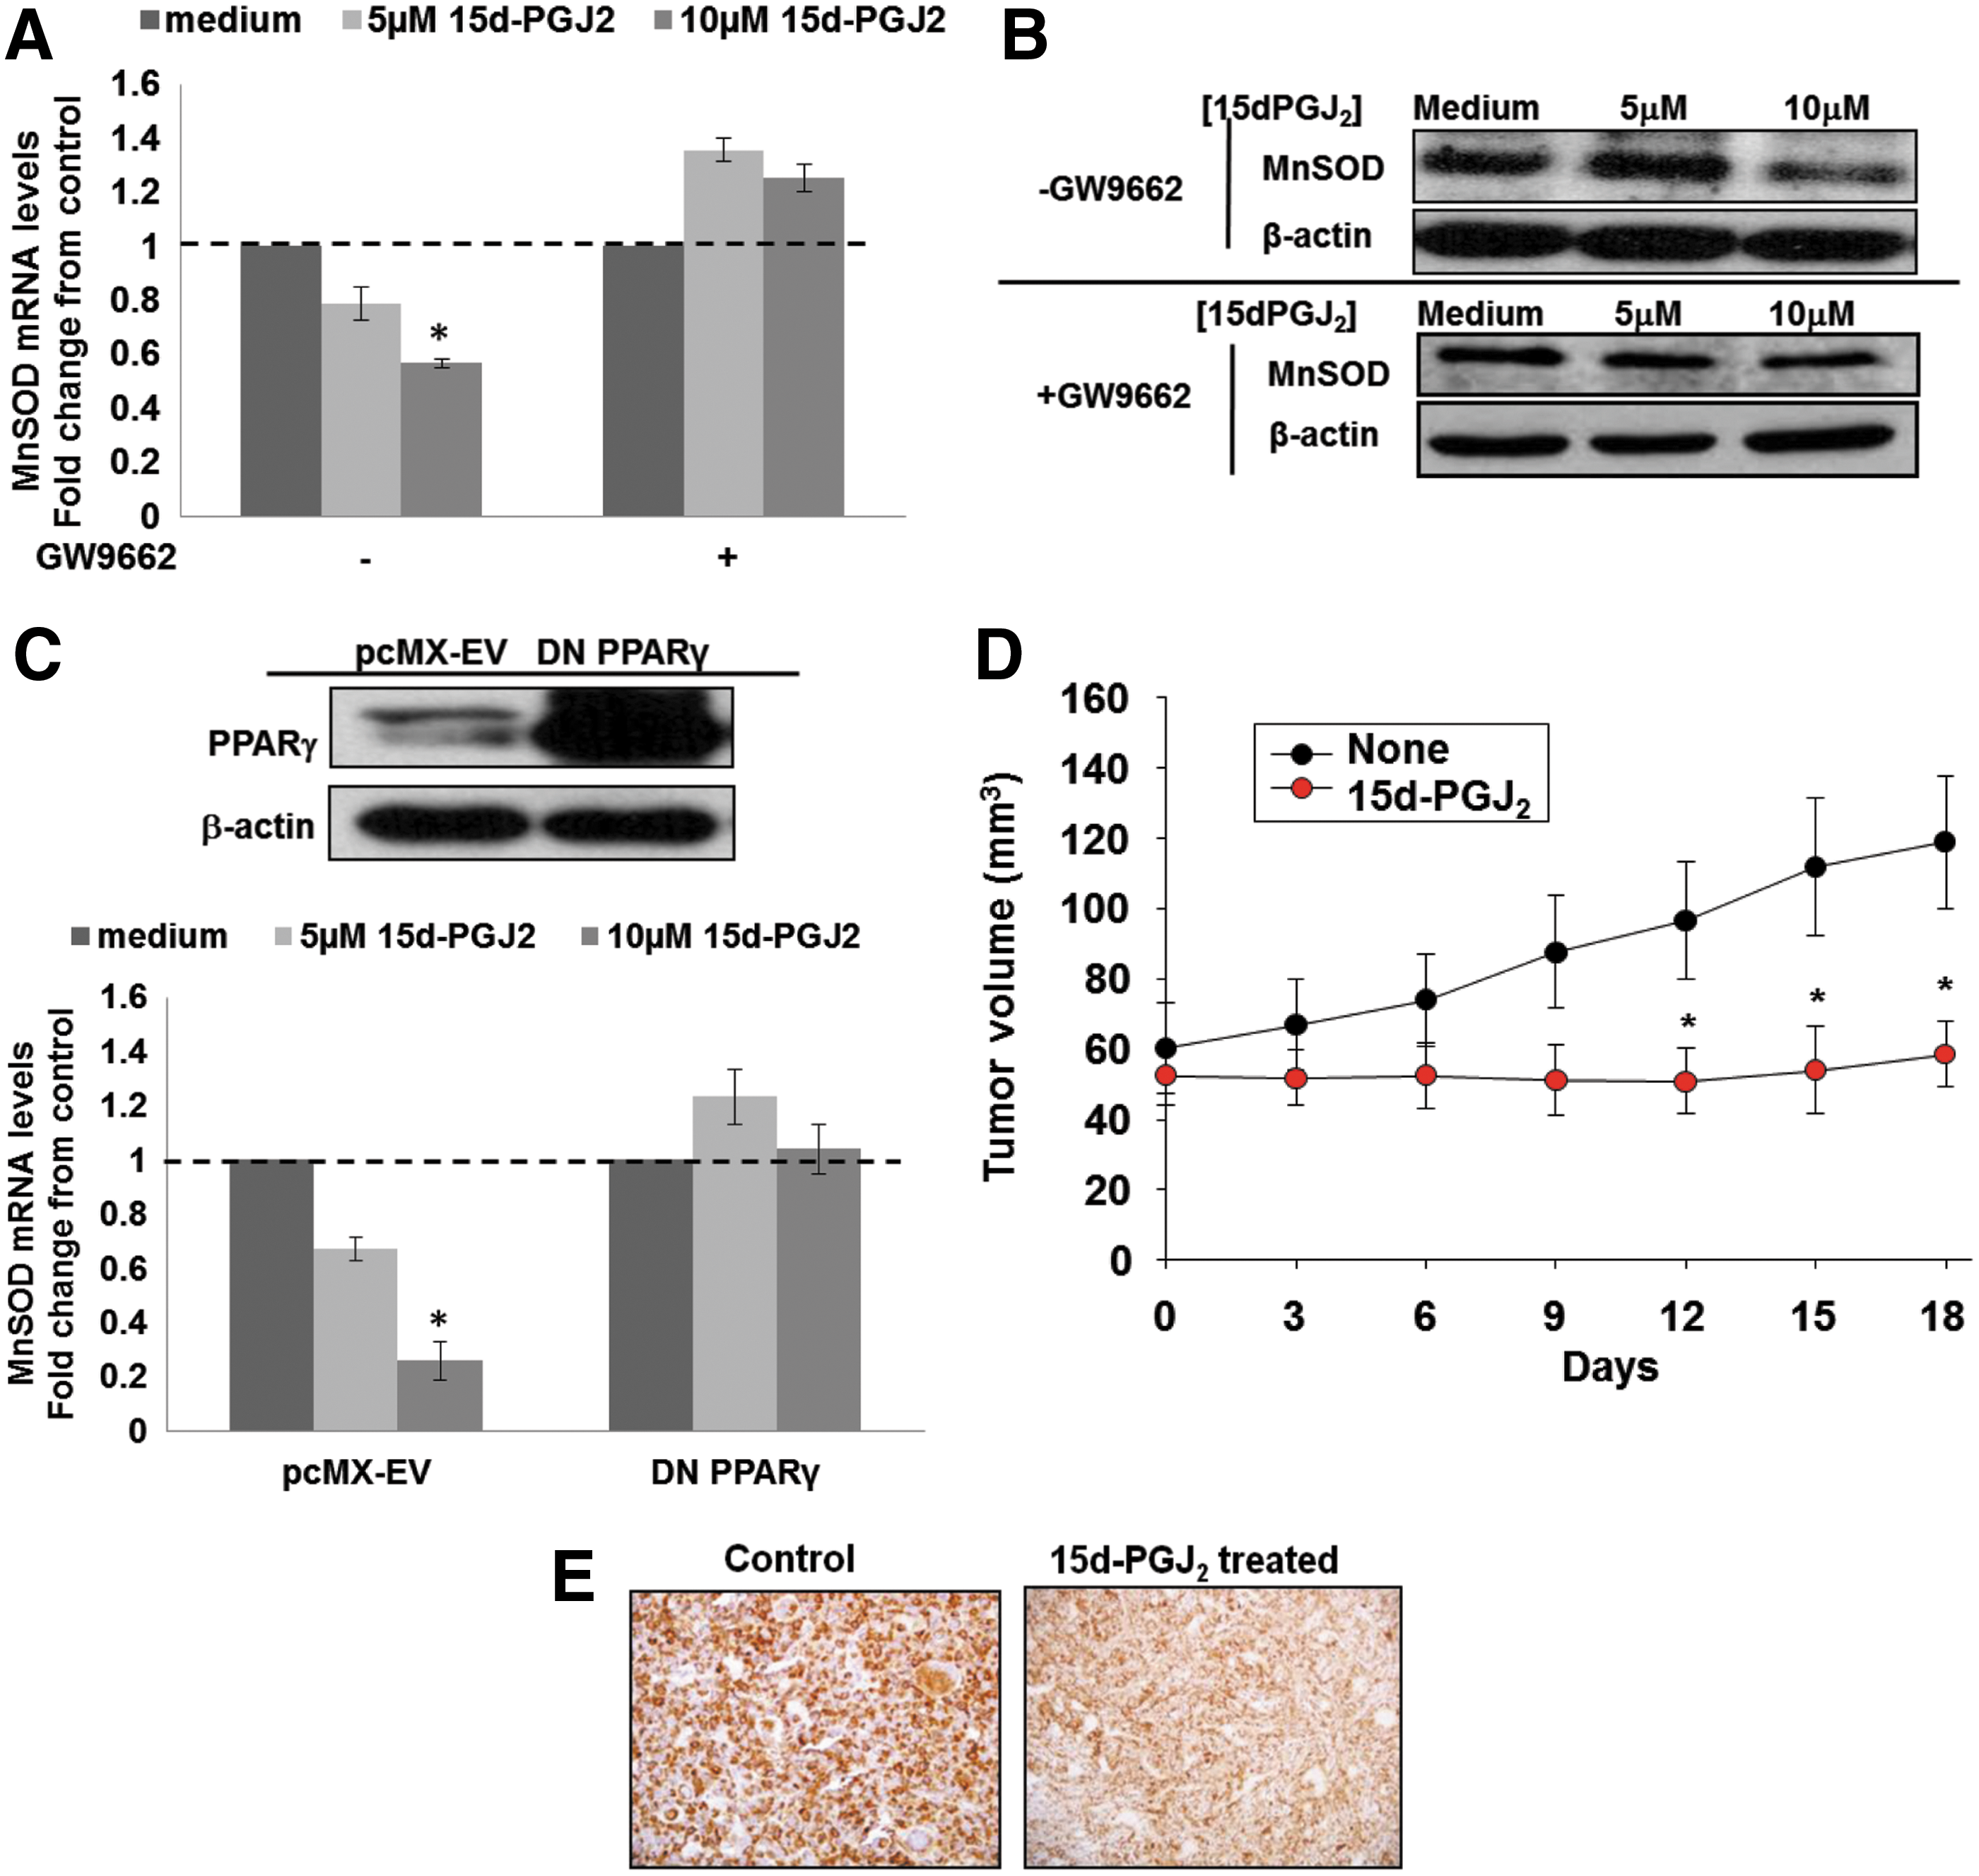
Next, to assess whether down-regulation of MnSOD was associated with the inhibitory effect of PPARγ activation on tumor growth, viable MDA-MB-231 cells were injected into the mammary fat pads of 6 week-old female Balb/c nude mice. Tumors were allowed to grow to a volume of 50–70 mm3 before the tumor-bearing mice were separated into a control and a 15d-PGJ2–treated group. As shown in Figure 3D, administration of 15d-PGJ2 given at a dose of 5 mg/kg via tail vein every 3 days significantly inhibited further tumor growth; the mean tumor volume in the 15d-PGJ2 group was significantly smaller than the vehicle-treated control group (control group mean=131.55±6.16 mm3; 15d-PGJ2 group mean=56.62±11.28 mm3). Most importantly, not only did 15d-PGJ2 induce activation of PPARγ in vivo, but also a significant down-regulation of MnSOD expression was detected in the 15d-PGJ2 group (Fig. 3E).
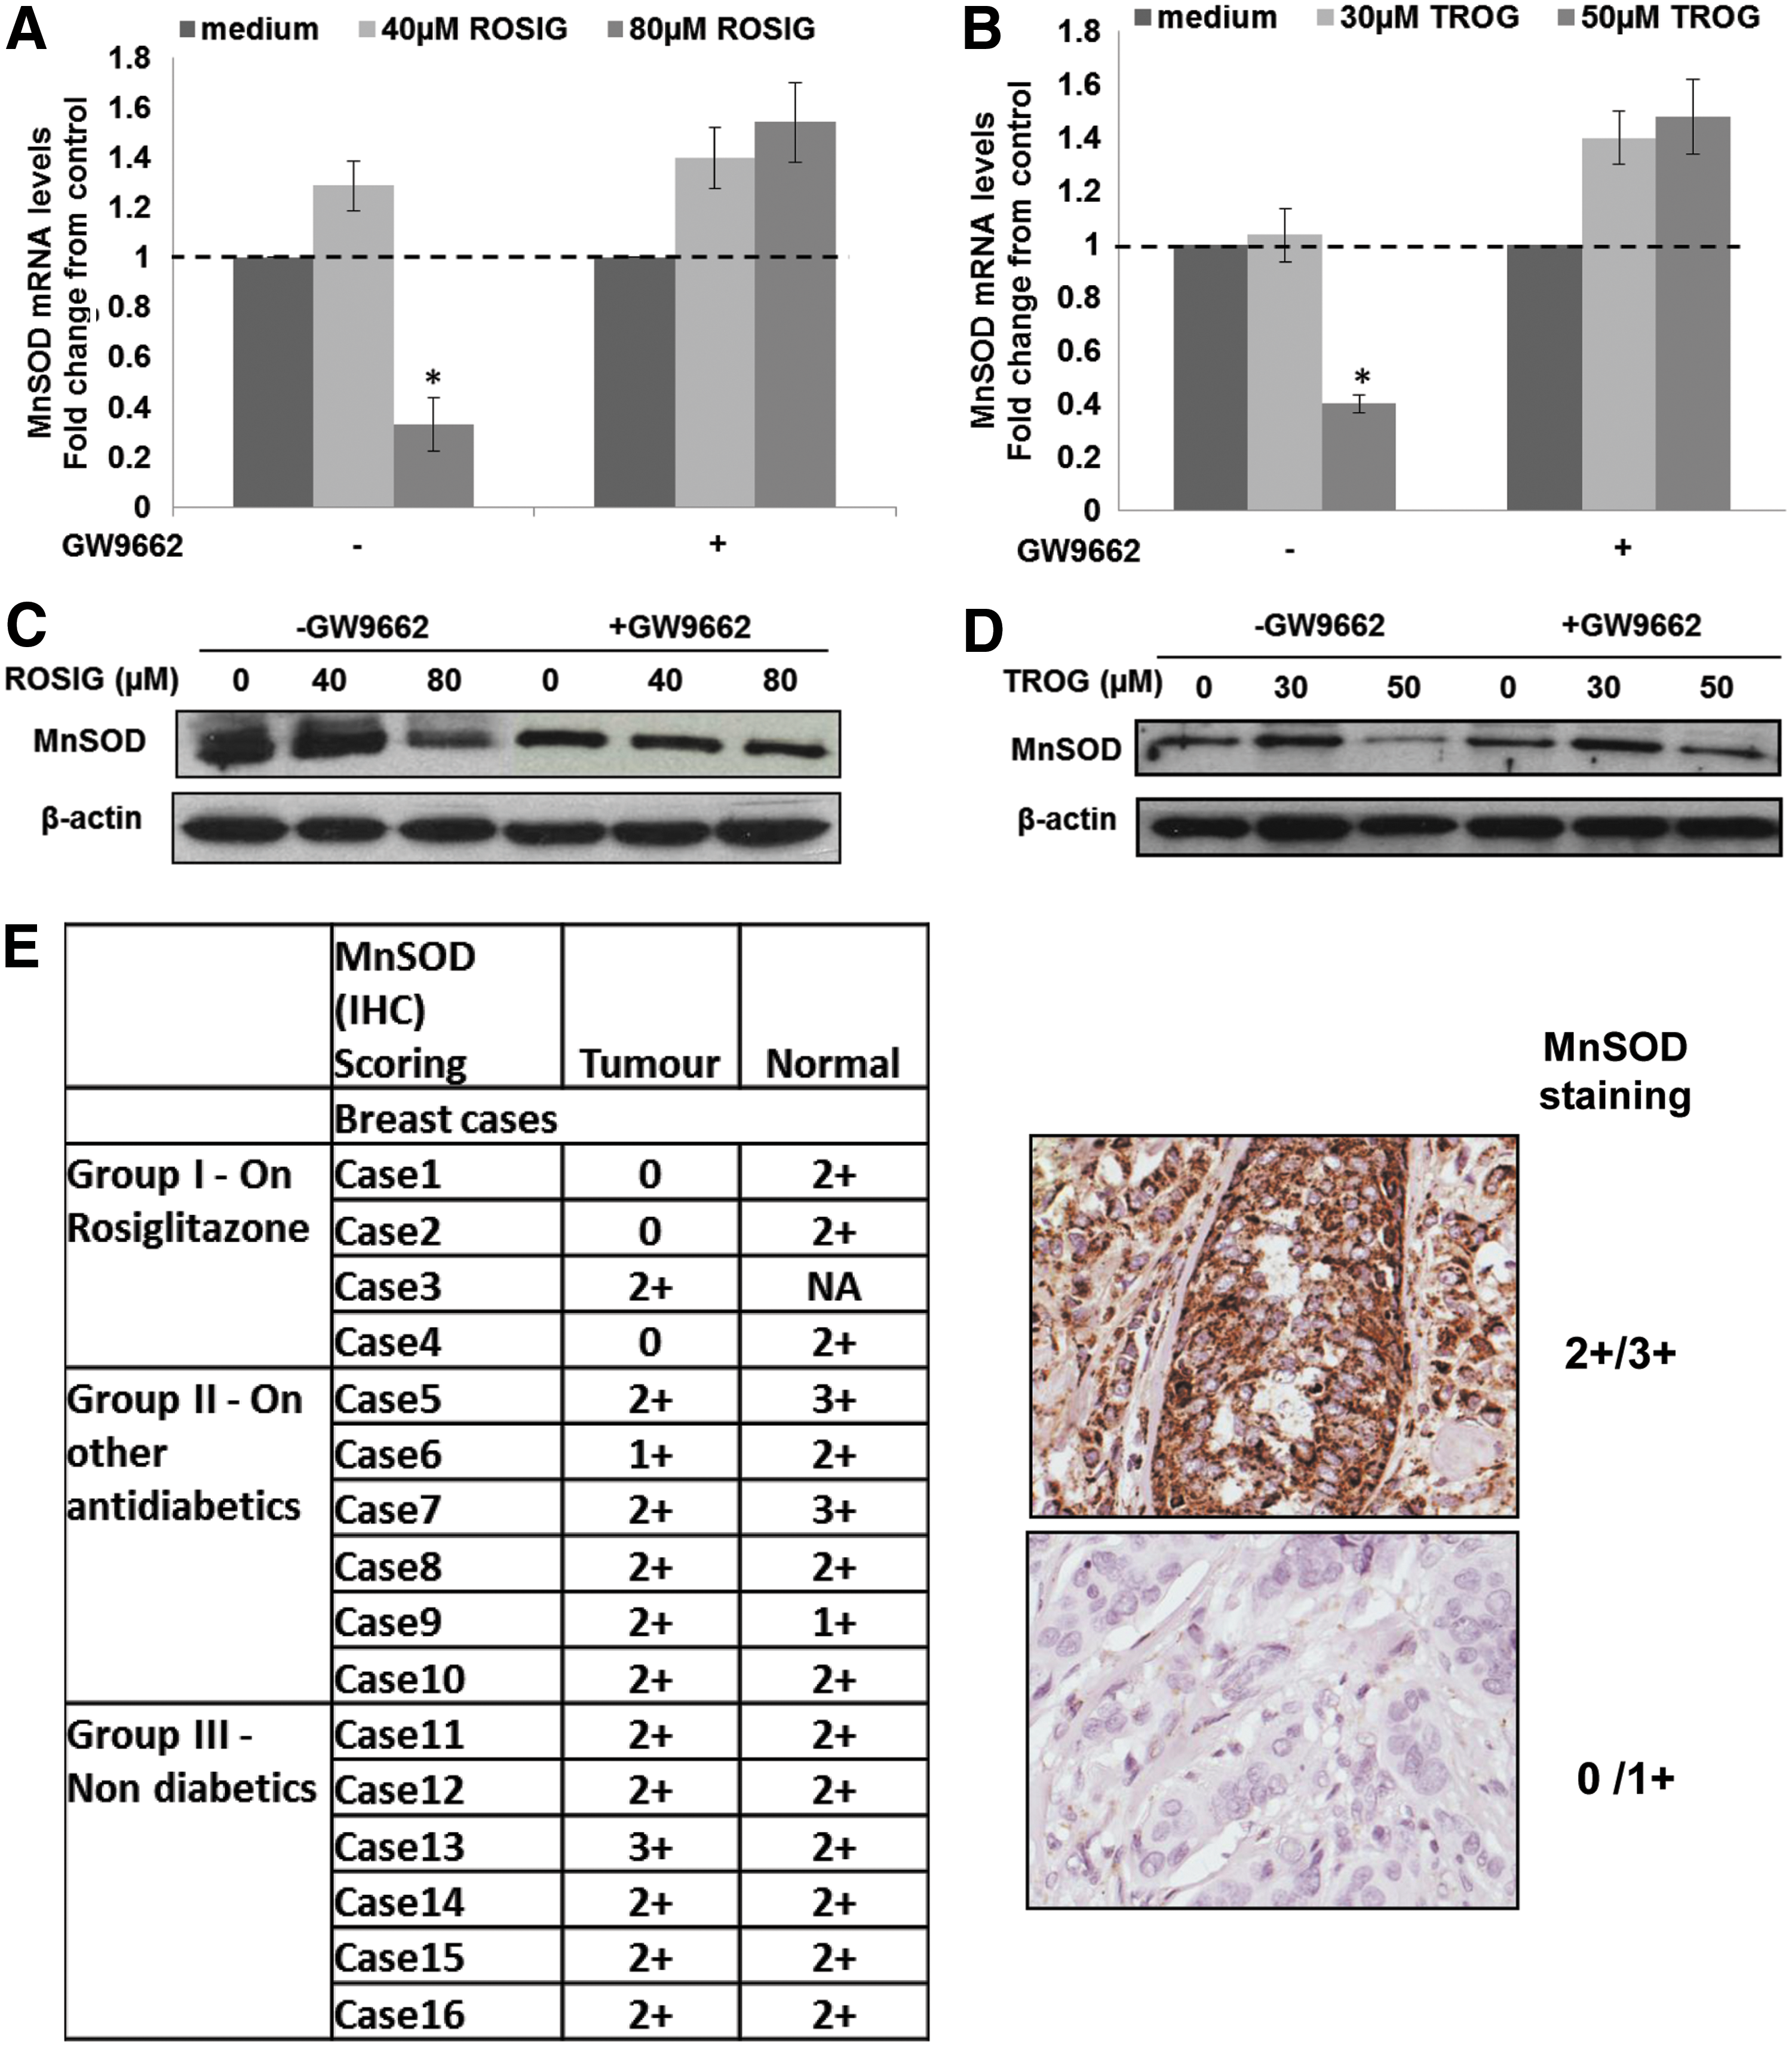
Having demonstrated that activation of PPARγ using its natural ligand 15d-PGJ2, specifically decreased MnSOD expression in basal breast cancer cell lines and a xenograft model, we next investigated whether these results could be reproduced using synthetic PPARγ ligands, such as rosiglitazone and troglitazone. MDA-MB-231 and BT549 cells were exposed to increasing concentrations of rosiglitazone and troglitazone to determine the concentration required to detect an activation of PPARγ. Exposure of MDA-MB-231 to 40 to 80 μM rosiglitazone and 30 to 50 μM troglitazone induced significant increases in PPARγ activation (Supplementary Fig. S4A, B) that were prevented in the presence of the PPARγ antagonist GW9662. Moreover, a down-regulation of MnSOD mRNA level and protein expression that was inhibited by GW9662 was also observed (Fig. 4A–D).
Validation of PPAR-γ-mediated repression of MnSOD in patient-derived breast cancer tissue
In order to provide a “proof of concept” that synthetic PPARγ ligands could induce a decrease in MnSOD expression in the clinical setting, we exploited the therapeutic use of the synthetic PPARγ ligands for the management of type 2 diabetes mellitus. To that end, we compared the expression of MnSOD in breast cancer tissues of diabetic patients treated with rosiglitazone versus breast cancer patients who did not receive rosiglitazone (but other anti-diabetic drugs) for their diabetic condition and/or nondiabetic patients with breast cancer. A total of 15 cases of carcinoma of the breast (intra-ductal carcinoma grade 2 to grade 3) with available paraffin-embedded tissue blocks were identified for the period 2004 and 2006 from the pathology files of the Department of Pathology, National University of Singapore. These cases were divided into three groups: Group I: diabetic breast cancer patients treated with rosiglitazone, Group II: diabetic breast cancer patients treated with other anti-diabetic drugs, and Group III: nondiabetic breast cancer patients. Immunohistochemical (IHC) analysis showed that the expression of MnSOD in clinical tissues corroborated our findings in breast cancer cell lines on the repressive effect of PPARγ activation on MnSOD expression: three out of four patients in Group I (diabetics on rosiglitazone) showed reduced levels of MnSOD expression compared with the tumors of all patients from the other two groups. Note that the invasive ductal carcinoma grade at diagnosis was similar within the different groups (Fig. 4E). A representative immunohistochemistry stain of a tumor tissue (2+/3+) showing higher MnSOD expressions than a tumor tissue (0/1+) is presented on the right panel of Figure 4E.
MnSOD regulates PPARγ activation-induced chemosensitization of MDA-MB-231 cells
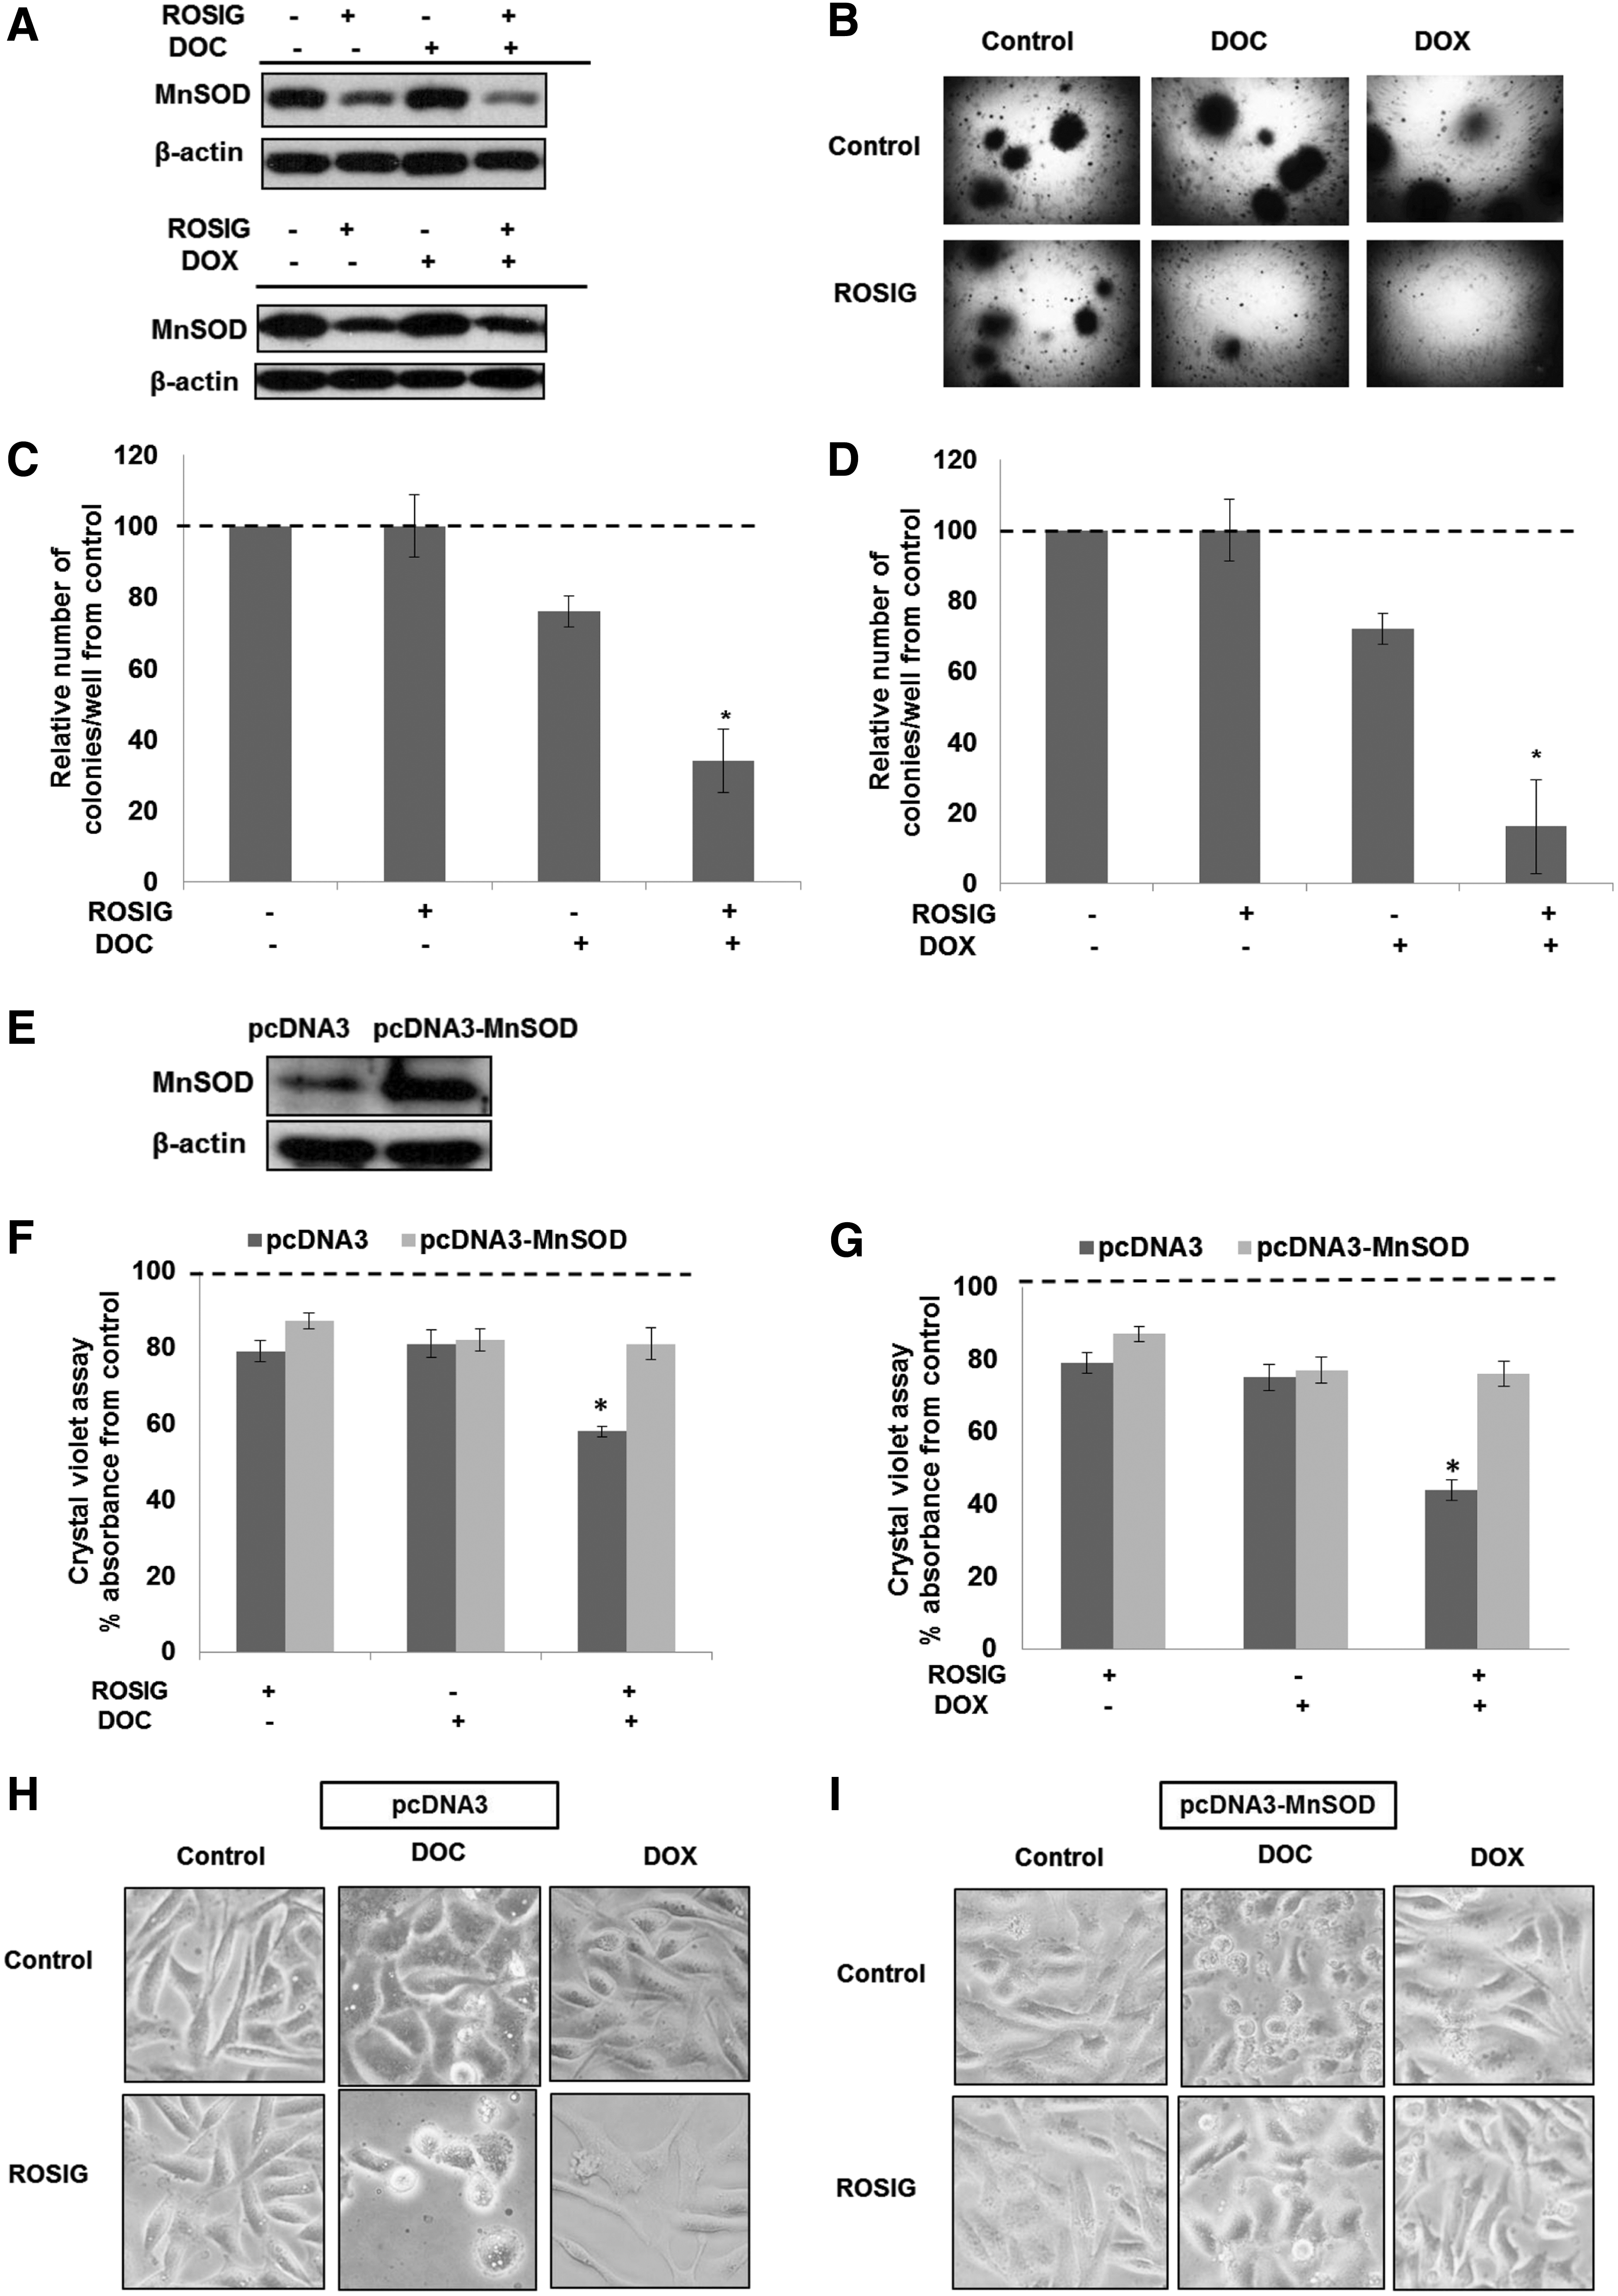
Synthetic ligands of PPARγ have been shown to sensitize a variety of human cancer cell types to chemotherapy-induced cell death. Intrigued by our findings that gene knockdown of MnSOD enhanced chemosensitivity of MDA-MB-231 cells (Fig. 2C–G) and activation of PPARγ down-regulated MnSOD expression (Fig. 3A, B), we questioned whether the chemosensitizing effect of PPARγ ligands could be mediated via their repressive effect on MnSOD. Indeed, exposure of MDA-MB-231 cells to rosiglitazone alone or in combination with DOC or DOX resulted in a significant down-regulation of MnSOD expression (Fig. 5A), and the combination treatment drastically affected the clonogenic potential of these basal-like breast cancer cells (Fig. 5B–D). Most importantly, the chemosensitizing effect of rosiglitazone was significantly blocked on overexpression of MnSOD (Fig. 5E–I), thus providing further testimony for a critical role of MnSOD in regulating the chemosensitizing effect of PPARγ activation. Similar treatment of nontumorigenic cells (MCF10A and 184A1) had negligible effects on MnSOD expression and cell survival, thus providing further evidence that this effect is specific to cancer cells (Supplementary Figs. S5A–F, S6A–H).
Validation of MnSOD as a potential target in chemotherapy-resistant breast cancer
Acquisition of chemoresistance remains a major challenge in the therapeutic management of breast cancer. Based on our data demonstrating the ability of MnSOD to block death signaling in breast cancer cells, we set out to generate chemotherapy resistant clones of MDA-MB-231 cell line and assessed the role of MnSOD. This was accomplished by exposing cells to DOX or DOC in a ‘stepwise increase’ method for a period of 4–6 weeks and selecting the surviving clones (Fig. 6A, B). Interestingly, the expression of MnSOD (mRNA and protein) was significantly increased in MDA-MB-231 cells that were rendered resistant to both the chemotherapy agents compared with the original MDA-MB-231 cell line (Fig. 6C–F). Furthermore, knockdown of MnSOD using gene-specific siRNA restored the sensitivity of the DOX and DOC MDA-MB231-resistant cell lines, MDA-MB-231 DOX-R and MDA-MB-231 DOC-R, respectively (Fig. 6G, H). Similarly, repression of MnSOD on ligand-induced activation of PPARγ restored chemosensitivity of the drug-resistant variants of MDA-MB-231 (Fig. 6I, J).

MnSOD-targeted chemosensitivity is linked to an accumulation of peroxynitrite
Finally, we set out to understand the mechanism involved in the decrease in viability of basal breast cancer cells and their increased chemosensitivity after down-regulation of MnSOD. Results show that down-regulation of MnSOD expression using siMnSOD or 15d-PGJ2 increases MitoROS as measured by the MitoSOX fluorescent probe. The increase in MitoROS caused by PPARγ activation could be inhibited by N-Acetyl cysteine (NAC) (Fig. 7A, B and Supplementary Fig. S7A, B), overexpression of MnSOD (Fig. 7C–E and Supplementary Fig. S7C), or preincubation with the PPARγ antagonist GW9662 (Fig. 7F–H and Supplementary Fig. S7D).
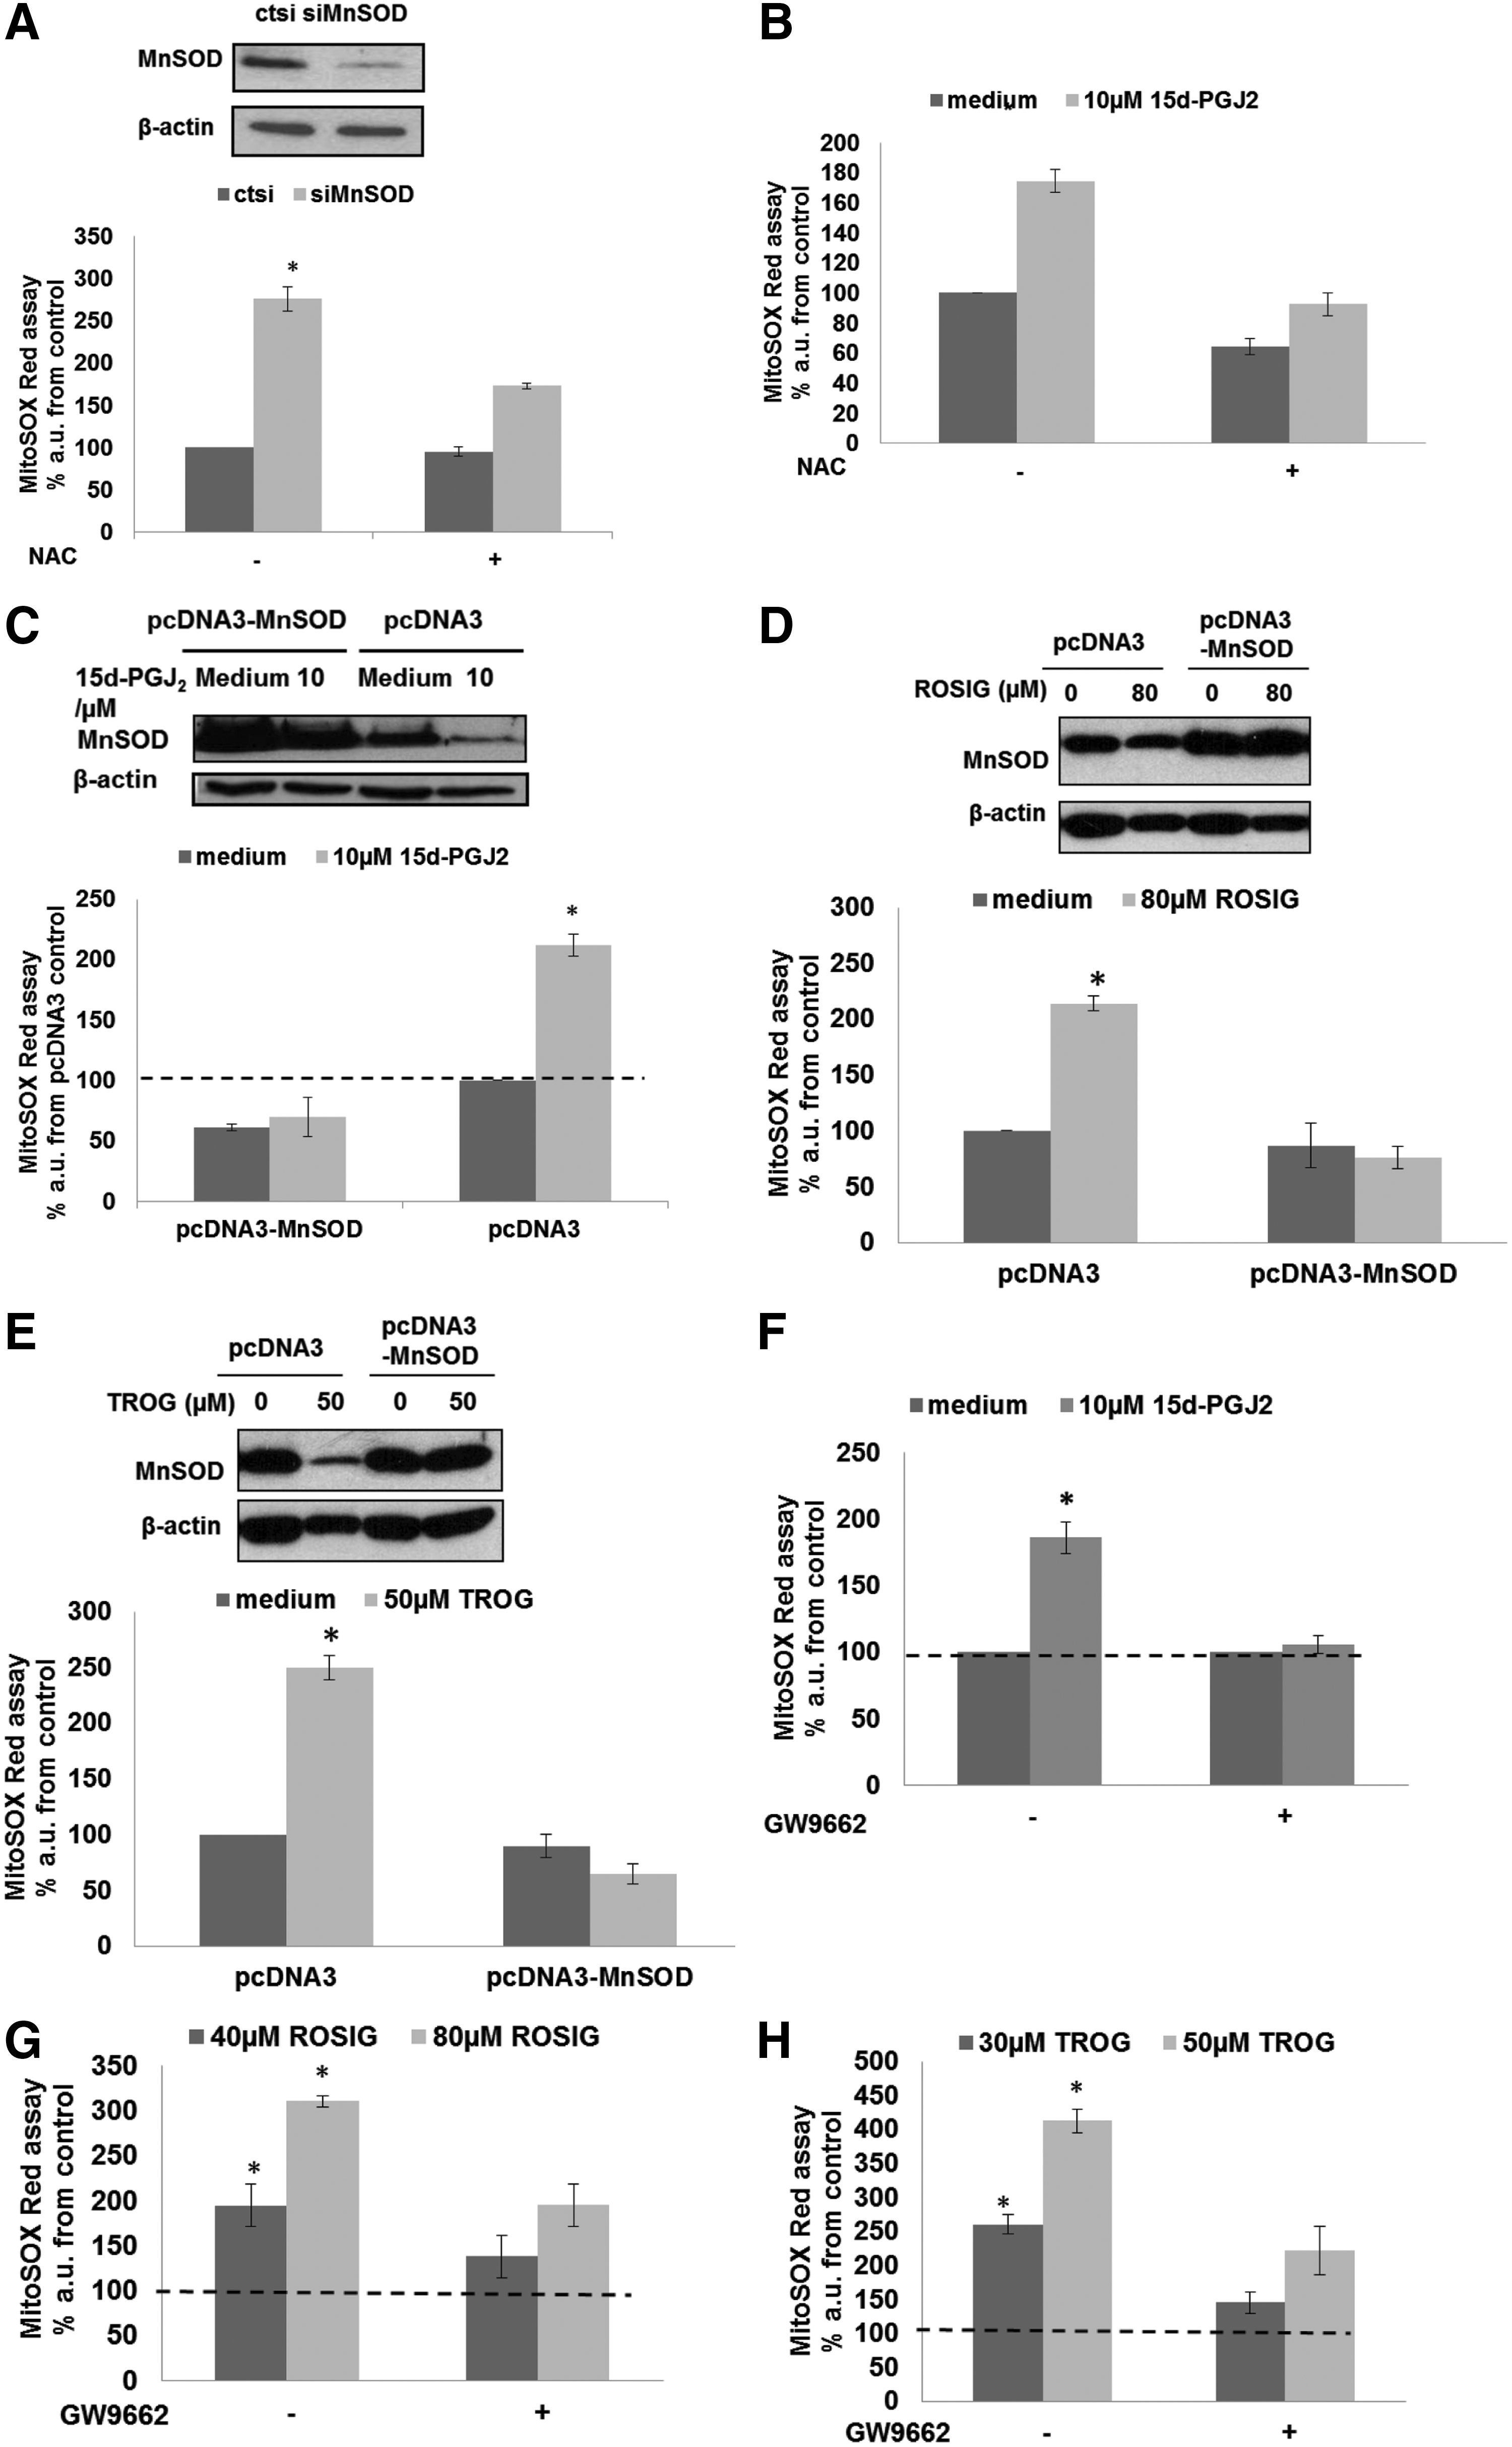
Since intracellular increase in ROS has been implicated in the anti-cancer activity of DOC or DOX (26, 68), we questioned whether the increased sensitivity of cancer cells to these drugs in combination with PPARγ ligands could be due to this accentuated mitochondrial oxidative stress. Indeed, MitoROS level measured by MitoSOX was further increased in MDA-MB-231 cells on combination treatment with rosiglitazone and DOX or DOC, compared with single agent treatment (Fig. 8A, B). Ectopic overexpression of MnSOD prevented rosiglitazone-induced increase in MitoROS and sensitization to DOC or DOX in MDA-MB-231 cells (Fig. 8C–E), whereas similar treatment of the nontumorigenic cell lines (MCF10A and 184A1) did not significantly alter intracellular ROS levels assayed by MitoSOX (Supplementary Fig. S8A–D).

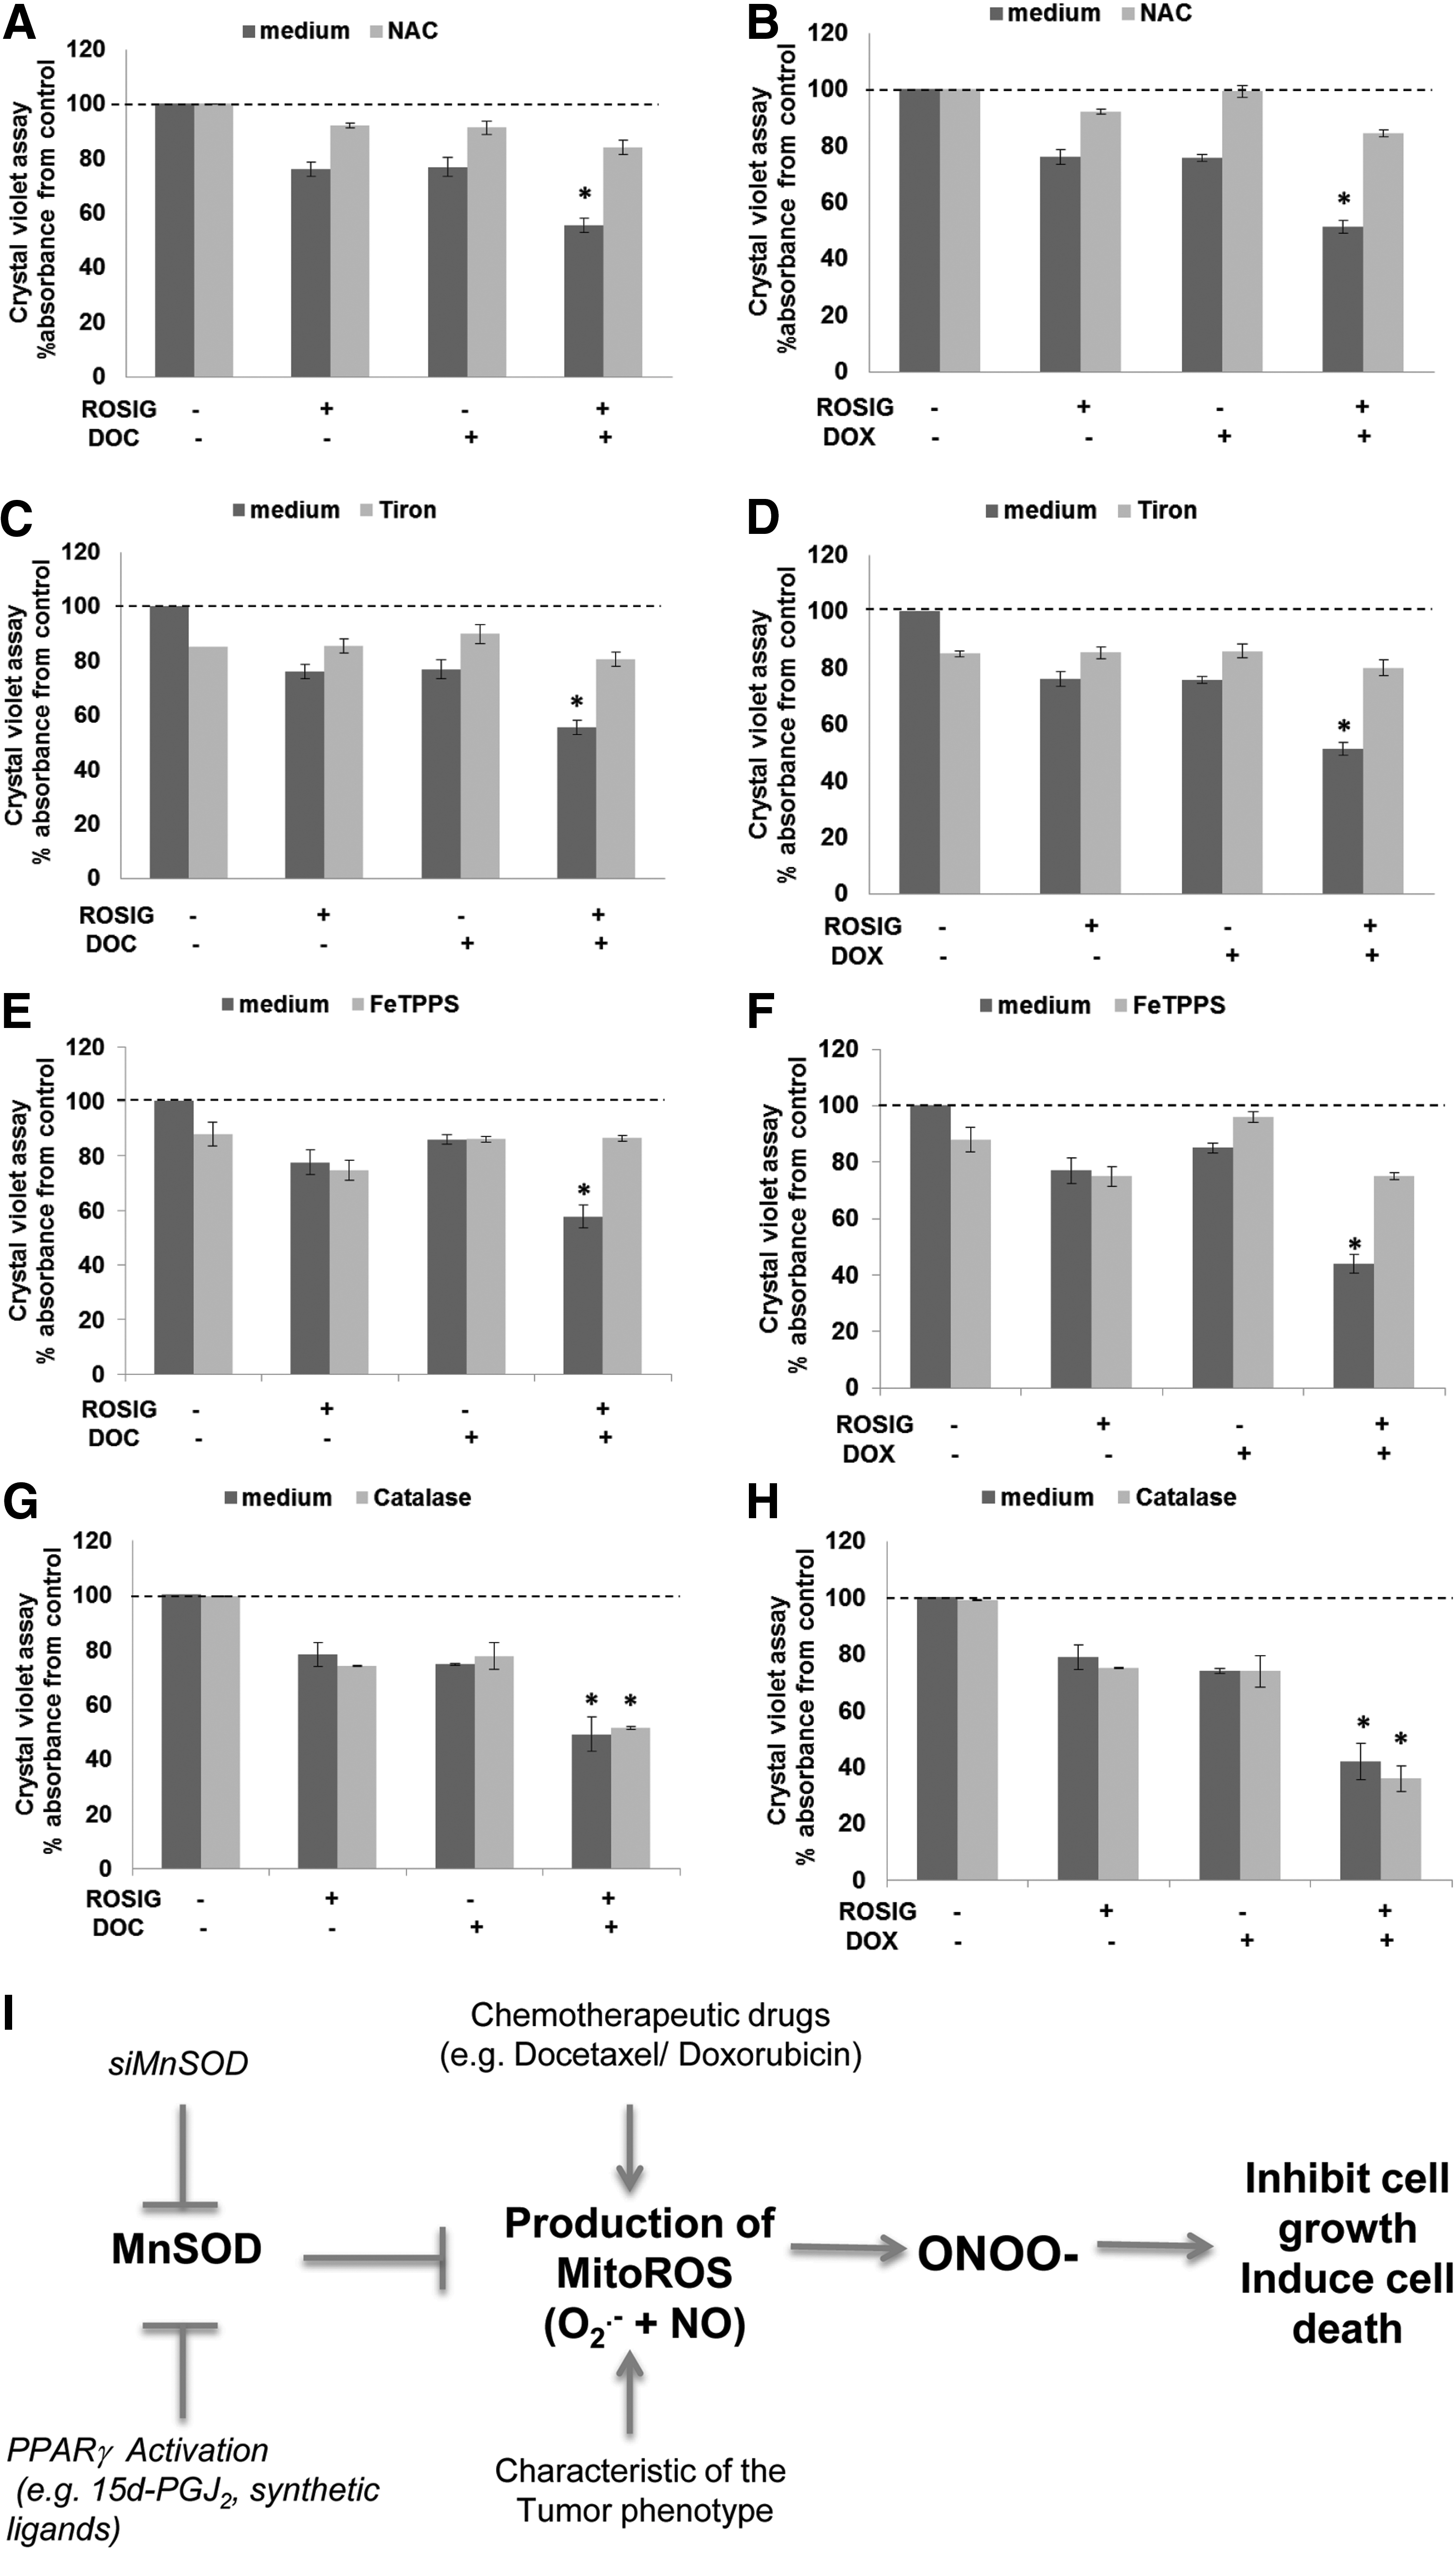
Accumulation of O2 − in the mitochondria was confirmed by showing that on treatment with rosiglitazone, DOC or DOX, tiron, but not catalase, could prevent the increase in MitoSOX fluorescence (Fig. 9D–I). Interestingly, in addition to O2 − production, mitochondria have also been shown to produce the reactive nitrogen species, nitric oxide (NO) (20). Using 4-amino-5-methyamino-2,7'-difluorofluorescein (DAF-FM) to detect NO, our data show that in addition to an increase in O2 −, an increase in NO level could be detected on silencing of MnSOD in MDA-MB-231 cells (Fig. 9A). NO level was also significantly increased on combination treatment with rosiglitazone and DOC or DOX compared with single-agent treatment (Fig. 9B, C). These data led us to hypothesize that mitochondrial O2 − production induced by MnSOD repression could react with NO to form the reactive nitrogen species, peroxynitrite (ONOO−), which could be responsible for the enhanced sensitivity to DOC or DOX (52). In agreement with this idea, chemosensitization to DOC or DOX by rosiglitazone was prevented by preincubation of the cells with NAC, Tiron, and the ONOO− decomposition catalyst, 5,10,15,20-Tetrakis(4-sulfonatophenyl)porphyrinato Iron (III), Chloride (FeTPPS), but not catalase (Fig. 10A–H). Taken together, these data indicate that ONOO− could be the probable species involved in mitigating enhanced chemosensitivity of basal-like breast carcinoma on gene knockdown or pharmacological inhibition of MnSOD (Fig. 10I).

Discussion
MnSOD expression is associated with aggressive sub-type of breast cancer
We report here, using hierarchical clustering of microarray data, that MnSOD expression was significantly different in the various subtypes of breast carcinoma. The Luminal breast carcinoma subtype associated with the less aggressive ER+ breast cancer phenotype had a significantly lower MnSOD expression than the Basal/Claudin-low breast carcinoma subtype that is often associated with the more aggressive ER- breast cancer phenotype.
Evidence from a host of earlier studies suggested a tumor suppressor role for MnSOD; however, the fact that MnSOD is overexpressed in a variety of cancers such as thyroid tumors, neuroblastomas, gastric and colorectal carcinomas (9, 28, 48) argues in favor of a complex functional biology of this protein in the various stages of cancer development and progression. Moreover, studies reported elevated levels of MnSOD in estrogen-independent breast cancer cell lines, MDA-MB-231 and BT-549, compared with estrogen-dependent, MCF-7 and T47D and nontumorigenic cell lines, MCF-12A and MCF-12F (33, 47). Hence, the correlation between MnSOD expression and tumor aggressiveness suggests the possibility of distinctly different expression patterns for the anti-oxidant gene depending on the stage of the tumor. This dual role of MnSOD was recently demonstrated in a model of skin carcinogenesis in which MnSOD expression was suppressed at a very early stage but increased at a later stage of the skin carcinoma (11). It is plausible that, similar to the development of skin carcinoma, MnSOD may be involved in the suppression of the early development of breast cancer but an increase in MnSOD expression is required for the acquisition of a more aggressive phenotype. Therefore, therapeutic strategies targeting MnSOD may need to be tailored in a subtype-specific manner. For example, the Luminal subtype might be sensitive to an increase in MnSOD expression while Basal and Claudin-low could be more susceptible to a decrease in MnSOD expression. This is further reinforced by the clinical outcomes data demonstrating that patients from the MnSOD-low group within the basal-like subtype may have a better survival than patients in the MnSOD-high group. These data provide impetus to the idea that within the basal carcinoma subtype, MnSOD expression could be a prognostic marker for poor survival. Indeed, supporting the critical role of MnSOD expression in the survival of Basal breast carcinoma and in agreement with a previous report (33), silencing of MnSOD using gene-specific siRNA was associated with a decrease in the colony-forming ability of MBA-MD-231 and BT549 cell lines. Interestingly, a previous study showed that the expression of MnSOD was an important factor in the response of gastric cancer cells to 5-flurouracil (26). In agreement with this article, we observed a significant increase in the basal MnSOD expression in breast cancer cells that were rendered resistant to DOX, and, more importantly, repression of MnSOD restored chemosensitivity in the resistant cells.
PPARγ activation: a promising approach to down-regulate MnSOD expression in basal breast carcinoma
Intrigued by our findings linking MnSOD expression to chemo-resistance, we set out to search for a clinically relevant approach to specifically decrease MnSOD expression in our model cell lines of basal breast carcinoma. To that end, we recently reported the presence of three putative PPREs (24) in the human MnSOD promoter and provided experimental evidence that human MnSOD was, indeed, a PPARγ target gene (64). Of note, among the three PPAR isoforms, PPARγ activation has been shown to inhibit the proliferation of malignant cells from different lineages such as liposarcoma (62), breast adenocarcinoma (14, 37, 40), prostate carcinoma (36), and colorectal carcinoma (12). Here, we present evidence that activation of PPARγ, either via its physiological ligand or on exposure to the synthetic ligands, resulted in repression of MnSOD in the basal type breast cancer cell lines (MDA-MB-231 and BT-549) in vitro as well as in a MDA-MB-231 xenograft model. Moreover, as a “proof of concept” using a cohort of diabetic patients treated with rosiglitazone, we established that rosiglitazone treatment correlated with a low level of MnSOD expression in the breast tumors of diabetic patients treated with rosiglitazone. These data provide strong evidence that the repression of MnSOD by PPARγ activation occurs not only in vitro, but also in vivo. Similarly, PPARγ activation-induced decrease in MnSOD significantly increased chemosensitivity of the two breast cancer cell lines. Interestingly, a previous report had demonstrated synergism between PPARγ activation and carboplatin in lung cancer cells; however, the target and exact mechanism of the increased chemosensitivity remained elusive (18, 19). Our results not only implicate MnSOD expression in the aggressiveness of the basal type breast cancers, but also provide evidence to link the anti-tumor activity of PPARγ activation to repression of this important anti-oxidant protein.
Repression of MnSOD enhances chemosensitivity via MitoROS generation
Since MnSOD is an important anti-oxidant protein expressed in the mitochondria, a logical explanation for these effects could be that an altered expression of MnSOD changes the redox milieu of cells, which could explain for the varied responses to drug treatment. Indeed, repression of MnSOD by siRNA was accompanied by an increase in mitochondrial O2 − production in tumor cells but not in nontransformed cells. This difference could be due to the Warburg effect, as cancer cells are under intrinsic oxidative stress and require a significantly higher antioxidant capacity than their normal counterparts (53). Coupled to this is the observation that the cellular levels of a major antioxidant enzyme, glutathione peroxidase, are significantly lower in tumor cells compared with normal cells (33). Thus, the intrinsic vulnerability of tumor cells provides a window for potential therapeutic exploitation.
Interestingly, intracellular ROS have been implicated in PPARγ-induced cytotoxicity; however, it is not entirely clear whether the effect on intracellular ROS is linked to the transcriptional activity of the active nuclear receptor or a bystander effect. Our results show a clear increase in intracellular ROS as well as intra-mitochondrial O2 − production in human breast carcinoma cell lines after exposure to the PPARγ ligands, whereas no detectable increase was observed in nontransformed cells. This could be due to the significantly lower expression of PPARγ in the nontransformed cells, thereby rendering them insensitive to low concentrations of 15d-PGJ2, unlike tumor cells. This is further supported by the insignificant change in PPARγ activity when nontransformed cells were exposed to increasing doses of 15d-PGJ2, thus strengthening the therapeutic potential of specifically targeting tumor cells with PPARγ ligands. It is worth pointing out that Martinez et al. had previously reported a similar effect of 15d-PGJ2 on cellular ROS generation (46).
Based on the published reports, a number of possible mechanisms of PPARγ-induced increase in intracellular ROS have been proposed (Table 1). These reports suggest that altering redox homeostasis to activate apoptotic pathways is closely associated with PPARγ-induced cytotoxicity. We show that not only does the expression of MnSOD decrease on activation of the PPARγ receptor (by natural or synthetic ligands), but also the resultant increase in mitochondrial O2 − could be blocked by the overexpression of MnSOD as well as by the PPARγ antagonist GW9662. Most importantly, this increase in MitoROS via repression of MnSOD appears to be an effector mechanism in the significant synergism observed with the combined use of PPARγ ligand and chemotherapeutic agents, DOX and DOC. The synergism is not only in terms of increased sensitivity to cell death, but also in an amplification of intracellular ROS given that DOC and DOX are known inducers of oxidative stress. A similar mechanism might explain the observed synergy between rosiglitazone and carboplatin in lung carcinoma, considering that carboplatin and other platinum-based compounds trigger an increase in MitoROS (7). Importantly, the involvement of the reactive ONOO− via the reaction between mitochondria-dependent O2 − and NO production is proposed. This observation is further supported by the use of ROS scavengers Tiron and FeTPPS, which effectively attenuated the chemosensitization caused by PPARγ-induced repression or gene knockdown of MnSOD in the basal breast carcinoma. Similar findings implicating ONOO− as an effector molecule in inducing cancer cell cytotoxicity have recently been reported (16, 66, 71). These independent reports provide precedence to the possible involvement of ONOO− in the enhanced chemosensitivity of basal breast carcinoma on targeting MnSOD expression by PPARγ ligands.
Therefore, these results support the correlation between MnSOD repression by PPARγ activation, and increased oxidative stress in tumor cells. It also provides an explanation for other studies that associated MnSOD deficiencies to an increase in intracellular ROS production (45, 67, 70).
Concluding remarks
In conclusion, our study not only highlights the association between increased MnSOD expression and an aggressive subtype of breast cancer, but also provides evidence for the judicious use of PPARγ agonists as chemosensitizers in this particular subtype of breast cancer for targeted ROS-mediated strategy that warrants serious consideration in the clinical settings.
Materials and Methods
Reagents
Roswell Park Memorial Institute (RPMI) 1640 medium, Dulbecco's modified Eagle's medium, phosphate-buffered saline (PBS), fetal bovine serum (FBS), charcoal-stripped FBS,
Cell lines and culture conditions
ER-negative MDA-MB-231, MDA-MB-468, BT-549, MCF-10A, and 184A1 breast cancer cells (American Type Culture Collection) were used. Cells lines were routinely maintained in RPMI 1640 for tumor cell lines and mammary epithelial cell growth medium for normal epithelial cell lines supplemented with 10% FBS, 2 mM
Western blot analysis
Western blot was performed as previously described (1). For details, refer to Supplementary data.
RNA isolation, reverse transcription, and real-time polymerase chain reaction
Total RNA was isolated from cells by TRIZOL reagent (Invitrogen), as described by the manufacturer's instructions. Reverse-transcription reaction was carried out using ABI PRISM 7500 (Applied Biosystems). Primers and probe for human 18S, human PPARγ, and human MnSOD were purchased from Applied Biosystems (Assays on Demand). For details, refer to Supplementary data.
Transfection
In vitro transfections were done using LipofectAMINE 2000 (Invitrogen) following the manufacturer's protocols. For silencing studies, 200 nM of MnSOD siRNA (5′-AAAUUGCUGCUUGUCCAAAUC-3′) (17) or scrambled control siRNA (5′-AGCUUCAUAAGGCGCAUGCTT-3′ [luciferase gene sequence inverted]) was transiently transfected into MDA-MB-231 and 184A1 using LipofectAMINE RNAiMAX (Invitrogen) following the manufacturer's protocols.
MTT assay
Cell number after drug treatment was assessed by MTT assay as previously described (44).
Crystal violet assay
Cell number after drug treatment was assessed by crystal violet uptake assay as previously described (1).
MitoSOX red assay
Intracellular mitochondrial O2 − production was detected via MitoSOX Red (Invitrogen) staining as previously described (44).
DAF assay
Intracellular NO production was detected via DAF-FM (Invitrogen) staining as per manufacturer's instructions.
Luciferase assay
The luciferase reporter construct used was pPPRE-tk-Luc, which contains three PPREs from rat acyl-CoA oxidase promoter under the control of the Herpes simplex virus thymidine kinase promoter. PPRE promoter activities were assessed with a dual-luciferase assay kit. Bioluminescence generated was measured using a Sirius luminometer (Berthold). The luminescence readings obtained were normalized to the protein content of the corresponding cell lysate.
Colony forming assay
Cells transfected with control scrambled siRNA (ctsi) and siMnSOD were subjected to DOC and DOX treatment for 48 h. After this, cells were trysinised and 15,000 cells per treatment were re-seeded into 100 mm dishes and left to grow for 10 to 15 days with complete medium. At the end of the assay, cells were washed and stained with crystal violet.
Soft agar colony forming assay
Soft agar colony formation assay was performed in 96-well plates after MnSOD siRNA transfection followed by DOC and DOX treatment. Briefly, 5×10³ cells were seeded into 100 ml 0.35% agarose onto the 0.5% agarose base layer. Serum supplemented medium (100 ml) containing drug was added on the top and changed every 3 days. After 10 days, total number of colonies per well that were >100 microns in size when viewed under a simple microscope were counted (31). Light microscopy images were captured under 100× magnification.
Mouse xenograft model
To determine the in vivo activity of 15d-PGJ2, viable MDA-MB-231 cells (1×10⁷) resuspended in 100 μl Matrigel and PBS were injected into the mammary fat pad of 6-week-old female Balb/c nude mice (Orient Bio, Inc.). When average subcutaneous tumor volume reached 50–70 mm3, mice were assigned into two treatment groups: (i) control (vehicle only) and (ii) 15d-PGJ2 given at a dose of 5 mg/kg via tail vein every 3 days. Control groups were treated with vehicle. Tumor size was measured daily with a caliper (calculated volume=shortest diameter2×longest diameter/2). Mice were followed for tumor size and body weight and were sacrificed on the 18th day. Tumors were resected, weighed, and frozen or fixed in formalin and paraffin embedded for IHC studies.
Clinicopathological data
The study material comprised 15 cases of mammary carcinoma diagnosed at or referred to National University Hospital, Singapore, between 2004 and 2006 (37).
Immunohistochemistry for MnSOD
IHC detection of MnSOD antigen was done on formalin-fixed, paraffin-embedded tumor breast tissues. Stained sections were viewed on an Arcturus PixCell II LCM System. Pictures of stained sections were taken using an Olympus camera (Model C5050). The expression status of MnSOD was scored by following standard 4-tiered scoring practice, ranging from 0 to +3. For statistical analyses, negative (0) and weak expression (+1) were grouped together and termed ‘low expression’ of the proteins. Moderate (+2) and strong (+3) expression was termed ‘high expression’.
Generation of DOX- and DOC-resistant cells
Generation of MDA-MB-231 DOX- and DOC-resistant cells was carried out by exposing cells first to one-tenth of IC50 for 24 h before replacing with fresh medium. Cells were then allowed to proliferate before exposure to stepwise increasing concentrations of the drug for 24 h each time. The starting dose of DOX used was 0.1 μM, and the dose was increased by 0.1 μM each time. The starting dose of DOC used was 10 nM, and the dose was increased by 10 nM each time. Cells were passaged whenever 80%–90% confluency was reached. After 4–6 weeks, cell viability assay was carried out on parental (drug sensitive) and drug-resistant cell lines to measure fold resistance.
Data preprocessing of TCGA and affymetrix breast cancer data
Invasive ductal breast cancer data were downloaded from TCGA (
Breast cancer data on Affymetrix U133A or U133Plus2 platforms were downloaded from Array Express and GEO. The panel of human breast cancer data utilized for analysis comprises 3992 tumor samples from 26 cohorts (22). Robust Multichip Average normalization was performed on each dataset. The normalized data were combined and subsequently standardized using ComBat (29) to remove batch effect.
Identification of breast cancer subtypes
Breast cancer subtype signature was obtained from Prat et al., 2010 (57). Subsequently, ssGSEA (65) was computed based on the breast cancer subtype signature for each sample. Each sample was then assigned to be the subtype under which it has the maximum ssGSEA score.
Statistical analysis
Statistical analysis was performed using paired Student's t-test. A p-value of<0.05 was considered significant. Statistical significance evaluation by Mann–Whitney test and Spearman correlation test were computed using Matlab®. Dot plot and Kaplan–Meier analysis were done using Graphpad Prism.
Footnotes
Acknowledgments
PPARγ mutant (PPARγC126A/E127A) (PPARγDN) ( ) was kindly provided by Christopher K. Glass (UCSD, San Diego, CA). The pcDNA3-MnSOD plasmid was kindly provided by Daret St. Clair (University of Kentucky College of Medicine, Lexington, KY). The luciferase reporter construct pPPRE-tk-Luc was a kind gift from Ronald M. Evans, The Salk Institute for Biological Studies, San Diego, CA.
This work was supported by grants from the National Medical Research Council, Singapore, to M.V.C., S.P., and A.P.K. [R-183-000-204-213] and to A.P.K., M.V.C., and S.P. [R-713-000-124-213]. A.P.K. and S.P. are also supported by the Cancer Science Institute of Singapore, Experimental Therapeutics I Program [Grant R-713-001-011-271]. J.I.P. was supported by the Korea Science and Engineering Foundation (KOSEF) grant funded by the Korean government (MEST) [R13-2002-044-05002-0].
Author Disclosure Statement
No competing financial interests exist.
Abbreviations Used
References
Supplementary Material
Please find the following supplemental material available below.
For Open Access articles published under a Creative Commons License, all supplemental material carries the same license as the article it is associated with.
For non-Open Access articles published, all supplemental material carries a non-exclusive license, and permission requests for re-use of supplemental material or any part of supplemental material shall be sent directly to the copyright owner as specified in the copyright notice associated with the article.
