




Abstract
Introduction
R
Challenged by oxidants from chloroplasts, peroxisomes, mitochondria, and the apoplast, plants have evolved sophisticated mechanisms that control ROS and their damaging properties. This control extends beyond mere detoxification: The production of specific ROS in specific contexts has provided ample opportunities for the evolution of signaling mechanisms involving ROS.
Mechanisms of ROS accumulation in plants can be catalogued into three categories: (i) Metabolic “background” ROS accumulation through “leaky” ROS-scavenging systems (42). (ii) Oxidative stress when changing environmental conditions give rise to metabolic imbalances (131). (iii) Active ROS production through regulation of ROS-producing enzymes, best exemplified by apoplastic oxidative burst in response to pathogen attack (75, 132).
The boundaries separating these three categories are not sharp. For example, the drop in antioxidant defense during senescence could be regarded as either “metabolic background” or “active” ROS accumulation. The antioxidative capacity of peroxisomes is severely reduced during senescence. This is caused by active down-regulation of antioxidant enzymes, resulting in H2O2 leaking into the cytosol (30). Furthermore, these three processes, separated here for the purpose of simplicity, are not always spatiotemporally isolated from each other in vivo but can happen simultaneously. Nonetheless, ROS from all three categories can function as a signal.
ROS of category 1: The ROS production at the electron transport chains of mitochondria and chloroplasts is unavoidable. If ROS were exclusively harmful for the organism, the redox defense would have adapted to eliminate the accumulation of ROS. In plants there is a significant accumulation of H2O2 in seedlings under normal growth conditions in light (18), which can be considered a background. It has been suggested that ROS-scavenging systems are regulated to operate below full capacity to lower the threshold for ROS signaling. Thus, the continuous flow of ROS through the cell relays information between different subcellular compartments (42, 131). Furthermore, ROS production and the synthesis of ROS-producing/scavenging enzymes fluctuate according to a diurnal cycle, most likely for the use of ROS as signal molecules (73).
ROS of category 2: ROS arising from metabolic imbalances after changes in environmental conditions. Historically, these ROS were considered to be directly toxic for the plant, oxidizing a wide spectrum of biomolecules and eventually leading to cell death. In contrast to the historical view, the cell death evoked by these ROS is not necessarily a consequence of the damage caused by ROS but the result of specific protein-mediated signal transduction events. The fluorescent (flu) mutant accumulates protochlorophyllide, the precursor of chlorophyllide and an efficient photosensitizer generating 1O2. When transferred from dark to light, flu plants produce massive amounts of 1O2 (69, 101). An extensive analysis of flu has shown that cell death mediated by ROS is dependent on downstream signaling (110). Cell death in flu is suppressed by a loss-of-function mutation in the EXECUTER1 gene, which is related to ROS ignal transfer from the chloroplast to the nucleus. However, even executer1 plants will eventually die when the ROS load is further increased, probably due to the toxicity of ROS.
ROS of category 3: Plants, like animals, have enzymes that are dedicated to active ROS production. Respiratory burst oxidase homologs (RBOHs) at the plasma membrane integrate symplastic signals, including calcium and protein phosphorylation, and once activated, they transfer electrons from symplastic NADPH to apoplastic oxygen, generating O2 •− at the apoplastic side of the plasma membrane (132). In addition, apoplastic peroxidases, peroxisomal xanthine oxidases, and several other enzymes are capable of coordinated ROS production. These proteins form the most prominent sources of quickly and precisely tuned ROS signaling.
Understanding the signals elicited by different ROS has been challenging (94). An accurate interpretation of ROS in signal transduction requires an indicator or reporter assay that is activated in response to specific signals. ROS-induced cell death can be measured by proxy (through electrolyte leakage, also referred to as ion leakage) or visually detected by staining that labels dead or dying cells; for example Trypan blue or Evans blue (145). However, ROS also elicit responses other than cell death; for example stomatal closure (57, 107) or priming of a plant's defenses (105). One sensitive, commonly used indicator of cellular change is the measuring of changes in gene expression, or rather transcript abundance, using suitable marker genes. Even though the transcript levels of a single gene, or even a set of genes, may not have any predictive power regarding the plant's future, it might reveal something about the plant's immediate past: which signals have been sensed and which pathways have been activated. As a consequence, expression profiling, from a few marker genes up to the entire transcriptome, has been used to investigate ROS signaling (44, 46, 95, 109, 111, 127, 141, 142, 144).
The next few sections summarize how ROS are produced in plants, how these ROS have been artificially produced or their production has been induced under experimental conditions, and how plants respond to these ROS at the transcriptional level. Finally, a critical evaluation of the use of “specific” marker genes is presented along with recommendations for a ROS gene expression experiment.
Apoplastic ROS
Biological role
The cell wall outside the plasma membrane is an integral part of the plant cell. It provides not only mechanical support but also a framework for an aqueous matrix that enables cell-to-cell and air-to-cell diffusion. This diffusion space is called the apoplast, while the symplast consists of the area inside the plasma membrane (Fig. 1). Since the apoplast is the first contact surface for substances entering the leaf, many environmental perturbations first affect the apoplast. Pathogens seeking to infect the plant first come into contact with the apoplast (10). Signaling molecules for cell-to-cell and plant-to-plant communication can diffuse in the apoplast. Thus, it is not surprising that the plasma membrane has hundreds of membrane-spanning receptor proteins with sensory domains residing on the apoplastic side (79, 126).
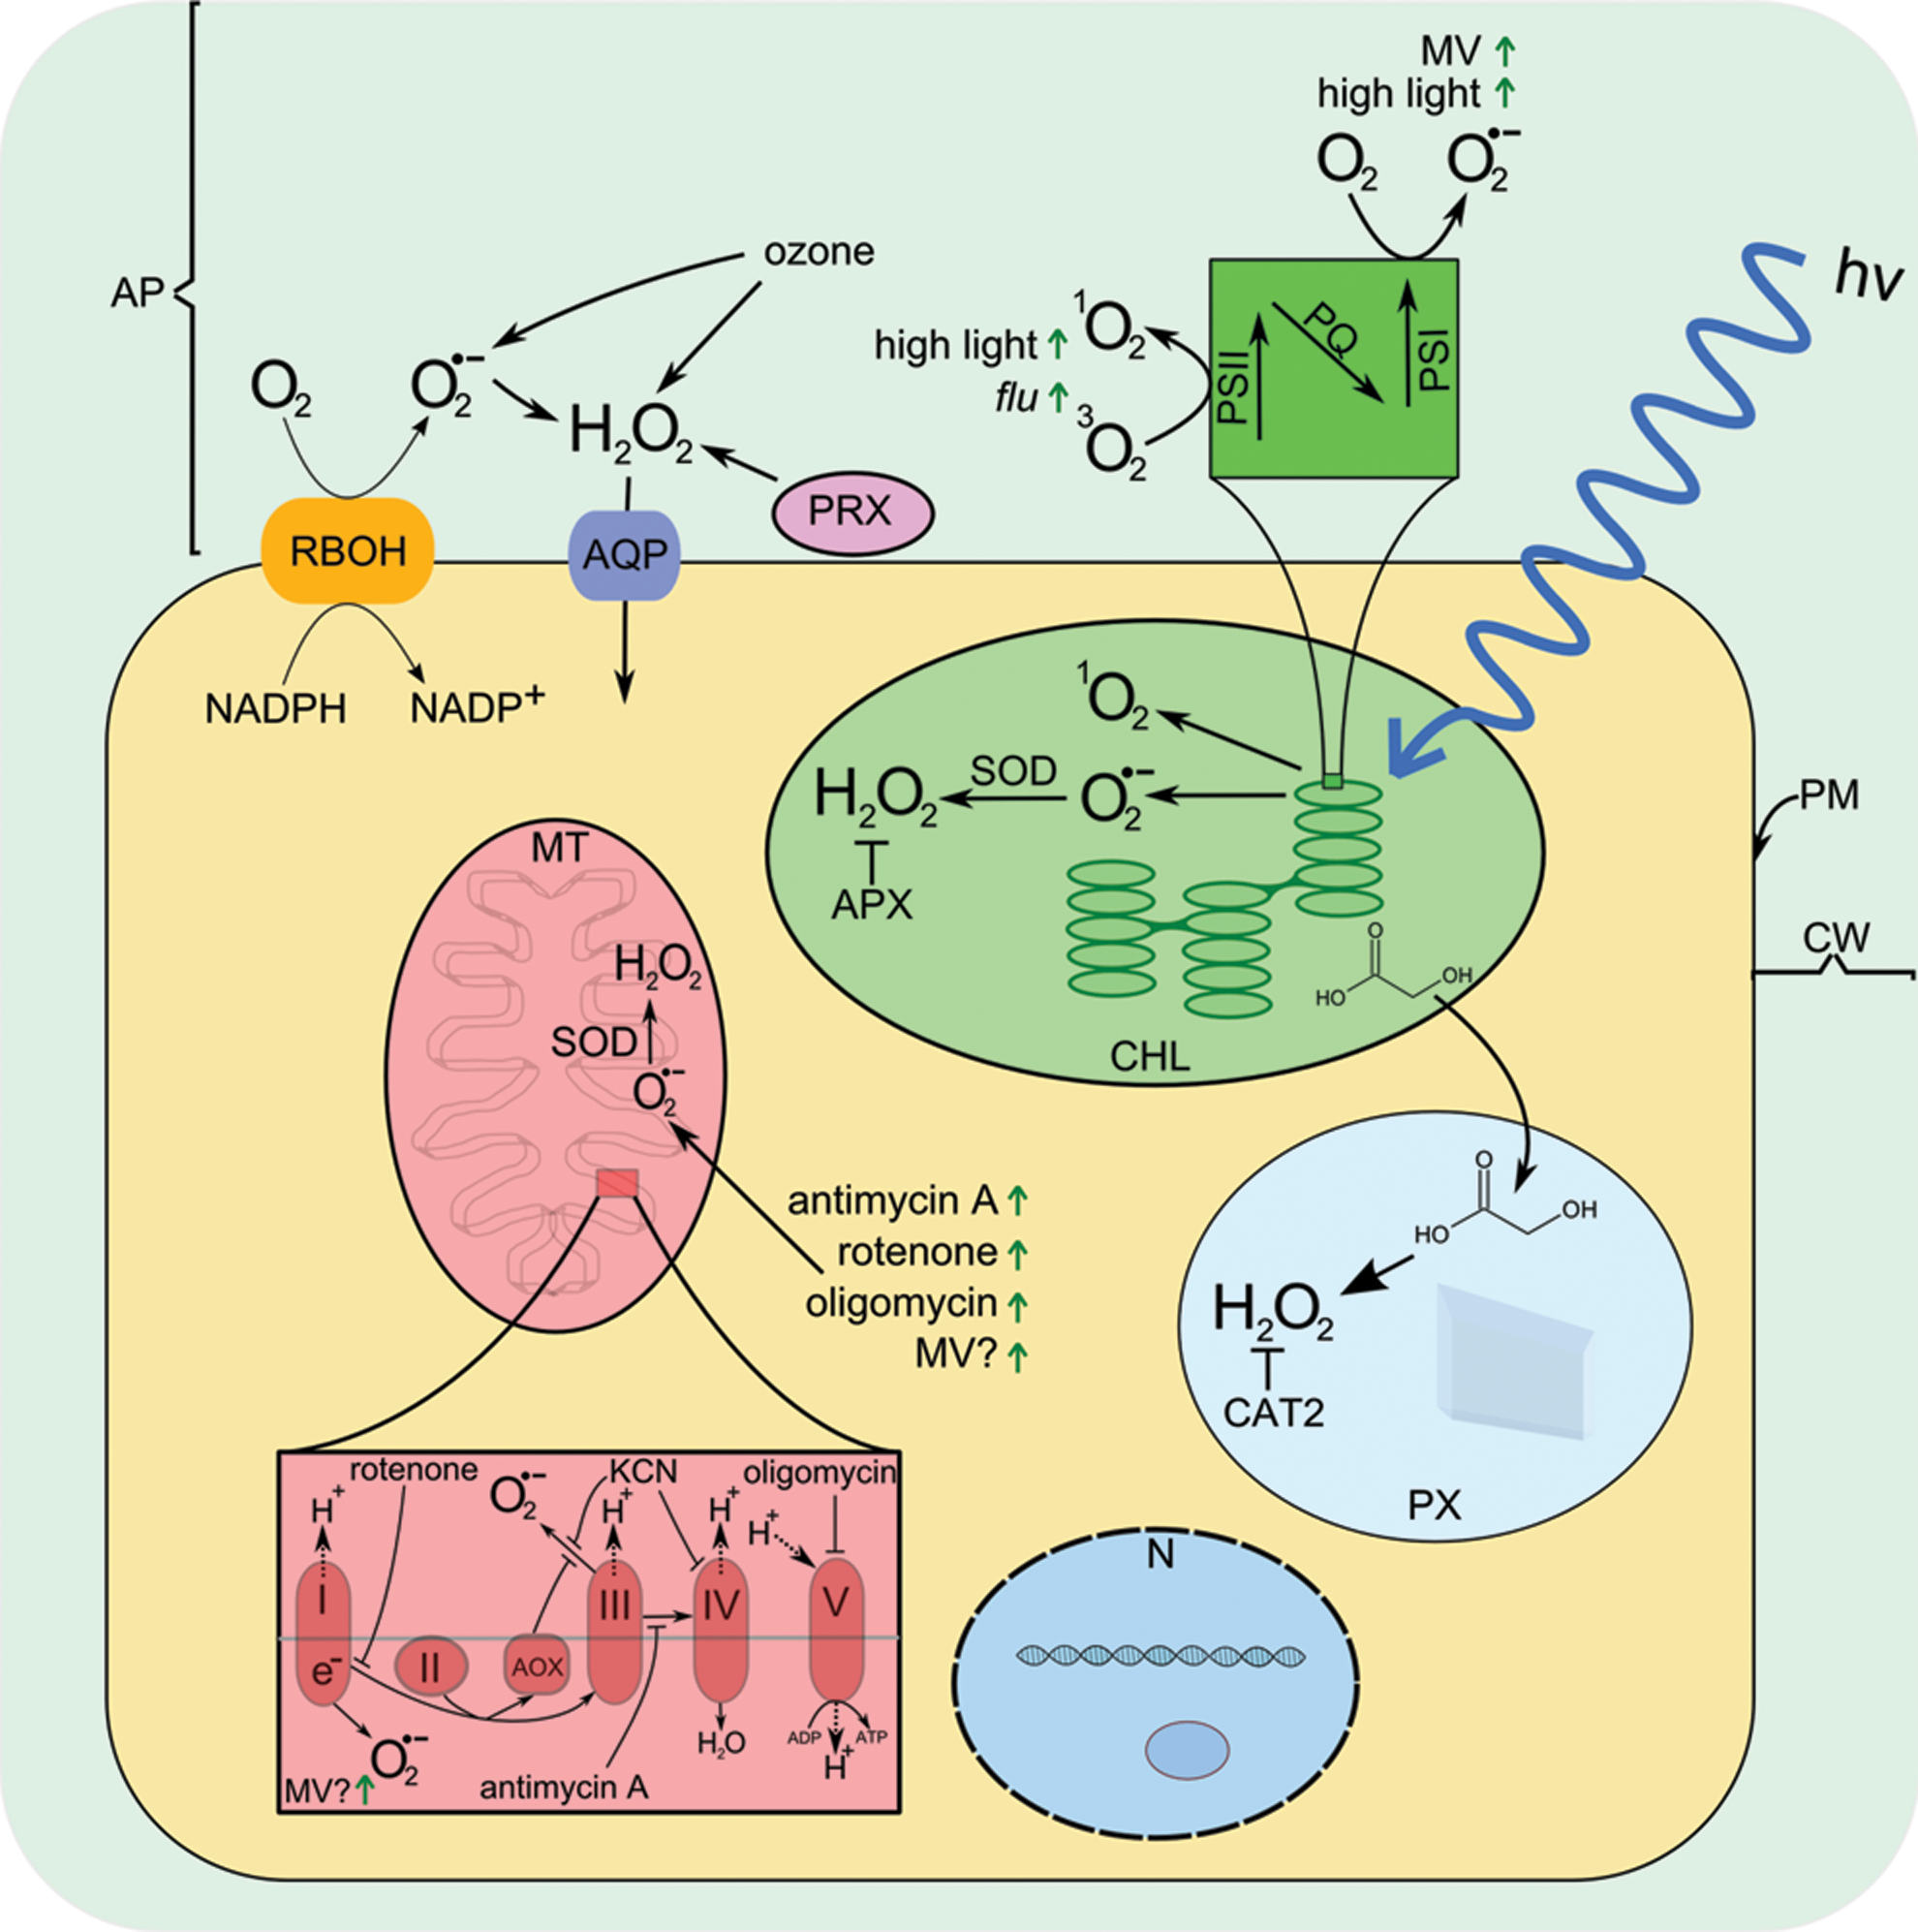
The formation of lignin polymers, a major component of the plant cell wall, requires ROS to initiate the polymerization of monolignols. Cell wall-localized peroxidases (PRXs) and NADPH oxidases at the plasma membrane are necessary components for cell wall lignification (36, 77). Excess antioxidant capacity would inhibit the lignification process; thus, the apoplast has a lower redox-buffering capacity compared to the chloroplast or mitochondrion. The known scavengers include superoxide dismutase (SOD) (64, 106) that dismutates O2 •− to H2O2, and a comparatively low concentration of ascorbate. The reduction of dehydroascorbate does not take place in the apoplast but requires import and recycling (153). As a consequence of this lower detoxification capacity, ROS produced in the apoplast have a comparatively higher chance of reaching downstream signaling components before being quenched by the redox defense. In addition, similar enzymatic machinery, NADPH oxidases and PRXs, catalyze cell wall formation and the apoplastic pathogen-induced oxidative burst (28, 75, 132). Neighboring cells can sense this burst and transduce it to cytosolic signaling, thereby joining, what has been termed, the “ROS wave” (94). Apoplastic ROS production is not only relevant for pathogen defense but also involved in abscisic acid (ABA)-induced stomatal closure (154) and the signaling in response to abiotic stresses (132).
Experimental production
There are several ways to induce an apoplastic oxidative burst for experimental purposes. The gaseous ROS ozone (O3), the triatomic form of oxygen, enters through the stomata into the apoplast, where it breaks down and forms H2O2, O2 •−, and •OH. Subsequently, plant cells actively produce apoplastic ROS in response to O3 (104). This system requires minimal manipulation of the plants, thus minimizing possible effects from improper handling. The apoplast can also be infiltrated with substrate/enzyme pairs that chemically produce ROS. These include xanthine/xanthine oxidase, which produces a mixture of O2 •− and H2O2 (58), and glucose/glucose oxidase (4), which produces H2O2. Various microbial elicitors such as flagellin-derived 22-amino-acid peptide (flg22), a short peptide derived from bacterial flagellin, trigger intracellular signaling events leading to an apoplastic oxidative burst (88).
Chloroplastic ROS
Biological role
ROS are produced at high rates in chloroplasts during photosynthesis. At photosystem II (PSII), 1O2 is generated when the plastoquinone (PQ) pool is in a highly reduced state; for example as a consequence of high light, drought, or low carbon dioxide (CO2) concentration (71). Electrons excited at photosystem I (PSI) can escape to molecular oxygen generating O2 •− which is quickly dismutated to H2O2 (Fig. 1) (5). The amounts of ROS produced in the chloroplast are significant. Estimates suggest that in the light chloroplasts produce 20 times more H2O2 per area unit than mitochondria (40). If uncontrolled, this constant flow of ROS could cause problems, as H2O2 inhibits photosynthesis already at micromolar concentrations by modifying redox-regulated enzymes of the Calvin cycle, and chloroplastic ROS can affect and damage PSI and PSII and the thylakoid electron transport systems in general. To counteract the high ROS generation rates, chloroplasts contain an array of ROS-scavenging enzymes that are backed up by high concentrations of the low-molecular-weight antioxidants ascorbic acid and glutathione. This redox buffer appears to be finely balanced to match ROS generation rates, and this tight balance between ROS production and quenching enables increased ROS production rate to function as a signal (5, 27, 40, 42).
Chloroplastic ROS production has been shown to participate in the responses to various biotic and abiotic stresses (100, 156). However, the mechanisms by which stress conditions are sensed and integrated and how chloroplastic ROS accumulation is interconnected with stress signaling are not completely clear.
Experimental production
There are numerous ways to induce ROS production in the chloroplast. Most approaches involve disturbing the photosynthetic electron transport chain chemically, genetically, or with manipulation of light conditions.
Various chemicals affecting different processes in the chloroplast have been used to study the effect of ROS. Norflurazon inhibits carotenoid synthesis and causes photo-oxidative damage in the light (2). N-octyl-3-nitro-2,4,6-trihydroxybenzamide (PNO8) inhibits PSII by inducing proteolytic degradation of D1 protein (98). Lincomycin inhibits chloroplast protein synthesis (50). Methyl viologen (MV), N,N′-dimethyl-4,4′-bipyridinium dichloride, which is an effective compound in a redox cycling herbicide paraquat, can accept electrons from PSI and transfer them to molecular oxygen generating O2 •−, which is quickly dismutated to H2O2 (7). However, the interpretation of experimental data using inhibitors is complicated by potential side effects of the chemicals.
Genetic modifications which induce chloroplastic ROS production include the flu-mutant and a set of flu-like mutants that create a burst of 1O2 on dark-to-light transition (101, 120). Another approach is the expression of glycolate oxidase in the chloroplast, which leads to H2O2 production through oxidation of glycolate in conditions that induce photorespiration (37). The amounts of ROS can also be manipulated through alteration of the ROS detoxification machinery. Plants with increased chloroplast ROS scavenging tend to be more tolerant to stress and vice versa for knockouts (5). However, the exact phenotype depends on the scavenging enzyme targeted and on subtle variations in growth conditions between different laboratories (47, 63).
A potential disadvantage of working with mutants or transgenes which constitutively alter the ROS production or the redox balance in chloroplasts is that plants grown to maturity before experiments are likely to have fully acclimated to the altered ROS signal. More elegant approaches to study fast responses include the use of transient expression or silencing. Estrogen-induced transient silencing of tAPX revealed a role for chloroplast H2O2 in retrograde signaling and cold acclimation (85).
Several stress conditions, including high light, salinity, and drought, accelerate chloroplastic ROS production (92). However, chloroplasts are not the only organelles affected by these stresses; thus the specificity regarding ROS signaling is difficult to address. Excess light causes over-reduction of the PQ pool. When excited electrons cannot move from PSII to PQ efficiently enough, the generation of 1O2 is accelerated. Exogenously applied H2O2 has been shown to increase the amount of oxidized PQ, thus reviving the electron transport chain and decreasing 1O2 production (131).
Peroxisomal ROS
Biological role
Peroxisomes are essentially found in all eukaryotes. In plants they are mainly known for their role in photorespiration where they recycle glycolate. H2O2 is produced through several reactions, including oxidation of photorespiratory glycolate and β-oxidation of fatty acids. Inside the peroxisome, O2 •− is produced in a reaction that is catalyzed by xanthine oxidase, and also at the peroxisomal membrane by a small electron transfer chain. The produced O2 •− is dismutated into H2O2 by a peroxisomal SOD (31).
Peroxisomes produce H2O2 at even a higher rate than chloroplasts and similar to chloroplasts, they have a high redox-buffering capacity (40). However, if the activities of antioxidative enzymes are reduced, H2O2 can leak out from the peroxisome. Especially catalase seems to be an irreplaceable member of the peroxisomal ROS detoxifying machinery. Photorespiratory H2O2 leaking out of the peroxisome could function as a message from the chloroplast relayed into the cytosol (40).
Experimental production
Peroxisomal ROS production can be induced by two strategies: by accelerating photorespiration or by removal of catalase through knockout or silencing. Arabidopsis and many other plants contain three catalase genes. However, based on knockout phenotypes, CATALASE2 (CAT2) contributes toward the major catalase activity in Arabidopsis leaves (90). Thus, the cat2 mutant and CAT2 silenced plants have been extensively used to study the role of peroxisomal H2O2 in cell death and gene expression (16, 141). Typically, these experiments are performed by keeping plants in low light/short day length or high CO2 to suppress photorespiration and then by transferring them to high light or normal CO2 to elicit ROS production (cat2+high light, cat2+low CO2). These approaches are noninvasive and should not be affected by developmental acclimation and thus offer a system to follow the kinetics of ROS production and downstream responses in gene expression (111). Interestingly, a catalase knockdown mutant of the green alga Chlamydomonas reinhardtii lacks a transient accumulation of H2O2 on transfer to high light that in wild type (wt) is achieved through down-regulation of catalase activity, possibly through thiol modification (91). This illustrates how knockdown of antioxidant enzymes may affect not only the absolute levels of ROS but also the temporal dynamics.
Mitochondrial ROS
Biological role
Mitochondria are a major source of ROS in animal cells. In plants, their contribution to total ROS pool is comparatively smaller (40), at least under normal growth conditions. However, it has been estimated that plant mitochondria produce ROS at rates equal to or higher compared to animal mitochondria (96). At complexes I and III of the mitochondrial electron transport chain (mtETC), O2 •− is produced and further dismutated to H2O2 by mitochondrial SOD (96, 116).
The proton gradient across the mitochondrial membrane is the driving force for ATP production. The high proton gradient favors mitochondrial ROS production by contributing to to over reduction of mtETC components and by extending the lifetime of reactive intermediates such as semiquinone radical, thus increasing the probability of electrons escaping to O2 (70). Similar to animals, plants have uncoupling proteins (UCPs) that can unload the proton gradient across the mitochondrial membrane (54, 116). In addition to UCPs, however, plants have several other means of fine-tuning the function of mtETC. Plants have two mitochondrial respiratory pathways, whereas most animals have only one. Electrons from the oxidation of NADH (in complex I) and succinate (in complex II) are in both pathways transferred to ubiquinone, thereby reducing it to ubiquinol. From ubiquinol electrons can be transferred either via complexes III and IV to oxygen or directly from ubiquinol to oxygen by alternative oxidase (AOX), thus bypassing complexes III and IV. Unlike complexes III and IV, AOX does not pump protons across the inner mitochondrial membrane, thus uncoupling ubiquinol oxidation from proton pumping. In addition to the two respiratory pathways described, plants have a third option for regenerating NAD+: Complex I is not the only mitochondrial NADH dehydrogenase in plants; other, type II NAD(P)H dehydrogenases exist (96, 115). These enzymes do not pump protons across the membrane, enabling an uncoupling of the oxidation of NADH from proton pumping.
Since complexes I and III are major sources of mitochondrial ROS (96), plants appear to have more options for avoiding mitochondrial ROS production than animals do. The additional flexibility that plants possess in the regulation of mtETC may be necessary due to photosynthesis; more electron transport chains require complex cross-talk and more alternatives for regulation. When mtETC is under pressure during stress conditions, plants can relieve the pressure by regulating aforementioned safety valves, type II NAD(P)H dehydrogenases and AOXs. According to literature and the results presented in Figures 2 –5, the expression of Arabidopsis AOX1a (AT3G22370) is induced in response to several stresses, such as drought, heat, cold, salt, pathogen infection, and O3 (23, 128, 139). In addition, tobacco AOX1a has been shown to be induced by O3 (35). It has been suggested that AOX could help oxidize the excess reducing equivalents produced in chloroplasts during high light stress (152).


Experimental production
Similar to the chloroplast, mitochondrial ROS production is experimentally induced by perturbing the function of the electron transport chain. ROS production in mitochondria is accelerated when the mtETC is in a reduced state. The reduced state can be achieved by either inhibiting the flow of electrons downstream of complexes I and III or increasing the input of electrons to mtETC. The most commonly used inhibitors of mtETC include rotenone, which inhibits complex I, and a complex III inhibitor antimycin A. Both rotenone and antimycin A enable the ROS production at the complex they inhibit (23, 81). Interestingly, antimycin A also inhibits the cyclic electron transport around PSI in Arabidopsis, possibly disturbing chloroplast redox homeostasis (60, 130). Potassium cyanide (KCN) can be used to inhibit complex IV and the O2 •− production at complex III. Salicylhydroxamic acid (SHAM) can be used to inhibit AOX. Oligomycin inhibits mitochondrial ATP synthase (complex V), increasing the proton gradient and ROS production rates. In addition, oligomycin can affect chloroplastic ATP synthase, but the effect is significantly weaker compared with mitochondria (23, 53).
MV induces O2 •− production at complex I (24), but isolated plant mitochondria appear to be more tolerant to MV than animal mitochondria (108). Under light, the effects of MV on mitochondria are probably smaller than its effects on chloroplasts. However, the significance of MV action outside the chloroplast warrants further research.
The expression of AOX1a increases in response to stress and is a proposed key regulator of plant stress responses (23, 139). Thus, the manipulation of the expression levels of AOX1a could shed light on mitochondrial ROS signaling and plant stress responses. A microarray study on Arabidopsis aox1a knockdown lines revealed an influence on genes related to chloroplasts, highlighting the extensive cross-talk between cellular compartments (137). The absence of AOX1A leads to sensitivity to light stress combined with drought stress (48). In addition, AOX1a appears to be necessary in cold acclimation (38).
ROS in Other Compartments
Although ROS production and accumulation in plants has been mostly studied in relation to chloroplasts, mitochondria, peroxisomes, and apoplast, several different lines of evidence suggest that ROS could also have important functions in other parts of the cell. Fluorescently tagged RESPIRATORY BURST OXIDASE HOMOLOG F (RBOHF) is found not only at the plasma membrane but also at internal membranes, potentially suggesting a role for RBOHF in symplastic ROS production (34). The elicitor cryptogein triggers ROS production first in the nuclear region and only later in other subcellular compartments in tobacco suspension cells. Isolated tobacco nuclei respond to the application of Ca2+ with an ROS burst, implying a potential for active ROS production in the nucleus (6). ROS-containing vesicles in the cytoplasm of salt-stressed Arabidopsis root cells are constantly fusing with the tonoplast, thereby affecting the function of pumps and channels in the tonoplast membrane. Apparently these ROS have been produced in the endosomes (80). A confounding problem is the lack of a high-resolution detection system for the subcellular distribution of ROS production or accumulation. To overcome this problem, several ROS-sensitive dyes have been developed, although their true specificity remains to be fully explored (148). A variant of yellow fluorescent protein (YFP) that detects H2O2, Hyper, has been used to follow changes in the cytosolic H2O2 concentration (18, 25).
The redox state of the cellular compartment affects ROS signaling. Redox signaling has been reviewed in depth elsewhere (39, 40, 41), so here it will be discussed only briefly. Several redox-regulated processes take place in the cytosol, where they can be visualized using reduction-oxidation sensitive green fluorescent protein 2 (roGFP2), which is considered to report the redox status of glutathione (62, 89). One of the best studied redox-regulated proteins is NONEXPRESSOR OF PATHOGENESIS-RELATED 1 (NPR1), which is kept inactive in the cytosol as an oxidized multimer under normal growth conditions. After biotic/abiotic stress, it is reduced by a thioredoxin, resulting in the release of monomers, which subsequently enter the nucleus and act as a co-regulator of gene expression (133). However, the regulation of NPR1 is very complex, as NPR1 serves as a receptor for the plant hormone salicylic acid (SA) (151), and is additionally regulated through S-nitrosylation, which prevents oxidation and multimerization. It is unclear how these modifications affect nuclear translocation of NPR1. Future research will have to clarify how redox regulation, S-nitrosylation, and SA binding function together to regulate NPR1 and subsequent gene expression.
ROS Production in Plants Is Complex
ROS production in plants is a highly dynamic and interactive process. Many stresses induce ROS production in specific subcellular compartments, which, in turn, results in ROS accumulation in other compartments. Disturbance of ROS production or detoxification in one subcellular compartment has an impact on the ROS balance in other compartments. The removal of cytosolic ascorbate peroxidase 1 (APX1) in the apx1 mutant led to decreased H2O2 scavenging in the chloroplast (29). Simultaneous removal of both APX1 and TAPX, or APX1 and CAT2 led to new downstream ROS responses that could not be predicted from the single mutants (93, 143). Even intraorganellar ROS production is interacting in various ways; increased H2O2 production in the chloroplast antagonizes 1O2-mediated signaling (74). These connections between different ROS locations in the plant cell make it very difficult to study the isolated role of a single organelle or subcellular compartment. Further complexity is added by the interactions between ROS and hormone signaling, in particular, ethylene, SA, and jasmonic acid (JA) (103). In addition, other plant hormones exhibit reciprocal effects onto ROS production and signaling. For example, mitochondrial ROS production is increased in an ABA-sensitive mutant aba overly sensitive 6 (abo6) (52). Apoplastic ROS decrease auxin signaling, resulting in so-called stress-induced morphogenic responses (9).
“Transcriptional” Response to ROS
Background
Plant stress responses involve large-scale transcriptional reprogramming, where transcript levels of thousands of genes are altered. The transcript level of a gene is the product of two competing processes: the synthesis and degradation of messenger RNA (mRNA). The methods discussed next cannot distinguish between those two processes, but rather measure the overall outcome. Thus, the observed “transcriptional responses” include changes in the rate of mRNA degradation (19, 21).
ROS are produced in response to many stresses, and ROS treatments exhibit similar changes in transcript profiles compared to biotic and abiotic stress treatments (59). The model plant Arabidopsis thaliana is used for most of the analyses given next, as the amount of microarray data for this species far exceeds that for any other plant species (55).
With the adaptation of molecular biology in plant biology during the 1980s, the study of gene expression quickly became popular. The methods used to find differentially regulated genes included subtractive screening, subtractive hybridization, and differential display, all of which tend to have a low throughput; that is, only a few genes were found and, furthermore, they tended to find genes with very large changes in gene expression (13). The newly identified genes were often named after the screen from which they were identified, a legacy that is still apparent these days in the names of many genes for example in the TAIR database (e.g., RESPONSIVE TO ABA 18—RAB18–AT5G66400; EARLY RESPONSIVE TO DEHYDRATION 15—ERD15–AT2G41430). The same experimental techniques were also applied to the study of ROS, and numerous ROS-regulated genes were identified (33, 84, 122). One limitation to these early experiments (in addition to the limited number of genes identified) is that the specificity (i.e., if other ROS or stresses were also regulating the same genes) was seldom tested.
Later, DNA microarray analysis and other high-throughput methods, including complementary deoxyribonucleic acid amplified fragment length polymorphism (cDNA AFLP) (142) replaced earlier methods, and the extent of transcriptional reprogramming and the overlap between different stress responses became detectable on a global scale (82, 83). Unfortunately, some of the early classifications of a stress-responsive gene as a marker gene for a specific stress can be misleading these days when array data from multiple stresses and ROS treatments are revealing the true complexity of transcriptome changes. Briefly, a gene initially classified as a marker for a given treatment is in many cases also responding to other treatments.
The pioneering work of Gadjev et al. (44) provided a meta-analysis of microarray data on transcriptional changes in response to different ROS. Nine different ROS-inducing conditions were included in the analysis, five of which were time series. Three of the experiments were chemical treatments, five experiments took advantage of genetically modified plant lines, and one was a combination of both. Age of the experimental plants varied from 2 to 6 weeks. Three of the experiments involved a change in growth conditions to induce ROS production. Despite the heterogeneity of the experimental setups, or perhaps partly because of it, several transcriptional footprints specific for different ROS were found. The framework provided by Gadjev et al. (44) has been and still is an invaluable tool, but the increasing amount of transcriptomic data in public databases calls for a re-evaluation of the specificity regarding transcriptional responses to ROS.
The dominant techniques for analyzing transcriptomic changes are quantitative real-time reverse transcription polymerase chain reaction (qPCR), when studying a few genes, and microarray technology, when studying global transcriptome changes. With the rise of next-generation sequencing technologies, RNA sequencing (RNAseq)—where mRNA is converted into a cDNA library followed by the sequencing of millions of reads—is likely to replace microarray technology due to its greater sensitivity and whole genome coverage (140). However, in silico methods offer an alternative by using large public data sets to dissect transcriptomic responses. Downloading, analyzing, and visualizing the publicly available raw data requires considerable experience in bioinformatics, whereas online tools for expression analysis offer a quick low-threshold option for a biologist without specialized bioinformatics training. Online tools that analyze transcript levels of Arabidopsis genes are summarized in Table 1. The commercial Genevestigator advanced license offers large enough data sets that are combined with powerful visualization and analysis tools to give an overview of the behavior of transcript levels in response to various stresses and ROS. A similar analysis could be done by downloading the raw data directly from Gene Expression Omnibus (
ROS, reactive oxygen species.
Analysis
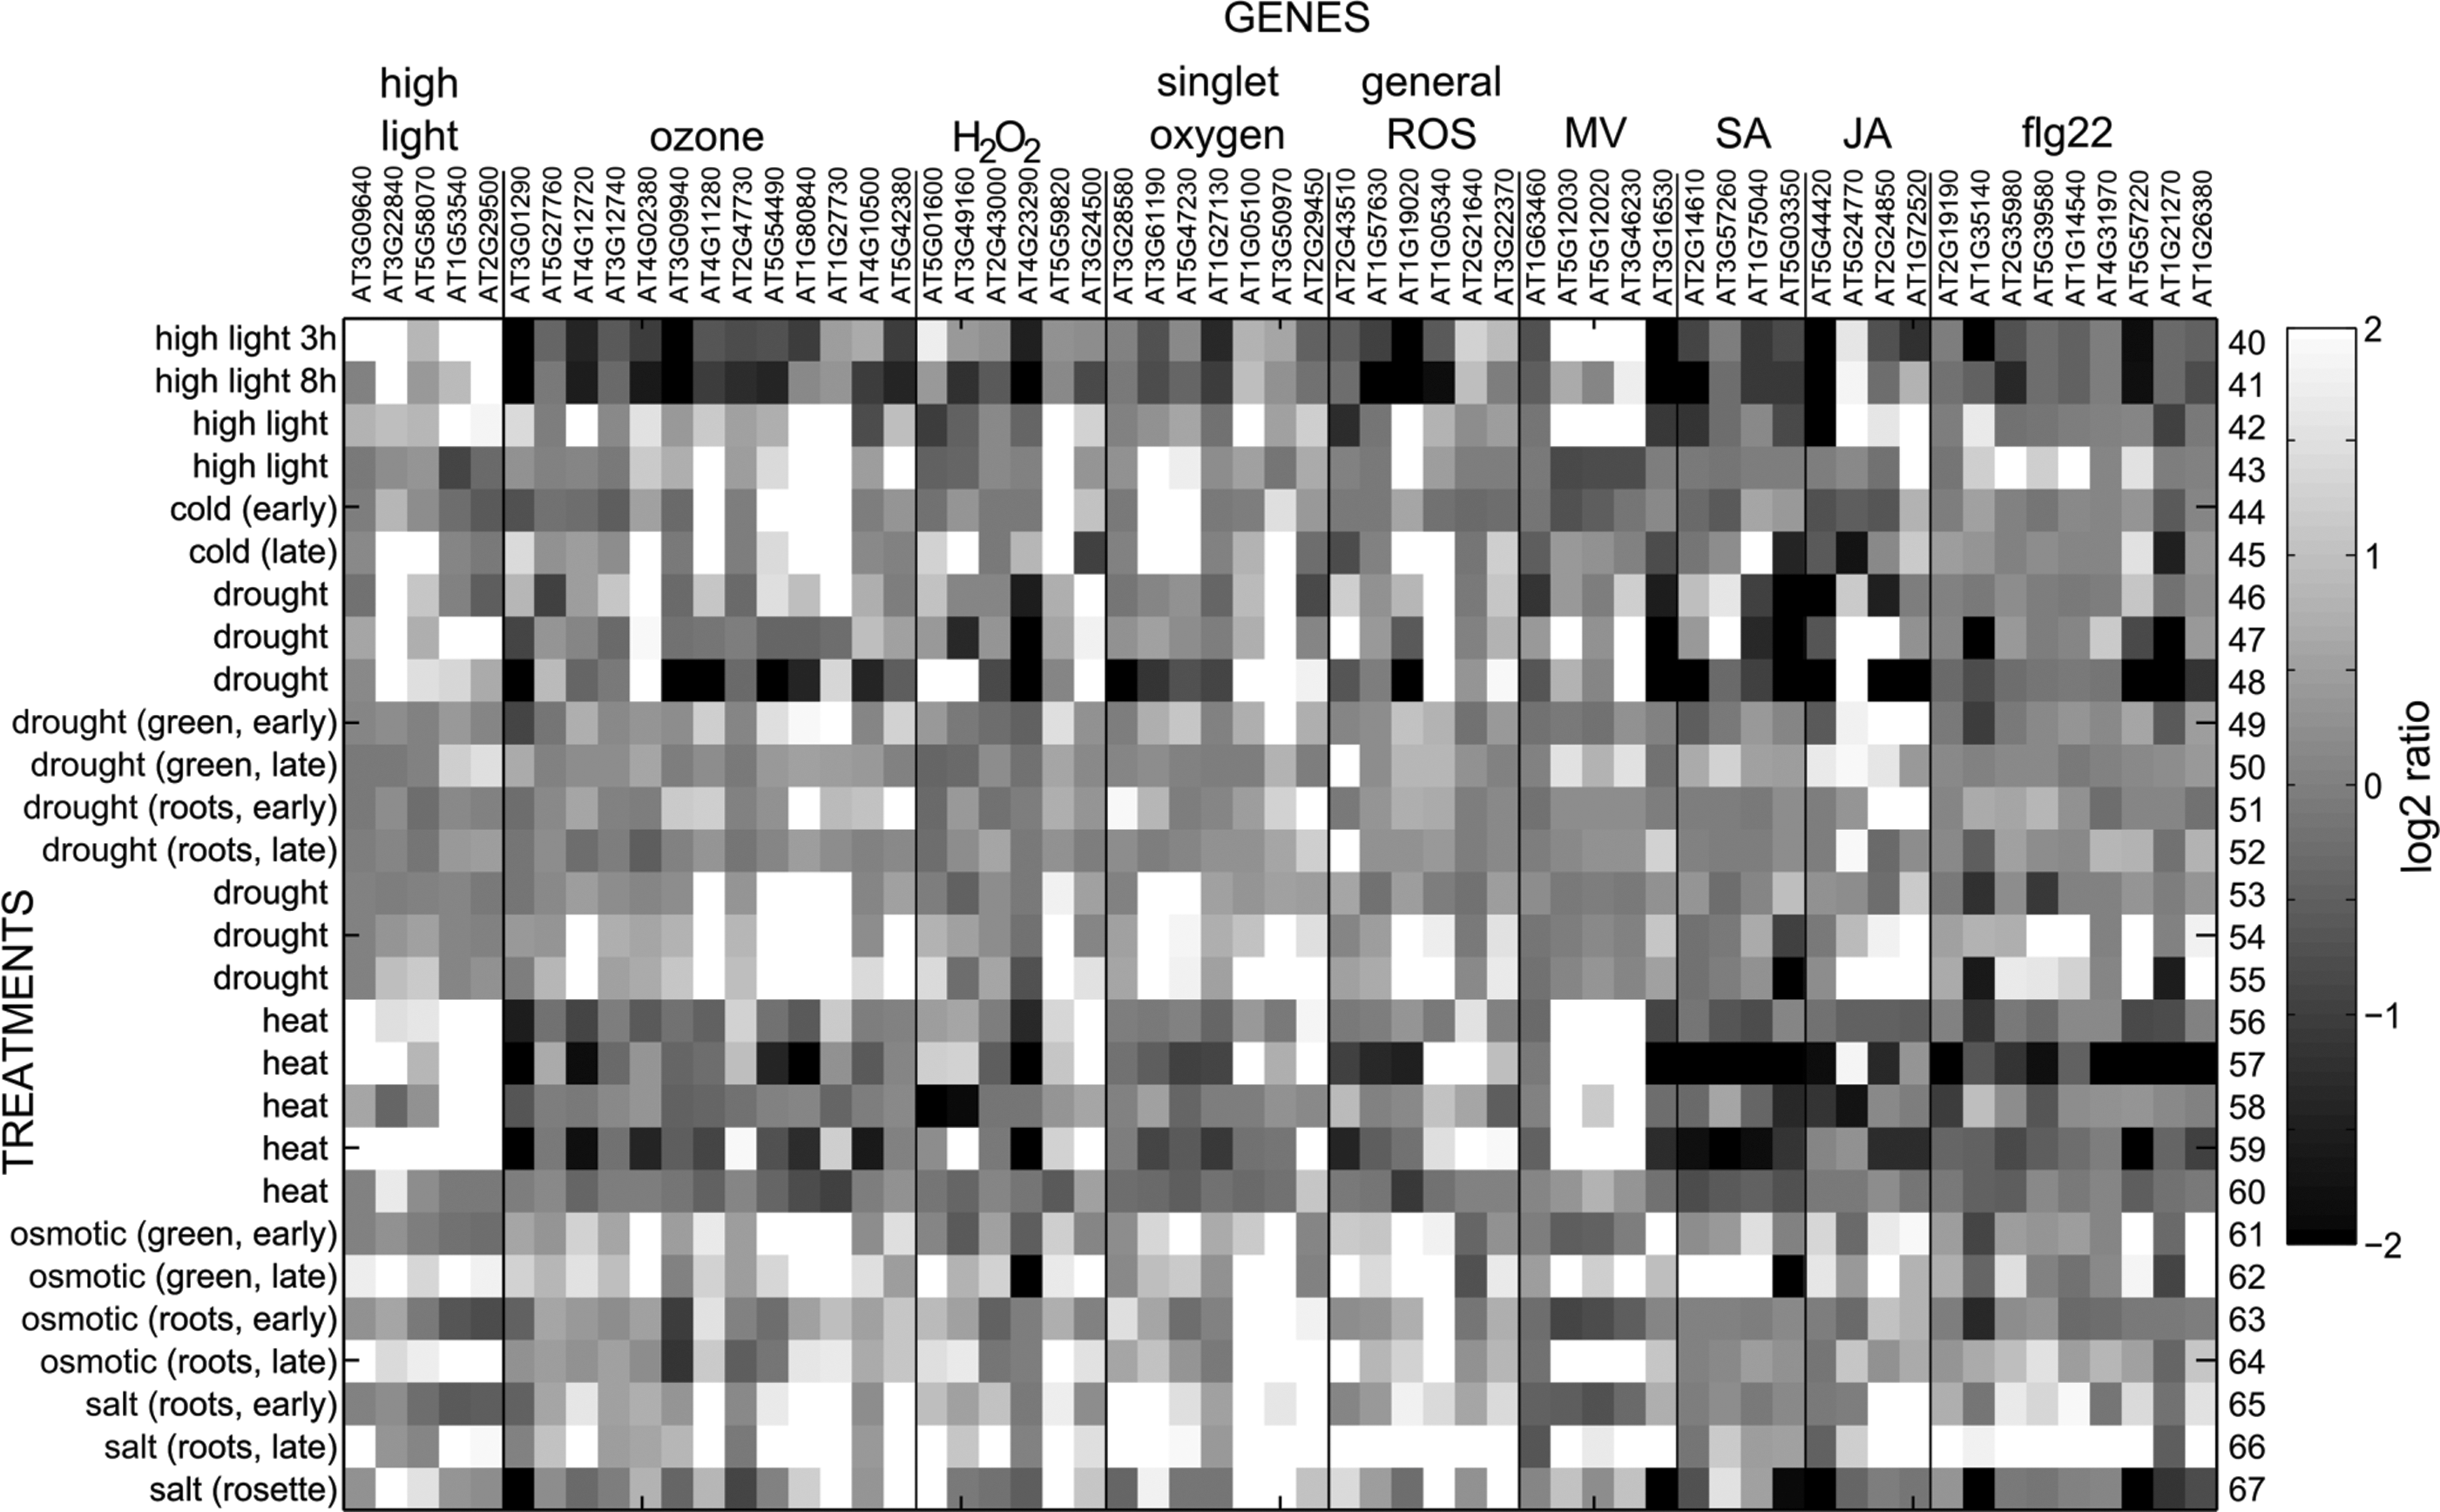
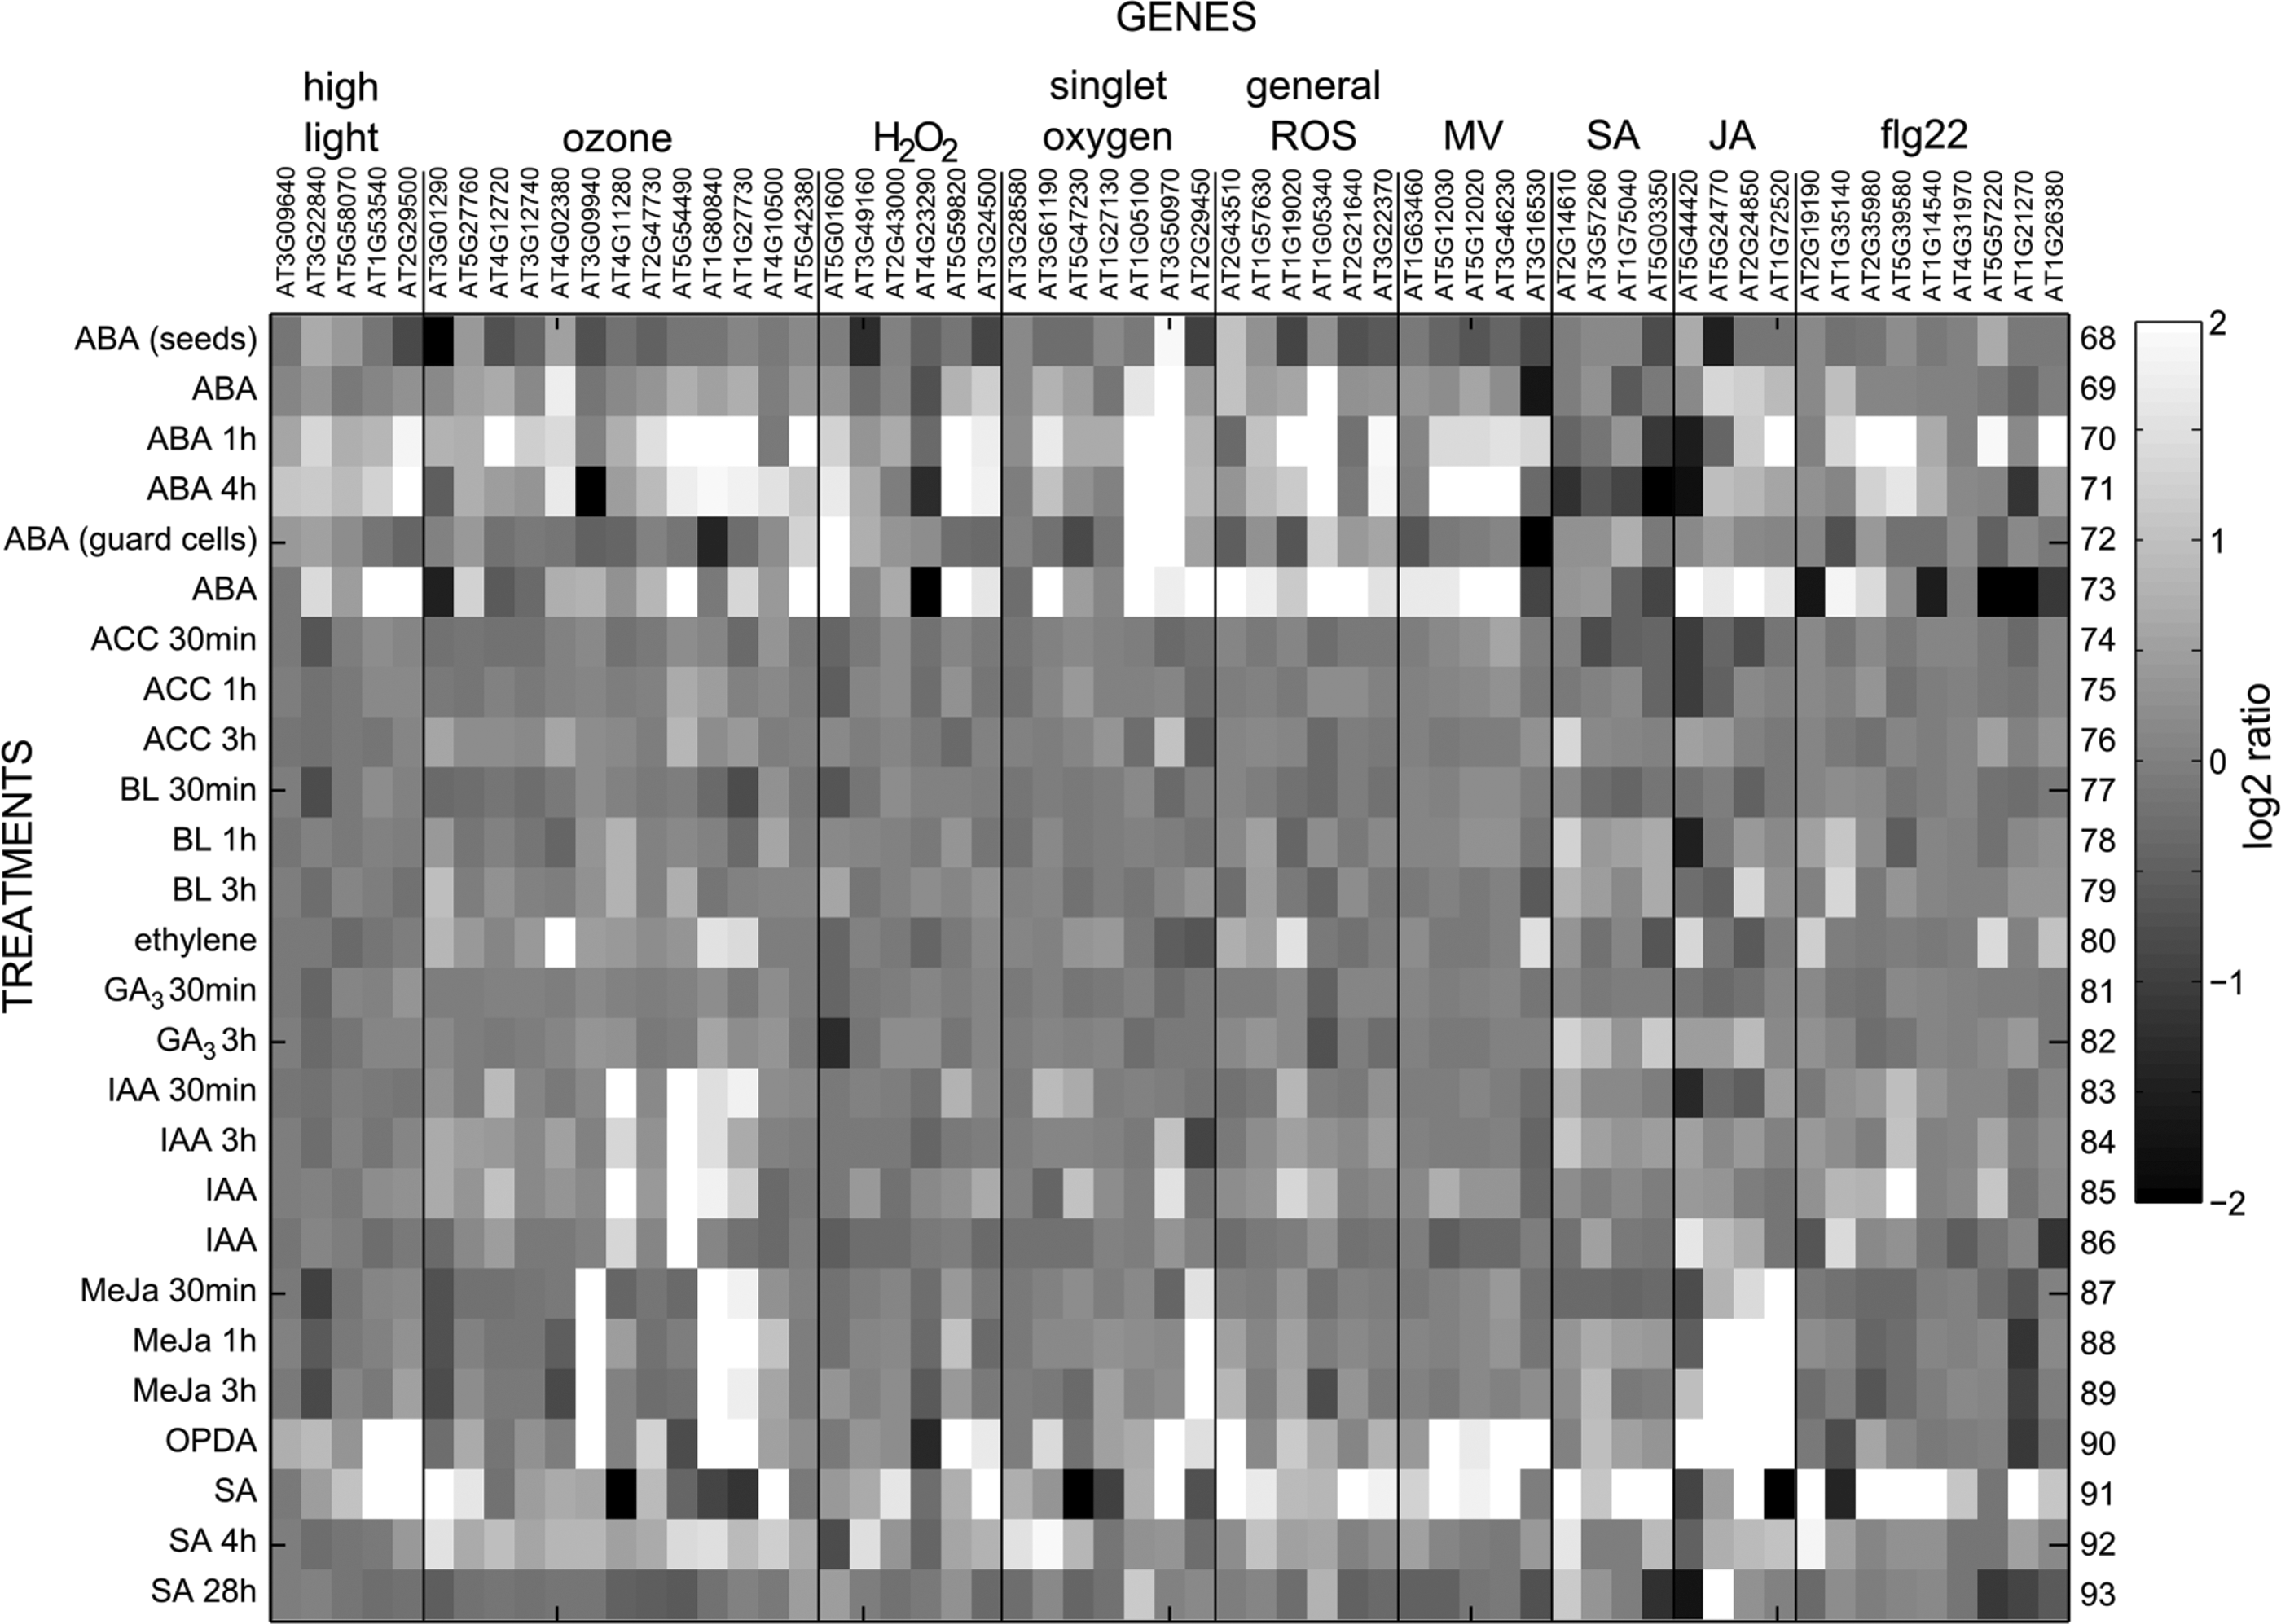
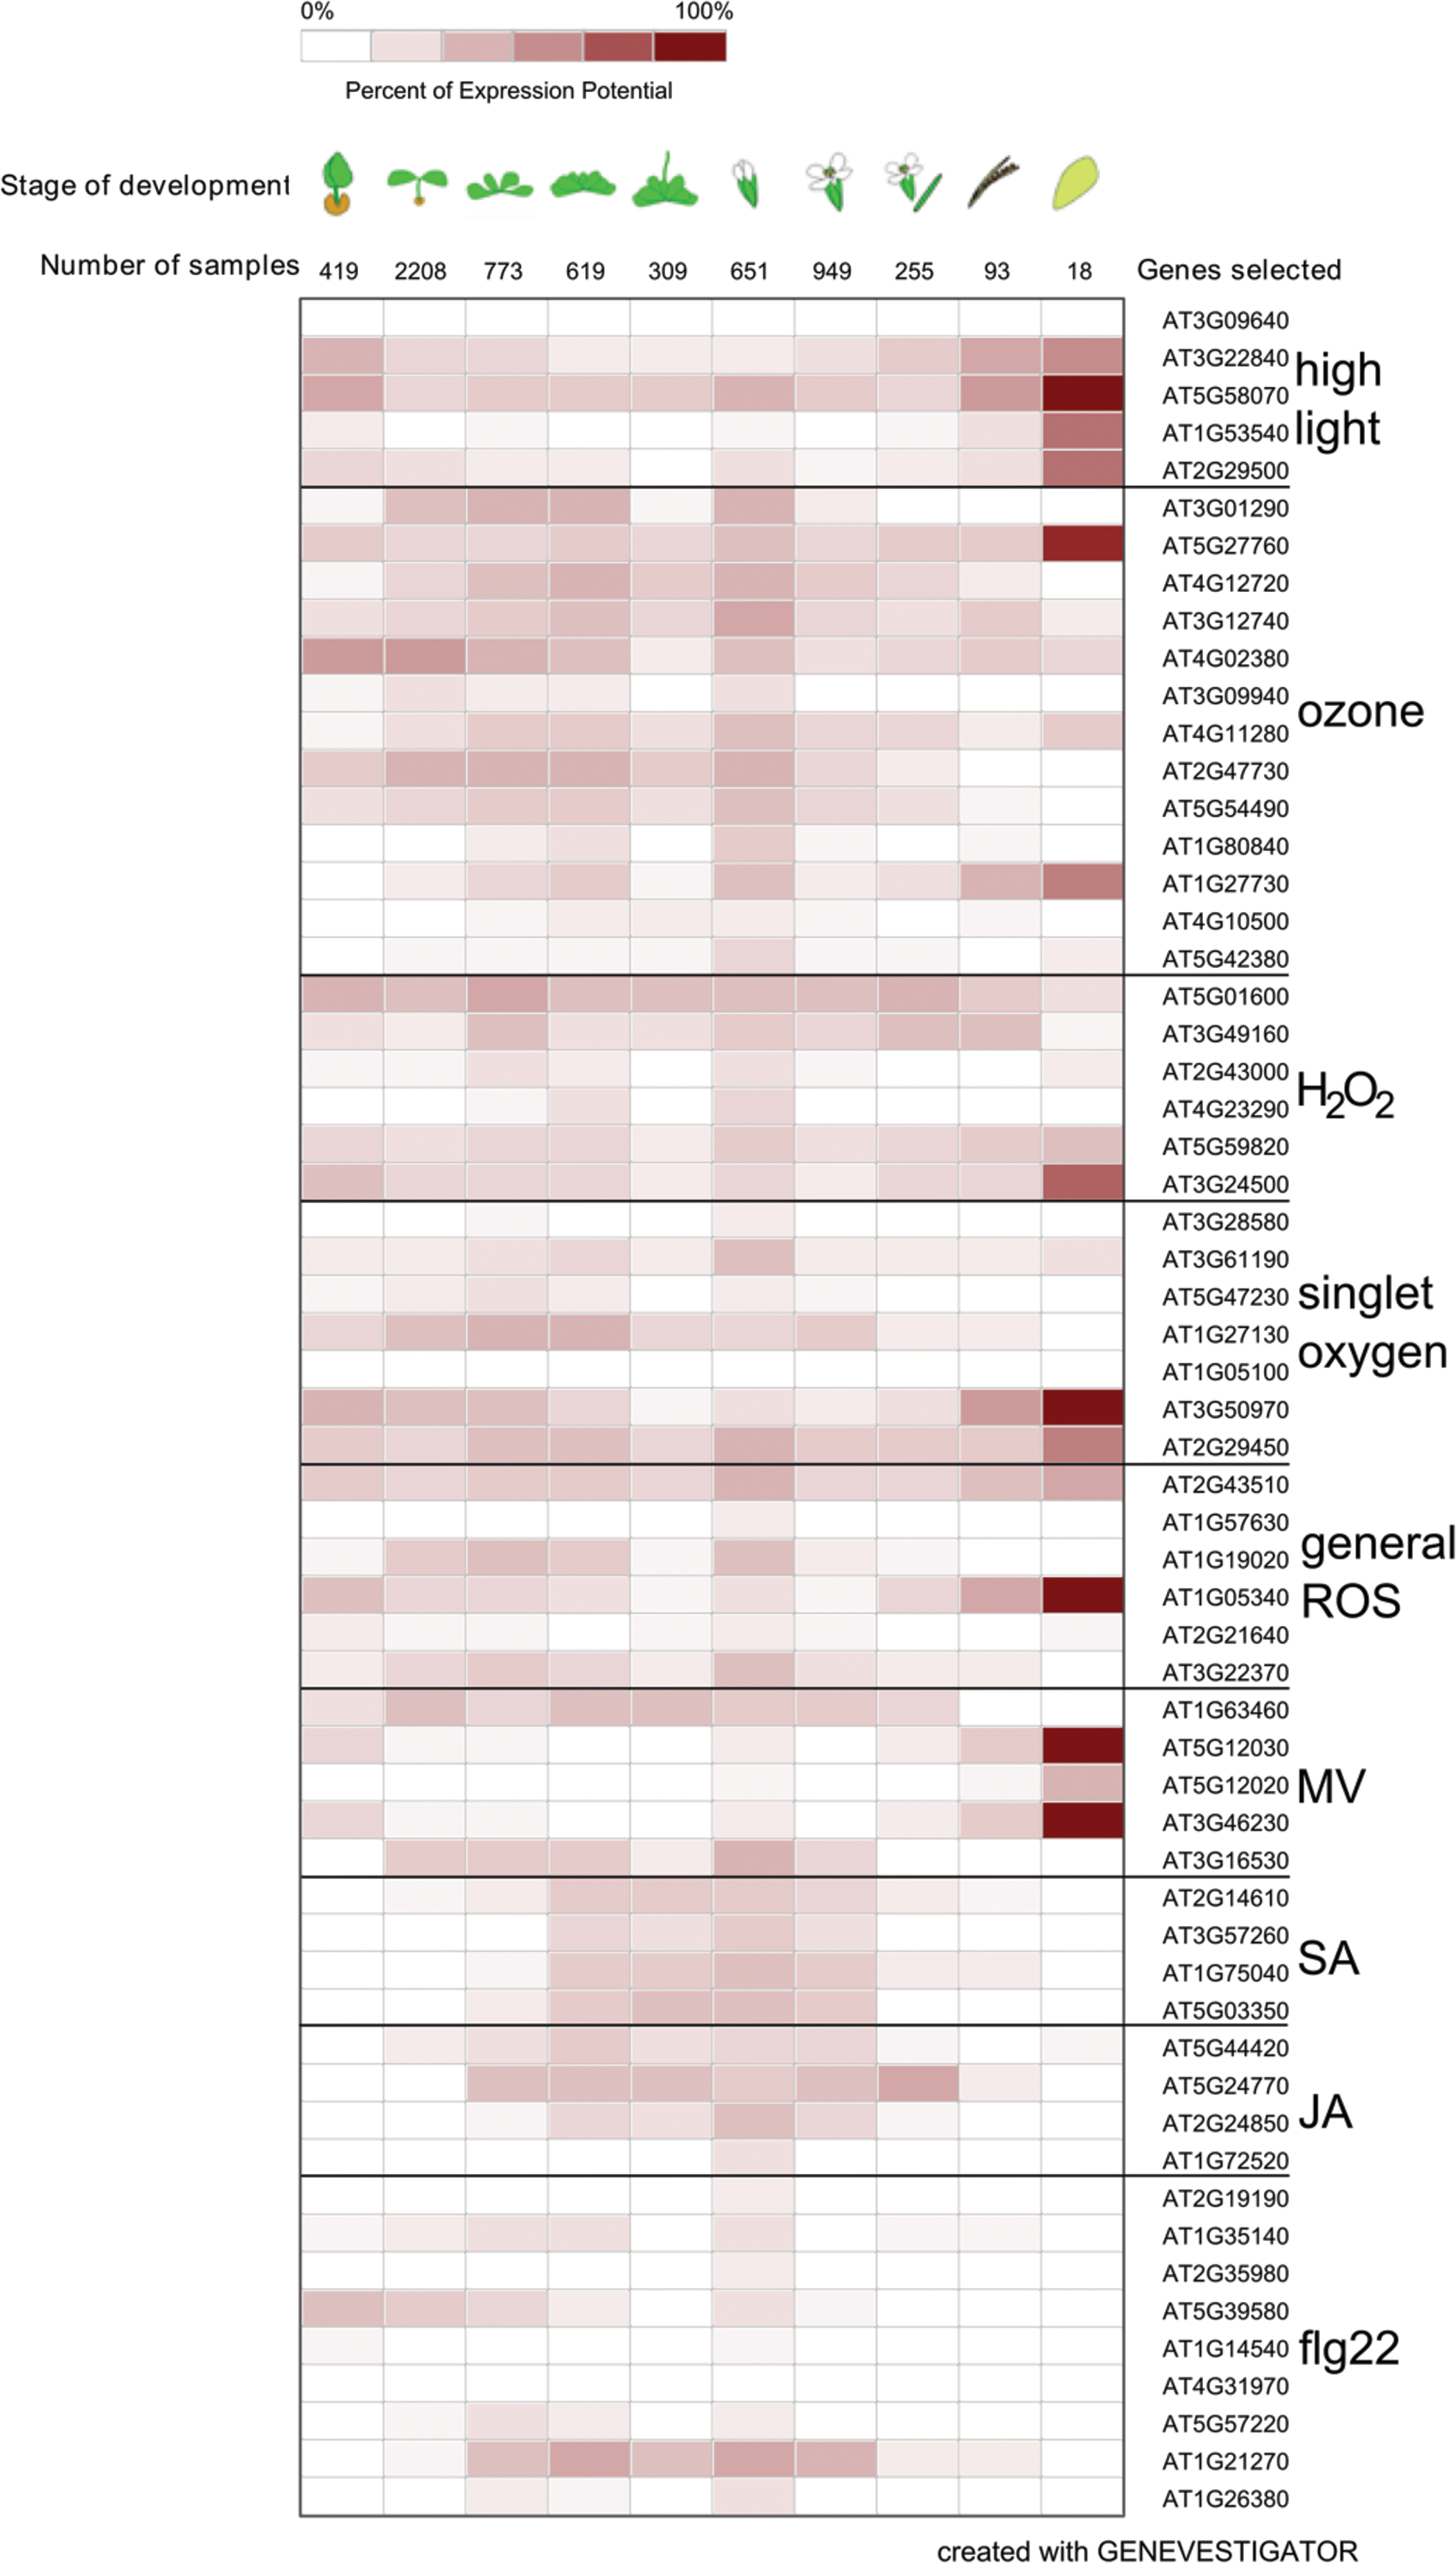
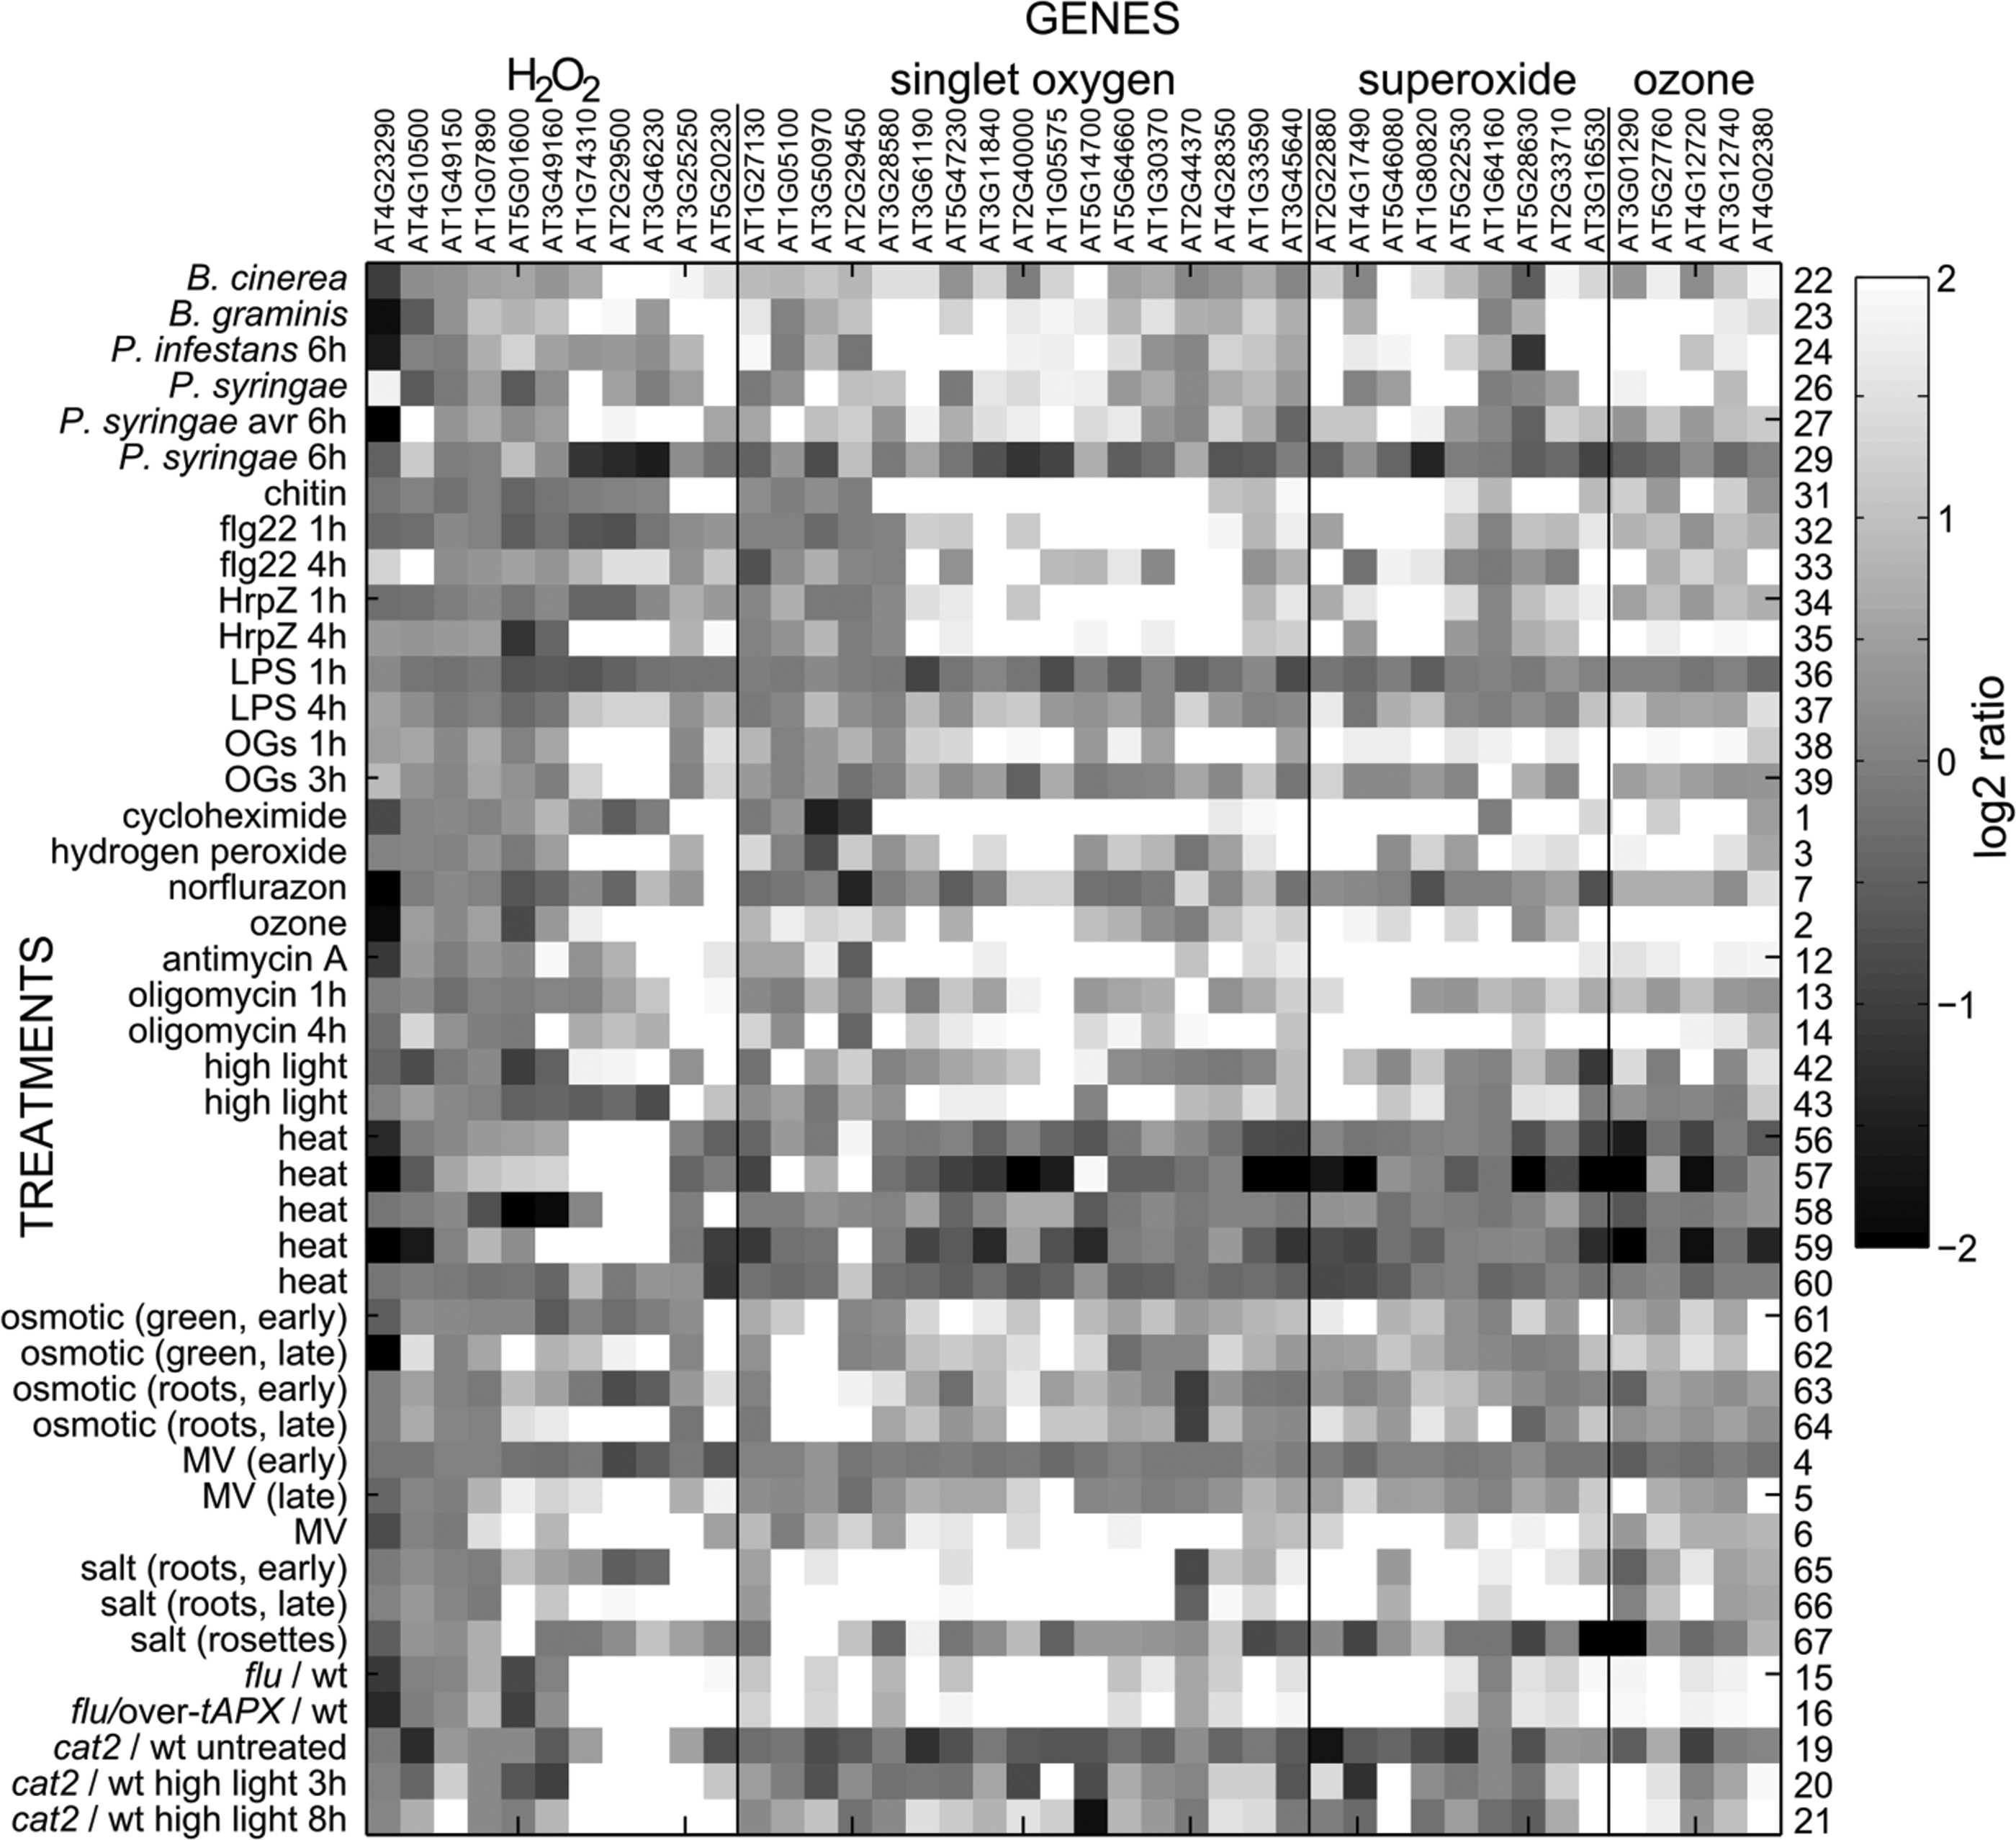
In order to get an overview of the behavior of ROS-responsive transcripts, a selected set of ROS-, hormone-, and elicitor-responsive genes were analyzed with Genevestigator. For the sake of brevity, this gene set is called “defense” genes in the next few sections. The transcriptional responses of these genes to different perturbations are presented in Table 2 and Figures 2 –6. These genes were selected from recent publications studying ROS in various biological processes and in addition include classical marker genes, for example the SA-responsive PATHOGENESIS RELATED 1 (PR1) (3, 9, 11, 14, 17, 23, 32, 43 –45, 87, 112, 125, 127, 150). The transcript levels of selected genes have not been suggested to be specific for the particular stimulus, simply responsive to it. Figures are presented in gray scale reconstructed from the data exported from Genevestigator.
AGI, Arabidopsis genome initiative; flg22, flagellin-derived 22-amino-acid peptide; H2O2, hydrogen peroxide; JA, jasmonic acid; MV, methyl viologen; 1O2, singlet oxygen; SA, salicylic acid.
Several microarray experiments have been designed to study the effects of ROS production in specific cellular compartments (Fig. 2). General ROS marker genes behaved as expected; their transcript levels responded to apoplastic ROS (O3), mitochondrial ROS (antimycin A, oligomycin), 1O2 (flu), and peroxisomal H2O2 (cat2). Treatment with norflurazon quite specifically increased the transcript levels of genes responsive to high light and MV. In addition to general ROS markers, genes previously reported as responsive to O3 and MV responded to a large variety of treatments in our analysis. The striking similarity of the regulation of the “defense” genes in response to O3, antimycin A, oligomycin, 1O2 (flu), H2O2, and cycloheximide treatments could imply that all these treatments trigger a large transcriptional reprogramming in response to ROS.
The transcript levels of the “defense” genes responded to several pathogens and elicitors (Fig. 3). Most of the selected O3-responsive and general ROS-responsive genes responded to a wide variety of pathogens and elicitors. All these treatments trigger an apoplastic oxidative burst, which could lead to the activation of a common signaling pathway. However, more complex signaling networks involving organellar crosstalk and chloroplastic ROS production are also plausible (124, 126). Accordingly, transcripts responsive to 1O2 and MV also respond to pathogens and elicitors. Not surprisingly, flg22-responsive transcripts also respond to many biotic stress treatments. A detail worth highlighting is the variance of the response depending on the time point and pathogen strain or elicitor. An avirulent strain of Pseudomonas syringae DC3000 pv. tomato appeared to trigger transcriptional reprogramming faster than the virulent strain. Similarly, different elicitors exhibited different temporal profiles.
High light and heat stress share some common target genes, including HSFA2, a heat shock transcription factor (99). Accordingly, these stresses activated similar sets of high light- and MV-responsive genes (Fig. 4). Drought, osmotic, and cold treatments had different profiles and induced the expression of a subset of O3- and 1O2-responsive genes. Salt treatment of roots at late time points appeared to be a severe stressor and increased the expression of almost all the genes selected for the analysis.
As expected, SA, methyl jasmonate (MeJA), and the JA precursor 12-oxo-phytodienoic acid (OPDA) induced expression of their corresponding marker genes (Fig. 5). In contrast, most other hormone treatments did not alter the transcript levels of the “defense” genes. A few transcripts showed increased expression by SA and ABA. Both SA and ABA have been shown to induce an oxidative burst in guard cells, which opens the possibility for a similar mechanism also in other cell types (66, 72). Furthermore, ABA treatment increased mitochondrial ROS levels, and ABA-insensitive mutants had lower levels of ROS in Arabidopsis root mitochondria (52). In addition, ABA signaling, extracellular H2O2 accumulation, and high light responses are interconnected (45). Leaf senescence is a complex process, and it includes large changes in the transcriptome (12), with ROS being among its many regulators (76, 129). Several of the “defense” marker genes displayed their highest expression in senescent leaves (Fig. 6).
Are There ROS-Specific Marker Genes?
As apparent from Figures 2 to 6, the regulation of commonly used ROS and defense marker genes is complex. If an O3-responsive gene is selected as a marker gene, it will with a high probability also respond to numerous other treatments in addition to O3. This is neither surprising, nor is it actually a problem, unless a statement about specificity is desired. Within the last 2 years there have been several studies using marker gene sets suggested to be specific for a particular ROS, that is, the transcripts should have increased expression exclusively to one specific ROS (8, 49, 87, 112, 113, 125, 127, 150). Some of these gene sets have consisted of tens of ROS-specific genes (8, 49, 87), including a qPCR platform for almost 100 genes, each specific for a single ROS (8, 87). Although the use of this platform for probing transcript levels of generally ROS-responsive genes can be useful, the specificity of the genes for a single ROS would require further evidence.
A subset of these genes suggested to be ROS-specific was compared against a representative set of experiments comprising biotic, abiotic, and ROS treatments (Table 3 and Fig. 7). This gene set is referred to as “specific” from here on. Many of the “specific” genes are regulated in response to a variety of treatments. For example, 1O2-specific genes responded to salt treatment in roots, O3-specific genes also responded to H2O2, and almost all “specific” genes showed increased expression in response to 1O2 production in flu.
O2 •−, superoxide.
Recently, the difficulties in interpreting the data obtained using flu were discussed in a review by Kim and Apel (68). The authors suggest that the similarities in the transcript signatures between 1O2 production in flu and severe light stress in wt plants are not a consequence of 1O2-mediated signaling but rather the loss of cellular integrity. It is suggested that an early time point of 15 min would be informative when studying transcript responses to 1O2 in flu, as at later time points, loss of chloroplast and vacuole integrity elicits broader damage responses, apparently similar to severe light stress. Unfortunately, only a 2-h time point for flu experiments is available in Genevestigator, and the time points used by Gadjev et al. (44) were between 30 min and 2 h. Therefore, it is advisable to treat conclusions based on the transcript data from flu with caution, especially when discussing 1O2-specific responses. Similar pitfalls, yet to be explored, are likely to exist for other experimental setups for studying ROS signaling, which adds further complications to the analysis of ROS-specific marker genes. Is it a problem that marker genes, which are considered specific, actually respond to a variety of treatments? To answer that question, the term “specific” needs a precise definition: A specific marker gene encodes a transcript that responds exclusively to a single stimulus. However, for many stimuli, there might be no such transcript. It would be hard to imagine a gene that would respond for example only to an O3 pulse but nothing else. Since the O3 pulse mimics and activates an apoplastic oxidative burst, the overlap between O3 and other treatments that induce apoplastic oxidative burst is extensive. Indeed, most O3-responsive genes were also responsive to pathogen infection, microbial elicitors such as flg22, and damage-associated molecular patterns such as oligogalacturonides (OGs) (Fig. 3).
Due to the reactive nature of ROS and interconnectivity between cellular compartments, the precise ROS production in a single place is not a straightforward task. Furthermore, unintended side effects may come from the use of inhibitors that affect multiple targets. In addition, even noninvasive methods such as induction of photorespiration in cat2 require changes in growth conditions. In their natural habitat, plants are unlikely to experience a single stress; instead, various combinations of biotic and abiotic stresses are more likely. The combination of two or more stresses will affect the transcriptome in ways that are not predictable from the single stresses (114, 117). Similar emergent effects are likely true with regard to ROS signaling.
If a plant, from its own perspective, does not need a specific marker gene, why do scientists keep looking for them? To understand the role of ROS in signaling, there is a need for assays that reflect the starting point of the signaling pathway. Despite the recent advances in the development of ROS-specific fluorescent dyes and biosensors, measuring a single ROS in a single cellular compartment is anything but straightforward (20). For example, diaminofluorescein dyes that are commonly used for the purpose of specifically detecting nitric oxide also cross-react with H2O2 (119). In contrast, measuring changes in transcript levels is straightforward. Thus, it is easy to understand if, for example, an investigator studies the role of the chloroplast in stress responses, it would be of great advantage to have marker genes that reflect 1O2, O2
•−, and H2O2 production in the chloroplast. Is it realistic to find these specific genes? When experiments in Genevestigator are analyzed individually (i.e., without taking into account that a similar experiment might have been performed in a different lab), it is often possible to find genes that are uniquely regulated in a given experiment. However, when two or more similar experiments are analyzed, the number of unique genes is low and in the case of comparing two independent H2O2 experiments, the resulting list of H2O2-regulated genes shows that they are also regulated in many other ROS experiments. What does this mean for ROS-specific marker genes? There are several possible answers: (i) Experimental difficulties in inducing the accumulation of specific ROS in a specific cellular compartment leads to an uninformed interpretation of gene expression data. (ii) Even if a single ROS is specifically accumulated, the selection of a time point is crucial. At later time points, the ROS signal might have spread away from the site of origin or elicited secondary responses. (iii) Experimental difficulties in determining exactly which ROS is formed after an experimental treatment may contribute to the wrong classification of ROS-responsive transcripts. (iv) The amount of ROS-specific transcripts in the literature could be largely overestimated, and most ROS-responsive transcripts are, instead, induced by many different ROS and other treatments. This overestimation could be a result of comparing too few experiments or a limited set of time points against each other.
Pitfalls of the Data Analysis
Data analysis of large gene expression datasets remains a challenge. Some standardization of microarray data analysis has been obtained, while the best practices for analysis of RNAseq data are still to be achieved (140). It is beyond the scope of this review to outline all steps in bioinformatics and statistical analyses; however, a few pitfalls that may have contributed to incorrect interpretations of ROS-dependent gene expression data will be mentioned. Microarray data are typically first analyzed for genes with a statistically significant change (including gene-wise statistical testing and p-value correction for multiple statistical tests), followed by the application of a fold change cut-off to reduce the number of genes, where a two-fold cut-off is popular. Both of these steps can introduce errors in the final list of differentially regulated genes. The statistical testing framework was not originally developed for experiments in which a high number of statistical tests are carried out, and methods for correcting this assume independency of the tests, which is heavily violated in gene expression data. In microarray data, which typically consist of numerous measurements (gene expression levels) but only a few repeats (two or three repeats is very common for Arabidopsis Affymetrix data in the public domain), this may lead to statistical significance, which is not necessarily reflected by the biology of the underlying experiment. For example, gene A has increased expression 2-, 2.5-, and 3-fold in three repeats, and gene B has increased expression 3-, 5-, and 10-fold. Although gene B is more responsive to the treatment (but has a higher variation in expression), it is gene A that will get higher statistical significance (due to low variation), even with commonly applied log transformation of the fold changes. In a list with hundreds to thousands of genes, this might lead to some type B genes being removed from the list due to low statistical significance. Similarly, the arbitrary selection of a two-fold cut-off is by definition removing genes with 1.99-fold increased expression. It is hard to imagine that this would be less biologically relevant than a gene with 2.01-fold increased expression. There are methods that compensate for these artifacts, for example, by taking the biologically significant fold change (86), or the correlations among genes (155), into account, but those are not commonly used currently. As a consequence, gene lists which state that they are specific for a given treatment should be interpreted with some caution, especially if they are subsequently used in Venn diagram analysis to find common and specific genes for different treatments.
Due to the problems listed earlier, pathway analysis has started replacing the traditional gene-by-gene analysis. The methods look for small coordinated changes in a set of genes known to share similar functions, and they do not need a fixed fold change cut-off (65).
A Biological Mechanism for a Common Early Response
Despite the different sites of production and the different chemical structures of the different ROS, they appear to regulate a common set of genes (Figs. 2 and 7). Can the behavior of these genes be explained by a unified mechanism? Could this mechanism bear similarity to some of the known mechanisms of plant hormone signaling? The first response after binding of the hormones JA, auxin, and gibberillic acid by their receptors CORONATINE INSENSITIVE 1 (COI1), TRANSPORT INHIBITOR RESPONSE 1 (TIR1), and GA INSENSITIVE DWARF1 (GID1), respectively, is the degradation of short-lived transcriptional repressors: JASMONATE-ZIM-DOMAIN PROTEIN (JAZ) proteins for JA, AUXIN/INDOLE-3-ACETIC ACID (Aux/IAA) proteins for auxin, and DELLA proteins for GA (121). This highlights the importance of transcriptional repression in hormone signaling.
Cycloheximide is an inhibitor of protein translation. Treatment of Arabidopsis with this chemical results in a remarkably similar gene expression profile as induced by various ROS treatments (Fig. 2). One explanation for the similar expression profiles could be that treatment with cycloheximide itself results in elevated ROS production, for example via altered steady-state levels of ROS scavenger proteins such as catalase. Another possibility is that common early ROS-responsive genes could be under the control of a hypothetical, short-lived repressor protein. When this protein is removed (either by blocking protein synthesis in cycloheximide-treated plants or by ROS-mediated/regulated/induced protein degradation), repression of the ROS genes is relieved, resulting in reprogramming of gene expression. Since this hypothetical repressor has not been identified in genetic screens for altered biotic/abiotic stress responses, it is likely to belong to a gene family that functions—at least partially—in a redundant fashion. Similarly, the JAZ, Aux/IAA, and DELLA proteins are all a part of large gene families. Degradation of a short-lived repressor protein would provide the plant with a fast mechanism to increase the expression of defense genes in a well-coordinated manner. If this is to be a relevant biological response, another mechanism needs to be able to re-establish repression. Analysis of an O3-induced gene expression study with multiple time points across a 24-h time course revealed a cluster of genes that displayed the expected behavior: Early increased expression peaked at 2 h and was followed by a return to basal expression at 8 h (9). This pattern is consistent with degradation of a short-lived repressor protein followed by a new translation of the repressor.
The JAZ gene family is among the early target genes in JA signaling. Degradation of the JAZ repressor leads to new transcription and translation of the JAZ genes (135). Thus, in an analogous manner, one way to find the hypothetical ROS repressor would be to look at early ROS-induced genes for suitable candidate repressor proteins. Recently, JA signaling was shown to be regulated by double repression, first by JAZ proteins and second, by the repressor JAV1 (56). Therefore, this approach should not be limited to searching for repressor proteins in a single gene family, as functional redundancy might occur between repressors from different protein categories in addition to within-gene family genetic redundancy. A second approach to find the repressor could be to use proteomics comparing early time points with and without cycloheximide or MG132 (an inhibitor of proteasome-mediated protein degradation) (146). Possible candidates for this repressor include proteins encoded by two of the commonly employed marker genes for ROS gene expression experiments ZAT10 and ZAT12 (Table 2). They are transcription factors which contain the ERF-associated amphiphilic repression (EAR) transcriptional repressor domain that could be involved in regulating an appropriate gene expression response by shutting down unwanted gene expression (22). The EAR domain is also present in JAZ and Aux/IAA proteins.
If all early ROS responsive transcripts are under repression of a common negative regulator, how could—at later stages—a more stimulus-specific response be generated in gene expression? This is likely achieved by the combinatorial interaction of several biological mechanisms: activation of transcription factors via proteolytic cleavage, protein phosphorylation, or other post-translational modifications; transport of transcription factors from the cytosol to the nucleus, interaction of two or more transcription factors between each other and with the basal RNA polymerase complex and restrictive or permissive chromatin status (138).
Guideline to Studying ROS-Induced Gene Expression
To facilitate transcriptional analysis for the investigation of ROS, and also for other responses in plants, we propose the following guidelines: (i) Determine the purpose of your gene expression experiment. Should it show the effect of your treatment on apoplast, chloroplasts, mitochondria, or other parts of the cell? Which time points should be used? In gene expression experiments with two or more time points, it is often observed that transcripts are early or late in responding to the treatment. Hence, using only a single time point may lead to a false conclusion in terms of specificity; for example, if only an early time point is chosen, the transcript levels might be altered at a late time point. Arabidopsis provides a rich genetic resource with most mutants available from stock centers. Consider if it would be informative to include mutants that affect particular signaling pathways; for example, ein2, a mutant essential for ethylene signaling, sid2, a mutant for isochorismate synthase required for SA production, and so on, or removing an ROS-scavenging enzyme, for example, apx1 or cat2, and evaluating the resulting change in the ROS gene expression profile. (ii) The extensive amount of ROS gene expression experiments in the literature provides a rich background for marker gene selection. However, as seen in Figures 2
–7, it is important to re-evaluate past marker genes against all public array data to get a more accurate picture of where and when they are expressed. (iii) New ROS marker genes can be identified from array experiments in the public domain. However, some caution is advised in this selection. To find robust marker genes, if possible, find genes that are responsive in two independent but similar ROS experiments (that produce the same ROS species in the same compartment, for example two MV experiments or two O3 experiments). In our experience, this requirement often drastically reduces the number of candidate genes, and is probably a reflection of different growth conditions in different labs as well as differences in how ROS treatments are executed, including the age of plants, concentration of chemicals, light intensity, and so on. If a marker gene that is specific for a single ROS is required, stringent selection and comparison with several ROS treatments is necessary, and is currently only feasible with the Genevestigator advanced license or by trained bioinformatics experts working with raw data from public depositories. Due to the differences between labs indicated earlier, any new marker gene identified requires validation with qPCR, for example. (iv) Global gene expression profiling with microarrays or RNAseq is often done on relatively few samples due to their costs. Hence, the results from these experimental techniques are often confirmed and extended with qPCR. These qPCR experiments should also be designed with properly verified reference genes and other appropriate controls (15, 51). (v) The concept of a “specific” marker gene is very attractive, as a transcript that is truly responsive to a single ROS in a distinct cellular compartment would enable identification of ROS and spatiotemporal dissection of ROS production by qPCR. However, as indicated in Figures 2 and 7, it is rare to find marker genes that are responsive to a single ROS treatment. Thus, caution is advised when using the word “specific,” especially if no comparisons have been made with the public data available for Arabidopsis.
Future Directions
Gene expression analysis is and will likely remain a corner stone of plant molecular biology. However, caution needs to be taken in the analysis process so that correct interpretations of activated or inactivated signaling pathways can be made. New technologies for sequencing provide a better coverage of the transcriptome and combined with improvements in bioinformatics, it may become possible to identify more specific marker genes. In the near future the following steps could improve the study of ROS-induced gene expression changes.
From marker gene to marker signature
The use of a single marker gene is problematic, as many genes are regulated by many ROS and other treatments (Figs. 2 –7). However, further data mining of experiments in the public domain could uncover sets of genes, marker signatures, that together give better predictions of the signaling pathways activated in response to ROS treatment compared with individual genes. A preliminary analysis of heat stress experiments in Genevestigator suggests that at least for this stress it is possible to find such a signature.
RNAseq
The Affymetrix ATH1 chip covers only about half of the Arabidopsis transcriptome. In addition, array analysis is overall not good at finding differentially regulated genes with low expression levels. RNAseq overcomes both problems and should thus be the method of choice in future transcriptome studies.
Inducible, precise ROS production
In order to find ROS-specific marker genes (or signatures), one needs to be able to produce specific ROS in a specific subcellular compartment and to design experiments with high temporal resolution. At least some popular chemicals that are used to generate ROS (e.g., MV) will produce ROS in several subcellular locations, which obscures data analysis. Mutants lacking a crucial ROS scavenger are likely to have adapted to the increased ROS production by the time they are mature and therefore might not show specific gene expression profiles. To circumvent this problem, inducible RNAi silencing or overexpression of the scavenger of interest is more likely to reveal the role of a given ROS. Similarly, a screen for novel chemical compounds might identify more specific inhibitors for ROS production or detoxification elements to increase ROS production in a specific subcellular compartment.
Consortium for ROS-specific marker genes
Given the crucial role of ROS as signaling molecules, it is not surprising that mutants in ROS scavengers have different phenotypes in different labs reflecting variations in growth conditions. This is exemplified by the ascorbic acid biosynthesis mutant vtc1, which is either early or late flowering in different laboratories (14). The development of a robust set of ROS marker signatures would preferably take place in a consortium of collaborating laboratories. Furthermore, this would help avoid technical artifacts in data generated from batch effects (78).
Gene expression analysis is likely to remain a popular experimental technique. With careful planning of the experiments combined with new high-throughput approaches and analysis methods, we believe that measuring changes in gene expression can reach its true potential in understanding the role of ROS in plant development and responses to the environment.
Materials and Methods
Genes selected from publications were analyzed with Genevestigator's Condition Search tool “Perturbations” (55). The data were exported and visualized as grayscale heat map using Matlab (1) and the following script:
Footnotes
Acknowledgments
The authors would like to apologize to all their colleagues whose work they had omitted mentioning due to space constraints. They thank Jarkko Salojärvi, Johanna Leppälä, Adrien Gauthier, Alexey Shapiguzov, Maija Sierla, and Kirk Overmyer for constructive discussions and critical comments on this article. Their research is supported by the Academy of Finland, University of Helsinki, Biocentrum Helsinki, and Viikki Doctoral Program in Molecular Biosciences (VGSB).
Abbreviations Used
References
Supplementary Material
Please find the following supplemental material available below.
For Open Access articles published under a Creative Commons License, all supplemental material carries the same license as the article it is associated with.
For non-Open Access articles published, all supplemental material carries a non-exclusive license, and permission requests for re-use of supplemental material or any part of supplemental material shall be sent directly to the copyright owner as specified in the copyright notice associated with the article.
