




Abstract
Introduction
A
Spatial and temporal variations in shear stress regulate vascular metabolic effects. We hereby elucidate the hemodynamic mechanisms underlying disturbed flow and impaired autophagic flux. We demonstrate that oscillatory shear stress (OSS) significantly increases microtubule-associated protein light chain 3 (LC3)-II/LC-I ratios and p62 expression, whereas pulsatile shear stress (PSS) minimally increases LC3 ratios and downregulates p62. In corollary, the OSS-exposed aortic arch is preferentially prominent for p62 accumulation in association with markers for JNK activation and mitochondrial DNA damage, as opposed to the PSS-exposed descending aorta. Thus, disturbed flow-associated OSS induces autophagy, but impairs autophagic flux to perturb mitochondrial homeostasis.
Autophagy is a highly regulated process associated with the activation of autophagy-related (ATG) genes (61). The initiation of autophagy is influenced by the UNC-51-like kinase (ULK)-Atg17 complex, which is inhibited by the mechanistic target of rapamycin (mTOR) (24). Inhibition of mTOR by rapamycin results in the activation of autophagy (24). The ATG8/microtubule-associated protein light chain 3 (LC3) family and ATG5 play key roles in autophagosome biogenesis by building protein scaffolds (3, 14, 68, 75) and by mediating expansion of the lipid membrane of the autophagosome (61). Conversion of LC3-I (ATG8) to LC3-II allows the anchorage of ATG8/LC3 to the phagophore and is essential for its expansion to form autophagosomes (61). Autophagy substrates are targeted for degradation by associating with p62/SQSTM1, a multidomain protein that functions as a selective autophagy receptor, which physically link autophagic cargo to ATG8/MAP1-LC3/GABARAP family members located on the forming autophagic membranes (71). Deficiency in autophagy leads to intracellular accumulation of p62, a marker for an incomplete autophagy process known as impaired autophagic flux (45).
Shear stress imparts both metabolic and mechanical effects on vascular endothelial cells (10), with a pathophysiological relevance in the focal and eccentric nature of atherosclerotic lesions (11, 18, 20, 21, 28, 34, 36, 37, 79). A complex flow profile develops at arterial bifurcations; namely, flow separation and migrating stagnation points create low and oscillatory shear stress (OSS). At the lateral walls of bifurcations, disturbed flow, including oscillatory flow (bidirectional and axially misaligned flow), preferentially induces oxidative stress to initiate atherosclerosis, whereas in the medial walls of bifurcations, pulsatile flow (unidirectional and axially aligned flow) downregulates inflammatory responses and oxidative stress (33). Specifically, pulsatile shear stress (PSS) increased endothelial mitochondrial membrane potential (ΔΨm), accompanied by a decrease in mitochondrial superoxide production (mtO2 •−) (51), whereas OSS and oxidized low-density lipoprotein (ox-LDL) increased mtO2 •− production and apoptosis (73, 74). In this context, spatial (∂τ/∂x) and temporal (∂τ/∂t) variations in shear stress largely determine the focal nature of vascular oxidative stress and proinflammatory state.
Oxidative stress is considered to be a major inducer of autophagy (35, 41). ox-LDL induces autophagy accompanied by mitochondrial DNA (mtDNA) damage (22). Unlike nuclear DNA, the lack of protective histones in mitochondria renders mtDNA vulnerable to oxidative stress (76). A significantly higher incidence of mtDNA with 4977 bp deletion mutation is present in circulating blood cells and atherosclerotic lesions (7). ApoE-null mice deficient in protein kinase ATM (ataxia telangiectasia mutated) also exhibit an increase in frequency of mtDNA damage and a decrease in oxidative phosphorylation, leading to defects in cellular proliferation and initiation of atherosclerosis (60). OSS activates NADPH oxidase to increase cytosolic superoxide (O2 •−) production, which in turn activates c-Jun NH2-terminal kinase (JNK), leading to mtO2 •− production (19, 73, 74). Increased mtO2 •− production impairs the electron transport chain and promotes mtDNA damage (38).
While biomechanical forces have been reported to induce autophagy (42), whether spatial and temporal variations in shear stress modulate autophagy to influence mtO2 •− production remains undefined. We demonstrated prominent staining for p62, a reverse marker of autophagic flux, in the disturbed flow-exposed aortic arc, but attenuated p62 in the PSS-exposed descending aorta. OSS significantly increased the LC3-II/LC3-I ratios and p62 levels, whereas PSS minimally increased LC3 ratios and decreased P62 expression. Both anti-phospho-JNK and anti-8-hydroxy-2′-deoxyguanosine (8-OHdG) staining for DNA damage were prominent in the OSS-exposed aortic arch, whereas the staining was nearly absent in the PSS-exposed descending aorta. Our results indicate that OSS-mediated oxidative stress and JNK activation induced autophagy, but impaired autophagic flux to promote mtO2 •− production, mtDNA damage, and mitochondrial dysfunction in the disturbed flow-exposed regions.
Results
Spatial variations in shear stress modulate p62/SQSTM1 immunostaining in rabbit aorta
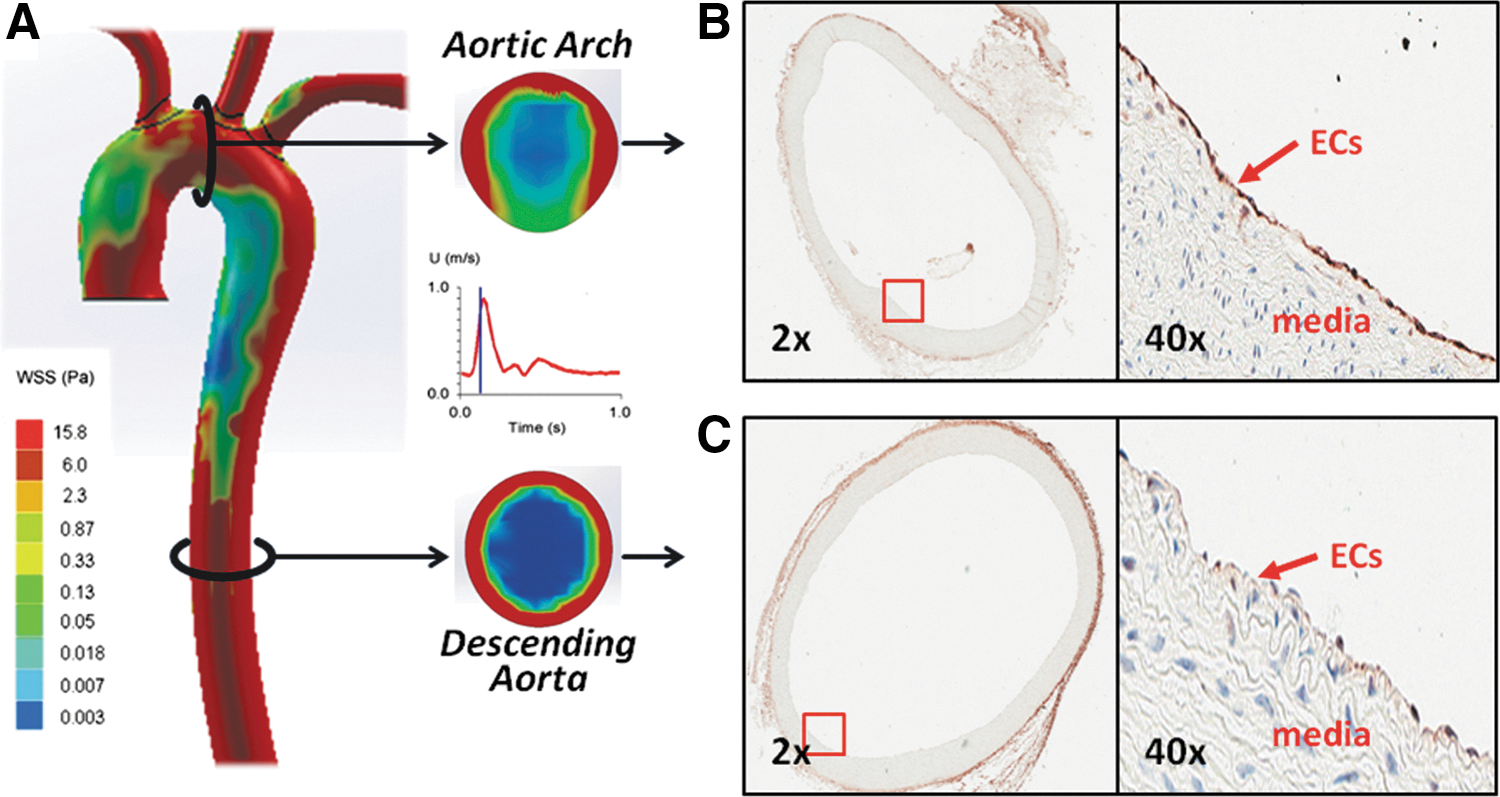
Atherosclerosis preferentially develops in the branch points and curvature of arterial trees where disturbed flow, including OSS, occurs (11, 18, 28, 36, 79). To examine whether there is a relationship between spatial variations in shear stress and autophagy, we stained cross sections of the rabbit aortic arch and descending aorta with an antibody against the autophagy-related gene p62, an ubiquitin-binding scaffold protein to promote autophagosome formation. Computational fluid dynamics (CFD) was employed to illustrate both spatial (∂τ/∂x) and temporal variations (∂τ/∂t) in wall shear stress at an instantaneous moment in systole and diastole (Fig. 1A). Immunohistochemistry revealed prominent endothelial p62 staining in the OSS-exposed aortic arch (Fig. 1B), but p62 staining was nearly absent in the PSS-exposed descending aorta (Fig. 1C) (65, 72). This observation suggests a link between spatial variations in shear stress and p62 staining and provides a basis to determine whether temporal variations in shear stress (∂τ/∂t), namely OSS versus PSS, differentially induce autophagy.
Temporal variations (PSS vs. OSS) in shear stress modulate LC3-II to LC3-I ratios and autophagosome formation
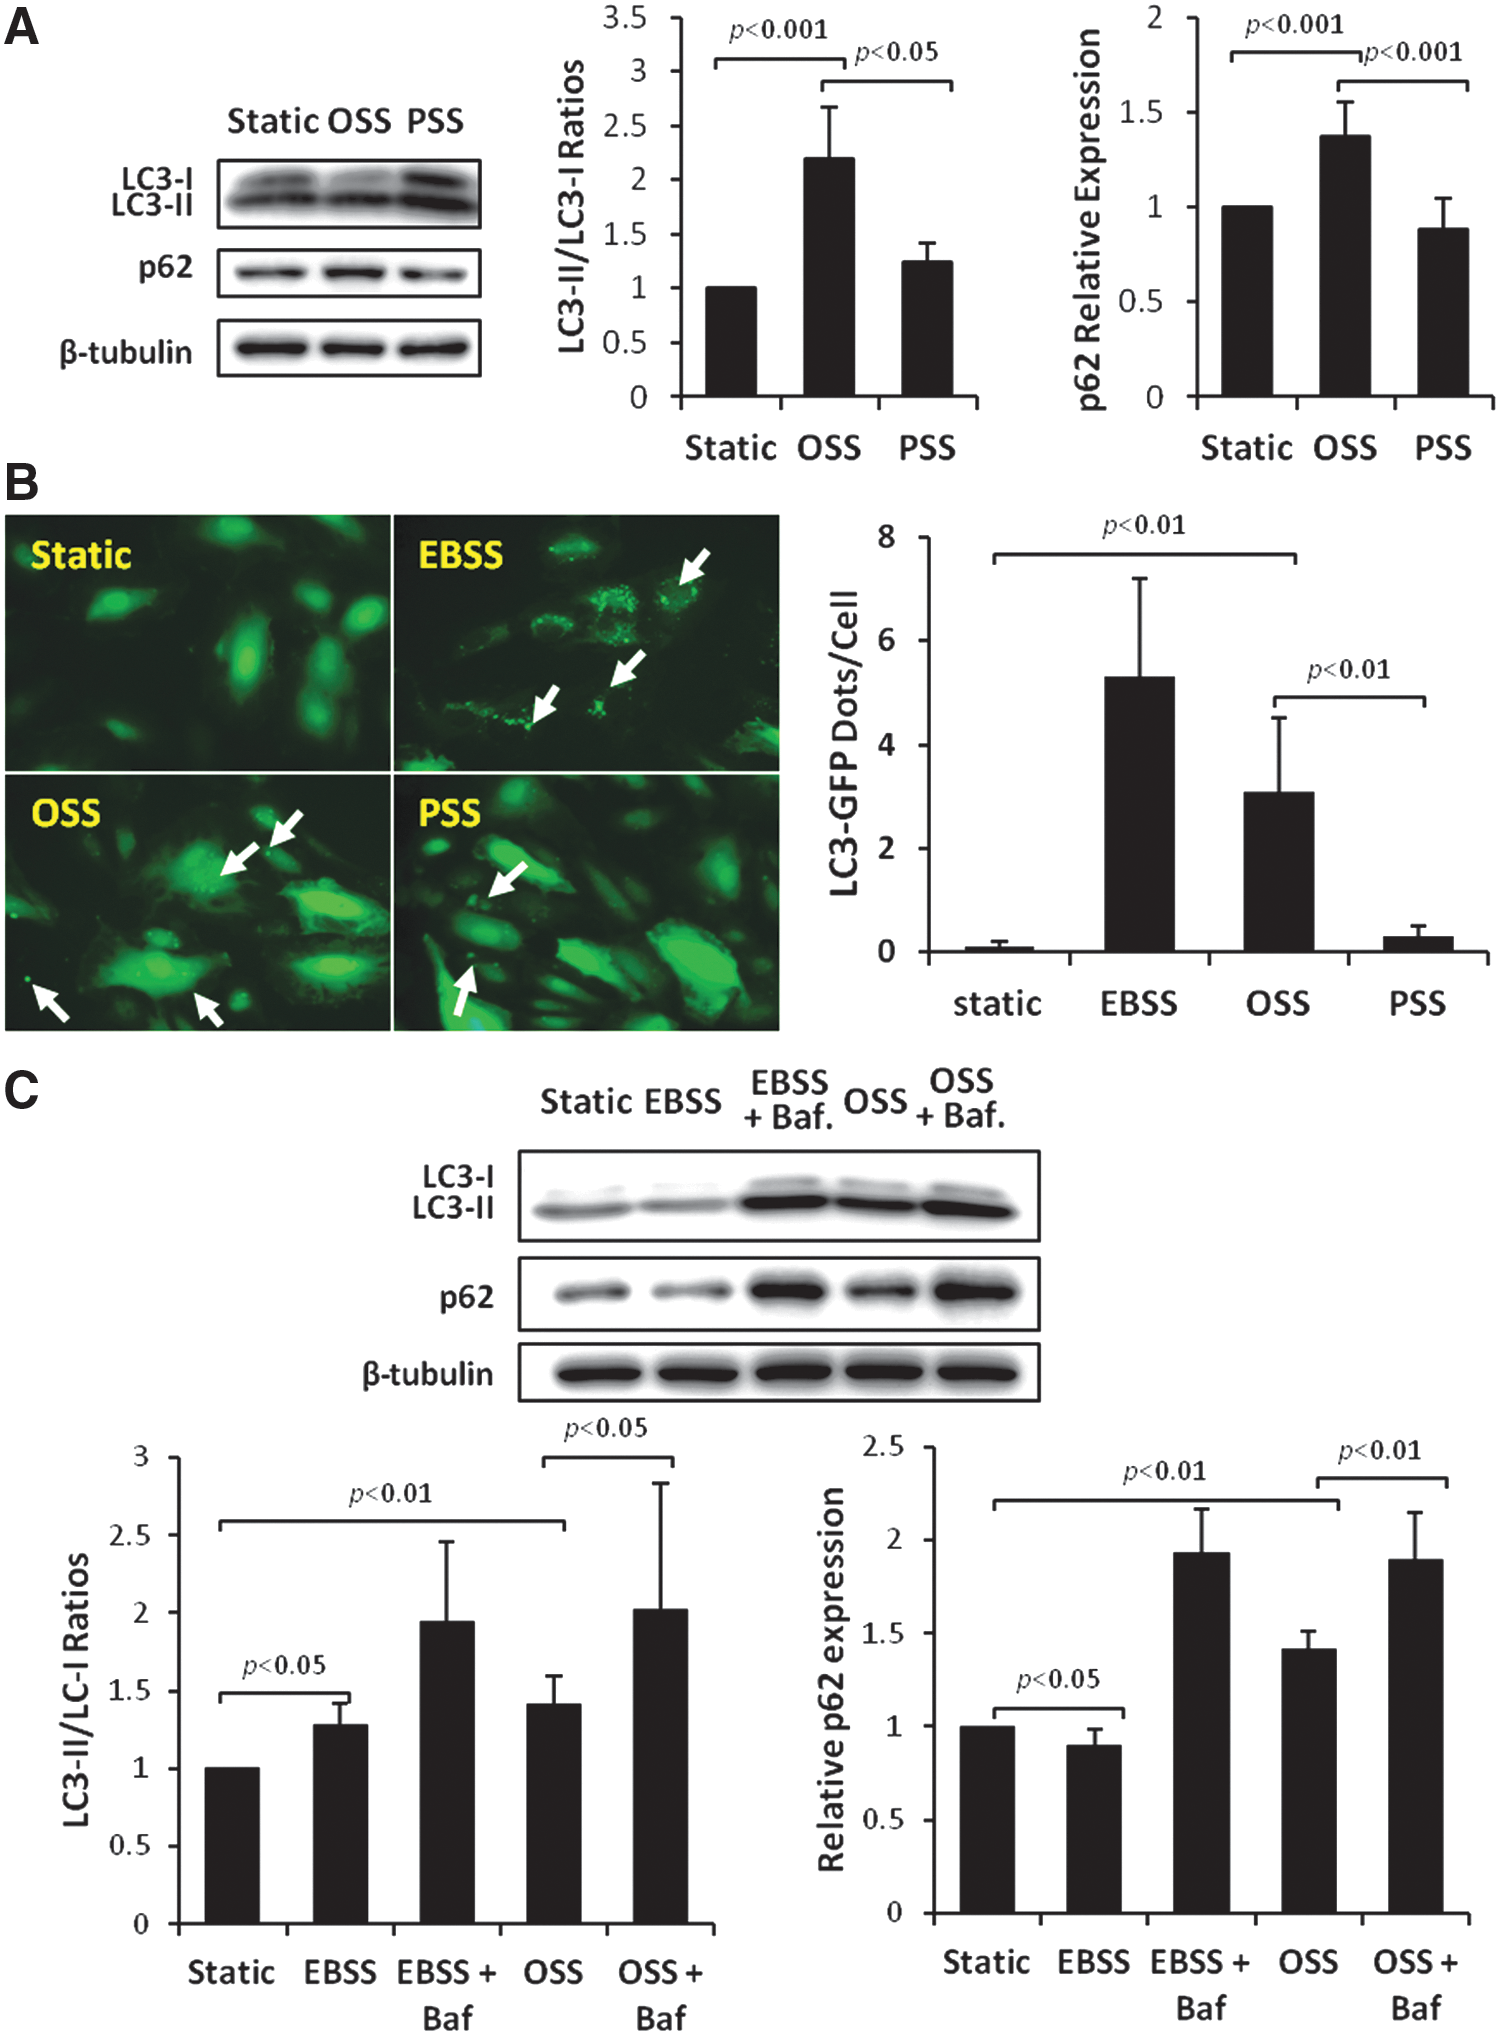
Human aortic endothelial cells (HAECs) were exposed to OSS versus PSS for 4 h, and autophagy was assessed by normalizing the LC3-II to LC3-I ratios to the static condition. The LC3-II to LC3-I ratios significantly increased in response to OSS by 120% (p<0.001 vs. static control, n=5) and 77% over PSS (p<0.001, n=5), whereas PSS minimally increased LC3 ratios by 23% (p<0.05, n=5) (Fig. 2A). To further assess the completion of the autophagy process, we examined the p62 levels, a reverse marker for autophagy flux. OSS increased p62 by 37% (p<0.01, n=4), whereas PSS did not significantly change p62 level (Fig. 2A). In parallel, OSS significantly increased autophagosome formation, as illustrated by green fluorescent protein (GFP)-LC3 puncta or dots/cell, but not PSS (Fig. 2B, arrows). Earle's balanced salt solution (EBSS) to induce autophagy by starvation also increased GFP-LC3 puncta (Fig. 2B). Our data indicate that OSS significantly induced autophagy by nearly twofold and thus provided a basis to focus on OSS modulation of autophagy.
OSS impairs autophagic flux
To further determine OSS modulation of autophagic flux, we compared the LC3 ratios and p62 levels in the presence of autolysosome inhibitor, bafilomycin. EBSS-induced autophagy increased C3-II to LC3-I ratios by 28% (p<0.05, n=6), but decreased p62 levels by 10% (p<0.05, n=6), and cotreatment of EBSS and bafilomycin increased LC3-II to LC3-I ratios by 55% (p<0.05 vs. EBSS, n=6) and p62 levels by 120% (p<0.01 vs. EBSS, n=4) (Fig. 2C). Cotreatment of OSS and bafilomycin increased LC3-II to LC3-I ratios by 47% (p<0.05 vs. OSS, n=6) and p62 levels by 41% (p<0.01 vs. OSS, n=6) (Fig. 2C). The increase in p62 levels in response to introducing bafilomycin to EBSS or OSS indicates an incomplete autophagy process, supporting the notion that OSS induces autophagy by an increase in LC3-II to LC3-I ratios, but impairs autophagic flux by a concomitant increase in p62 levels.
OSS-induced oxidative stress and JNK signaling increase LC3-II to LC3-I ratios
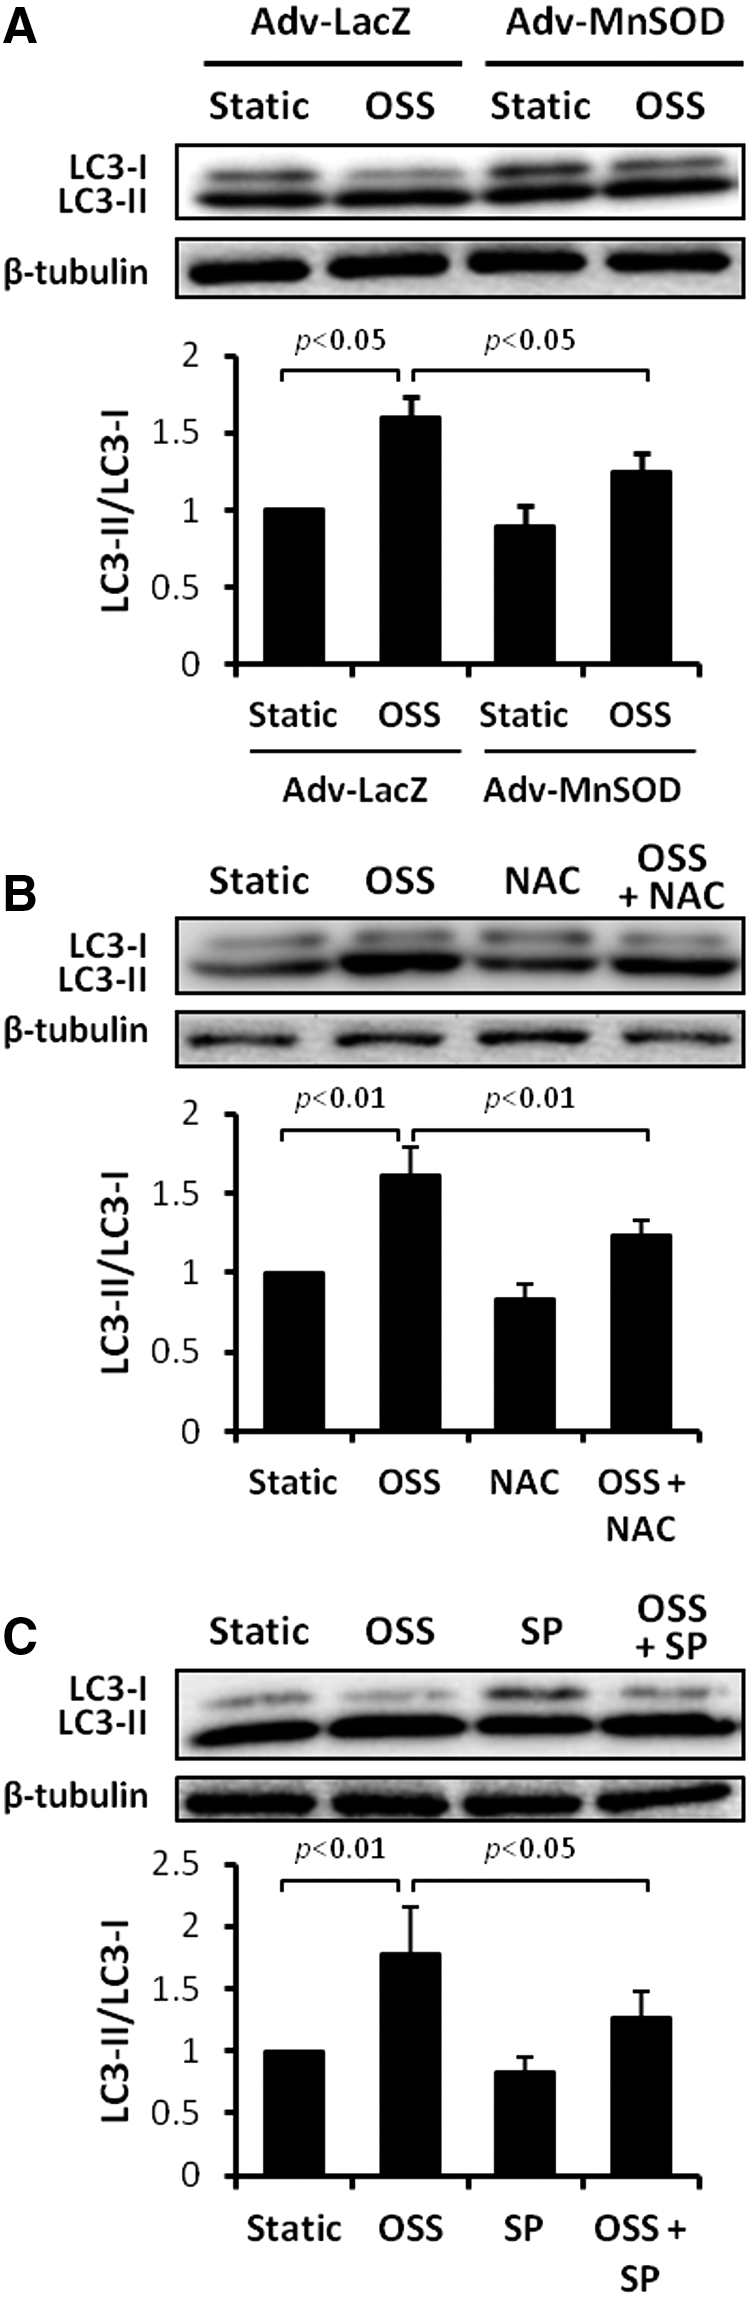
Previous studies demonstrated that OSS induces endothelial O2 •− production via activation of the NADPH oxidase enzyme system and c-Jun NH2-terminal kinase (JNK-1 and JNK-2) signaling (36, 37, 56, 73, 74). In this study, we transfected HAECs with control (Adv-LacZ) or recombinant manganese superoxide dismutase (MnSOD) adenovirus (Adv-MnSOD) to reduce mitochondrial superoxide production (O2 •−) (74). Overexpression of MnSOD significantly attenuated OSS-induced LC3-II to LC3-I ratios (p<0.05 vs. static condition, n=4) (Fig. 3A). Similarly, treatment with antioxidant N-acetyl cysteine (NAC) and JNK inhibitor, SP600125, significantly mitigated OSS-induced LC3-II to LC3-I ratios (NAC: p<0.01, n=4; SP600125: p<0.05, n=4) (Fig. 3B, C). Thus, OSS-mediated O2 •− production and JNK phosphorylation induce autophagy.
EBSS or rapamycin-induced autophagy mitigates OSS-induced mitochondrial superoxide (mtO2 •−) production
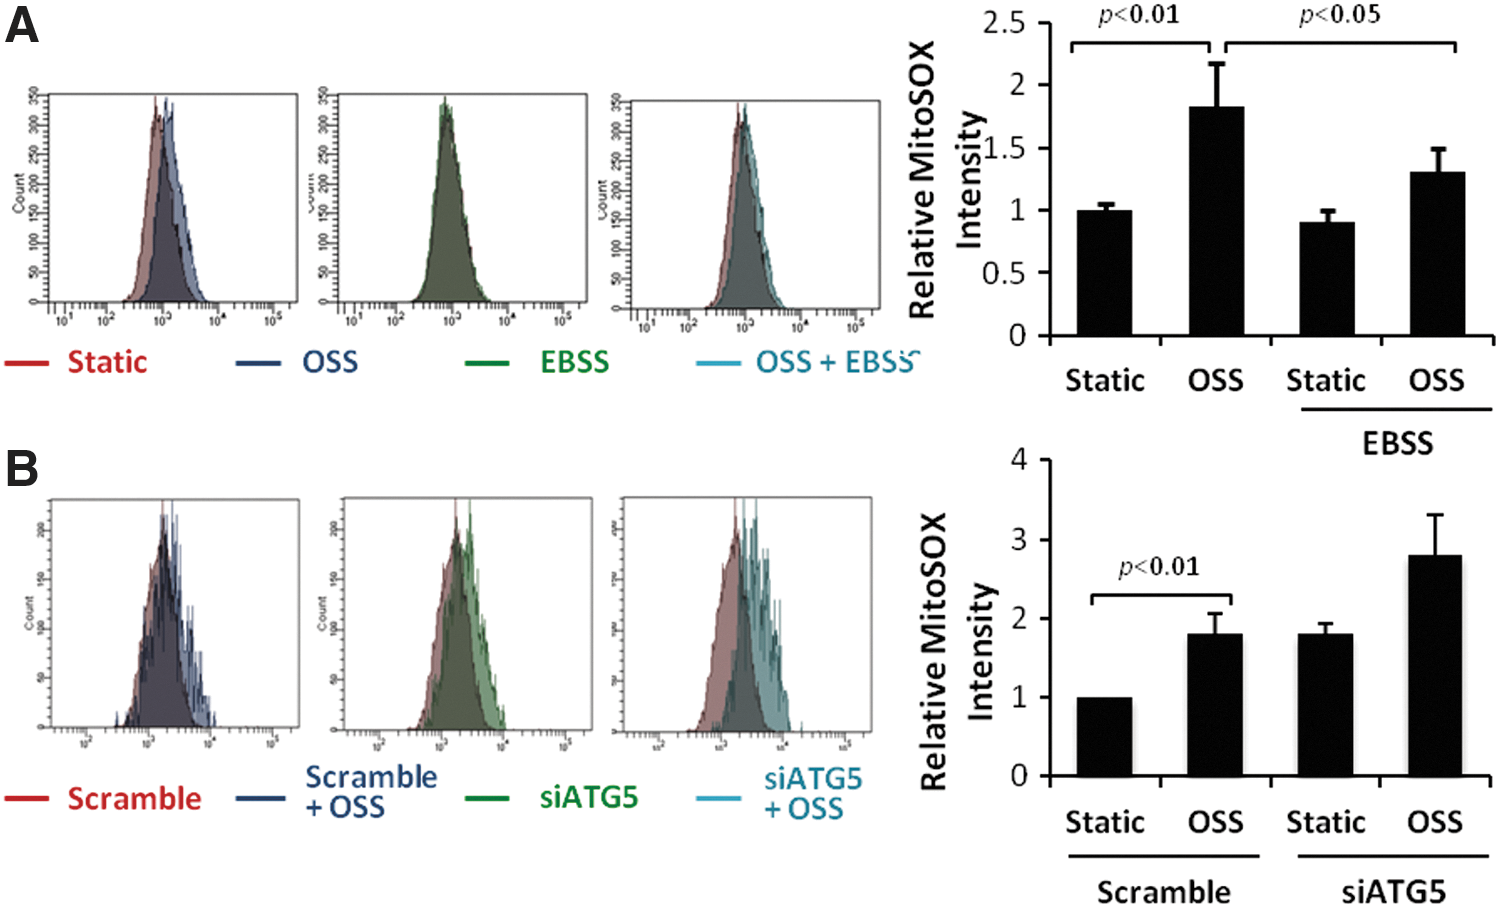
OSS significantly increased mtO2
•− production in HAECs, as measured via MitoSOX Red fluorescent intensity quantification by flow cytometry (p<0.05, n=4) (Fig. 4A). EBSS attenuated OSS-induced inhibition of autophagy flux (p<0.05, n=6) (Supplementary Fig. S1; Supplementary Data are available online at
EBSS or rapamycin-induced autophagy restores OSS-mediated reduction in mitochondrial respiration
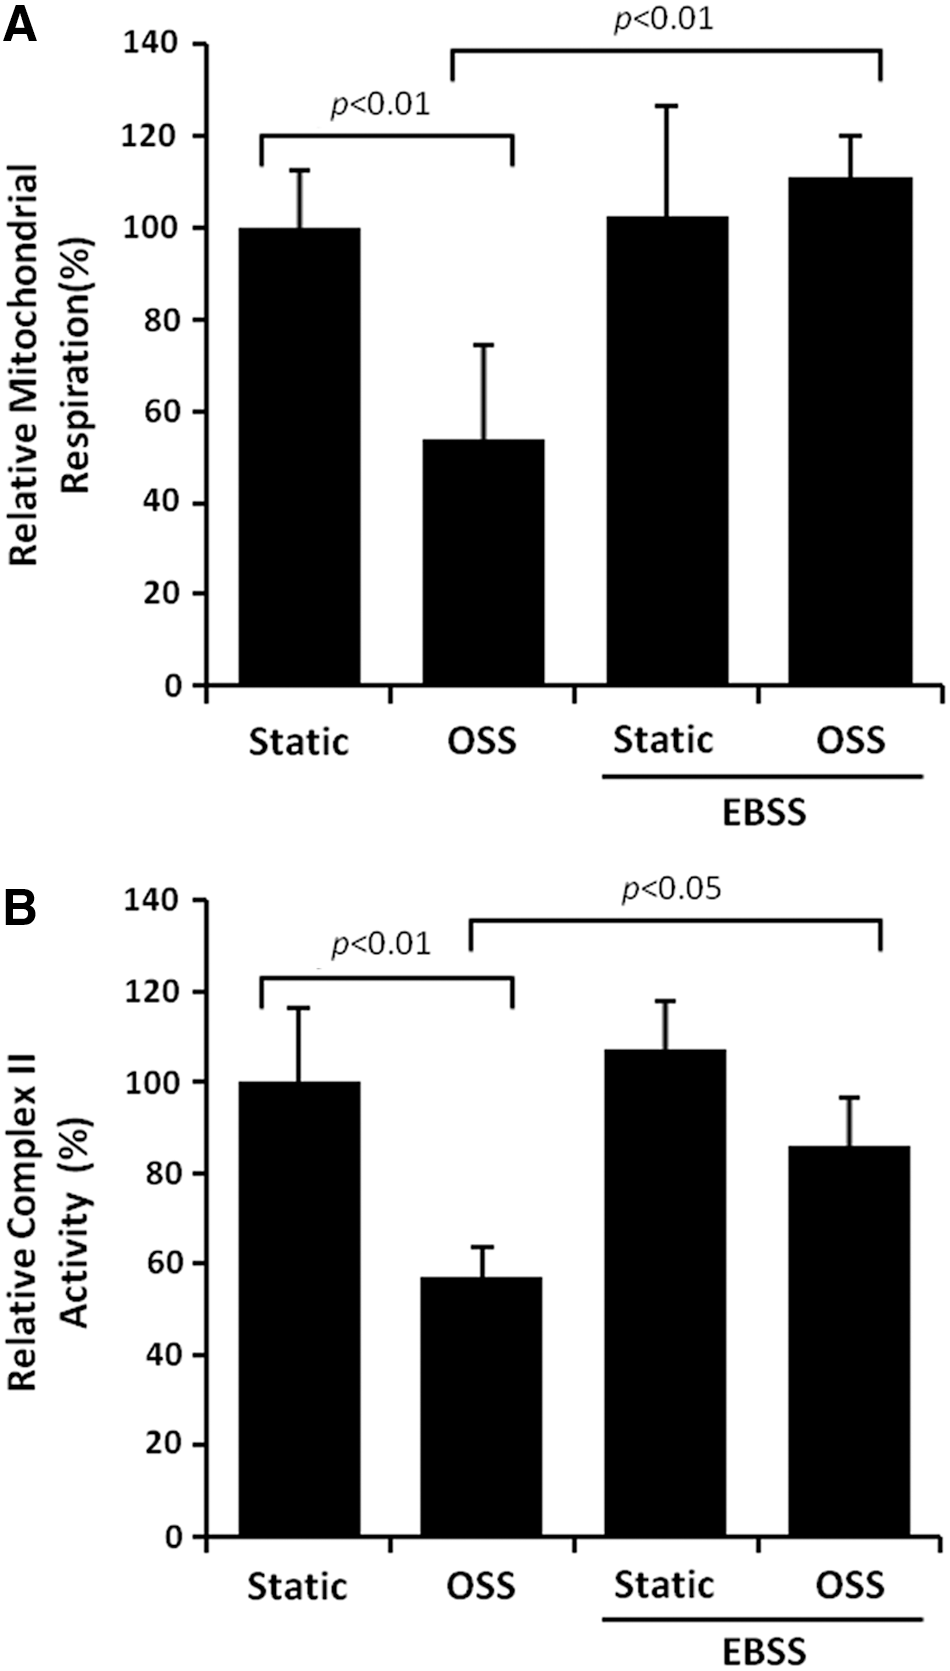
OSS significantly reduced mitochondrial respiration by 46% (p<0.01, n=4). EBSS-induced autophagy completely restored OSS-mediated reduction in mitochondrial respiration (p<0.01, n=4) (Fig. 5A). Mitochondrial complex II generates ROS at high rates during oxidative phosphorylation (69). OSS reduced complex II activity in HAECs by 43% (p<0.05, n=3), which was restored by EBSS (p<0.05, n=3) (Fig. 5B). Rapamycin-induced autophagy also completely restored an OSS-mediated decrease in complex II activity (p<0.05, n=4) (Supplementary Fig. S3). Collectively, induction of autophagy restores mitochondrial respiration.
OSS-mediated JNK signaling and mtO2 •− production induce mtDNA damage
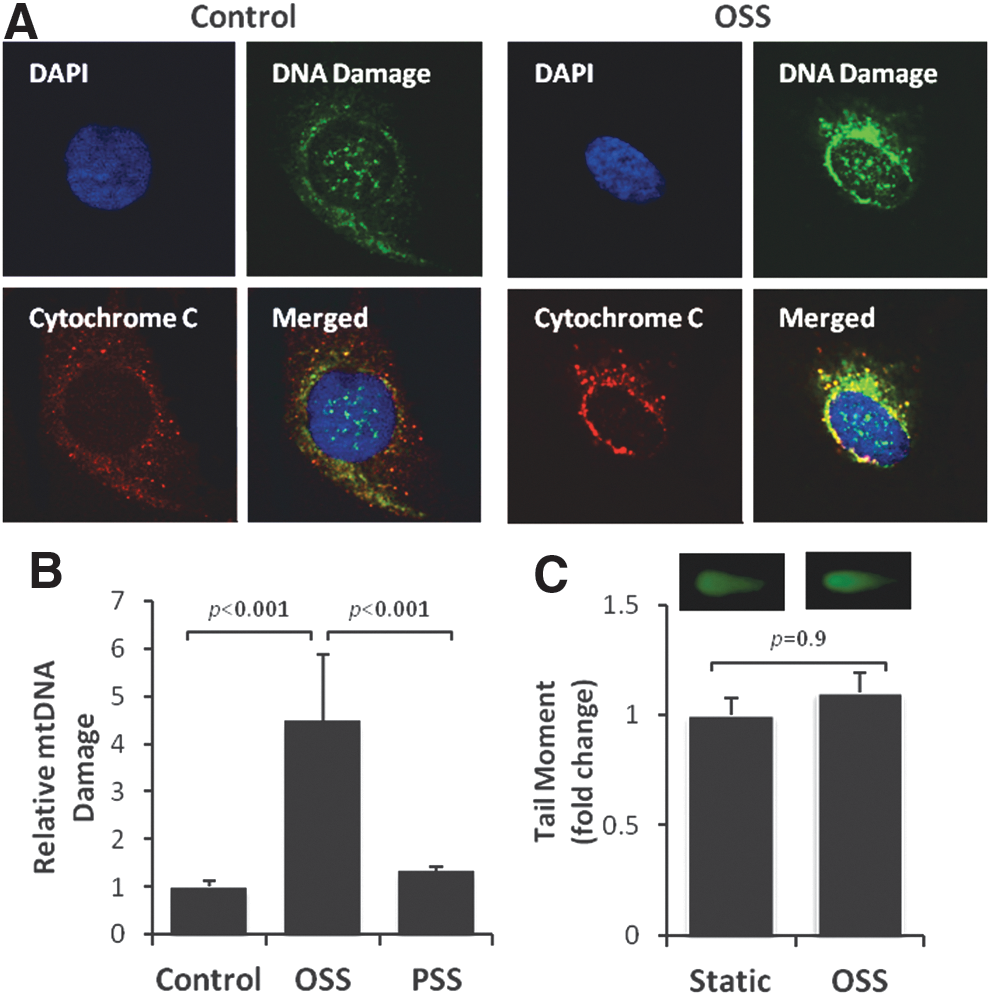
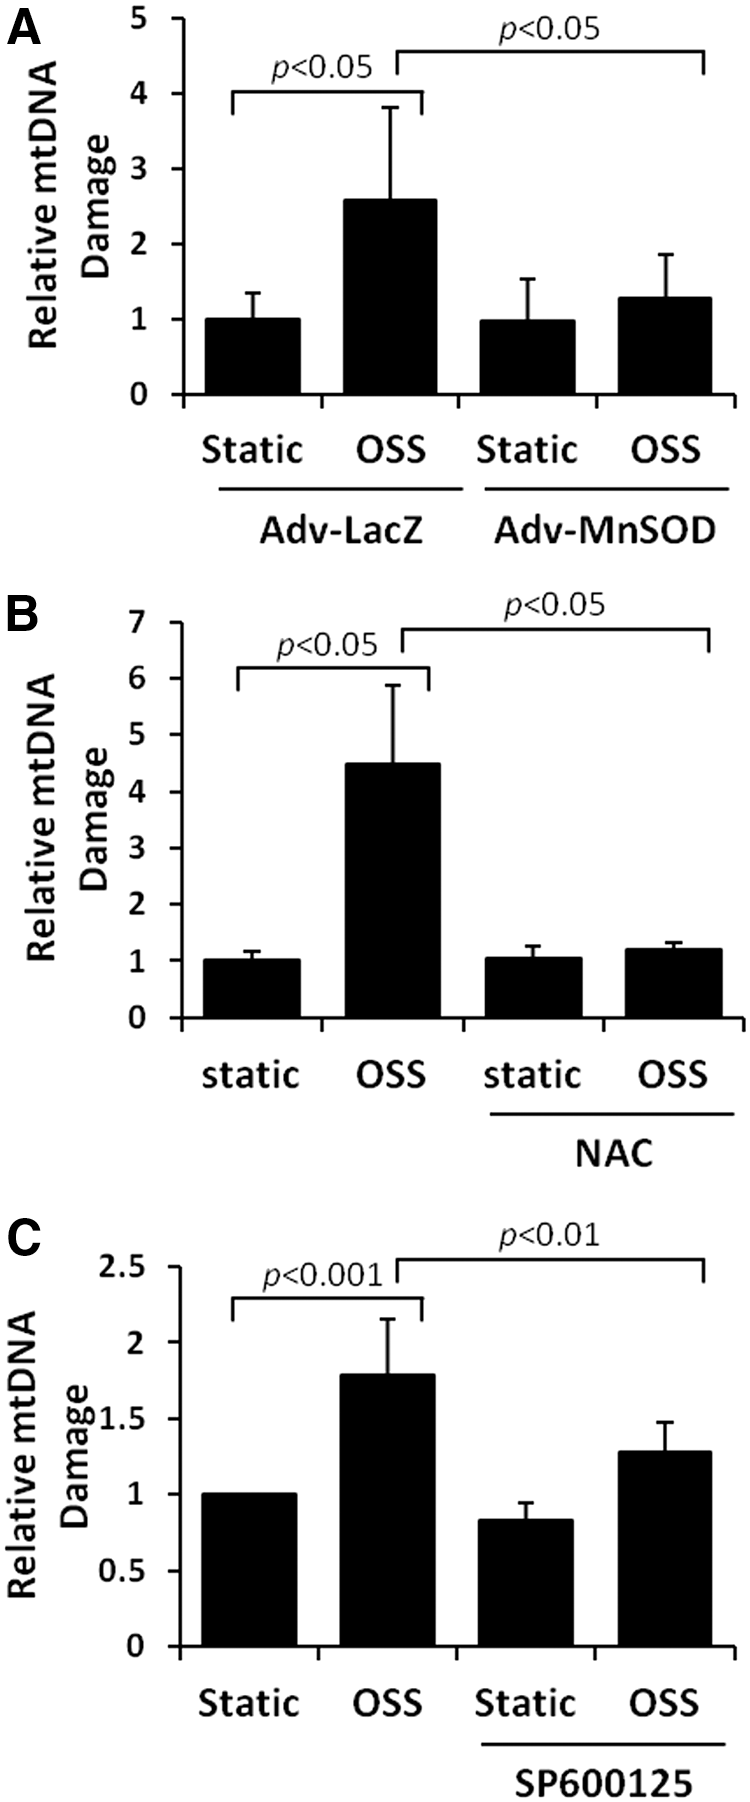
Unlike nuclear DNA, mtDNA is not bound directly to the histone family in the mitochondrial matrix (13, 40) and is susceptible to oxidative DNA damage (76). OSS-induced mtDNA damage was assessed by accumulation of 8-OHdG (40) and was predominantly colocalized with mitochondria (anti-cytochrome C, red fluorescence) (Fig. 6A). OSS induced a 4.5-fold increase in mtDNA damage (p<0.001 vs. control, n=4) (Fig. 6B). OSS-induced nuclear DNA damage was statistically insignificant, as measured by the Comet assay (p=0.9, n=3) (Fig. 6C). Furthermore, OSS-induced mtDNA damage was significantly mitigated by overexpression of MnSOD with recombinant adenoviruses (p<0.05, n=4) (Fig. 7A), treatment with antioxidant NAC (p<0.05, n=4) (Fig. 7B), and the JNK inhibitor, SP600125 (p<0.01, n=4) (Fig. 7C). These observations demonstrate that OSS-induced mtO2 •− production and JNK signaling promote mtDNA damage.
DNA damage and JNK activation develop in the disturbed flow-exposed aortic arch
To recapitulate spatial variations in OSS-induced JNK activation and mtDNA damage in vivo, we performed immunohistochemistry staining in both the aortic arch and descending aorta of New Zealand White rabbits fed a normal chow diet. Both anti-8-OHdG antibody staining for oxidative DNA damage and anti-phospho-JNK staining were prominent in the OSS-exposed aortic arch, but were nearly absent in the PSS-exposed descending aorta (Fig. 8). Taken together, spatial (lesser vs. greater curvature vs. descending aorta) and temporal variations (OSS vs. PSS) in shear stress differentially induce autophagy and autophagic flux (Fig. 1) to modulate mitochondrial homeostasis (Fig. 6).

Discussion
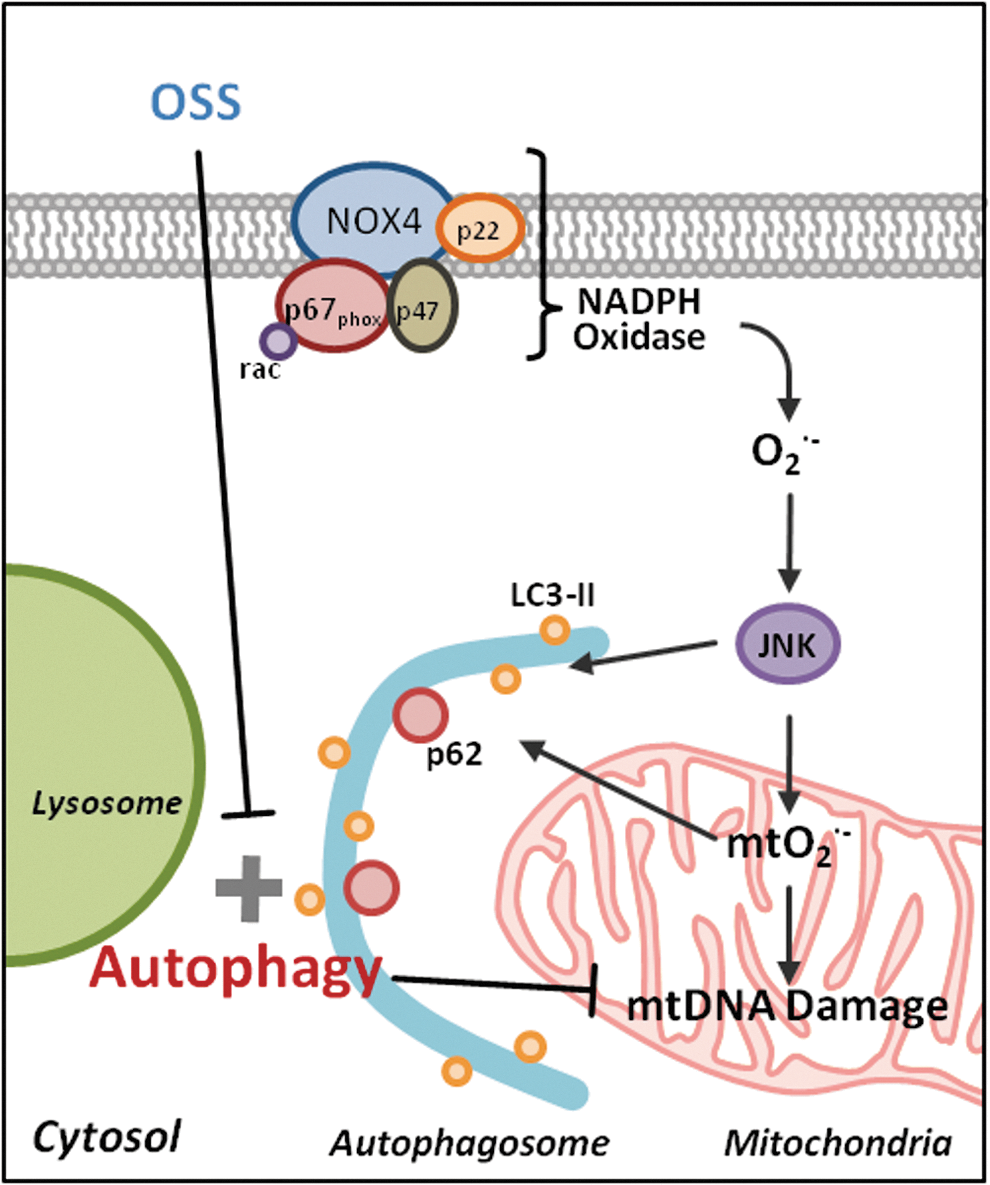
Spatial and temporal variations in hemodynamic shear stress modulate endothelial metabolic states to support the focal and eccentric nature of atherosclerotic lesions. While the mechanotransduction mechanisms underlying fluid shear stress and oxidative stress have been well elucidated (15 –18, 29), we hereby provide new metabolic insights into the disturbed flow-mediated (i) LC3-II to LC3-I ratios to promote autophagosome biogenesis and (ii) p62 accumulation to impair autophagic flux. We further elucidate OSS-mediated oxidative stress and JNK signaling underlying activation of autophagy to modulate mitochondrial homeostasis (Fig. 9).
Organisms experience frequent changes in their biophysical and biochemical environment. Induction of basal autophagy preserves cellular function and adapts to stress responses via delivery of proteins, macromolecules, organelles, and microbes to the lysosome for digestion (12, 31, 46, 54, 57, 59, 66, 78). Macrophage-specific ATG5-null mice develop an increase in atherosclerotic lesions accompanied by elevated inflammatory markers, supporting the impairment of autophagy as an underlying mechanism in the initiation of atherosclerosis (70). In our dynamic flow system, ATG5 knockdown accentuated OSS-induced mtO2 •− production, whereas EBSS or rapamycin activated autophagy to attenuate OSS-induced mtO2 •− production (Fig. 4A and Supplementary Fig. S2).
In the disturbed flow-exposed regions of the adult porcine aorta, both proinflammatory and antioxidative endothelial transcription profiles coexist (64). While disturbed flow promotes inflammatory responses, the antioxidative transcript profiles, including MnSOD expression, prevent initiation of atherosclerosis (64). Shear stress-responsive MnSOD is located in the mitochondrial matrix to dismutate the conversion of superoxide anion (O2 •−) to hydrogen peroxide (H2O2) (2, 43). MnSOD+/− mice exhibit impaired endothelium-dependent vasodilation (26). ApoE −/− MnSOD+/− mice display earlier mtDNA damage and accelerated atherosclerosis compared with ApoE −/− MnSOD+/+ mice (4). In our dynamic HAEC model, induction of autophagy mitigates OSS-induced mtO2 •− production in the absence of hyperlipidemia. EBSS or rapamycin-induced autophagy mitigates OSS-mediated JNK activation and mtO2 •− production to reduce mtDNA damage, which initiates atherogenesis (22, 58, 60). Overexpression of MnSOD and treatment with NAC or JNK inhibitor significantly attenuate OSS-induced mtDNA damage (Fig. 7). In corollary, overexpression of MnSOD attenuates JNK-mediated MnSOD protein degradation and ubiquitination, leading to an increase in cleaved caspase-3 (74). Preferential accumulation of p62 levels in the OSS-exposed aortic arch rather than PSS-exposed descending aorta further supports an incomplete autophagy process known as impaired autophagic flux (45) (Fig. 1) (44, 47). Thus, the combination of impaired autophagic flux and mtDNA damage in the disturbed flow-exposed regions is conducive to initiate endothelial dysfunction (Fig. 8).
It is well recognized that ROS activate antibacterial autophagy and autophagic cell death through distinct mechanisms, depending on the specific cell types in the microenvironment (35, 41). Induction of autophagy by pharmacological intervention, overexpression of ATG genes, and exercise-mediated shear stress augmentation confer cellular protection against the aggregate-prone proteins associated with neurodegeneration (1, 67). In this study, we demonstrate that spatial (∂τ/∂x) and temporal variations (∂τ/∂t) in shear stress induce cytosolic O2 •− production, JNK activation, and mitochondrial metabolic changes to increase LC3-II to LC3-I ratios.
NADPH oxidase cytosolic O2 •−-JNK phosphorylation signaling was implicated in OSS-mediated mtO2 •− production (73). Immunostaining of aorta from New Zealand White (NZW) rabbits fed a normal diet supports the notion that DNA damage and JNK activation coexist in the OSS-exposed region or lesser curvature of the aortic arch (Fig. 8). In our dynamic HAEC model, OSS increased LC3-II/LC3-I ratios and GFP-LC3 dots/cell to a greater extent than did PSS, and OSS-mediated cytosolic O2 •−-JNK phosphorylation signaling induces autophagy (Fig. 3). Conversely, EBSS and rapamycin-induced autophagy mitigate OSS-induced mtO2 •− production, whereas ATG5 siRNA-inhibited autophagy increased OSS-induced mtO2 •− production. We further observed that autophagy restored OSS-mediated mitochondrial respiration (Fig. 5A).
Due to the lack of protective histones, mtDNA is vulnerable to oxidative damage (76). Oxidative phosphorylation is coupled with respiratory chain complexes I to II, III, and IV (23, 30). While the transfer of electrons from ubisemiquinone through the mitochondrial respiratory chain is more than 98% efficient, 1.5%–2% of electrons leak out to form O2 •− (27). For these reasons, autophagy modulates OSS-mediated changes in mitochondrial respiration and complex activity to mitigate mtO2 •− production and mtDNA damage (Fig. 4A and Supplementary Figs S1 and S2).
mtDNA damage is frequently observed in blood cells and the vascular wall. Despite its low abundance, a specific 4977 bp common deletion (mtDNA [4977]) is associated with mitochondrial dysfunction (7). mtDNA damage primes the initiation of atherosclerosis (60). Our laboratory and others have demonstrated that OSS activates NADPH oxidase, which, in turn, induces an increase in cytosolic O2 •− production to activate JNK and to increase mtO2 •− production (19, 73, 74). Thus, OSS induces the JNK signaling pathway to initiate mtO2 •− production and mtDNA damage.
Overall, disturbed flow modulates the cross talk between autophagy and mitochondrial function (5, 22, 35, 49, 55). In the athero-prone or OSS-exposed arterial regions, basal endothelial homeostasis may be dependent on the balance between OSS-induced mtDNA damage and autophagy. In the presence of cardiovascular risk factors, disturbed flow impairs autophagic flux to initiate inflammatory responses and atherosclerosis. We hereby provide a dynamic model with translational implications to modulate mechanosensitive tissues to maintain cellular homeostasis.
Materials and Methods
Immunohistochemistry staining
p62, also known as sequestosome (SQSTM1), is an ubiquitin-binding scaffold protein. p62 accumulates when autophagy is inhibited and decreases when autophagy is induced (44, 47). Cross sections of the aortic arch and descending aorta from NZW rabbits were stained with anti-p62 antibody (Boster Biological Technologies) to assess changes in autophagy in vivo. Staining of the aortic arch and descending aorta was performed with anti-8-OHdG (Cayman Chemicals) and anti-phospho-JNK (Cell Signaling) to assess DNA damage by oxidation.
Three-dimensional CFD simulation
Aortic arch geometry was extracted from an angiogram video of the aorta. Diameters were measured every 5 mm along the length of the aorta and cross sections were assumed to be circular at every measured site. The aorta was reconstructed in SolidWorks (Concord). The pulsatile arterial profiles were captured from the MRI images and the video frames were extracted by ImageJ (National Institute of Health). Arterial velocity profiles were used as inlet boundary condition and the outlet was defined at 0 Pa, static pressure. CFD simulation was performed with SolidWorks Flow Simulation (Concord) with 3176 fluid mesh cells and 6082 partial mesh cells. The simulation was run until the defining 2 s physical time with a time step size of 0.01. SolidWorks Flow Simulation automatically sets convergence conditions with changing iteration numbers. The governing equations were solved by laminar incompressible blood with nonslip unsteady flow condition.
Endothelial cell culture
HAECs were cultured in endothelial cell growth medium (Cell Applications) and used between passages 5 and 9. For the autophagy study in response to shear stress, cells were seeded on gelatin-coated glass slides (25×75 mm) and grown to confluent monolayers for 48 h in 5% CO2 at 37°C before flow was applied. For inhibitor and stimulator studies, the cells were pretreated with c-Jun NH2-terminal Kinase (JNK) inhibitor, SP600125 (2–10 μM), antioxidant NAC (5 mM), or rapamycin (1 μM) before shear stress exposure.
Dynamic flow system to simulate PSS versus OSS profiles
A dynamic flow channel was used to recapitulate hemodynamics in human carotid arterial bifurcations (2, 39). The flow system was designed to generate well-defined flow profiles across the width of the parallel flow chamber at various temporal gradients (∂τ/∂t), frequencies, and amplitudes. HAECs were exposed to three conditions in DMEM/1% FBS unless otherwise stated: (i) control at static conditions, (ii) PSS at τavg=23 dyn·cm−2 and ∂τ/∂t at±8 dyn·cm−2·s−1 at 1 Hz, and (iii) OSS at τavg=0.02 dyn·cm−2 and ∂τ/∂t at±3 dyn·cm−2·s−1 at 1 Hz.
Western blot analyses
After flow exposure, HAECs were rinsed with phosphate-buffered saline and lysed using RIPA buffer supplemented with protease and phosphatase inhibitors. Protein concentration was measured using the Bio-Rad DC assay and 50 μg of protein was loaded for Western blotting essentially as previously described (53). Antibodies against autophagy-associated genes were purchased from Abcam for LC3 and from Boster Biological Technologies for p62. Parallel blots were performed with anti-β-tubulin (Millipore, Inc.) for loading normalization. Densitometry was performed to quantify blot bands as previously described (53).
Autophagosome visualization with GFP-LC3
HAECs seeded onto glass slides were infected with recombinant GFP-LC3 adenoviruses, kindly provided by Dr. Junichi Sadoshima from Rutgers New Jersey Medical School, at the multiple of infection (MOI) of 1:20. The cells were then applied to EBSS, static condition, or shear stress for 4 h. Fluorescent images were acquired using an inverted microscope (Olympus) and a DSLR camera (Canon). The puncture autophagosome structures were assessed by quantifying the dots inside cells. Dots were averaged from 50 cells for each condition as an indication of autophagosome formation.
Mitochondrial respiration assay
HAECs treated with dynamic shear stress were collected by trypsinization and seeded on XF24 V7 microplates at 25,000 cells/well. The cells were allowed to adhere to the plate for 2 h, then analyzed for mitochondrial respiration using the Seahorse XF24 analyzer as previously described (69). Mitochondrial respiration was measured and normalized to protein levels using the Bio-Rad protein assay.
Complex II activity assay
Mitochondrial complex II activity was measured with an assay kit from Abcam. Briefly, HAECs were collected after flow and resuspended at 5.5 mg/mL. The cells were lysed with the lysis buffer provided in the kit. After 30 min of incubation, the lysates were centrifuged at 25,000 g for 20 min at 4°C. Supernatants were collected for the assay following the manufacturer's instructions. Relative complex II activities were normalized to protein levels.
mtDNA damage assay
mtDNA damage was assessed by quantifying a large base pair deletion along the major arch of the mitochondrial genome by quantitative PCR. A common 4977 bp deletion in mtDNA was quantified by quantitative PCR (8) using primers flanking the deletion and normalized to the mitochondrial COX1 gene. The pair of primers for detection of the 4977 bp deletion was forward: CCTTACACTATTCCTCATCACC; reverse: TGTGGTCTTTGGAGTAGAAACC; and the pair of primers for mitochondrial COX1 was forward: TTCGCCGACCGTTGACTATTCTCT; reverse: AAGATTATTACAAATGCATGGGC.
siRNA transfection
Validated siRNA for ATG5 was purchased from Qiagen, Inc. Negative control siRNA or ATG5 siRNA (30 nM) was transfected to HAECs with Lipofectamine RNAiMAX (Life Technologies) following the manufacturer's instructions. Real-time PCR was used for confirmation of gene knockdown at 48 h after transfection.
Overexpression of MnSOD
Overexpression of the mitochondrial antioxidant enzyme, MnSOD, was done by transfecting HAECs with MnSOD adenovirus at an MOI of 1:100 for 1 h. HAECs were allowed to recover for 24 h before flow exposure, as previously described (73).
Immunofluorescence staining
Following flow exposure, HAECs were fixed with 4% PFA and stained with antibody against 8-OHdG for DNA oxidation and anti-cytochrome C for mitochondria. Fluorescent images were acquired using an inverted microscope (Olympus) and a DSLR camera (Canon).
Flow cytometry analysis to quantify mtO2 •− production
Mitochondrial superoxide (mtO2 •−) production was assessed by staining with MitoSOX Red, as previously described (73, 74), and was quantified using flow cytometry as previously described (52).
Nuclear DNA damage assay (Comet assay)
Nuclear DNA damage was assessed by quantifying nuclear DNA fragmentation using the Comet assay kit (Trevigen) according to the manufacturer's suggested procedures. Briefly, HAECs were trypsinized and immobilized on a glass slide with low-melting point agarose. The cells were lysed, treated with alkaline buffer, and stained with an SYBR green nucleic acid stain. The sample was then run at 28 V for 30 m, comet tails were visualized by fluorescence microscopy, and the tail moments were quantified using CaspLab Comet Assay Software.
Statistical analysis
Data were expressed as mean±standard deviation and compared among separate experiments. Comparisons of multiple values were made by one-way analysis of variance (ANOVA), and statistical significance for pair-wise comparisons was determined post hoc using Tukey's method. p-Values of <0.05 were considered statistically significant.
Footnotes
Acknowledgments
The authors are grateful to Dr. Junichi Sadoshima from Rutgers New Jersey Medical School for providing recombinant GFP-LC3 adenoviruses. The authors thank Dr. Peixiang Zhang from UCLA for the Seahorse assay. This project was supported by National Institutes of Health, HL083015 (T.K.H.), HL118650 (T.K.H.), HL111437 (T.K.H.), DE010742 (D.K.A.), and DE014183 (D.K.A.).
Author Disclosure Statement
No competing financial interests exist.
Abbreviations Used
References
Supplementary Material
Please find the following supplemental material available below.
For Open Access articles published under a Creative Commons License, all supplemental material carries the same license as the article it is associated with.
For non-Open Access articles published, all supplemental material carries a non-exclusive license, and permission requests for re-use of supplemental material or any part of supplemental material shall be sent directly to the copyright owner as specified in the copyright notice associated with the article.
