




Abstract
Introduction
RAS
By dint of its strong stimulatory effect on cell proliferation/survival pathways, the activation status of RAS needs to be tightly regulated to prevent constitutive repetitive activation. This is accomplished by the intrinsic GTPase activity of RAS as well as other GTPase-activating proteins (GAPs) that speed up GTP hydrolysis, thus maintaining RAS in the inactive GDP-loaded state (2). Of note, somatic mutations associated with aberrant activation of KRAS (particularly affecting codons 12, 13, and 61) are highly oncogenic (30%–40% of human cancers) as they not only render the protein resistant to GAPs but also significantly reduce its GTPase activity (25, 29, 37). Consequently, mutated KRAS maintains constitutive activation of the RAF/MEK/ERK and the PI3K/AKT/mTOR signaling networks, resulting in unabated cell proliferation that promotes tumourigenesis (2, 4). Therefore, a considerable effort has been centered at designing therapeutic strategies that target the canonical downstream pathways of KRAS, such as the pharmacological inhibitors of BRAF, MEK1, PI3K, and mTOR, or those that indirectly inhibit KRAS by targeting upstream stimuli, such as inhibitors of EGFR (25, 37). As these canonical signaling pathways are also essential for normal healthy cells, the specificity of these strategies poses a major therapeutic challenge. As such, considerable effort to directly target mutant KRAS to disrupt these networks in an attempt to induce addiction shock and trigger execution of oncogene-addicted cancer cells has been underway (19). In this regard, the design of farnesyltransferase inhibitors to block membrane recruitment of RAS was a major development; however, these drugs did not prove successful in clinical trials (1, 15, 17).
We describe the ability of a small compound, C1, to preferentially target cancer cells harboring mutant KRAS, leading to hyperactivation of oncogenic KRAS and downstream reactive oxygen species production, which involves activation of AKT/PKB. The biological activity of this compound represents two main advantages: it targets a pathway, for which limited options exist, and its specificity toward oncogenic RAS provides a strategy to target cancer cells with minimal collateral damage. In addition, the requirement for AKT activation, downstream of KRAS, ensures further selectivity given that constitutive activation of AKT/PKB is a common finding in many human cancers.
In an earlier report, we demonstrated the ability of a novel small-molecule experimental agent, C1, to selectively target human colorectal carcinoma HCT116 cells as well as a variety of human cancer cell lines and primary cells derived from clinical lymphomas (33). This selective execution of cancer cells was mediated via reactive oxygen species (ROS)-dependent ERK and JNK activation, which served as the signal for the simultaneous induction of autophagy and apoptosis (33). In an attempt to decipher the molecular mechanism(s) underlying the specific targeting of cancer cells by C1, we unraveled a remarkable selectivity for cancer cells that carry mutant KRAS, such as HCT116, compared with the wild-type (WT) KRAS-expressing HT29 cells. Using a variety of model systems such as mutant KRAS-expressing cancer cell lines, isogenic clones of HCT116 cells with or without the mutant KRAS allele, normal prostate epithelial cells transformed with mutant KRAS, and gene silencing of KRAS, we provide evidence that the small-molecule compound not only targets mutant KRAS-expressing cancer cells but also does so in a manner that is dependent upon the specific activation, not inhibition, of mutant KRAS in these cells. Of note, the mutant KRAS activation drives downstream drug-induced ROS production via the activation of AKT/PKB, thereby resulting in oxidative stress-induced cell death. These data provide a novel mechanism of selective targeting of oncogene-addicted cancer cells, which could have therapeutic implications against mutant KRAS-driven cancers.
Results
C1 targets cells displaying a constitutively active KRAS phenotype
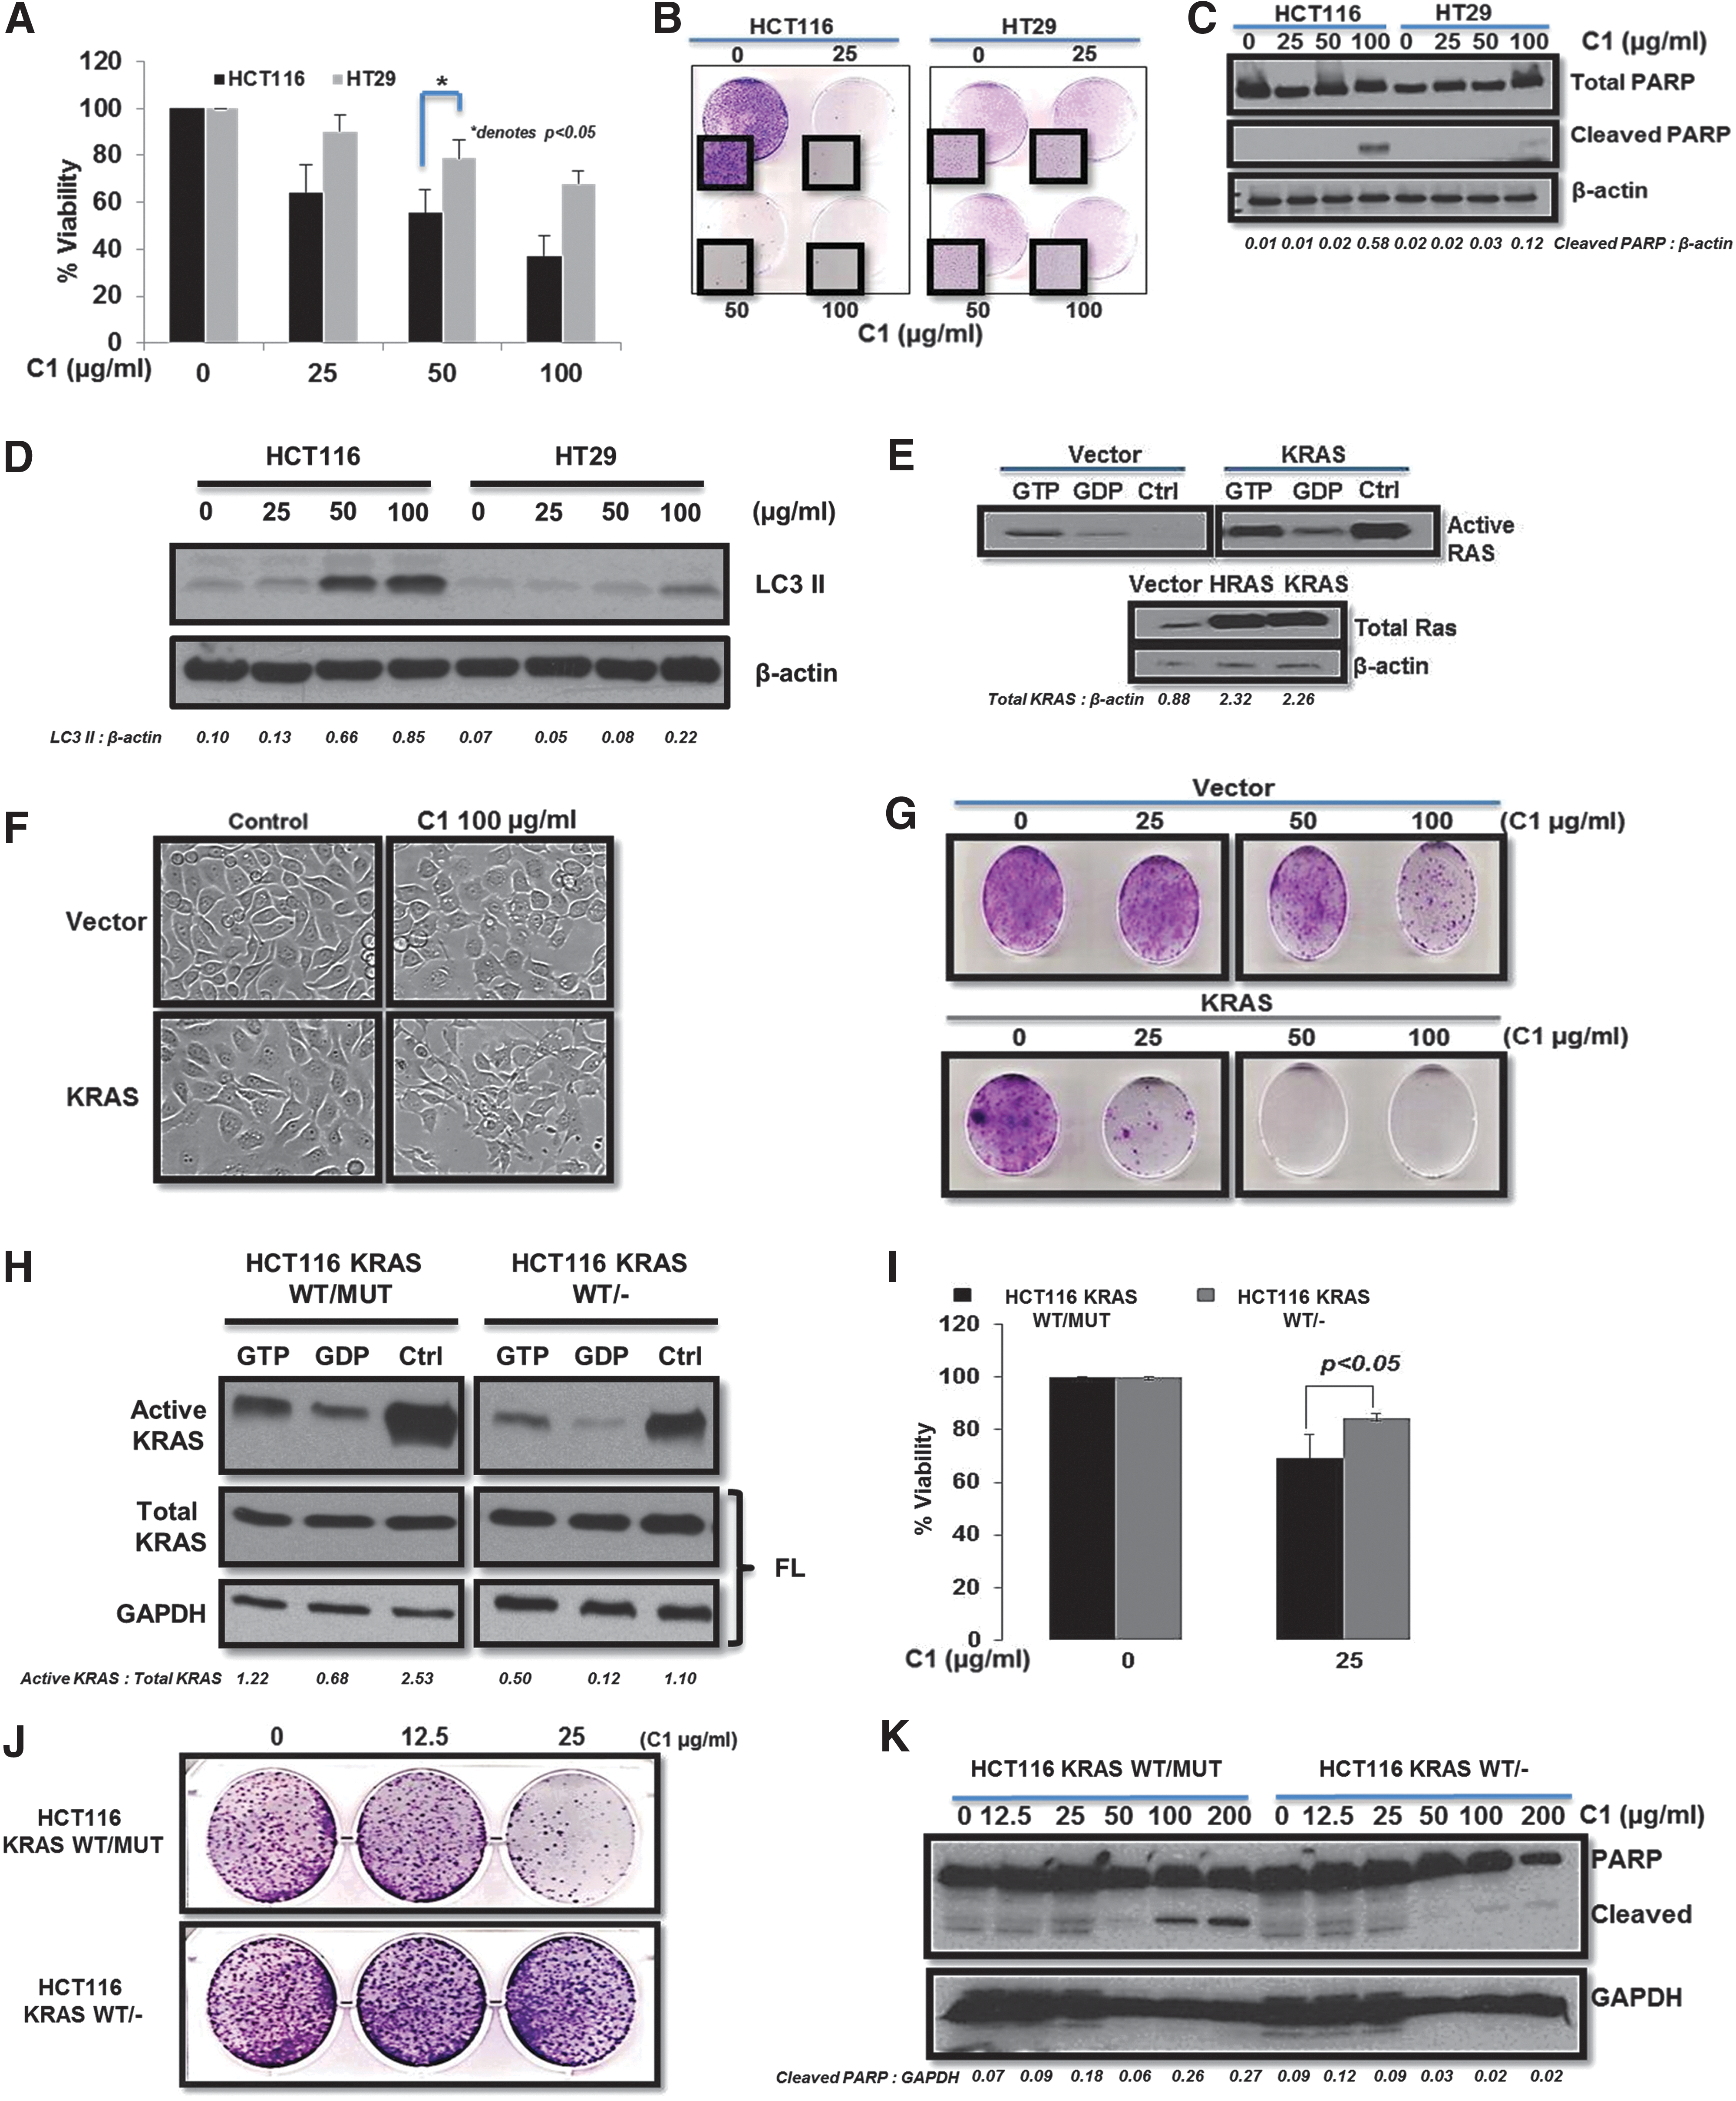
Our previous work showed that C1 treatment activates ERK and JNK, which are subsequently involved in the activation of cell death (33). In the present study, we postulated the involvement of upstream KRAS as a key factor in this mechanism. To verify our hypothesis, we first tested C1 in HCT116 known to harbor a mutant allele of KRAS (G13D) and in the HT29 that expresses WT KRAS. Assessment of cell viability using MTT assay as well as colony formation demonstrated that HCT116 cells were significantly more sensitive to C1 than HT29 cells (Fig. 1A, B). This response was confirmed by monitoring apoptotic and autophagic markers showing C1-induced PARP cleavage and LC3 II accumulation in a dose-dependent manner in HCT116, but not in HT29, cells (Fig. 1C, D). To confirm that this was not a cell line-specific effect, we made use of the normal prostate epithelial RWPE-1 cells stably transformed with active KRAS or PMN control vector (Fig. 1E). Interestingly, only cells transformed with active KRAS exhibited sensitivity to C1 (Fig. 1F, G). To further validate if mutant KRAS was a C1 target, isogenic HCT116 parental (HCT116 KRASWT/Mut) and mutant KRAS knockout (HCT116 KRASWT/−) cells were used (Fig. 1H). C1-induced loss of cell viability, inhibition of tumor colony-forming ability, and caspase 3-mediated cleavage of PARP were significantly blocked in HCT116 KRASWT/− cells (Fig. 1I–K), thereby indicating the critical role of mutant KRAS in C1-induced lethality. Due to the frequent association of KRAS mutations with pancreatic cancer, we employed pancreatic cancer cell lines, BxPC-3, PANC-1, and Mia-PACA 2. Confirming the previous results, only PANC-1 and Mia-PACA, two cells expressing mutant KRAS, were sensitive to C1 treatment (Supplementary Fig. S1A–C; Supplementary Data are available online at
Drug-induced hyperactivation of constitutively active mutant KRAS
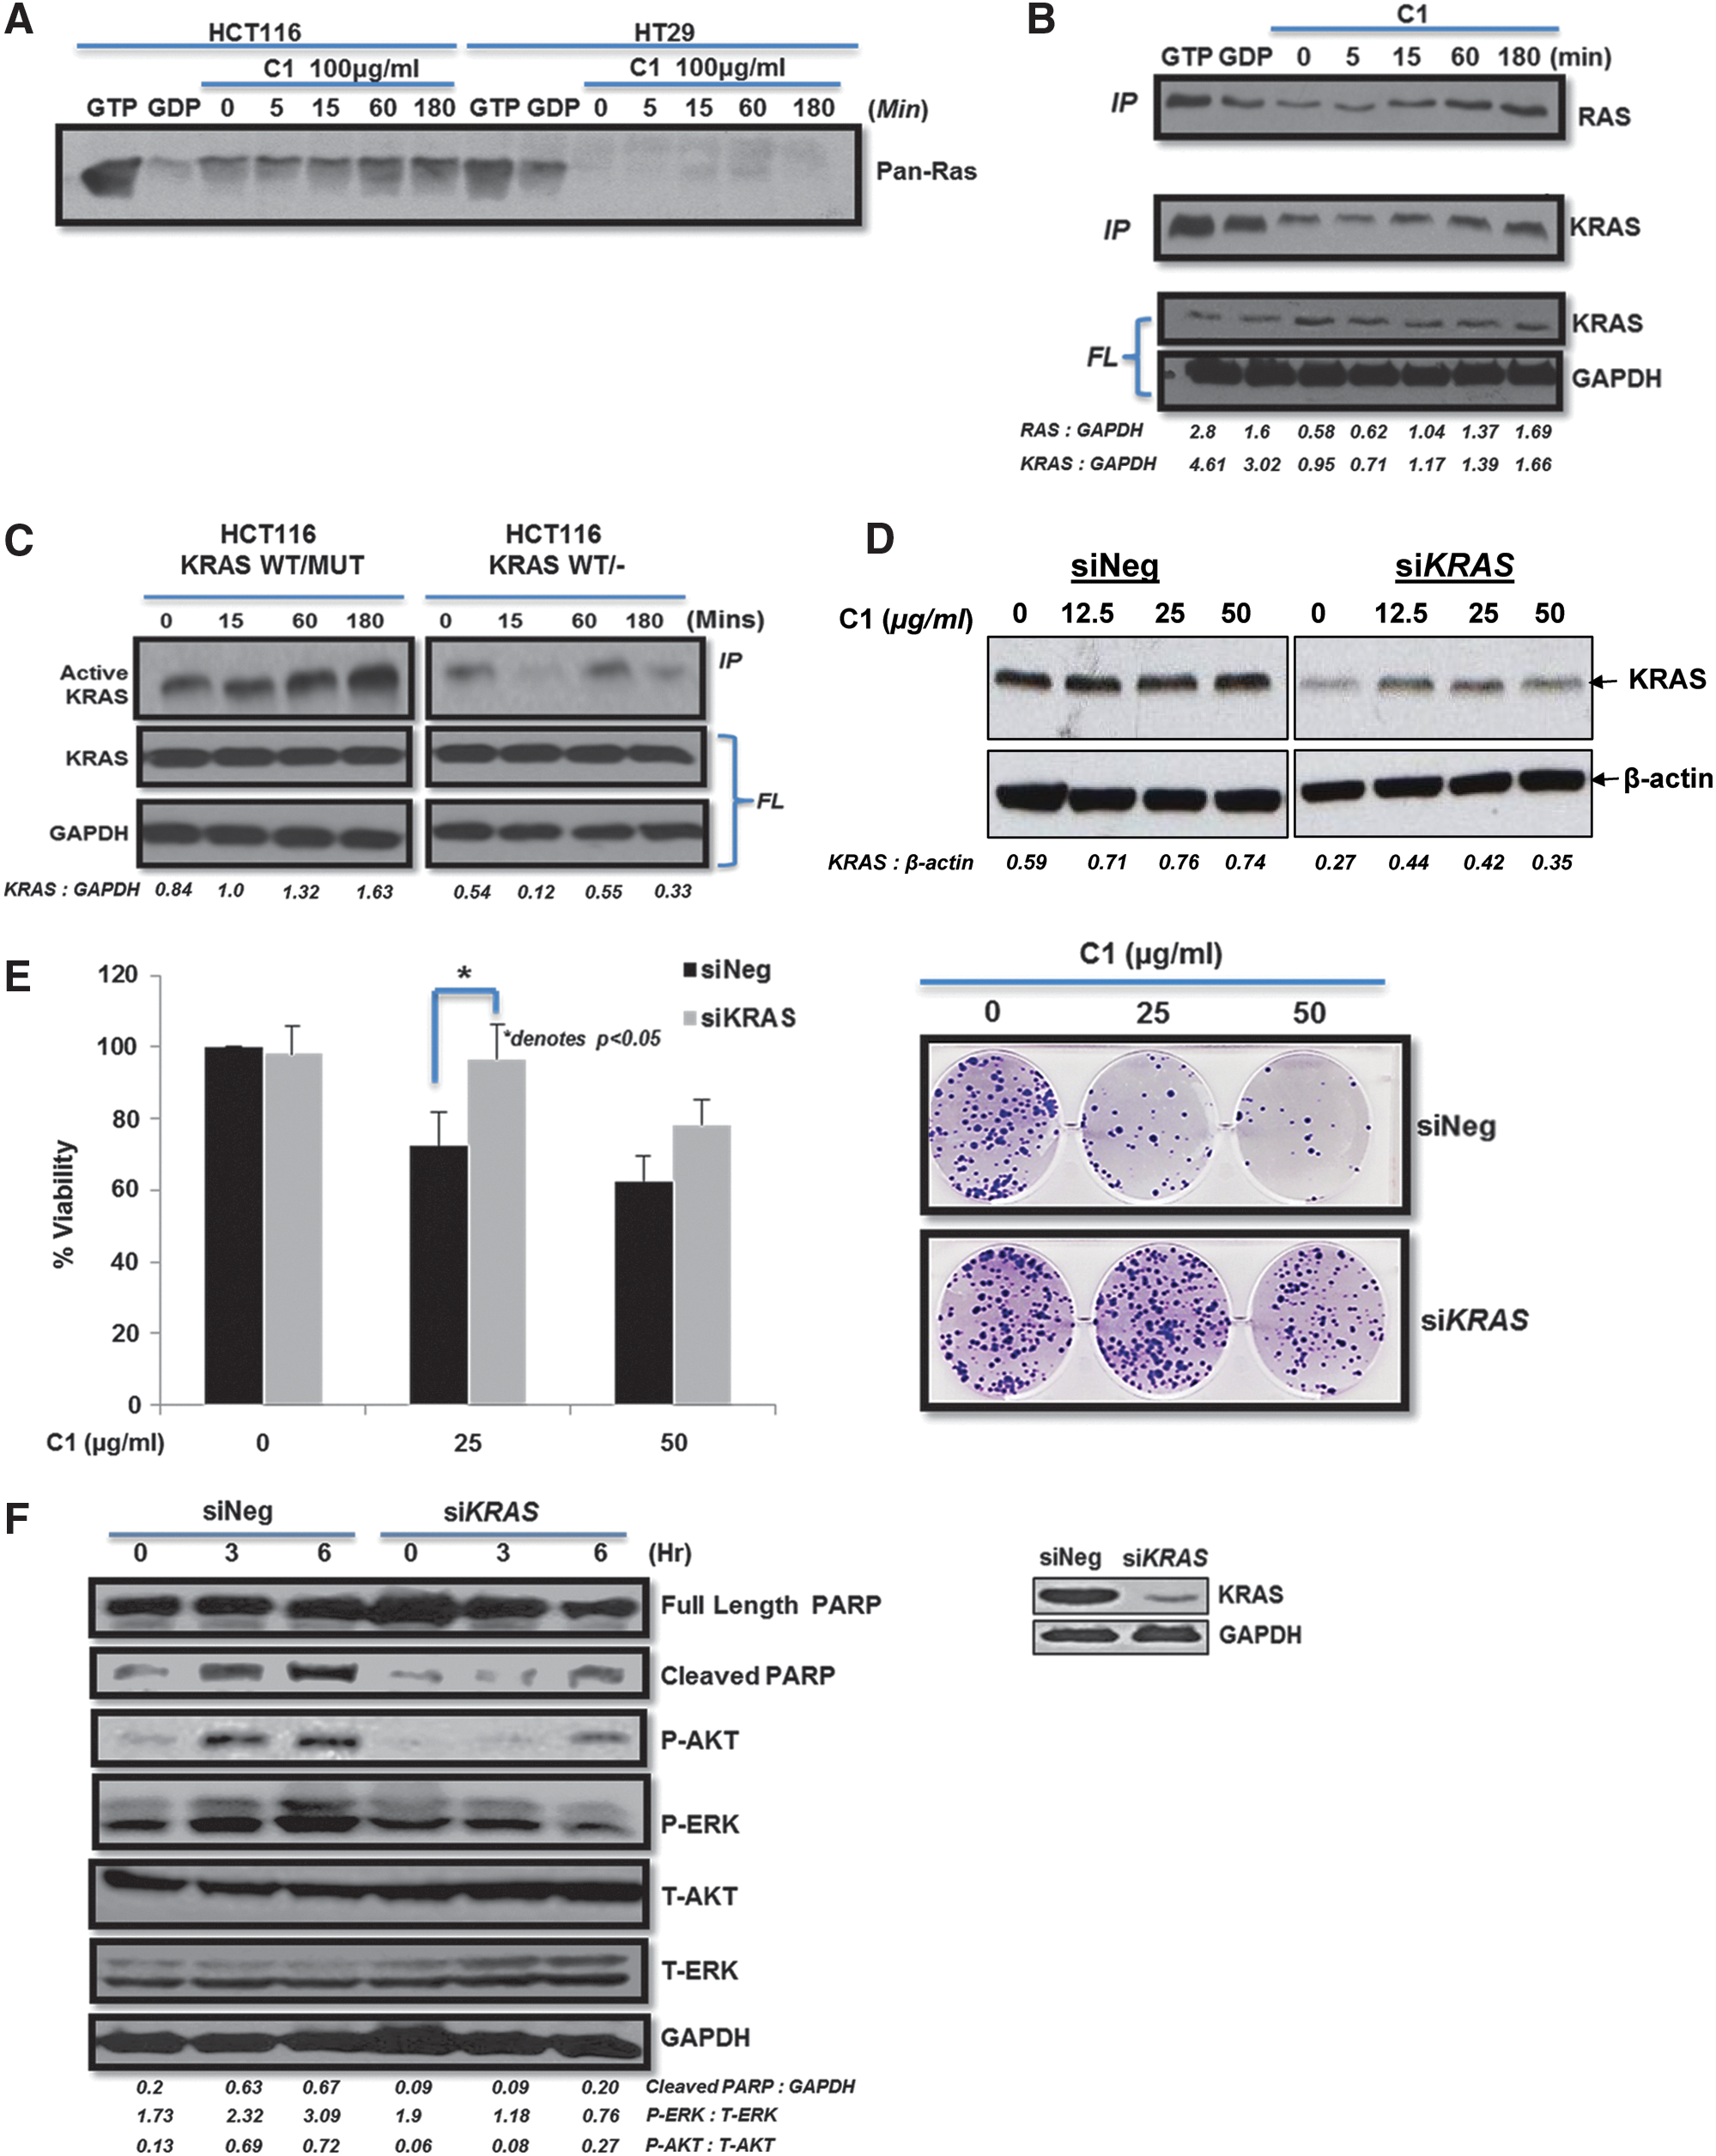
Intrigued by the selectivity toward mutant KRAS, we set out to investigate the effect of C1 on KRAS activity. Interestingly, C1 induced an increase in the pre-existing RAS activity in HCT116 cells, while no RAS activity was detected in HT29 cells expressing WT KRAS (Fig. 2A). Furthermore, this increase in total RAS activity was specifically linked to an increase in KRAS activity (Fig. 2B). Likewise, KRAS activity was significantly induced by C1 in HCT116 KRASWT/Mut cells, but not in the HCT116 KRASWT/− cells (Fig. 2C). Similar results were obtained in the pancreatic cancer cells, in which drug treatment resulted in an increase in KRAS activity only in PANC-1 cells (Supplementary Fig. S1D). Furthermore, silencing of KRAS in HCT116 (Fig. 2D) inhibited C1-induced cell death (Fig. 2E) and prevented ERK phosphorylation and PARP cleavage (Fig. 2F).
Active KRAS dependency of C1-induced ROS production
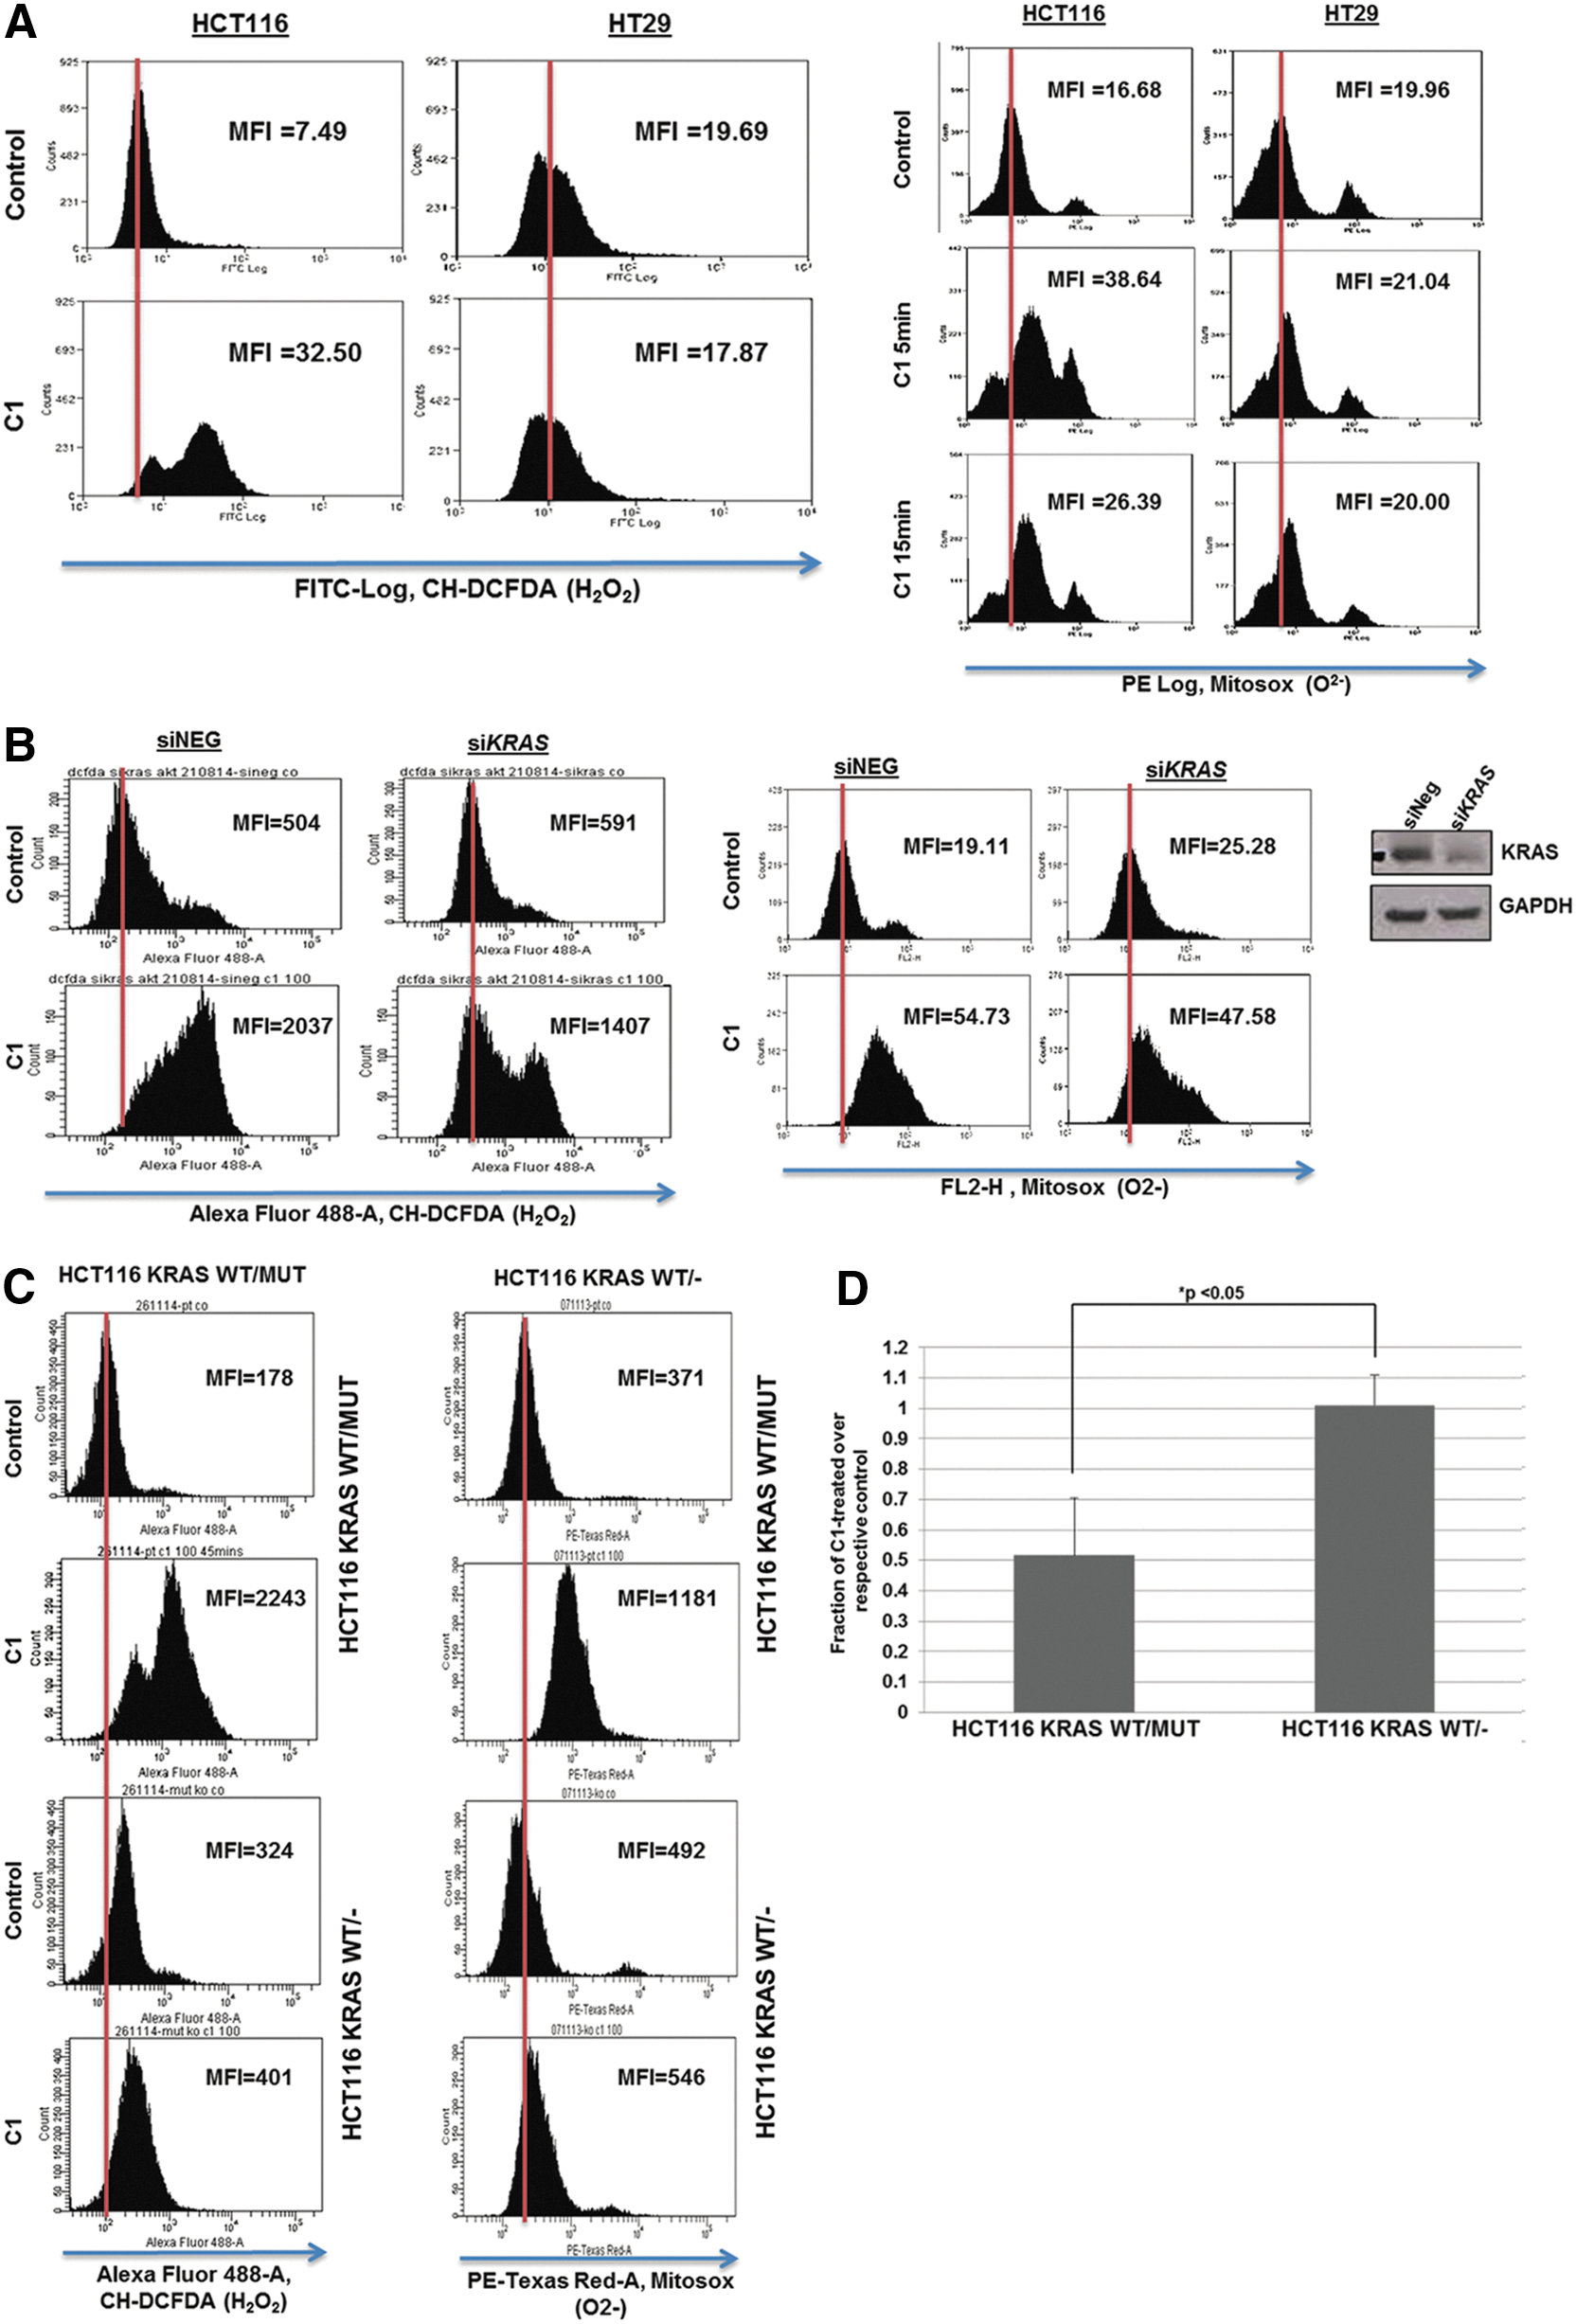
Given our earlier findings linking intracellular ROS to the antitumor activity of C1, we next questioned whether active KRAS served as the upstream signal. Corroborating the data presented above, a significant increase in H2O2 was observed in HCT116 KRASWT/Mut, but not in the WT KRAS-expressing HT29, cells (Fig. 3A, left panel). Furthermore, a significant increase in mitochondrial O2 − was detected in HCT116 KRASWT/Mut cells, while HT29 cells exhibited a much weaker response (Fig. 3A, right panel). Similarly, C1 induced a significant increase in DCF fluorescence in PANC-1, but not in BxPC-3, cells (Supplementary Fig. S1E). Of note, the use of ROS scavengers, NAC and catalase, blocked C1-induced H2O2 production (Supplementary Fig. S2A) and promoted cell survival (Supplementary Fig. S2B, C). Silencing of KRAS in HCT116 cells significantly compromised the effect of C1 on intracellular ROS production (Fig. 3B). The importance of the mutant KRAS allele in C1-induced ROS production was further corroborated by the absence of this response in HCT116 KRASWT/− cells (Fig. 3C). To understand the mechanism of the increase in ROS production, we measured the mitochondrial oxygen consumption rate in the isogenic cell lines following exposure to C1. Results indicate that C1 induced a decrease in oxygen consumption in HCT116 KRASWT/Mut cells, while no effect was observed in HCT116 KRASWT/− cells (Fig. 3D). The evidence implicating mitochondria, in part, in the antitumor activity of C1 is supported by our earlier findings and data demonstrating recruitment of Bax as well as RAS and p-AKT to the mitochondria-enriched heavy membrane fractions (Supplementary Fig. S3A) and loss of mitochondrial transmembrane potential (Supplementary Fig. S3B) in drug-treated cells. Moreover, HCT116 Bax/Bak DKO cells exhibited significant resistance to C1, suggesting a major role of Bak (Supplementary Fig. S3C–E). However, ROS production appears to be upstream of Bax/Bak in this model (Supplementary Fig. S3F, G).
While our current study focused on increased sensitivity of mutant KRAS-expressing cells to C1, preliminary results revealed a similar trend with other RAS isoforms. Exposure to C1 induced HRAS activity in HCT116 cells (Supplementary Fig. S4A), and HRAS-induced transformation of RWPE-1 prostate epithelial cells dramatically increased sensitivity to C1 (Supplementary Fig. S4B). Similarly, mutant HRAS (HRAS G12V)-expressing T24 bladder carcinoma as well as mutant NRAS-expressing HL60 leukemia cells (NRAS Q61L) exhibited sensitivity to C1 (Supplementary Fig. S4C–E), and drug-induced increase in intracellular ROS and drop in mitochondrial transmembrane potential in HL60 cells (Supplementary Fig. S4F, G) provide testimony to a similar mechanism of lethality to that associated with mutant KRAS.
Mutant KRAS-dependent Akt activation is a critical step in C1-induced cell death
Besides the canonical targets of KRAS, that is, RAF/MEK/ERK, the PI3K/AKT pathway has been shown as a target of KRAS. Of note, Akt/PKB activation has been linked to intracellular ROS accumulation via its inhibitory effect on FoxO3a. In the light of mutant KRAS-specific ROS production by C1 and intrigued by the localization of RAS and p-AKT (ser473) to the mitochondria, we hypothesized that active KRAS-induced ROS production might involve AKT/PKB. Indeed, a time-dependent increase in AKT Ser473 phosphorylation was observed in C1-treated HCT116 cells, together with a concomitant increase in FoxO3a phosphorylation (Fig. 4A). Preincubation of cells with the PI3K inhibitor, LY290042, not only blocked AKT phosphorylation but also neutralized the effect of C1 on cell viability and caspase 3 activation (Fig. 4B–D). Furthermore, C1-induced cell death was significantly blocked by pharmacological inhibition of AKT with AKT VIII inhibitor (Supplementary Fig. S5A). Similarly, gene knockdown of AKT not only rendered cells refractory to C1 (Fig. 4E) but also prevented FoxO3a (Fig. 4F) and ERK phosphorylation (Supplementary Fig. S5B). In addition, C1 failed to induce Akt phosphorylation in HT29 cells that do not express mutant KRAS as well as in HCT116KRASWT/− cells (Fig. 4G, H). Moreover, gene knockout of Akt1/Akt2 in HCT116 cells rendered cells refractory to C1 as shown by the MTT assay, colony formation, and three-dimensional (3D) culture assays (Fig. 4I). To further support these data, we employed two cell lines displaying high or low AKT activity: LNCAP cells harboring PTEN mutation (high level of AKT activity) and DU145 cells in which PTEN is not affected (low AKT activity); both cell lines have been shown to display increased KRAS activity (24, 32). Results showed that a constitutive high AKT activity increased the sensitivity to C1 (Supplementary Fig. S6A–D). Notably, the effect of C1 on FoxO3a target antioxidant protein, sestrin, was blocked in HCT116KRASWT/− cells (Supplementary Fig. S5C), thereby indicating that AKT phosphorylation and inhibition of FoxO3a were downstream of mutant KRAS in this model.

AKT is a central modulator of ROS production induced by C1
We questioned whether AKT phosphorylation functioned upstream of C1-induced ROS production. Indeed, preincubation with LY290042 inhibited the effect of C1 on intracellular ROS production (Fig. 5A). To validate these data, silencing of AKT1 or AKT2 or both was performed. siAKT2 transfection resulted in a more pronounced effect on the sustained increase in ROS (1 and 3 h) triggered by C1 than siAKT1; however, simultaneous silencing of AKT1 and AKT2 virtually completely inhibited H2O2-inducing activity of C1 (Fig. 5B). A similar effect was observed on mitochondrial O2 − production; siAKT1&2 restored O2 − levels to normal at 1 h compared with the negative control small interfering RNA (siRNA) (Fig. 5C). Next, we transiently overexpressed AKT1 and monitored H2O2 production by C1. While ROS levels decreased 1 and 3 h after C1 exposure in cells transfected with the control vector, AKT overexpression allowed for a sustained increase in intracellular H2O2 (Fig. 5D). The effect of AKT on ROS production was also validated in HCT116 AKT1/2 KO cells (Fig. 5E). Furthermore, silencing of AKT1/2 in HCT116 prevented the reduction in mitochondrial oxygen consumption by C1, similarly to KRAS KO (Fig. 5F), thereby indicating the involvement of AKT in C1-induced changes in mitochondrial function. Finally, the importance of AKT activity in this model was further addressed by comparing the response of LNCAP against DU145 cells. Indeed, C1 induced a significant increase in ROS in LNCAP cells, but not in DU145 cells (Supplementary Fig. S6E). Taken together, these results demonstrate that AKT activation by C1 is a critical step in drug-induced sustained increase in intracellular ROS.

C1 significantly impairs in vivo tumor growth in a xenograft model and in 3D spheroid cultures
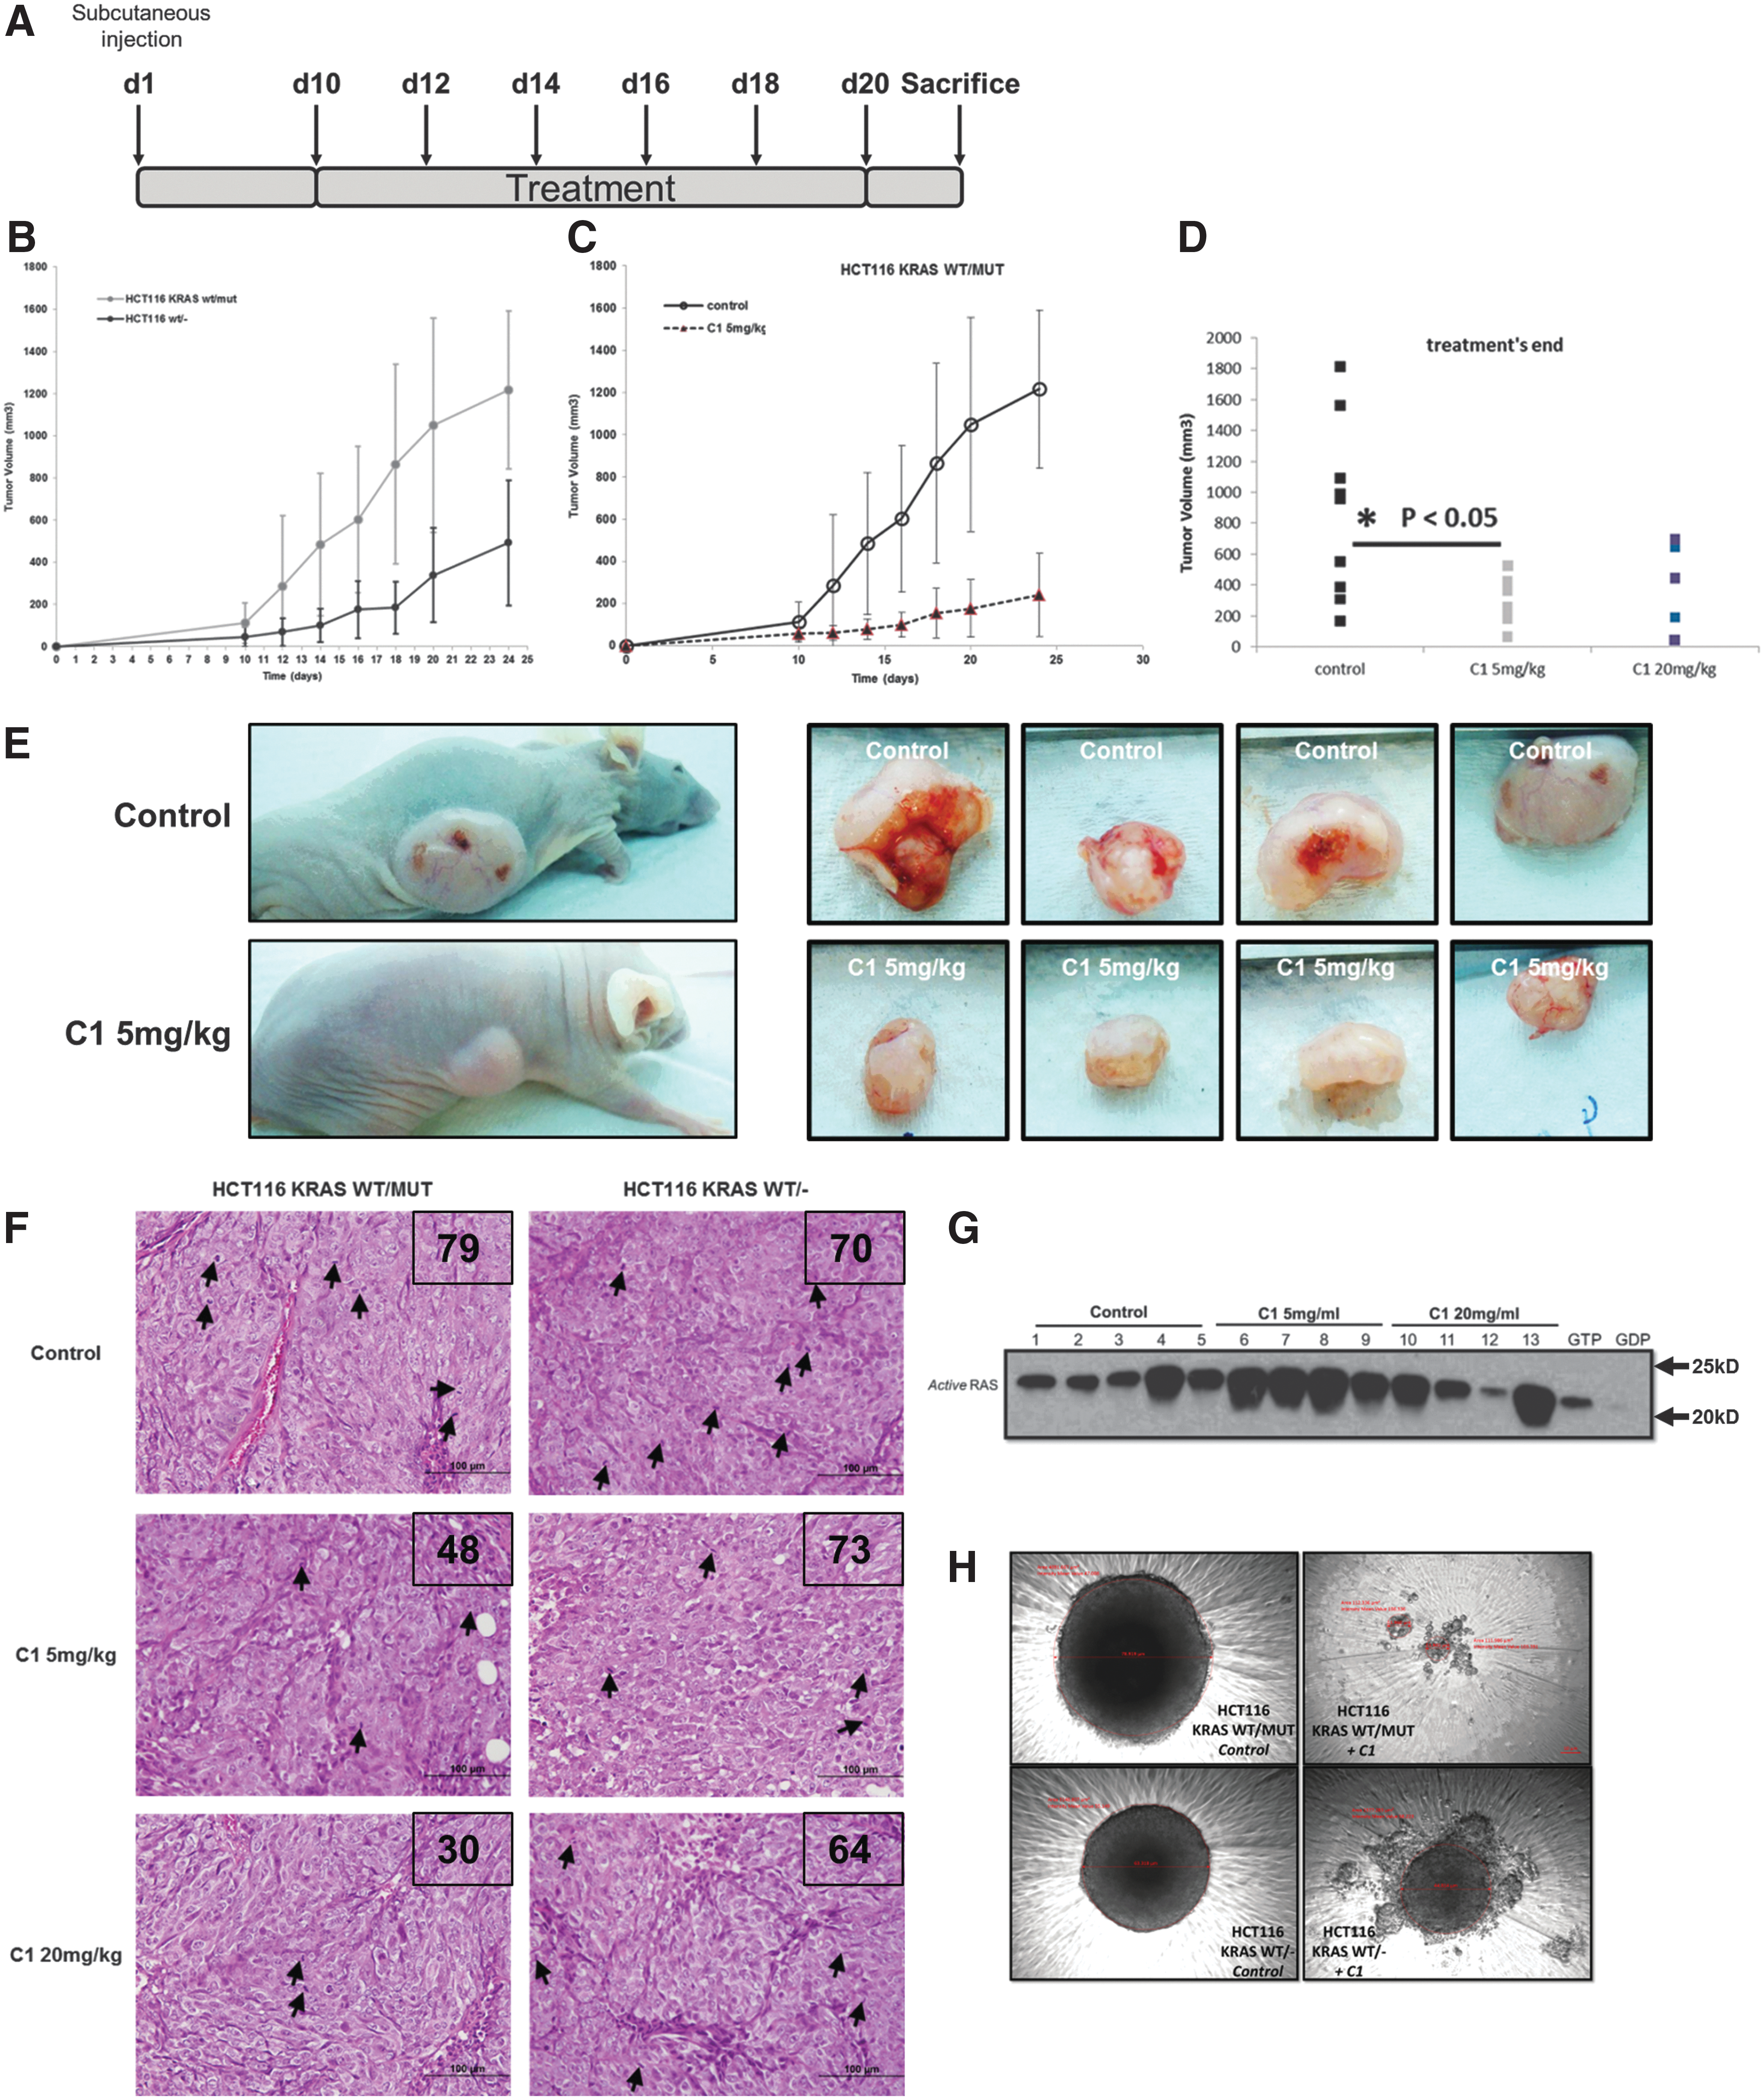
To further investigate the efficacy of C1 in vivo, a tumor xenograft model using the isogenic HCT116 cell lines was performed in nude mice (Fig. 6A). A striking difference was observed between the growth rates of the tumors generated with the parental HCT116 cells carrying the mutant KRAS allele versus the mutant KRAS KO cells (Fig. 6B). This confirms the crucial importance of mutant KRAS in the tumorigenic potential of this cell line. It is noteworthy that a strong growth inhibitory effect was observed following 10 days of treatment with a relatively low dose of 5 mg/kg of C1 (Fig. 6C–E), suggesting good therapeutic potential. In addition, hematoxylin and eosin (H&E) staining performed on the collected tumors revealed the ability of C1 to affect the mitotic index of the tumors harboring mutant KRAS (Fig. 6F). More importantly, Western blot analysis of lysates from xenografted tumors before and after drug treatment revealed significant induction of KRAS activity by C1 (Fig. 6G). We also made use of the 3D spheroid formation system to corroborate the in vitro and in vivo activity of C1. Indeed, C1 treatment virtually completely inhibited spheroid formation in mutant KRAS-expressing HCT116 cells, whereas deletion of the mutant allele (KO cells) retained the ability to form spheroids (Fig. 6H). Interestingly, a similar inhibitory effect on cell death was obtained in HCT116 KRAS−/MUT cells in which the WT KRAS allele had been deleted (Supplementary Fig. S7A–C). In addition, while the increase in intracellular O2 − was not compromised (Supplementary Fig. S7D), the absence of the WT allele significantly reduced drug-induced H2O2 generation (Supplementary Fig. S7E). Collectively, while these data indicate increased sensitivity of mutant KRAS-expressing cells and the ability of the drug to specifically activate mutant KRAS, the WT KRAS allele is not completely dispensable for C1-induced lethality.
Discussion
Mutant KRAS activation drives oxidative stress-induced execution of cancer cells
Current strategies against cancers carrying mutated KRAS involve agents that target pathways downstream of RAS. Only a handful of investigations have been successful in identifying molecules with direct effects on mutant KRAS using an approach targeting the SOS-mediated nucleotide exchange (5, 26, 29). Similarly, recent discoveries have identified small-molecule inducers of oxidative stress such as erastin, which exerts its tumoricidal effect by targeting the mitochondrial protein VDAC, downstream of the canonical RAS–RAF–MEK signaling axis (9, 27, 35, 36). Efforts have also been geared at unraveling synthetic lethality in oncogenic KRAS-expressing cells. In this regard, Steckel et al. reported that oncogenic KRAS-expressing cells displayed synthetic lethality toward topoisomerase inhibition (28), and another study identified a synthetic lethal interaction between oncogenic KRAS and the cell cycle regulator, CDK4, in nonsmall-cell lung carcinoma (18).
In this study, we present evidence that a small molecule previously shown to induce ROS-dependent autophagy-associated apoptosis in a variety of human cancers (33) selectively targets cancer cells carrying mutant KRAS. Interestingly, C1 triggers specific activation of mutant KRAS, but not WT KRAS, which leads to increased intracellular ROS production. Of note, KRAS-dependent ROS production involves the intermediacy of active AKT/PKB as pharmacological inhibition or gene silencing of AKT isoforms rescued KRAS mutant cells from C1-induced cell death (Fig. 7). These findings are corroborated by in vivo efficacy of the compound as well as its ability to inhibit 3D spheroid formation in cancer cells harboring mutant KRAS. As GTPases such as RAS are known to localize to membrane lipid structures, our preliminary results demonstrating changes in the recruitment of proteins such as KRAS to lipid raft domains (unpublished results) within the plasma membrane could provide clues into the mechanism of mutant KRAS-mediated ROS production. While we focused on mutant KRAS phenotype for this study, preliminary results indicate that C1 appears to target NRAS and HRAS mutant phenotypes as well (Supplementary Fig. S4). This would mean that C1 targets the Ras family and would broaden its range of activity.

Despite the remarkable selectivity in its ability to trigger activation of only mutant KRAS, the presence of the heterozygous genotype (RASWT/Mut ) appears to significantly enhance the synthetic lethal effect of C1 compared with either the homozygous genotypes RASWT/WT or RASMut/Mut . These data suggest that the WT allele may not be completely dispensable in the antitumor activity of C1; however, the cross talk between the WT and Mutant allele, as well as the contribution of the WT allele in drug lethality, remains to be elucidated.
Akt activation sustains high intracellular ROS and facilitates redox-dependent lethality
Previous reports have shown that activation of KRAS or other RAS family small GTPase members results in an increase in ROS production, notably through targeting the mitochondria and its electron transport chain (6, 12, 16, 34). Similar effects of active AKT on intracellular ROS production have been reported (7, 22). Interestingly, while the initial burst of C1-induced ROS is dependent on mutant KRAS hyperactivation, AKT activation seems to be required for the maintenance of high ROS levels. The latter is confirmed upon transient overexpression of AKT in HCT116 cells. Corroborating this, while silencing of KRAS abrogated ROS production, gene knockdown of AKT had a more pronounced effect on the second phase of sustained intracellular ROS. These results may suggest more than a simple upstream/downstream relationship between KRAS and AKT regarding C1-induced ROS production. Of note, KRAS-dependent ROS generation appeared to be the result of mitochondrial targeting as revealed by MitoSox staining, which showed an early increase in mitochondrial O2 −. This is consistent with a previous report by Hu et al. showing that KRAS stimulated ROS production by promoting mitochondrial dysfunction (11).
Whereas earlier reports have highlighted hyperphosphorylation of AKT as a stimulus for intracellular ROS accumulation, our results indicate that S473 phosphorylation appears necessary to drive C1-induced KRAS-dependent increase in mitochondrial ROS. It is also intriguing that KRAS and p-AKT are recruited to the mitochondria upon C1 exposure, which implies that the two proteins function in tandem to trigger changes in mitochondrial redox metabolism. Together with the involvement of Bax/Bak, which appears downstream of ROS production in this model, the results suggest a critical role of mitochondria in mutant KRAS-driven execution.
The sustained increase in ROS by C1 could be a function of AKT-mediated inactivation of FoxO3a, a transcription factor responsible for regulating expression of antioxidant factors (14, 30). Phosphorylation of FoxO3a by AKT inhibits its transcriptional activity and sensitizes cells to cell death by downregulation of antioxidant proteins, sestrin and catalase (8, 22). The requirement of active AKT in maintaining a sustained increase in intracellular ROS upon exposure to C1 could also be a mechanism of counteracting the effect of active JNK on FoxO3a (30); we previously showed that C1 triggered activation of JNK (33). On the other hand, AKT has also been shown to stimulate mitochondrial oxidative metabolism and promote mitochondrial ROS formation (23). Interestingly, silencing of mutant KRAS or AKT prevented the decrease in mitochondrial oxygen consumption induced by C1, which could also be a trigger for mitochondrial ROS production (20, 31). It is highly plausible that both these mechanisms of AKT-mediated ROS accumulation are engaged in cells upon C1-induced activation of mutant KRAS. Further investigations into the mechanism of ROS production and downstream targets such as MnSOD, which is significantly upregulated in mutant KRAS-expressing cells upon drug treatment (Supplementary Fig. S5C), may provide further insight into the antitumor activity of this small-molecule compound (3, 10, 13, 21, 38). In addition, our preliminary findings suggesting rearrangement of proteins, such as KRAS, in cholesterol-rich lipid raft subdomains of the plasma membrane might be equally relevant given the lipophilic nature of the small molecule.
In conclusion, the present study demonstrates that the small molecule, C1, targets cancer cells expressing mutant KRAS via inducing RAS activity and triggering AKT-dependent redox catastrophe, leading to tumor cell execution. It is noteworthy that the lethality does not appear exclusive to mutant KRAS as a similar effect, although in a preliminary analysis, on other mutant RAS isoforms was observed. Given the high incidence of RAS mutations in a host of human cancers, the ability of this small-molecule compound to target mutant RAS isoforms could have tremendous therapeutic potential against a wide range of malignancies.
Materials and Methods
Synthesis and analysis of the small-molecule compound, C1
The small compound, 1,3-dibutyl-2-thiooxo-imidazolidine-4,5-dione, herein referred to as C1, was synthesized as previously published (33). Oxalyl chloride was added to 1,3-dibutyl-2-thiourea (10 mM) in anhydrous ether in a round bottom flask. The reaction mixture was stirred for 1–2 h at ambient temperature and then poured into saturated NaHCO3. The product was extracted with 3× ethyl acetate. The ethyl acetate layer was then washed with distilled water and then brine water. Ethyl acetate was then dried with anhydrous Mg2SO4 and removed under reduced pressure. The purification through flash chromatography (ethyl acetate:hexane) afforded the yellow oil product. The oily product was solidified in a refrigerator. The compound was then analyzed by 1HNMR, 13C NMR, and MS and results are presented as follows: Name: 1,3-dibutyl-2-thiooxo-imidazolidine-4,5-dione; Color: Orange; FT-IR (in CH2Cl2): 2875–2960 cm (Aliphatic CH), 1770 (C = O), 1410 (C = S); 1HNMR (in CDCL3): δ = 0.95 9 (t, J = 7.3 Hz, 6H, 4′-CH3), 1.34 (sext, J = 7.7 Hz, 4H, 3′-CH2), 1.67 (quint, J = 7.2 Hz, 4H, 2-CH2) 3.93 (t, J = 7.5 Hz, 4H, 1′-CH2); 13C NMR (in CHCl3): δ = 13.54 (C4′), 19.90 (C-3′), 29.72 (C-2′), 41.83 (C-1′), 155.35 (C-4.5), 180.63 (C-2); Mass m/z (%): 242(100) [M+], 209(26) [M+ -HS], 187(22); MF C11H18N2O2S calculated 242.34, Found 243.34. Yield: 95%.
Cell culture
HCT116 (generously provided by Dr. Bert Vogelstein, The Johns Hopkins University School of Medicine, Baltimore, MD) and HT29 (ATCC®, Manassas, VA) colorectal carcinoma cell lines were maintained in McCoy 5A (Gibco; Invitrogen Corporation, Carlsbad, CA). X-MAN™ Mutant KRAS KO and parental HCT116 cells (Horizon Discovery Ltd., Cambridge, United Kingdom) were cultured in RPMI supplemented with 25 mM NaHCO3 (Sigma-Aldrich, St. Louis, MO). All previously mentioned cell lines were supplemented with 10% fetal bovine serum, 1%
Reagents and chemicals
Crystal violet and MTT [3-(4,5-dimethylthiazolyl-2)-2,5-diphenyltetrazolium bromide] were purchased from Sigma-Aldrich. LY290042 and AKT VIII inhibitor were purchased from Calbiochem (Merck KGaA, Darmstadt, Germany). 5-(and-6)-Chloromethyl-2-, 7-dichlorofluorescin diacetate (Carboxy-DCFDA) and MitoSox™ (Mitochondrial Superoxide Indicator) were obtained from Molecular Probes (Life Technologies, Carlsbad, CA).
Plasmids and siRNAs
siRNAs against KRAS, AKT1 and AKT2, ERK were obtained from Dharmacon, Inc. (Thermo Fisher Scientific, Inc.). The plasmids, pcDNA3-flag-HA and pcDNA3-flag-HA-AKT1, were purchased from Addgene (Cambridge, MA).
MTT and colony formation assays
Cell viability following drug exposure was determined using MTT assay as previously described (33). For colony-forming assays, 4000–6000 cells were plated in six-well plates and grown for 2 weeks. The plates were then stained with crystal violet solution (Sigma-Aldrich).
Western blotting
Western blot analysis was performed as described previously (33). Membranes were blotted using specific primary antibodies for LC3 II, β-actin, GAPDH (Santa Cruz Biotechnology, Dallas, TX), p-AKT(S473), p-ERK, p-FOXO3A, total AKT, total ERK, total FoxO3A, PARP (Cell Signaling Technology, Danvers, MA), Caspase 3, Ras (Merck Millipore, Billerica, MA), and KRAS (Abcam, Cambridge, United Kingdom) and respective secondary antibodies conjugated with horseradish peroxidase (Thermo Scientific Pierce, Rockford, IL). Signal was developed using WEST PICO chemiluminescence substrate (Thermo Scientific Pierce).
Flow cytometric analysis of Intracellular ROS
For determination of intracellular H2O2, cells were loaded with 5 μM of the redox-sensitive dye, Carboxy-DCFDA, at 37°C for 15 min. For detection of intramitochondrial O2 −, cells were loaded with MitoSox at 37°C for 15 min. Analysis of at least 10,000 events was performed using an EPICS Elite ESP flow cytometer (Beckman Coulter, Brea, CA) with excitation/emission wavelengths of 488/525 nm for Carboxy-DCFDA and 590/619 nm for MitoSox, respectively.
Oxygen consumption measurement
Oxygen consumption in HCT116 cells was measured by the XFe24 Analyzer (Seahorse Bioscience, Billerica, MA) according to the manufacturer's instructions. Readings (pmol O2/min) were obtained and simultaneously analyzed in XFe Wave software. Results were then calculated and presented as the fraction of treated over control cells.
RAS activity assay
HCT116 cells were plated in 100-mm Petri dishes and incubated with C1 for 5 min to 3 h, washed with phosphate-buffered saline (PBS), and scraped in 1× MLB Buffer (Merck Millipore). Lysates were immediately snap-frozen and spun down at 14,000 g for 10 min at 4°C. Immunoprecipitation of active KRAS in samples and controls was performed using Raf-1 Ras Binding Domain agarose beads (Merck Millipore) according to the manufacturer's instruction.
Subcutaneous implantation of HCT116 parent and HCT116 KRAS knockout cells
Cell suspensions with >90% viability were used for the injections (2 × 10⁶ s.c. cells in 100 μL sterile PBS) into the right flank of 4-week-old male BALB/c nude mice (BioLASCO). The mice were randomized into three groups: vehicle control (1% dimethyl sulfoxide), 5, and 20 mg/kg of drug C1. Vehicle or drug was given thrice per week for 2 weeks; body weight and tumor size were measured and recorded at the same time.
H&E staining
H&E staining and analysis were performed by the Histopathology facility of the Institute of Molecular and Cell Biology (A*STAR, Singapore, Singapore). Briefly, tissue samples were paraffin embedded, sectioned at 5 μm, and routinely stained with H&E using Leica Autostainer XL. Mitotic index was evaluated using 10 different fields at high magnification for each condition.
3D spheroid formation
Cells were treated with C1 50 μg/ml for 18 h before being replated (2000 cells) onto Corning® Ultra-Low Attachment plates and grown for six supplementary days to allow spheroid formation. Cells were observed under the Carl Zeiss Axio Vert.A1 Inverted Microscope (Carl Zeiss Microscopy, Thornwood, NY) at 40× magnification.
Number of experiments and statistical analysis
Western blots, flow cytometry, and other assays have all been performed at least thrice unless specified otherwise. A two-tailed t-test was used to validate the significance of the results.
Footnotes
Acknowledgments
The authors would like to thank Dr. Wee Zhen Ning of Genome Institute of Singapore, A*STAR, for generating the RWPE-1 prostate cells. The authors are also grateful to Dr. Jayshree Hirpara from Cancer Science Institute, NUHS, Singapore, and Mr. Owen Png Ziyun. This work is supported by a grant to S.P. from the Experimental Therapeutics Program within the Cancer Science Institute (CSI), National University of Singapore, Singapore.
Author Disclosure Statement
No competing financial interests exist.
Abbreviations Used
References
Supplementary Material
Please find the following supplemental material available below.
For Open Access articles published under a Creative Commons License, all supplemental material carries the same license as the article it is associated with.
For non-Open Access articles published, all supplemental material carries a non-exclusive license, and permission requests for re-use of supplemental material or any part of supplemental material shall be sent directly to the copyright owner as specified in the copyright notice associated with the article.
