




Abstract
Since type 2 diabetes (T2D) is associated with oxidative stress and metformin has been shown to exert a protective role against the said stress, we wondered whether metformin treatment might also modulate endoplasmic reticulum (ER) stress and autophagy in leukocytes of T2D patients. We studied 53 T2D patients (37 of whom had been treated with metformin 1700 mg for at least 1 year) and 30 healthy volunteers. Leukocytes from both groups of T2D patients exhibited increased protein levels of 78-kDa glucose-regulated protein (GRP78) with respect to controls, whereas activating transcription factor 6 (ATF6) was enhanced specifically in nonmetformin-treated T2D, and (s-xbp1) and phosphorylated eukaryotic initiation factor 2α (p-eIF2α) increased only in the metformin-treated group. The autophagy markers beclin1 (becn1), autophagy-related 7 (atg7), and microtubule-associated protein 1A/1B-light chain 3II/I (LC3 II/I) increased in nonmetformin-treated T2D, and metformin treatment reduced mitochondrial superoxide and increased glutathione (GSH) levels. Our observations raise the question of whether metformin treatment could reduce oxidative stress and act as an ER stress modulator in T2D patients by promoting an adaptive unfolded protein response (s-xbp1 and p-eIF2α) in their leukocytes; this was in contrast with nonmetformin-treated patients whose response could be driven by the ATF6-dependent pro-apoptotic pathway. Further, our findings lead to us to form the hypothesis of an autophagy-dependent clearance of misfolded proteins in nonmetformin-treated T2D patients that could be repressed by metformin treatment.—Antioxid. Redox Signal. 28, 1562–1569.
Introduction
T
T2D has been widely associated with oxidative stress (4), endoplasmic reticulum (ER) stress (7), and autophagy (8), mechanisms that may contribute to its pathogenesis.
Metformin treatment is believed to reduce oxidative stress; nevertheless, the impact of this drug on endoplasmic reticulum stress and autophagy in leukocytes under type 2 diabetes (T2D) conditions has not yet been studied. This work not only confirms the antioxidant effects of metformin but also suggests that it is a potential modulator of unfolded protein response (UPR) and autophagy that drives T2D leukocytes to activate the adaptive spliced X-box binding protein 1 (s-XBP1)- and phosphorylated eukaryotic initiation factor 2α (p-eIF2α)-dependent UPR branches. On the contrary, in non-metformin patients, the apoptotic activating transcription factor 6 (ATF6)-dependent pathway seems to be activated together with an autophagy-dependent clearance of misfolded proteins.
The ER is a crucial system for protein synthesis and sensing stress; in fact, it initiates the unfolded protein response (UPR) when unfolded or misfolded proteins accumulate in the cell. Three different signaling pathways can be triggered under ER stress conditions: protein kinase RNA-like ER kinase (PERK), inositol-requiring enzyme 1 (IRE1), and activating transcription factor 6 (ATF6). Seventy-eight-kDa glucose-regulated protein (GRP78) is a chaperone protein that acts as an ER stress sensor and controls the activation of UPR signaling through the three UPR transducers (PERK, IRE1, and ATF6) (3). The UPR is triggered in three ways: (a) through phosphorylation of the eukaryotic initiation factor 2α (eIF2α) by PERK, which leads to attenuation of protein translation; (b) through the splicing of X-box-binding protein 1 (XBP1) messenger ribonucleic acid (mRNA) by IRE1; and (c) through translocation of active ATF6 to the nucleus, which promotes the expression of UPR-related genes and of the proapoptotic CCAAT-enhancer-binding protein homologous protein, CHOP, under chronic stress conditions (5). Nevertheless, during severe ER stress conditions, diverse autophagy genes are induced by the UPR (2). Autophagy is the process by which unnecessary or damaged organelles and aggregated proteins are degraded. Regulation of autophagy involves proteins such as the microtubule-associated protein 1A/1B-light chain 3 (LC3), Beclin1 (BECN1), and autophagy-related 7 (ATG7). Although autophagy is an essential process for normal cell development and survival during starvation conditions, it can lead to pathological conditions when excessive.
In previous studies, our group has highlighted an induction of ER stress and autophagy in the leukocytes of T2D patients (7, 8). Further, we have demonstrated that metformin exerts beneficial effects by protecting T2D leukocytes from oxidative stress and leukocyte-endothelium interactions (4). However, the effect of metformin treatment on ER stress and autophagy has not yet been explored.
In light of the aforementioned evidence, we wondered whether metformin treatment might modulate ER stress, autophagy, and oxidative stress in peripheral blood mononuclear cells (PBMCs) of T2D patients. Therefore, we evaluated the expression levels of the principal ER and autophagy markers, as well as some oxidative stress parameters, in PBMCs of metformin- and nonmetformin-treated T2D subjects.
Results
Anthropometric and metabolic characteristics
Our cohort was composed of 53 T2D patients (16 of whom were not treated with metformin and 37 of whom received it as the main antidiabetic drug) and 30 healthy subjects whose anthropometrical and metabolic parameters are shown in Table 1. The three groups presented similar age and gender percentage. T2D patients presented higher weight (p < 0.01 in the group without metformin, and p < 0.001 in those with metformin), body mass index (BMI, p < 0.001), waist circumference (p < 0.001), and systolic blood pressure (SBP, p < 0.05) than control subjects. Glucose metabolism parameters were higher in T2D patients than in control subjects; that is, fasting glucose (p < 0.001), fasting insulin (p < 0.01 in metformin-treated patients), homeostasis model assessment of insulin resistance (HOMA-IR, p < 0.05 in patients without metformin and p < 0.001 in the metformin-treated group), and glycated hemoglobin (HbA1c, p < 0.001). Analysis of lipid profile revealed that T2D patients had lower levels of total cholesterol (p < 0.001), high-density lipoprotein (HDL) (p < 0.001), and low-density lipoprotein (LDL) cholesterol (p < 0.05 in non-metformin group and p < 0.001 in metformin-treated group) than controls. Triglyceride levels were increased only in the group of metformin-treated patients (p < 0.05). High-sensitive C-reactive protein (hs-CRP) was elevated in T2D patients without (p < 0.01) and with metformin (p < 0.001) with respect to controls. Parameters were BMI adjusted, as BMI is significantly higher in T2D. On doing this, differences between the groups in SBP, fasting insulin, triglycerides, and hs-CRP disappeared; whereas differences in the rest of the parameters with respect to controls remained as follows: glucose (p < 0.001), HOMA-IR (p < 0.05), HbA1c (p < 0.001), total cholesterol (p < 0.001), HDL cholesterol (HDL-c) (p < 0.01), and LDL cholesterol (LDL-c) (p < 0.01).
Parametric data are shown as mean ± SD, and nonparametric data are indicated as median (25th–75th quartiles). Proportions among groups were compared by a Chi-Square test. Comparisons of parametric data were made by one-way ANOVA and Newman–Keuls multiple-comparison post hoc test. Nonparametric data were compared with a Kruskal–Wallis test with Dunn's multiple-comparison post hoc test. Influence of BMI as a confounding variable on the studied parameters was minimized by applying a univariate general linear model for analyzing biochemical parameters and serum lipids. * p < 0.05, ** p < 0.01, and *** p < 0.001 when compared with controls.
ANOVA, analysis of variance; BMI, body mass index; DBP, diastolic blood pressure; DPP-4, dipeptidil peptidasa-4; GLP-1, glucagon-like peptide-1; HbA1c, glycated hemoglobin; HDL-c, high-density lipoprotein cholesterol; HOMA-IR, homeostasis model assessment of insulin resistance; hs-CRP, high-sensitive C-reactive protein; LDL-c, low-density lipoprotein cholesterol; SBP, systolic blood pressure; SD, standard deviation; T2D, type 2 diabetes.
ER stress parameters
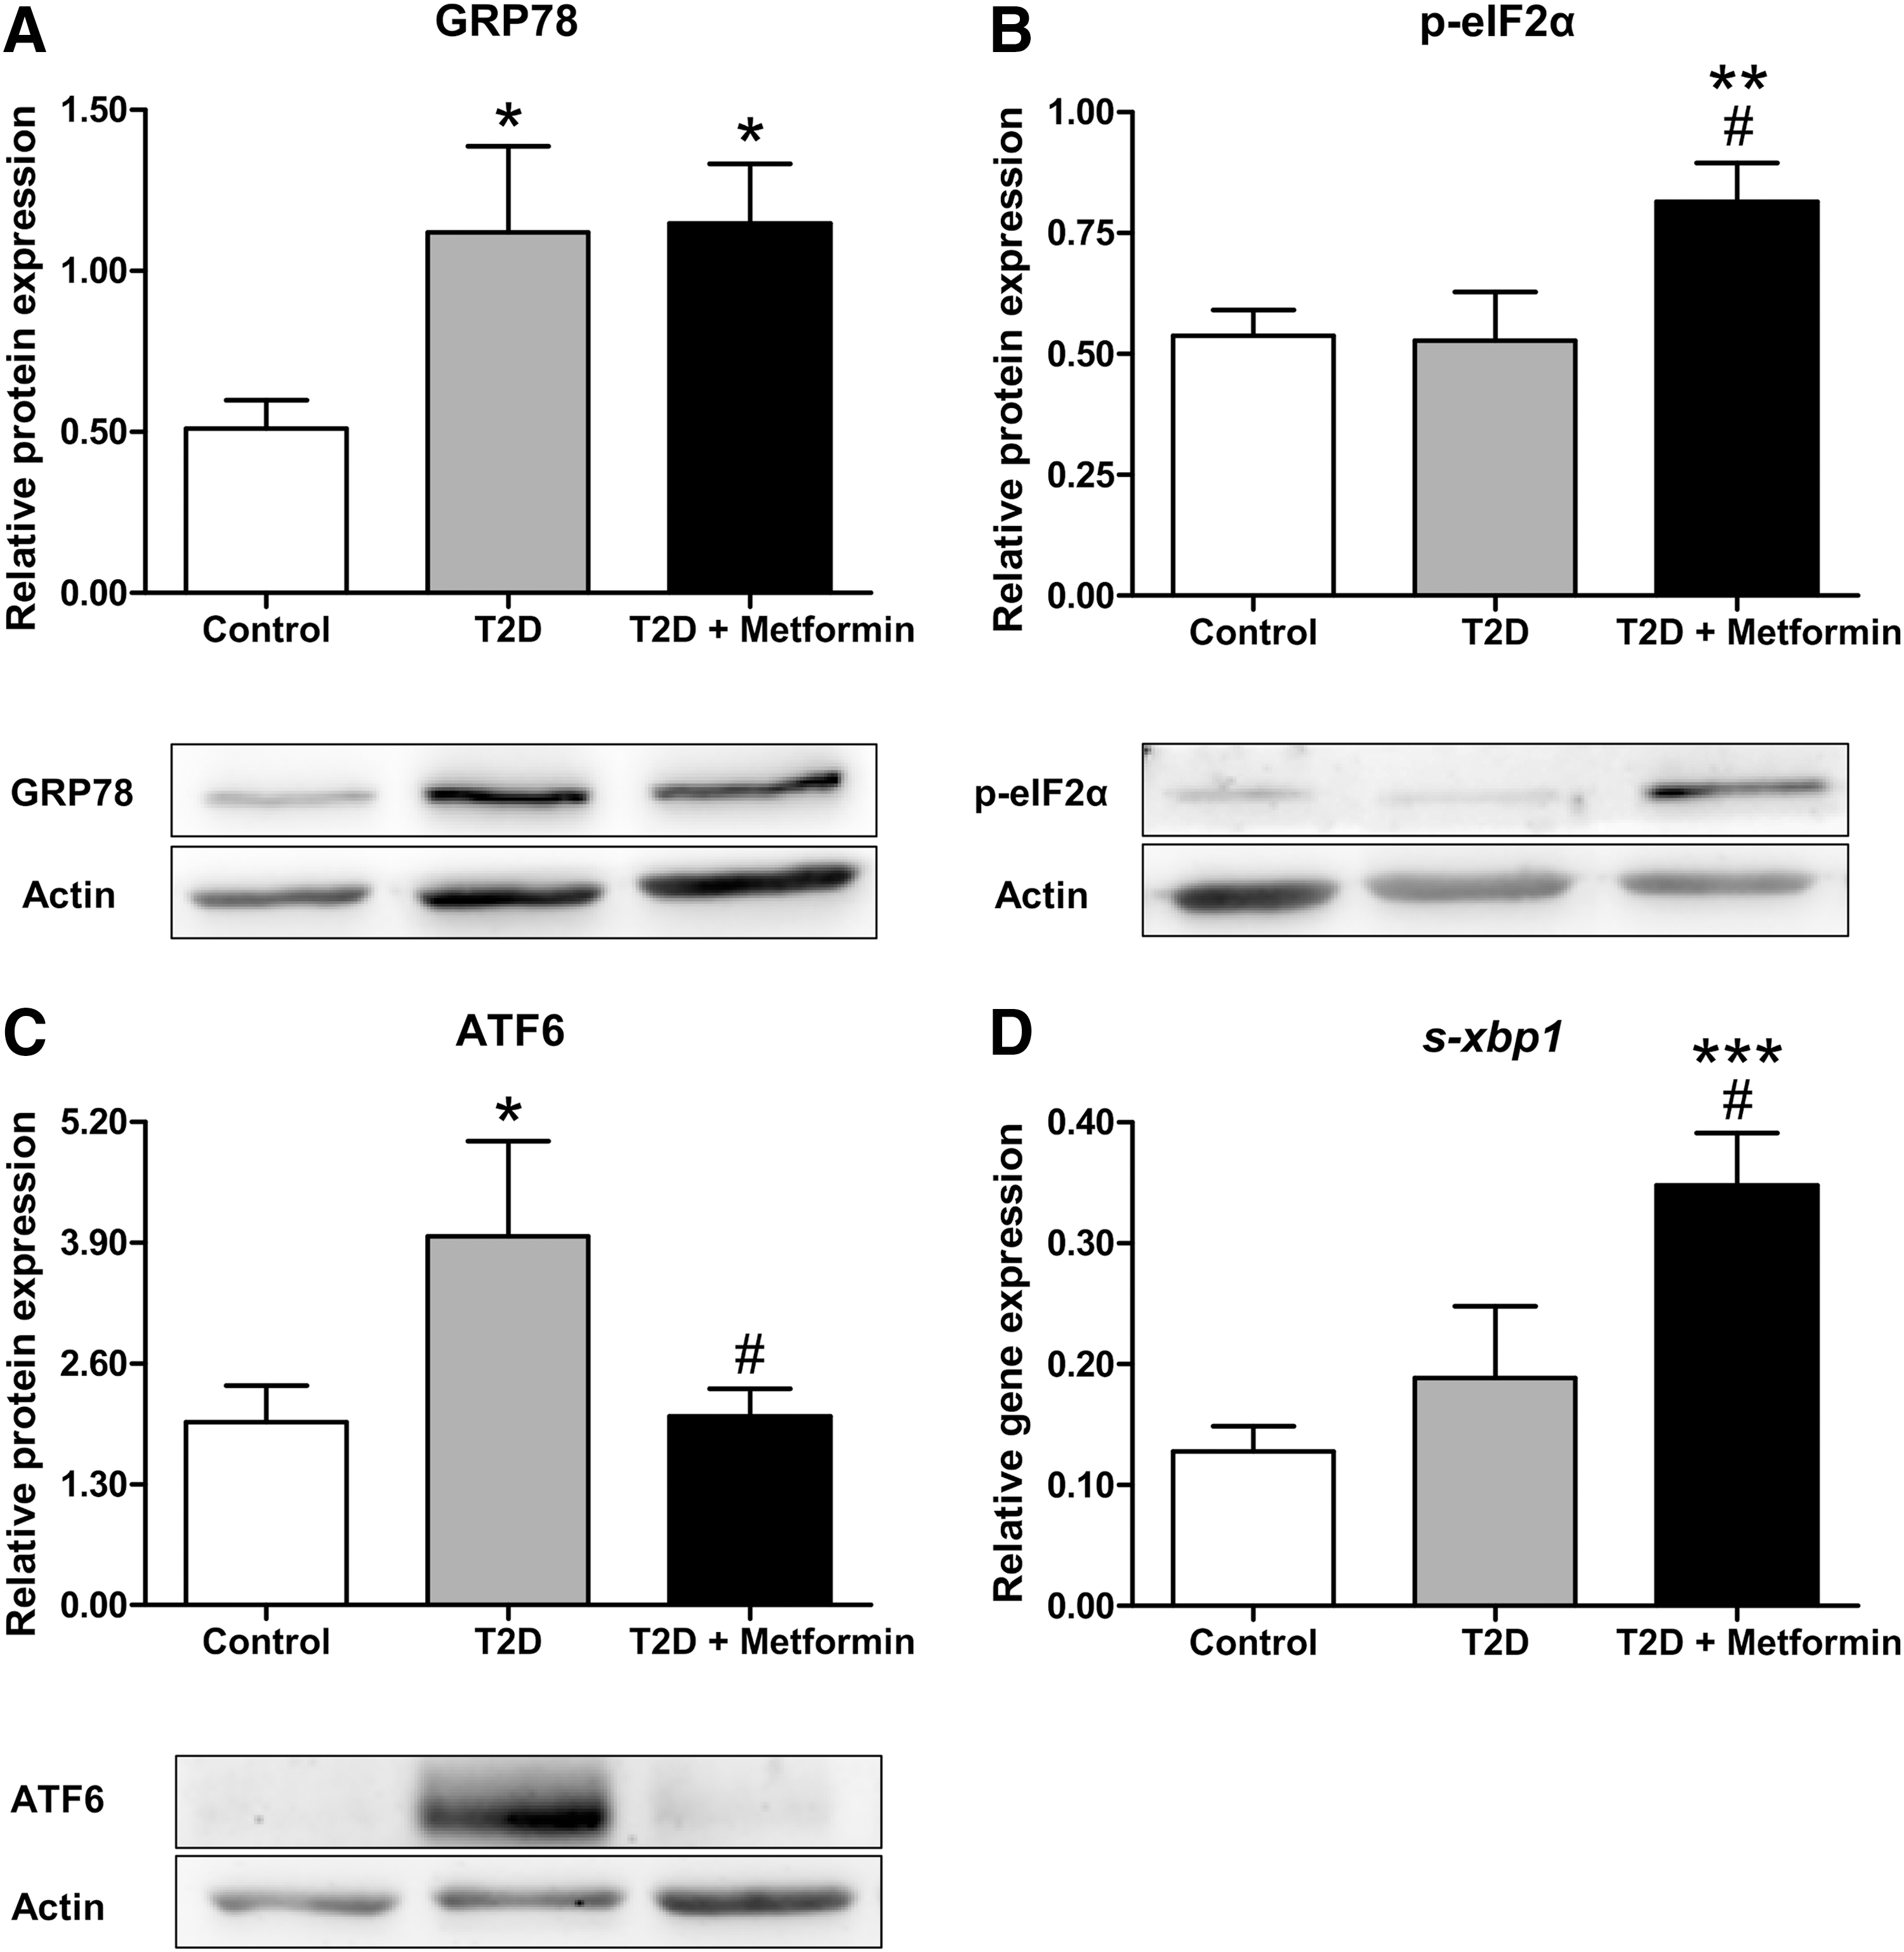
Protein expression of the ER stress indicators GRP78, phosphorylated-EIF2α (p-eIF2α) and ATF6, and mRNA expression of spliced X-box-binding protein 1 (s-xbp1) were measured to assess which of the ER stress pathways were activated in PBMCs. All diabetic patients displayed higher levels of GRP78 than controls (p < 0.05, Fig. 1A), whereas p-eIF2α levels were higher only among patients taking metformin (p < 0.01 with respect to controls and p < 0.05 compared with non-metfomin T2D, Fig. 1B), a trend that was accompanied by enhanced levels of s-xbp1 mRNA (p < 0.001 compared with controls and p < 0.05 with respect to T2D without metformin, Fig. 1D). Nevertheless, ATF6 was specifically increased in non-metfomin-treated patients (p < 0.05 compared with controls, Fig. 1C); in fact, ATF6 levels in metformin-treated T2D patients reverted to control values (p < 0.05 with respect to the T2D group).
Autophagy levels
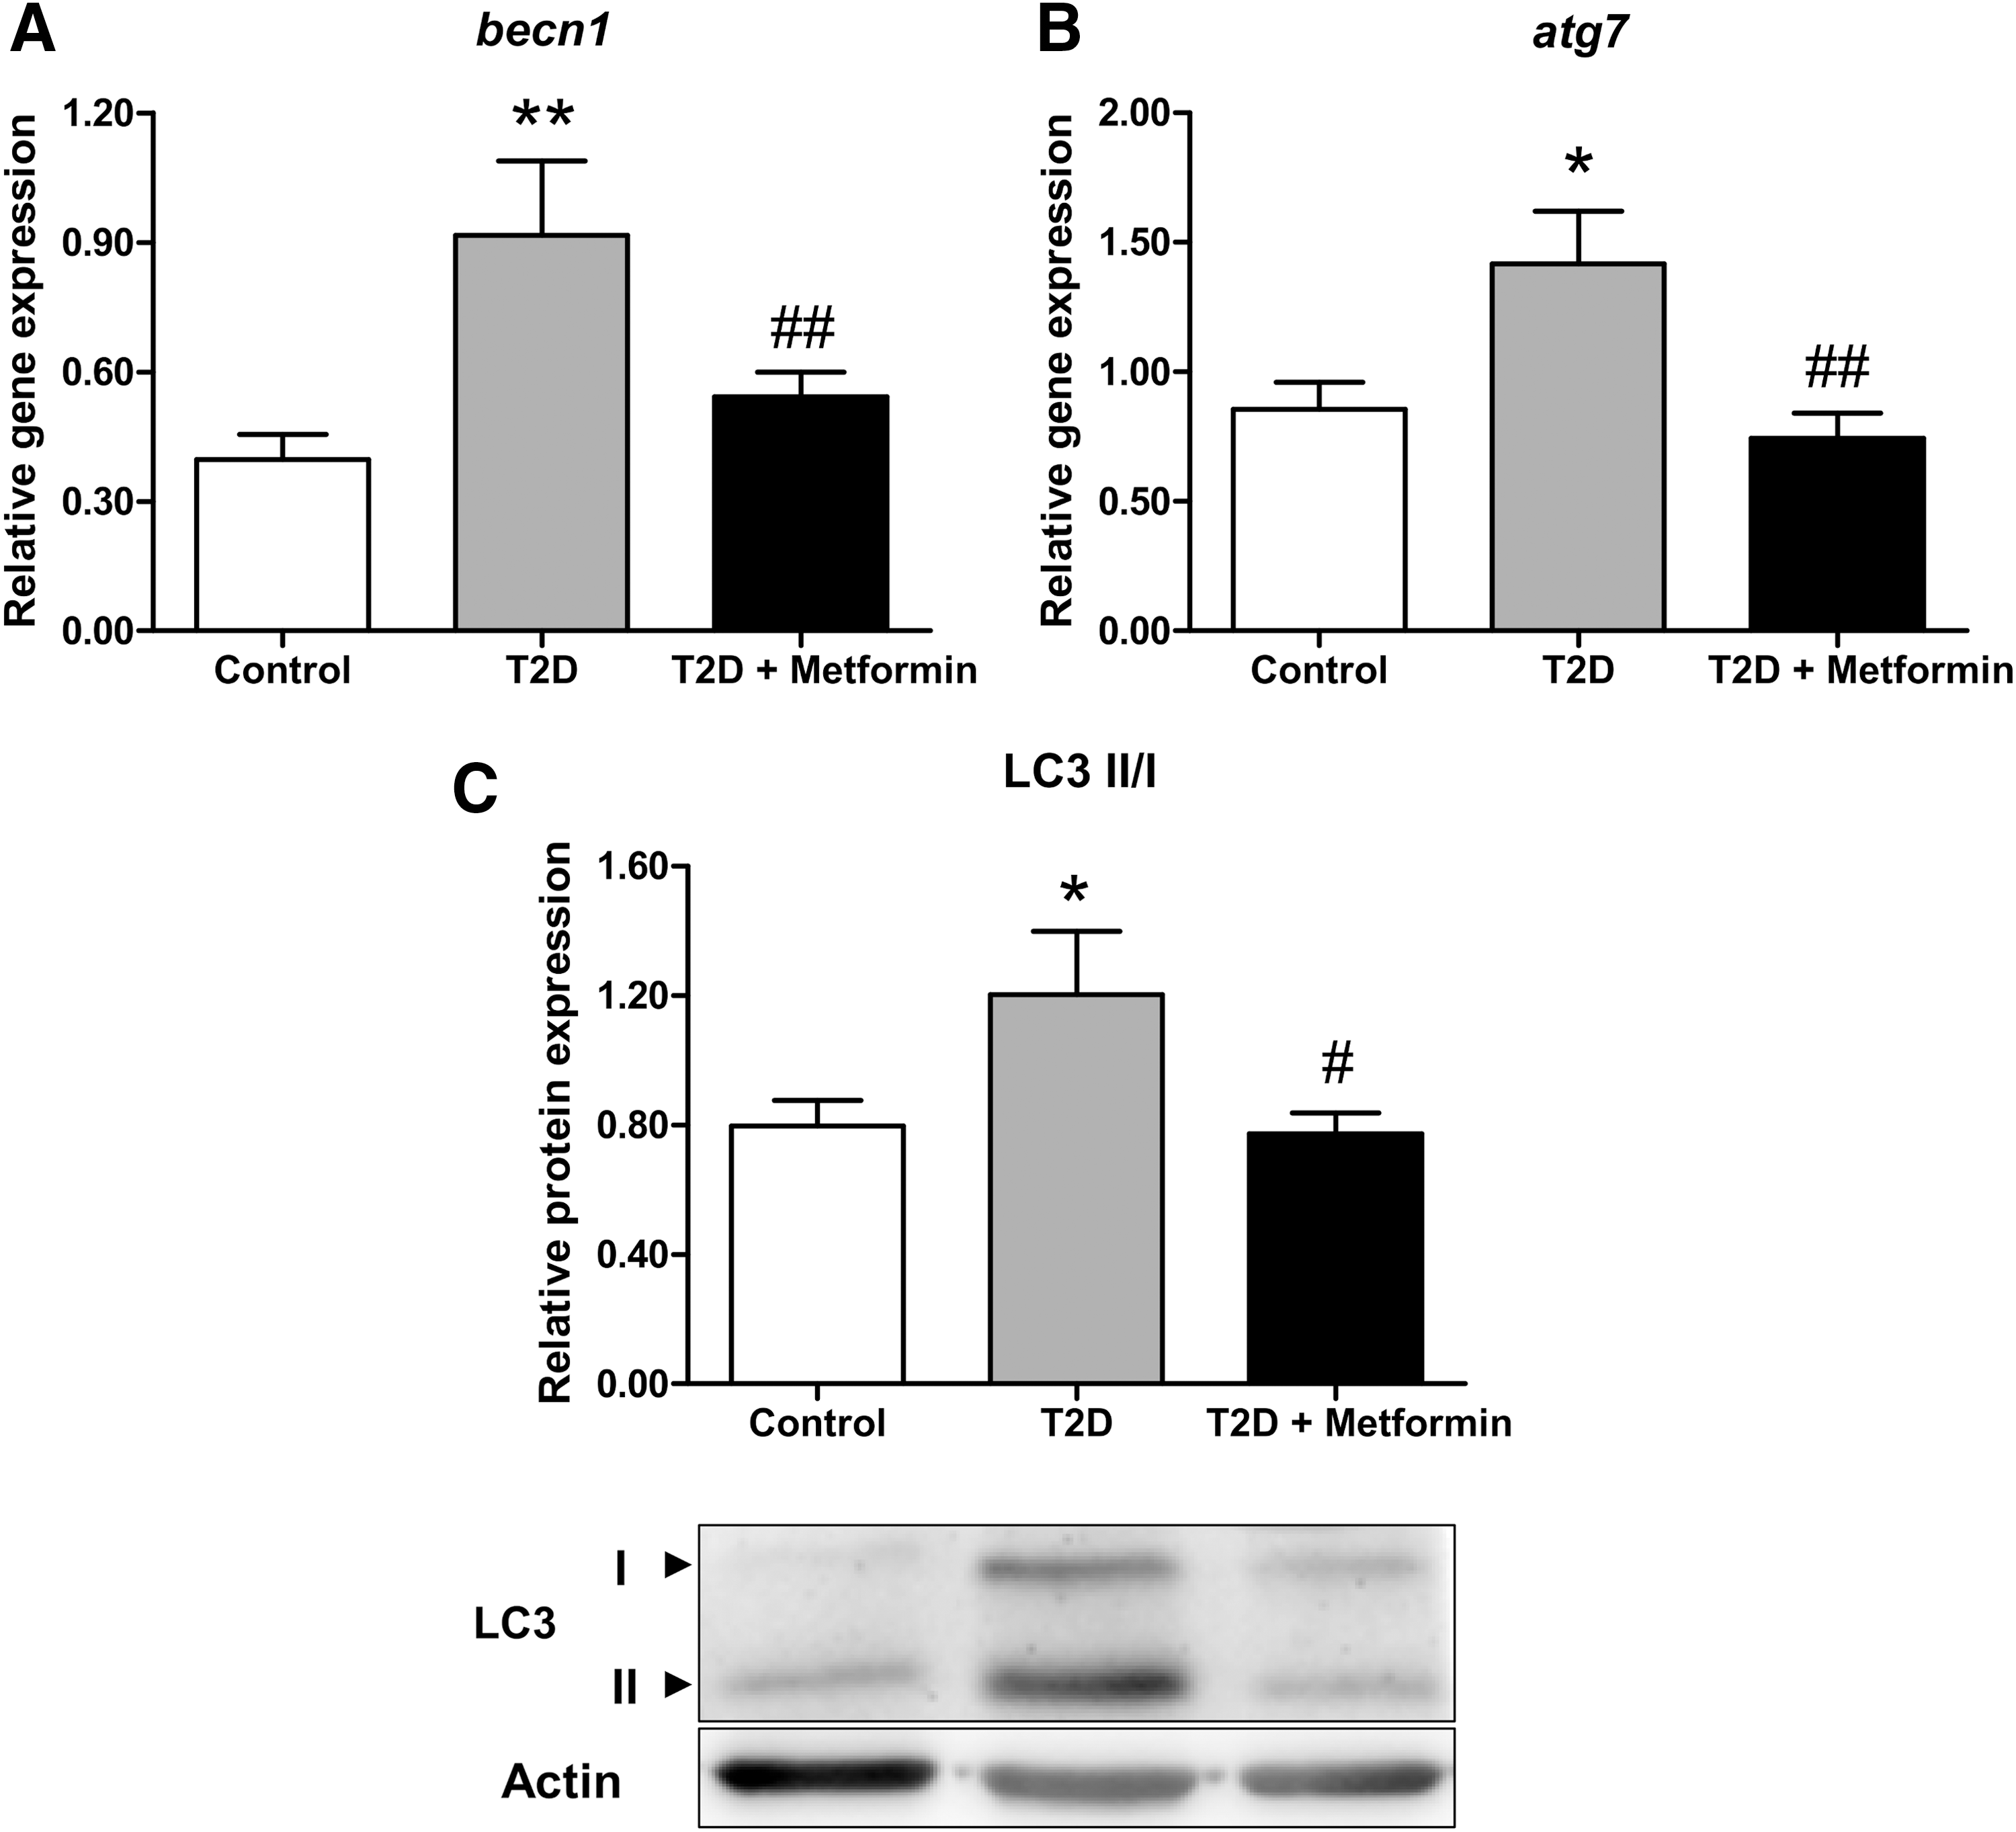
Nonmetformin-treated T2D patients showed higher mRNA levels of becn1 (p < 0.01, Fig. 2A) and atg7 (p < 0.05, Fig. 2B) than controls. However, patients receiving metformin displayed becn1 and atg7 levels similar to those seen in controls (p < 0.01 with respect to non-metfomin T2D). Similarly, LC3 II/I ratio was higher in non-metfomin-treated patients (p < 0.05 compared with controls), whereas it reverted to control values in metformin-treated T2D patients (p < 0.05 compared with T2D).
Oxidative stress assessment
Non-metformin-treated T2D patients presented higher mitochondrial superoxide production than controls (Fig. 3A, p < 0.05) and a decrease in intracellular glutathione (GSH) content (Fig. 3B, p < 0.01). Interestingly, patients under metformin treatment showed a decrease in mitochondrial superoxide levels when compared with non-metfomin-treated T2D (p < 0.01) to similar values to those expressed in controls (Fig. 3A). Further, an increase in intracellular GSH levels was observed in metformin-treated patients with respect to those non-treated with the drug (Fig. 3B, p < 0.05).

Discussion
We have studied how metformin treatment can modulate ER stress, autophagy, and oxidative stress in PBMCs of T2D patients. We demonstrate that PBMCs of T2D patients have higher levels of GRP78 than control subjects independently of whether or not they are receiving metformin treatment, suggesting an increase in ER stress under diabetic conditions. However, after evaluating in depth the three ER stress pathways, we observed that PBMCs of nonmetformin-treated T2D patients presented increased protein levels of ATF6, whereas metformin-treated patients showed increases in s-xbp1 mRNA levels and p-eIF2α protein levels. In addition, although PBMCs from non-metfomin-treated T2D subjects displayed higher levels of becn1, atg7, and LC3II/I ratio than control subjects; expression levels of these autophagy-related genes were reverted to control values in metformin-treated T2D patients, thus suggesting a modulating effect of metformin on autophagy. Finally, the leukocytes of our nonmetformin-treated T2D patients displayed higher levels of mitochondrial superoxide and lower levels of antioxidant defenses (GSH content), and these levels were reverted in metformin-treated patients, thereby confirming the antioxidant effect of this drug.
The pathophysiology of T2D involves enhanced oxidative stress induced as a consequence of high plasma glucose, lipids, and cytokine levels, which can trigger ER stress. The UPR is then activated due to a loss in the ER's capacity to handle the excess of aberrant proteins. Previous research has shown increases in ER stress markers in leukocytes of T2D patients, especially in those with poor glycemic control, which, interestingly, also exhibited enhanced levels of reactive oxygen species (ROS) (7). Leukocytes from well-controlled T2D patients (HbA1c<7%) exhibited an adaptive response to ER stress in which the IRE1 UPR branch was activated; this was in contrast to poorly controlled patients (HbA1c>7%), in whom the response shifted to the ATF6 branch (7).
Metformin has become the first-line therapy for the initial treatment of T2D, and it is widely prescribed for treating diseases related with insulin resistance. This biguanide has demonstrated beneficial effects on oxidative stress by decreasing ROS production in the leukocytes of T2D patients (4). This work demonstrates that UPR is activated in T2D leukocytes independently of whether or not metformin is administered, as manifested by the enhancement of GRP78 protein levels. Further, PBMCs from non-metfomin-treated T2D patients showed higher levels of ATF6, whereas this protein reverted to control levels in metformin-treated subjects, in whom an increase in the expression levels of s-xbp1 and p-eIF2α was detected. Thus, suggesting metformin as an ER stress modulator that drives PBMCs to the adaptive IRE1 and PERK pathways of UPR and protects them from the pro-apoptotic branch triggered by ATF6. In addition, metformin-treated T2D patients expressed lower levels of oxidative stress (decreased mitochondrial superoxide levels and increased intracellular GSH content) than those non-metfomin-treated patients, thus confirming our previously reported results obtained in a different cohort of patients (4). Taken together, these findings pose the question of whether metformin promotes ER stress modulation via the regulation of oxidative stress.
Autophagy has been widely related to ER function; in fact, it plays an important role in maintaining the functional and structural integrity of mitochondria and ER. Further, ER stress triggers autophagy to promote the clearance of misfolded proteins and counterbalance ER expansion (2). In T2D, autophagy acts as a protective mechanism toward stress responses in pancreatic β-cells under insulin resistance. Nevertheless, under certain conditions, autophagic vesicles accumulate and lead to type 2 programmed cell death. Consequently, autophagy can play a protective or harmful role in each specific situation and cell type, thus highlighting its context-dependent role in the pathophysiology of T2D.
We have previously reported that leukocytes from T2D patients display activation of autophagy, expressed by higher BECN1 and LC3-II levels than those seen in healthy volunteers (8). In this study, we have observed that nonmetformin-treated patients displayed higher levels of becn1, atg7, and a higher LC3II/I ratio than controls. These parameters reverted to control values in subjects treated with metformin, suggesting a possible role of metformin in the modulation of autophagy. We hypothesize that nonmetformin-treated T2D subjects experience an enhancement of oxidative stress and of the ATF6-dependent pro-apoptotic pathway, which eventually activates autophagic responses for the cell to eliminate misfolded proteins. In contrast, patients treated with metformin, in whom oxidative stress seems to be counteracted and the adaptative UPR is prompted via enhanced levels of s-xbp1 and p-eIF2α, seem to be able to handle ER stress without activating autophagic mechanisms. This hypothesis is supported by research showing that metformin inhibits autophagy in microvascular endothelial cells under conditions of glucose starvation (9), and by the reported effects of metformin treatment on prostate cancer cells, in which 2-deoxyglucose-induced expression of Beclin-1 and LC3 is repressed by addition of metformin (1).
To sum up, our data suggest that T2D promotes ER stress, manifested by enhanced GRP78 levels. PBMCs can respond to this increase if metformin treatment is administered. Thus, nonmetformin-treated patients show an increase of the ATF6-dependent pro-apoptotic pathway of UPR, as well as a rise in the autophagy mediators becn1, atg7, and LC3 II/I, suggesting a possible autophagy-dependent clearance of unfolded proteins. In contrast, in metformin-treated patients, the adaptive branches of UPR (s-xbp1 and p-eIF2α) are potentiated and levels of becn1, atg7, and LC3 II/I revert to values similar to those seen in controls, which suggests that metformin is a modulator of UPR response and autophagy in PBMCs under T2D conditions. Future mechanistic studies may reveal direct targets of metformin that mediate autophagy and ER responses.
Notes
Subjects
This work is an observational, cross-sectional descriptive study in which 53 T2D patients from our Endocrinology and Nutrition Service (University Hospital Dr. Peset, Valencia, Spain) and 30 healthy controls were included. T2D patients were divided into two groups depending on whether they were being treated or not with metformin, resulting in a group of 16 patients without metformin treatment and 37 with metformin treatment (850 mg orally twice a day for at least 1 year). T2D patients in both groups were selected in a way that they shared similar metabolic and anthropometrical characteristics. Healthy controls of a similar age to the T2D patients were voluntarily recruited. T2D was diagnosed according to the American Diabetes Association's criteria. Diagnosis was confirmed when one or more of the following criteria were fulfilled: (1) levels of fasting serum glucose ≥126 mg/dL; (2) random serum glucose ≥200 mg/dL on at least two occasions; (3) HbA1c ≥6.5%; and (4) antidiabetic medication. The exclusion criteria were documented history of cardiovascular disease (stroke, ischemic heart disease, peripheral vascular disease, etc.), autoimmune, infectious, inflammatory, hematological, or malignant disease. Patients receiving treatment with insulin were also excluded from the study.
The study was performed according to the ethical criteria of the Helsinki Declaration and with the approval of the Ethics Committee of the Hospital Dr. Peset. Informed consent was obtained from every single participant.
Clinical and biochemical determinations
Before collecting blood samples, patients underwent a physical examination to obtain anthropometrical information such as weight (kg), height (m), BMI (kg/m2), waist circumference (cm), and systolic and diastolic blood pressure (mmHg). Blood samples were obtained from the antecubital vein and collected in appropriate analysis tubes for biochemical and molecular determinations. 1500 g centrifugation was performed for 10 min at 4°C to obtain the serum. Levels of total cholesterol, triglycerides, and glucose in serum were determined by enzymatic assay. HDL-c levels were quantified with a Beckman LX20 analyzer (Beckman Corp., CA), and LDL-c concentration was calculated by Friedewald's formula. Percentage of HbA1c was obtained with an automatic glycohemoglobin analyzer (Arkray, Inc., Kyoto, Japan). Fasting insulin levels were measured by immunochemiluminescence (Abbott, IL), and HOMA-IR was calculated to evaluate insulin resistance (fasting insulin [μU/mL] × fasting glucose [mg/dL]/405). High-sensitive C-reactive protein (hs-CRP) was measured by a latex-enhanced immunonephelometric assay.
Cell isolation
PBMCs were isolated from heparinized blood samples. Extractions were performed by incubating whole blood samples with half a volume of dextran (3% w/v in saline solution; Sigma-Aldrich, MO, US) for 45 min at room temperature. Supernatants were collected, placed over Ficoll-Hypaque (GE Healthcare, Uppsala, Sweden), and centrifuged at 650 g for 25 min at room temperature to obtain a stratified sample. Middle phases containing PBMCs were collected and centrifugated at 650 g for 10 min at room temperature. After washing with phosphate-buffered saline (Sigma-Aldrich) and counting, an aliquot of the sample was freshly employed for static cytometry studies, and two identical pellets of each sample (one for real-time polymerase chain reaction [RT-qPCR] and the other for WB assay) were stored at −80°C until use.
Real-time polymerase chain reaction
The expression of genes involved in autophagy and ER stress was assessed by RT-qPCR analysis. Total RNA extraction from PBMCs was performed by using the GeneAll® Ribospin™ kit (Geneall Biotechnology, Hilden, Germany). A reverse transcriptase-polymerase chain reaction assay was performed with the RevertAid First Strand cDNA Synthesis Kit (Thermo Fisher Scientific, Waltham, MA) by using 1 μg of the extracted RNA. Finally, RT-qPCR was performed by using KAPA SYBR FAST universal master mix (KAPA Biosystems, MA) in a 7500 Fast RT-PCR system (Thermo Fisher Scientific). A summary of the protocol steps and primer sequences is provided in Table 2. Expression Suite software (Thermo Fisher Scientific) was employed to apply the comparative 2−ΔΔCt method and, hence, the relative quantification analysis of the samples, by using GAPDH as a housekeeping internal control.
atg7, autophagy-related 7; becn1, beclin1; s-xbp1, spliced X-box binding protein 1.
Western blot
PBMC pellets obtained from the subjects of the study were lysed for 15 min at 4°C with cell lysis buffer (20 mM HEPES pH 7.5, 400 mM NaCl, 20% glycerol, 0.1 mM EDTA, 10 μm Na2MoO4, 0.5% NP-40, 1 mM dithiothreitol) and protease inhibitor mixture (10 mM NaF, 1 mM NaVO3, 10 mM PNP, 10 mM β-glycerolphosphate) and then centrifuged for 15 min to discard cellular membranes. A BCA protein assay (Thermo Fisher Scientific) was used for determining the protein concentration of the samples. Mixes containing 25 μg of protein and loading buffer solution were resolved on 13% acrylamide (Sigma-Aldrich) gels by SDS-polyacrylamide gel electrophoresis. Proteins were then transferred onto nitrocellulose membranes (BIO-RAD, CA), which were blocked at room temperature for 1 h and incubated with primary antibodies at 4°C overnight.
The following primary antibodies were used: Actin (Sigma-Aldrich), BECN1 (Abcam, Cambridge, UK), LC3 (Merk Millipore, MA, US), GRP78 (Abcam), p-eIF2a (Invitrogen), and ATF6 (Thermo Fisher Scientific). Blots were incubated with the correspondent secondary antibody: horseradish peroxidase (HRP) goat anti-rabbit (Merk Millipore) or HRP goat anti-mouse (Thermo Fisher Scientific). Developing was performed with Supersignal West Femto (Thermo Fisher Scientific) or ECL plus reagent (GE Healthcare, IL). A Fusion FX5 acquisition system (Vilbert Lourmat, Marne La Vallée, France) was used to visualize the bands, and signals were analyzed and quantified by densitometry using Bio1D software (Vilbert Lourmat). All protein values were normalized to actin.
Static cytometry assay
Isolated leukocytes were seeded in 48-well plates (150,000 cells/well) and incubated for 30 min at 37°C with 5 μM MitoSOX™ Red reagent, or 1 μM CellTracker™ Green 5-chloromethylfluorescein diacetate (CMFDA) fluorescent probes (Thermo Fisher Scientific). Hoechst 33342 nucleic acid stain (4 μM, Sigma-Aldrich) was used to visualize nuclei. A fluorescence microscope (IX81; Olympus, Hamburg, Germany) coupled with the static cytometry software “ScanR” was employed to measure mitochondrial production of superoxide and intracellular GSH content.
Data analysis
The statistical analysis of data was performed by using SPSS 17.0 Software (SPSS Statistics, Inc.). Normally distributed variables were expressed as mean ± standard deviation and compared with one-way analysis of variance and Newman–Keuls multiple-comparison post hoc test, whereas non-normally distributed variables were expressed as median and 25th–75th quartiles and compared by means of the Kruskal–Wallis and Dunn's multiple-comparison post hoc tests. To compare proportions among groups, a Chi-Square test was performed. Possible confounding variables, such as BMI, were used as covariates to generate a univariate general linear model for analyzing biochemical parameters and serum lipids. For all the tests, a confidence interval of 95% was used and differences were considered significant when p < 0.05.
Footnotes
Acknowledgments
The authors thank Brian Normanly (University of Valencia-CIBERehd) for his editorial assistance, Rosa Falcon & Carmen Ramirez (FISABIO) for their technical assistance, and Juan Esplugues Foundation for its economical support. This study was financed by grants PI15/1424, PI16/1083, PI16/0301, and CIBERehd CB06/04/0071 by Carlos III Health Institute and by the European Regional Development Fund (ERDF “A way to build Europe”); UGP15-193 and UGP15-220 by FISABIO; and GV/2016/169 and PROMETEOII2014/035 by the Department of Education of the Valencian Regional Government. N.D.-M. is recipient of a PFIS contract from Carlos III Health Institute (FI14/00125). F.I. has a contract from Generalitat Valenciana (GRISOLIAP/2016/015). I.E.-L. is recipient of a predoctoral contract from FISABIO (UGP-15-144). C.B. has a Sara Borrell postdoctoral contract from Carlos III Health Institute (CD14/00043). S.R.-L. is recipient of a Juan de la Cierva-Formación contract from the Spanish Ministry of Economy and Competitiveness (FJCI-2015-25040). V.M.V. and M.R. are recipients of contracts from the Ministry of Health of the Valencian Regional Government and Carlos III Health Institute (CES10/030 and CPII16/00037, respectively).