
Abstract
Aims:
Selenoproteins are an essential class of proteins involved in redox signaling and energy metabolism. However, the functions of many selenoproteins are not clearly established. Selenoprotein M (SELENOM), an endoplasmic reticulum (ER)-resident oxidoreductase bearing structural similarity to thioredoxin (TXN), is among those yet to be fully characterized. This protein is highly expressed in hypothalamic regions involved in leptin signaling and has been previously linked to energy metabolism. Herein, we performed a series of studies using in vivo and in vitro models to probe the specific influence of SELENOM on hypothalamic leptin signaling and assess SELENOM-regulated pathways.
Innovation and Results:
Our initial experiment in vivo demonstrated that (i) leptin promotes hypothalamic expression of SELENOM and (ii) leptin-induced STAT3 phosphorylation is impeded by SELENOM deficiency. Additional in vitro studies using mHypoE-44 immortalized hypothalamic neurons corroborated these findings, as SELENOM deficiency obstructed downstream STAT3 phosphorylation and cytosolic calcium responses evoked by leptin treatment. Correspondingly, SELENOM overexpression enhanced leptin sensitivity. Microarray analysis conducted in parallel on hypothalamic tissue and mHypoE-44 cells revealed multiple genes significantly affected by SELENOM deficiency, including thioredoxin interacting protein, a negative regulator of the TXN system. Further analysis determined that (i) SELENOM itself possesses intrinsic TXN activity and (ii) SELENOM deficiency leads to a reduction in overall TXN activity. Finally, mHypoE-44 cells lacking SELENOM displayed diminished activation of the nuclear factor kappa-light-chain enhancer of activated B-cells (NF-κB) signaling pathway and increased susceptibility to ER stress-mediated cell death.
Conclusion:
In sum, these findings establish SELENOM as a positive regulator of leptin signaling and TXN antioxidant activity in the hypothalamus. Antioxid. Redox Signal. 35, 775–787.
Introduction
Selenoproteins are an essential class of proteins involved in redox signaling that have been increasingly implicated in energy metabolism. These proteins are characterized by the co-translational incorporation of selenium (Se) in the form of selenocysteine (Sec) and include the glutathione peroxidases, thioredoxin reductases (TXNRDs), iodothyronine deiodinases, and a host of additional Sec-containing proteins with undetermined molecular functions. Among the latter category is SELENOM (selenoprotein M), an uncharacterized endoplasmic reticulum (ER)-resident oxidoreductase that has been previously linked to Ca2+ homeostasis and energy metabolism. Structurally, SELENOM bears similarity to thioredoxin (TXN), as it contains a TXN-fold in its tertiary structure and a CxxU (U = Sec) active site that is believed to mediate disulfide exchange (9). SELENOM is also abundantly expressed in the brain, particularly in hypothalamic regions involved in leptin signaling (32). Our initial characterization of Selenom−/− global knockout mice led to the unexpected finding that SELENOM exerts a significant influence on energy homeostasis, as Selenom−/− mice developed increased body weight, elevated white adipose tissue levels, and reduced hypothalamic leptin sensitivity (32). Although leptin resistance eventually became apparent in Selenom−/− mice, it was not established whether this represented the root cause of the obese phenotype or simply a secondary complication.
Leptin resistance is a hallmark feature of obesity that occurs when increasing leptin levels fail to stimulate energy metabolism and inhibit feeding behavior. One established cause of leptin resistance is chronic ER stress, a phenomenon resulting from the accumulation of misfolded proteins and/or Ca2+ depletion within this organelle (30, 45). ER stress activates the unfolded protein response, an evolutionarily conserved mechanism to restore cellular homeostasis that is mediated by three parallel signaling pathways, each initiated by a distinct ER-resident transmembrane sensor (15, 37). One of these pathways triggers cytosolic splicing of X-box binding protein 1 (XBP1s) mRNA (20), leading to its translocation to the nucleus where it acts as a transcription factor to upregulate various genes involved in protein folding, including SELENOM (36). Interestingly, evidence also indicates that XBP1s promotes leptin sensitivity, as enforced expression of XBP1s enhances leptin signaling in vitro, whereas neuronal-specific XBP1s ablation increases susceptibility to diet-induced obesity in mice (30). Based on the aforementioned results and our prior finding that Selenom−/− mice develop leptin resistance, we hypothesized that SELENOM may be a positive regulator of leptin signaling.
Innovation
Although selenium (Se) has been increasingly implicated in energy homeostasis, its influence remains enigmatic, largely because many selenoproteins remain uncharacterized. Selenoprotein M (SELENOM), an ER-resident oxidoreductase, is among those lacking an established molecular function. Herein, by a series of in vivo and in vitro studies, we identify SELENOM as a positive regulator of leptin signaling and thioredoxin (TXN) activity in the hypothalamus. This work establishes SELENOM as an important player in redox-mediated regulation of leptin signaling and has significant clinical implications for the development of novel therapeutics targeting leptin resistance in metabolic disease.
To further investigate this potential role for SELENOM, we conducted a series of studies using in vivo and in vitro model systems to probe the influence of SELENOM on leptin signaling. In addition, we also performed microarray analysis on both mouse hypothalamic tissue and immortalized hypothalamic cells to identify genes and pathways most affected by SELENOM deficiency. Our results indicate that SELENOM promotes leptin signaling and TXN-antioxidant activity in the hypothalamus.
Results
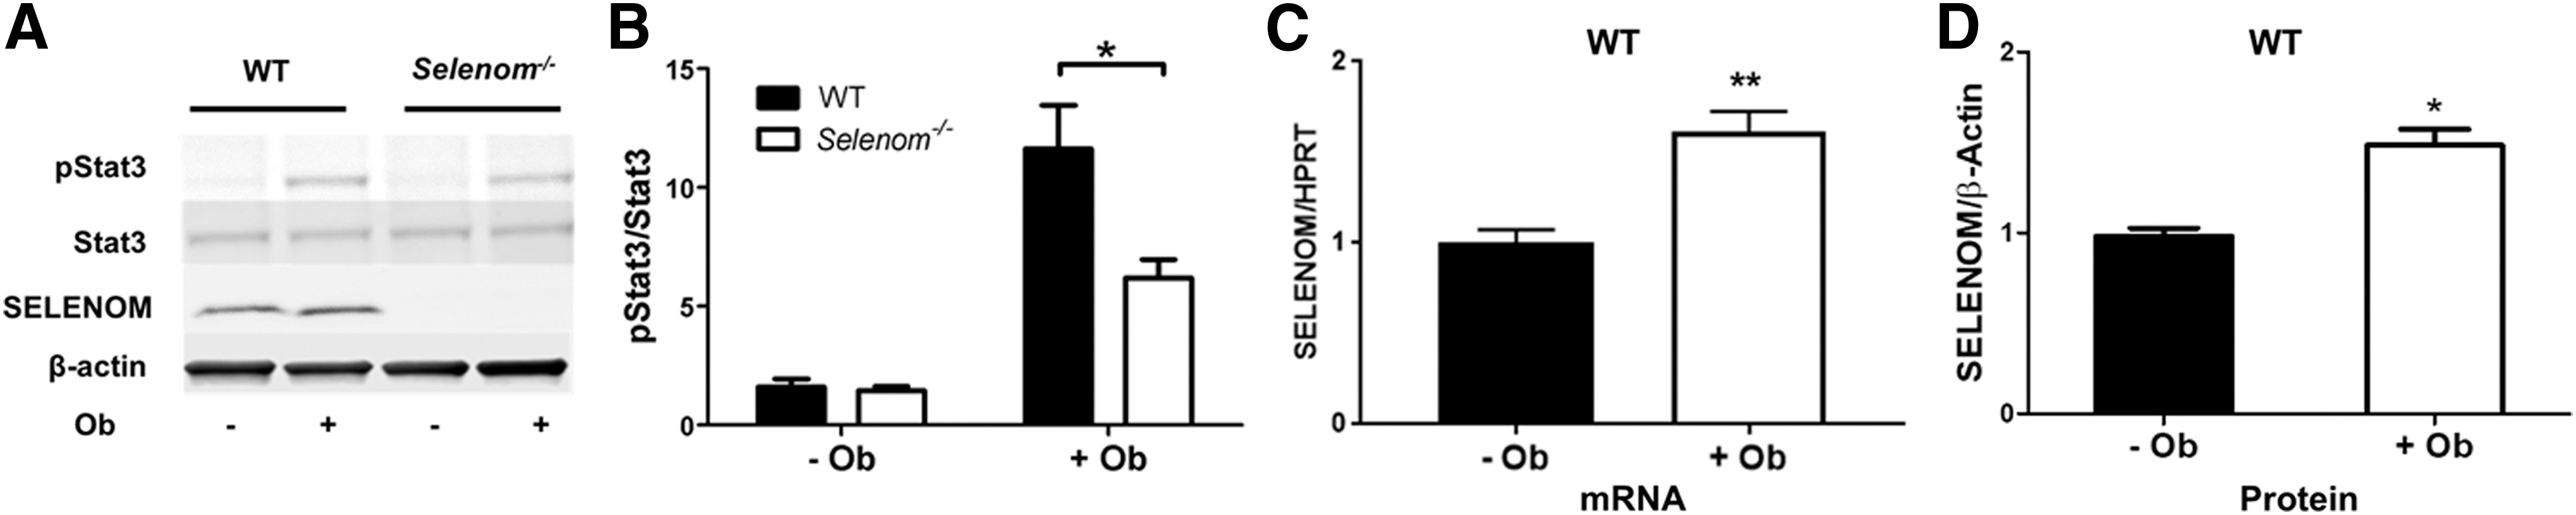
We previously reported that on reaching 18–20 weeks of age, Selenom−/− mice exhibit symptoms of obesity and hypothalamic leptin resistance (32). To determine whether hypothalamic leptin resistance precedes the development of the obese phenotype in Selenom−/− mice, we performed a leptin challenge on 10-week-old male mice of equal body weight [wild type (WT) = 24.5 ± 0.4 g; Selenom−/− = 24.1 ± 0.4 g; n = 6–7 per genotype] and we assessed downstream Stat3 signaling. Western blot analysis of hypothalamic tissue showed that leptin-induced Stat3 phosphorylation was significantly attenuated in Selenom−/− mice relative to controls (Fig. 1A, B). Moreover, in control samples, we found that both SELENOM mRNA and protein levels were increased by leptin treatment (Fig. 1C, D), corroborating results from a prior microarray study showing SELENOM upregulation in response to leptin (39).
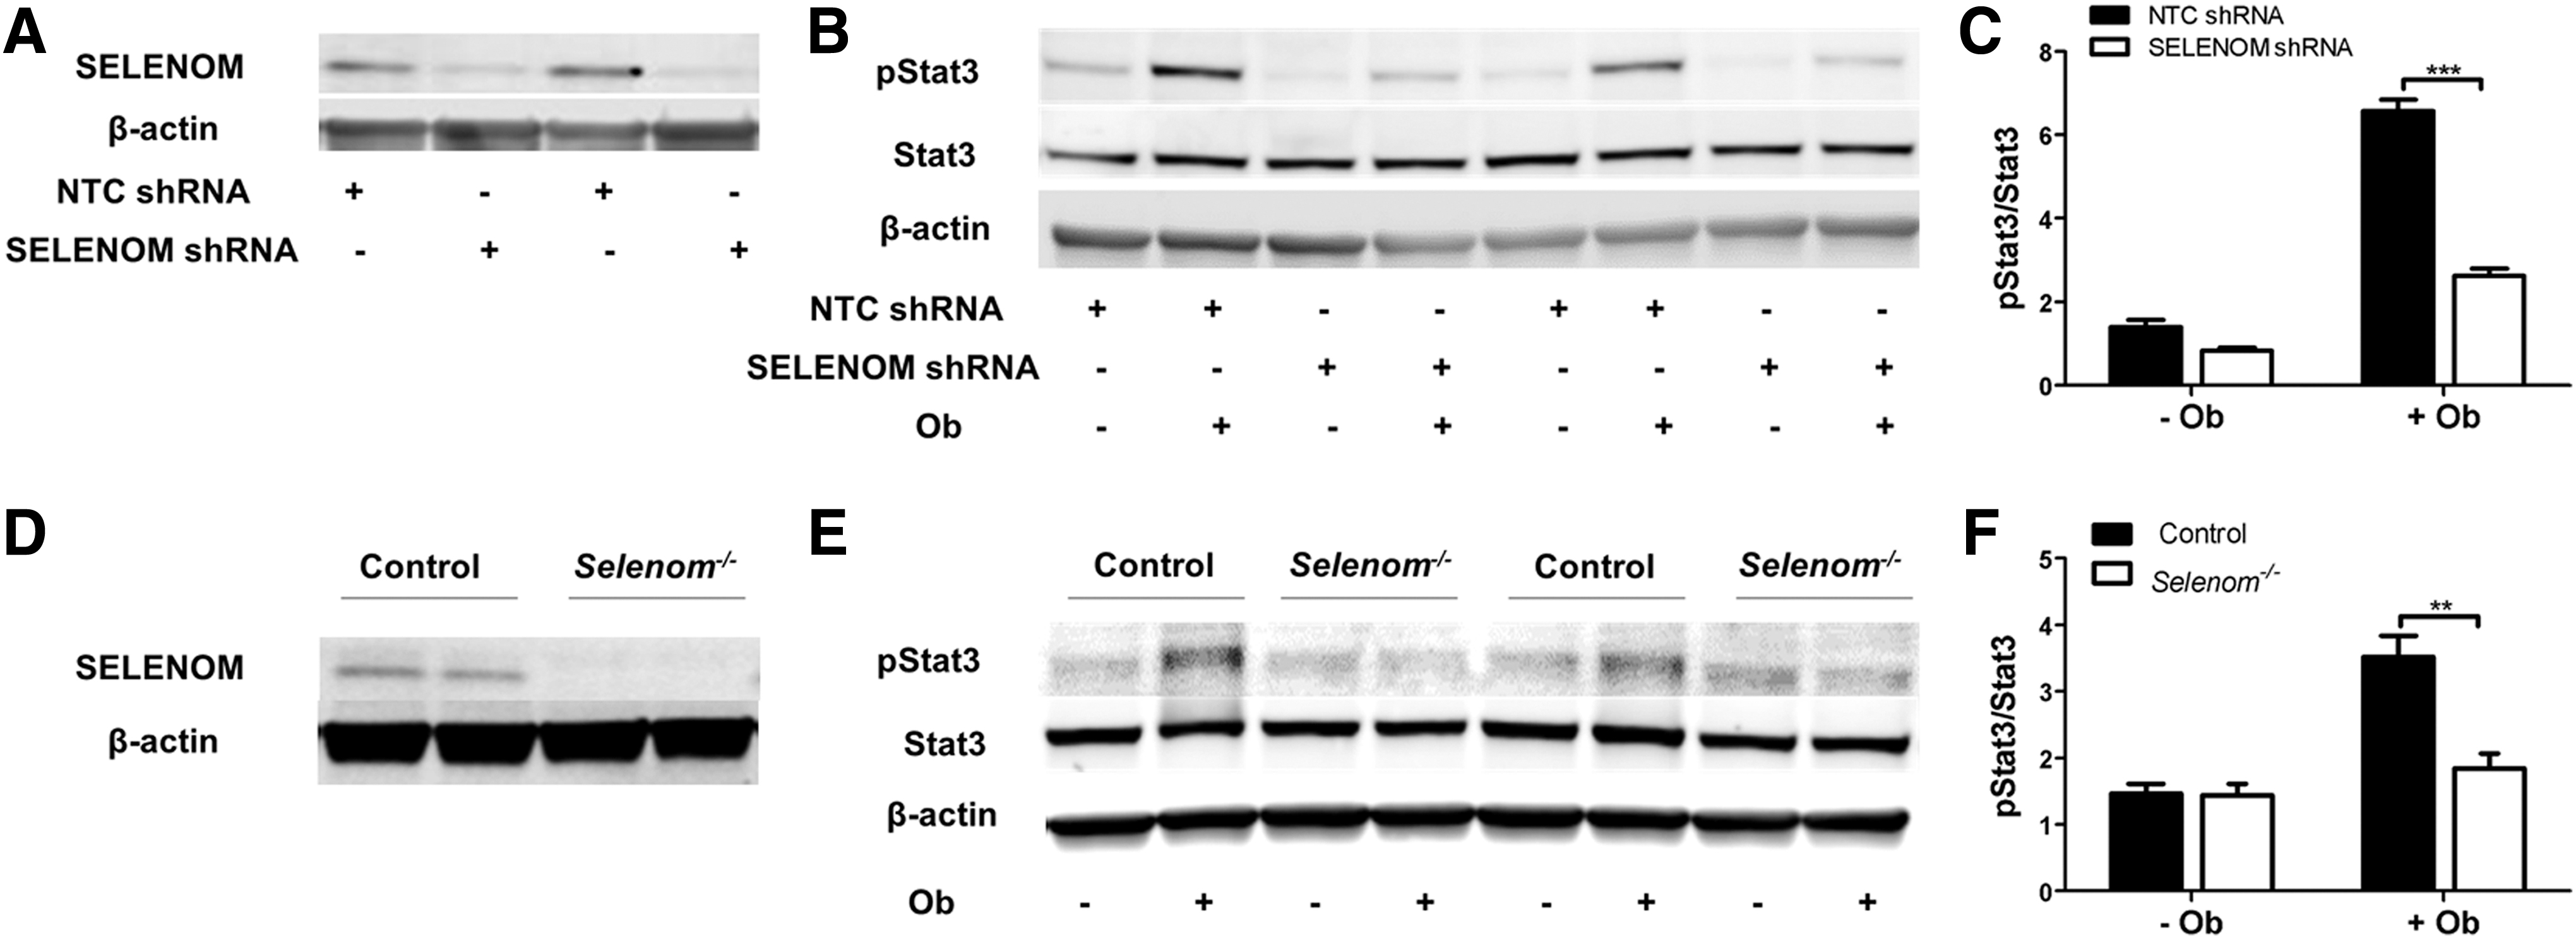
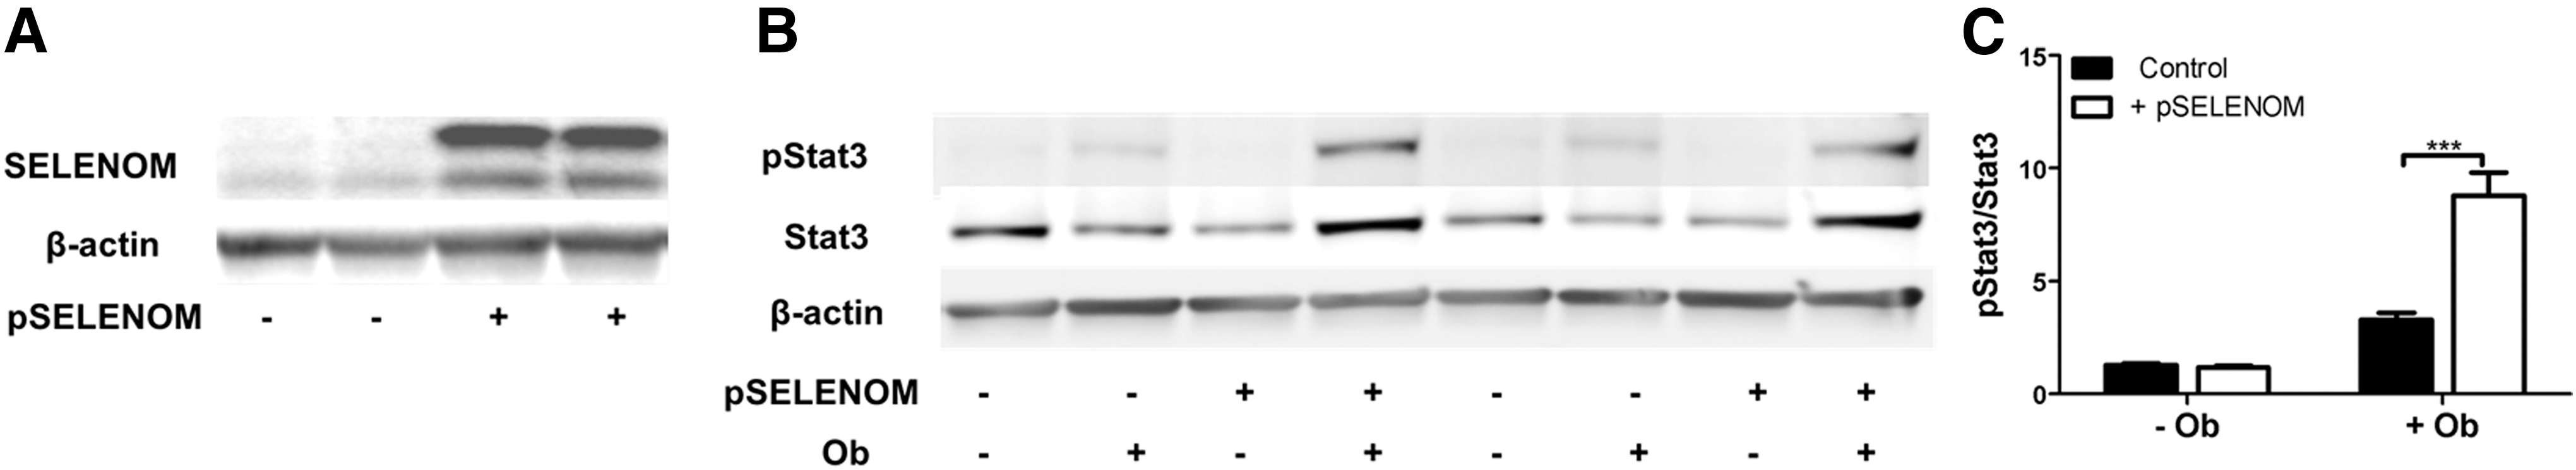
To further probe the influence of SELENOM on leptin signaling, we performed a series of studies in mHypoE-44 cells, an immortalized cell line derived from embryonic mouse hypothalamic neurons that expresses agouti-related peptide (AGRP) and neuropeptide Y (10). In our initial study, we stably transfected these cells with a SELENOM-targeted short hairpin RNA (shRNA) construct under the control of the Tet-On® inducible system. Doxycycline-mediated induction of this construct was observed to knock down SELENOM protein levels to ∼25% of control levels (Fig. 2A). In accord with our in vivo results, we observed reduced levels of Stat3 phosphorylation in response to leptin in SELENOM shRNA-expressing cells relative to controls expressing nontarget control (NTC) shRNA (Fig. 2B, C). We also utilized CRISPR/CAS9 technology to generate an edited mHypoE44 cell line where SELENOM expression was ablated (Fig. 2D). This cell line displayed reduced sensitivity to leptin stimulation (Fig. 2E, F), providing additional support that SELENOM impacts leptin signaling. To further confirm the role of SELENOM in leptin signaling, we also overexpressed SELENOM in mHypoE-44 cells (Fig. 3A). As anticipated, leptin treatment elicited significantly higher levels of Stat3 phosphorylation in SELENOM-overexpressing cells relative to controls (Fig. 3B, C). Taken together, these results demonstrate that SELENOM is a positive regulator of leptin signaling.
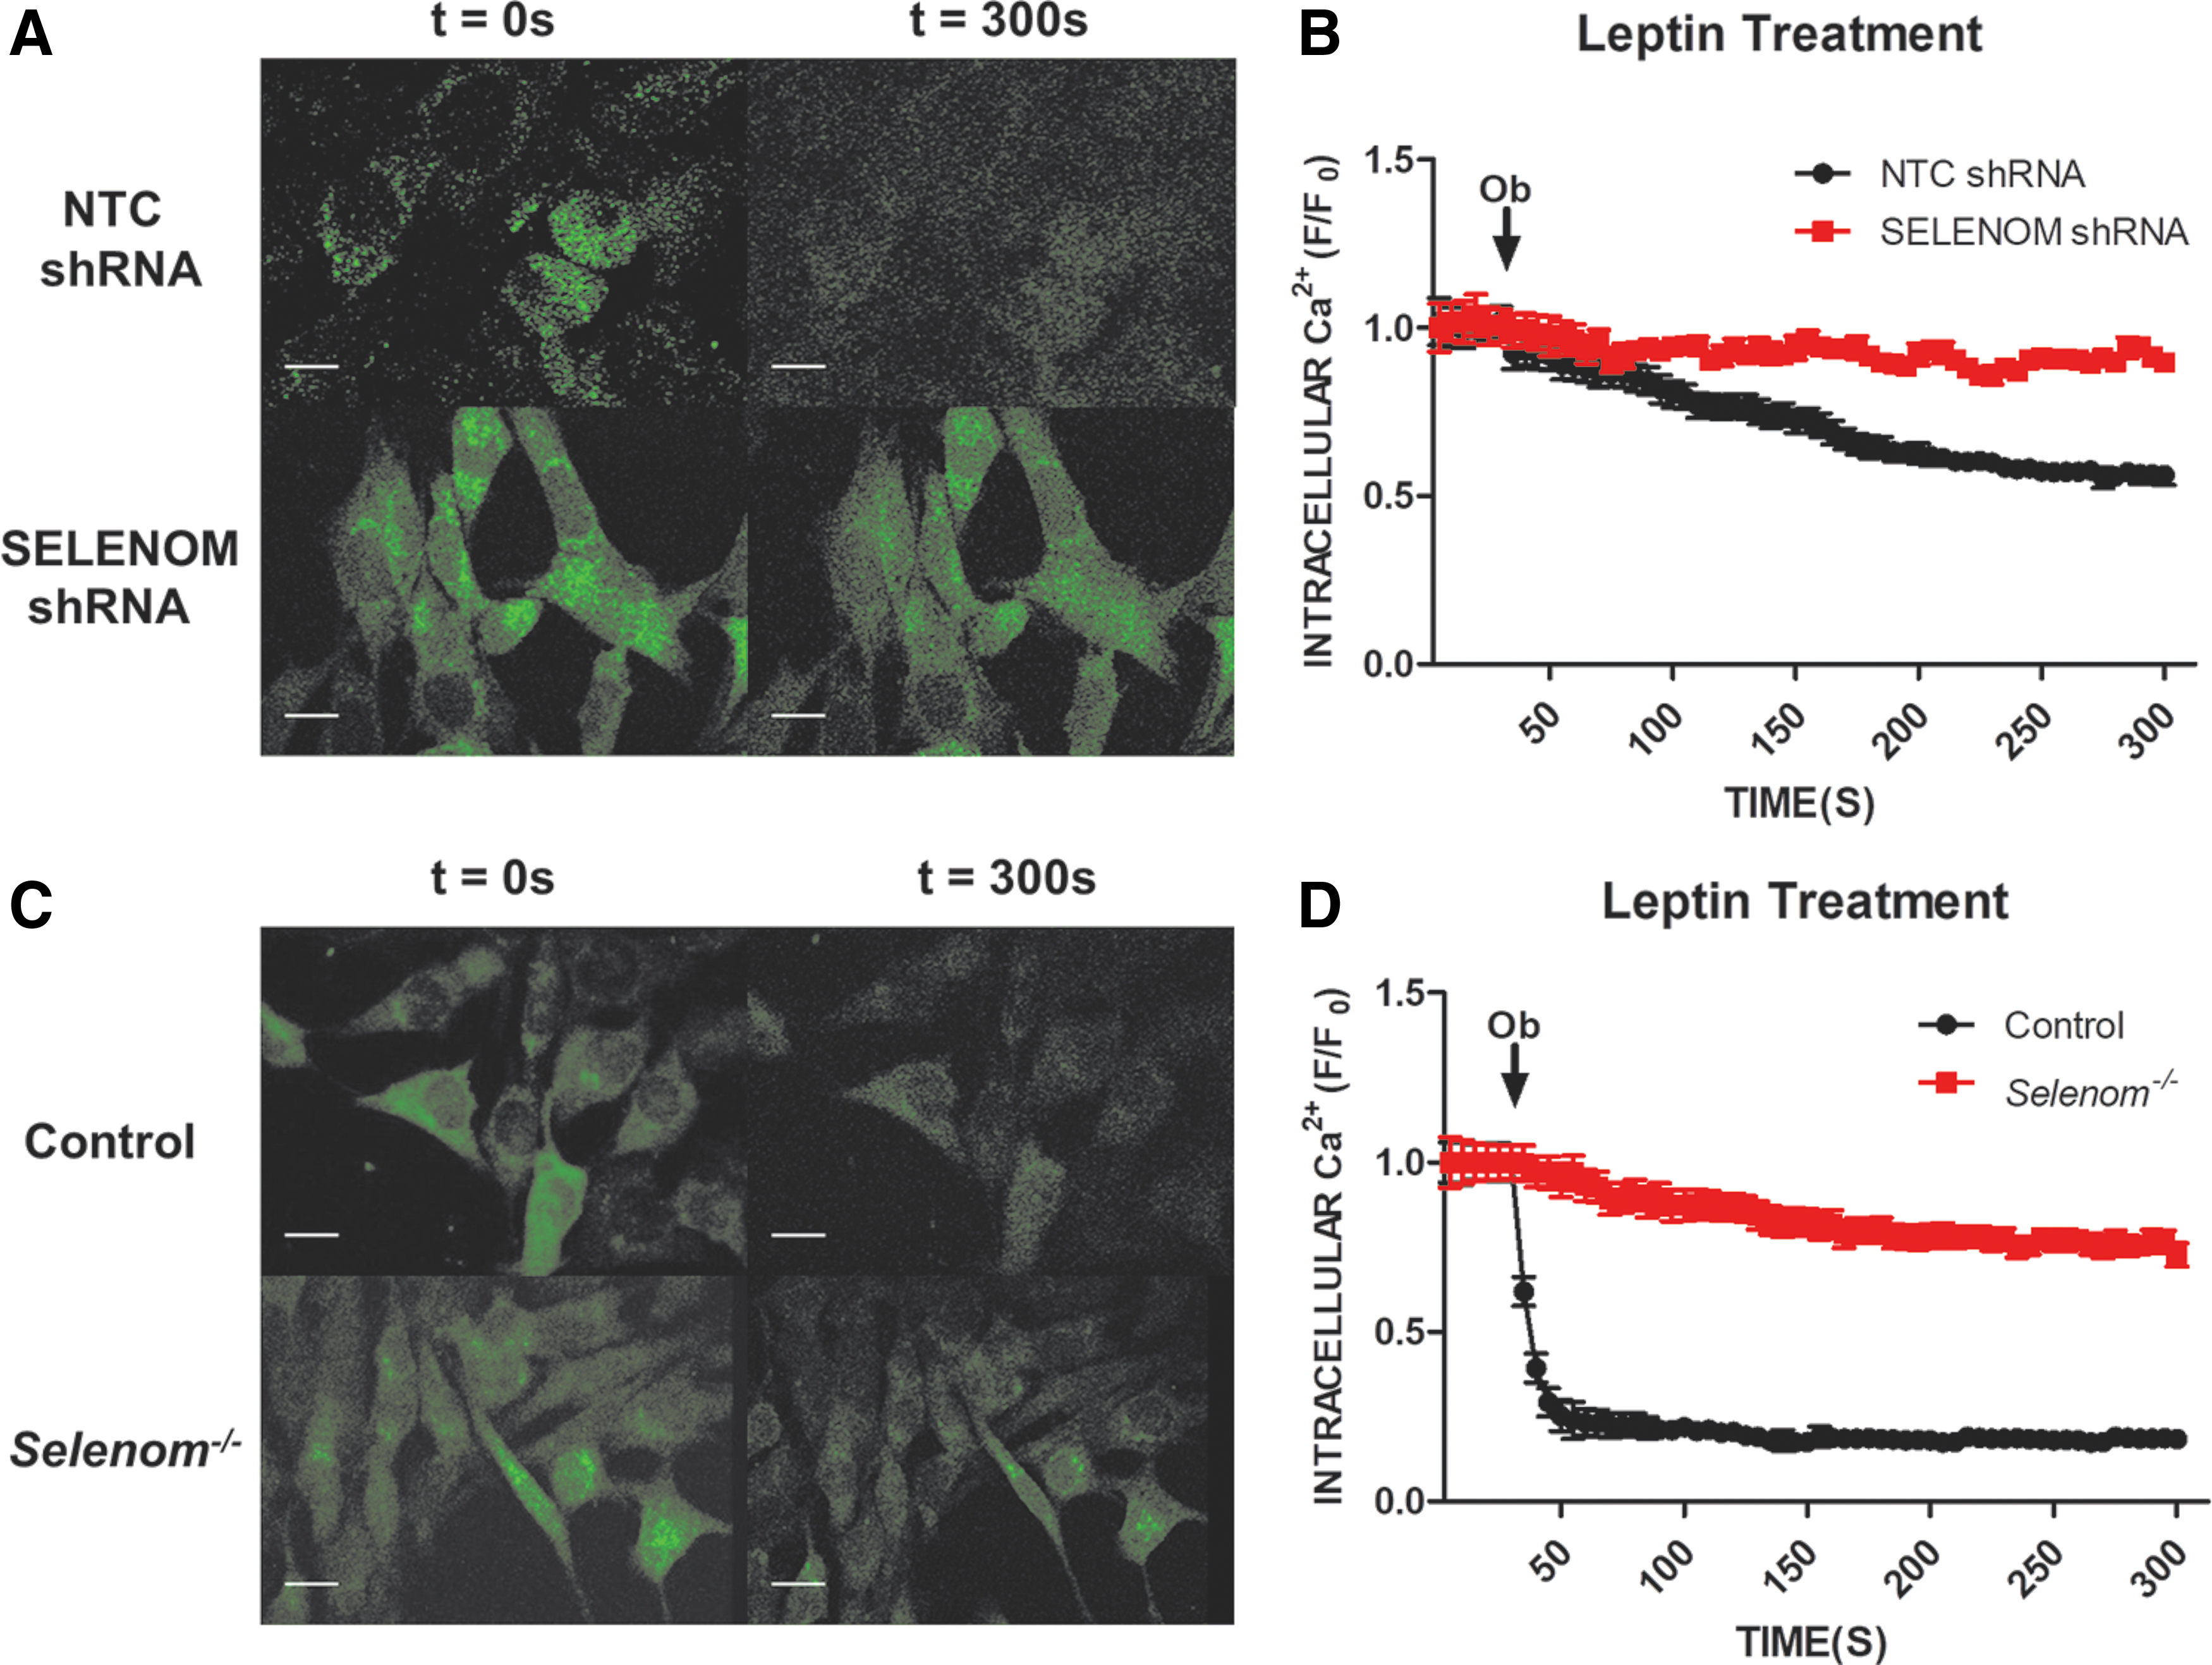
Prior in vitro studies demonstrated that SELENOM plays an important role in Ca2+ homeostasis (34). We next utilized live cell imaging to monitor changes in cytosolic Ca2+ induced by leptin treatment in our mHypoE-44 cell line. These cells were previously reported to express AGRP (10, 26), an established marker for a population of orexigenic hypothalamic neurons. The influence of leptin on AGRP neurons is inhibitory, leading to hyperpolarization and a reduction in cytosolic Ca2+ levels (27, 40). We found that leptin treatment of mHypoE-44 cells elicited a reduction in cytosolic Ca2+, consistent with the notion that they display certain features of AGRP neurons. The leptin-induced reduction of cytosolic Ca2+ was abrogated in SELENOM shRNA-expressing cells (Fig. 4A, B), confirming prior observations of SELENOM involvement in both Ca2+ homeostasis and leptin signaling. Similar results were observed in our Selenom−/− cell line, as leptin failed to reduce cytosolic Ca2+ levels (Fig. 4C, D).
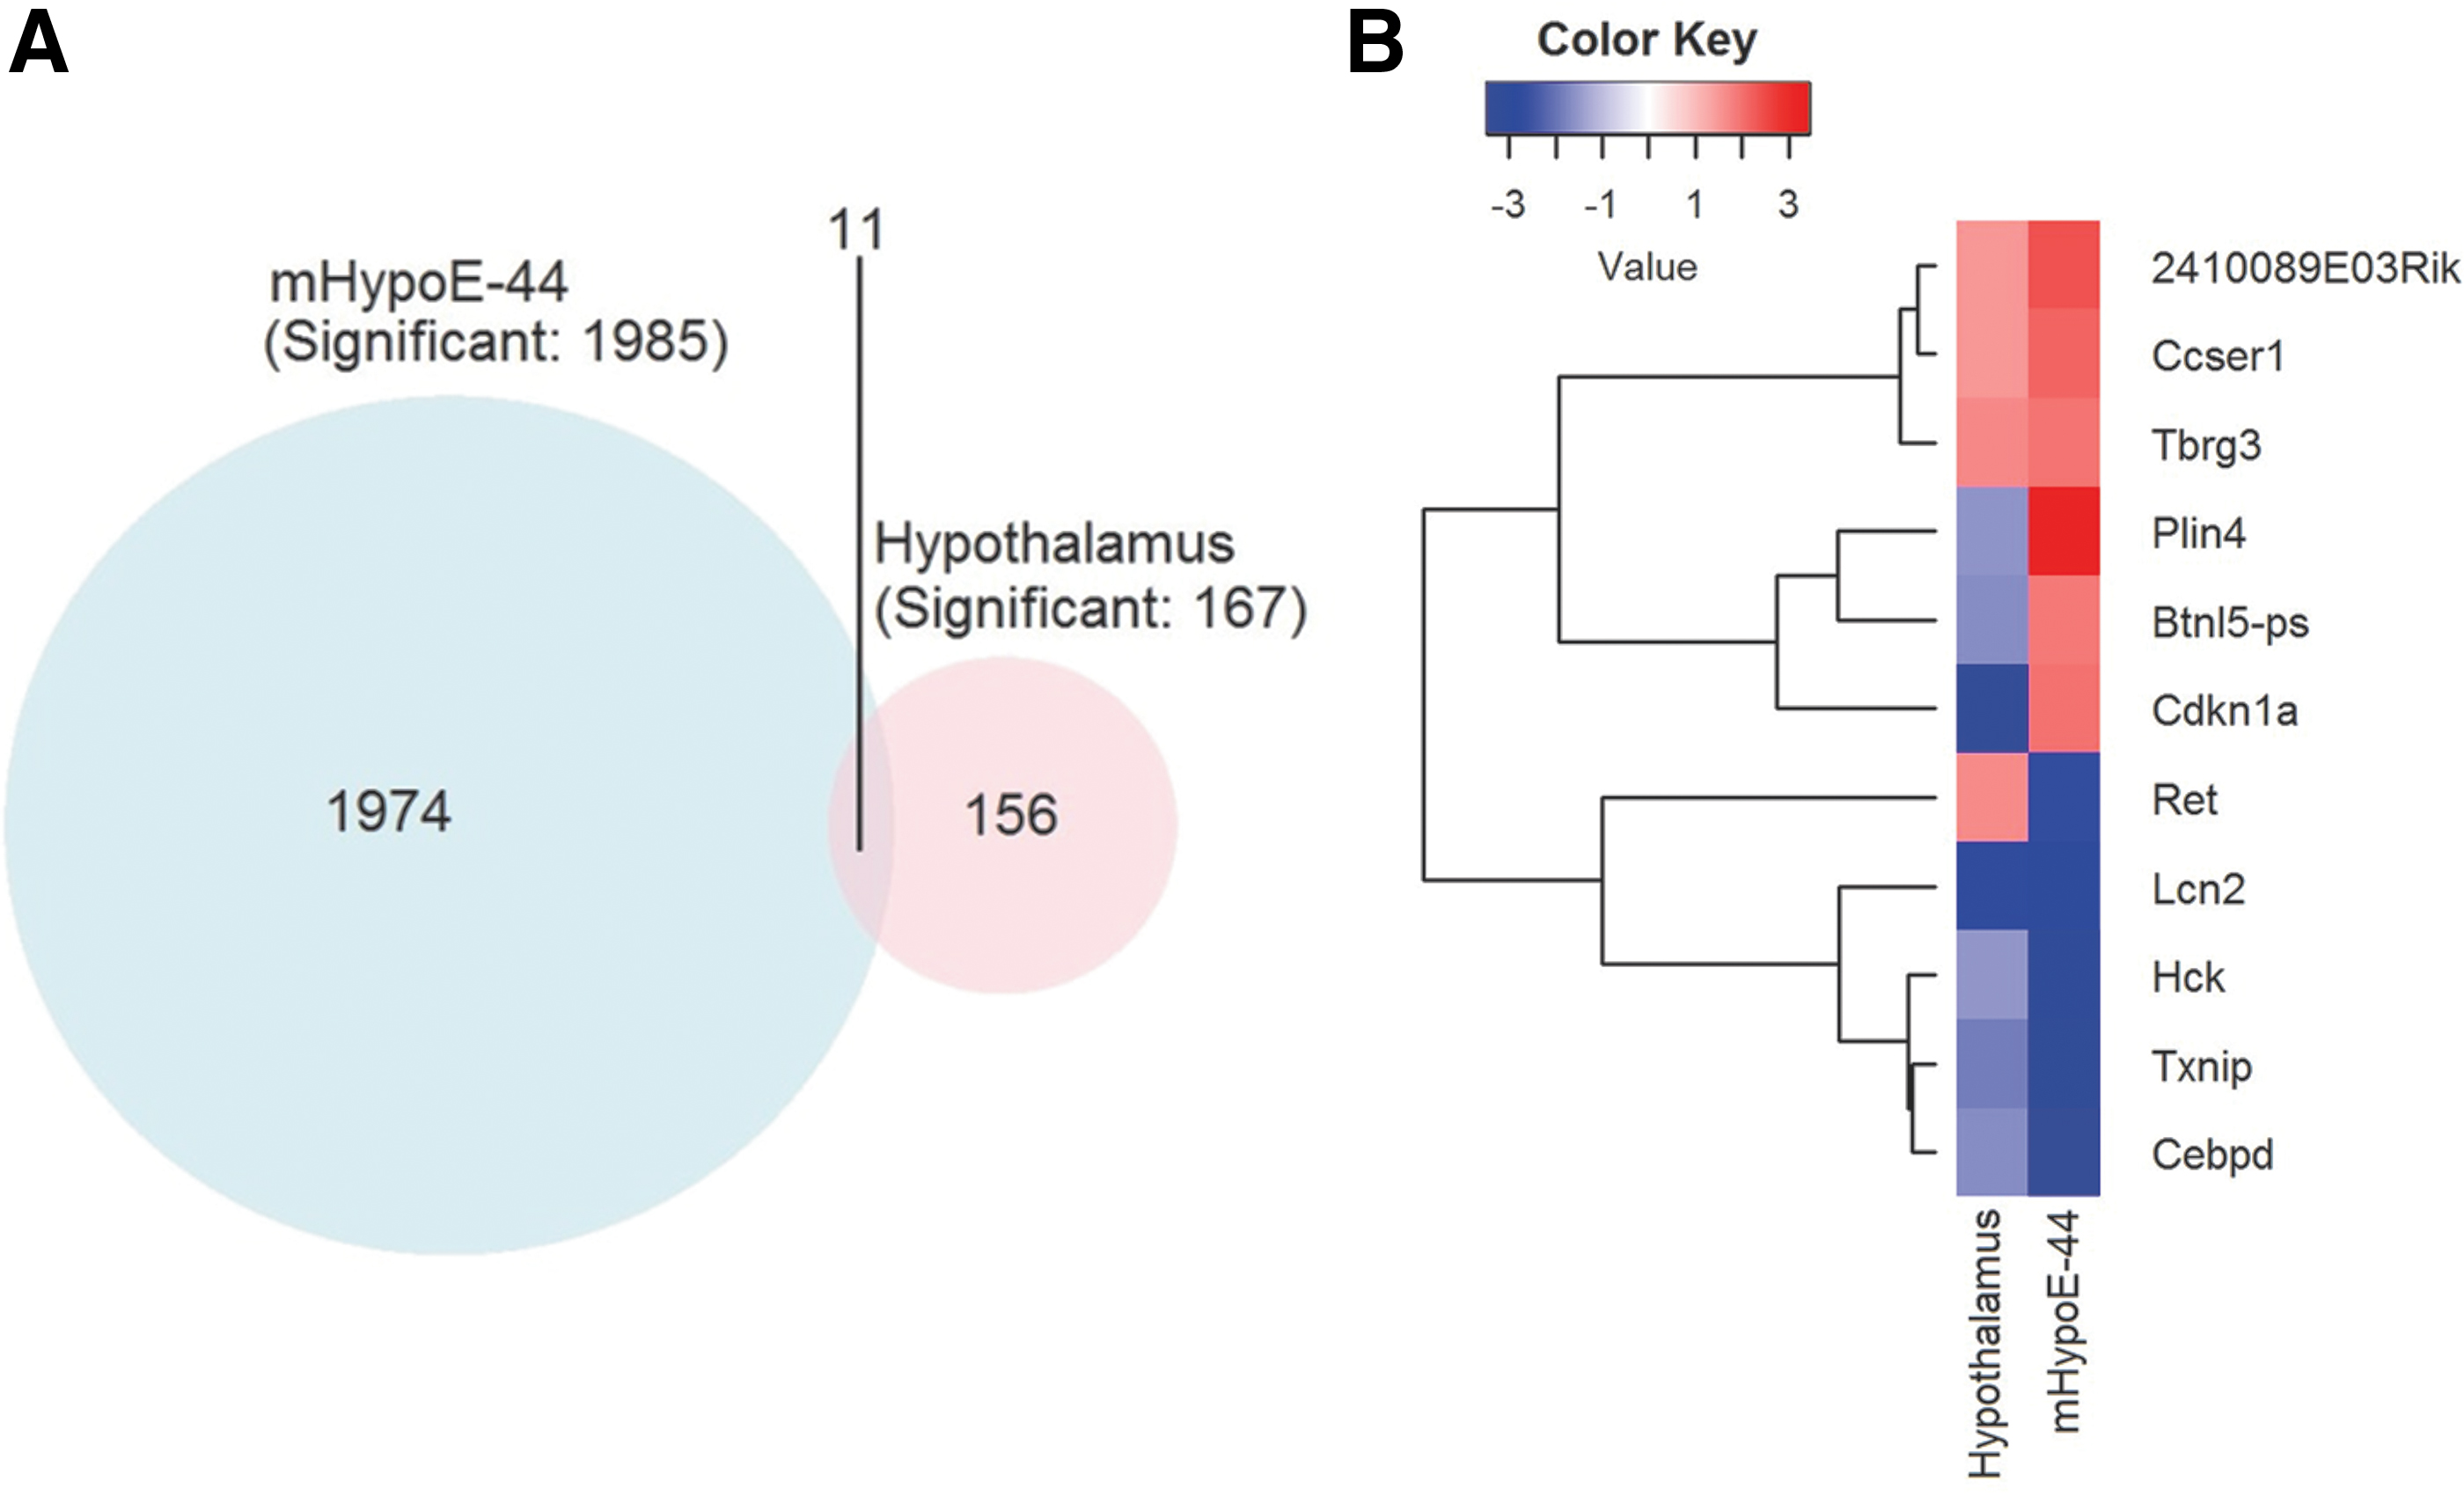
To gain further insight into the genes and signaling pathways regulated by SELENOM, we conducted microarray analysis on mHypoE-44 cells and hypothalamic tissue samples from 10-week-old mice. Genes showing fold changes greater than 1.5 and p-values <0.01 were considered differentially expressed genes (DEGs). Our analyses revealed 167 and 1983 DEGs in hypothalamic tissue and mHypoE-44 cells, respectively (Fig. 5A; Supplementary Table S1). We speculate that the smaller number of DEGs observed in hypothalamic tissue was largely due to the heterogeneous variety of cell types present in this sample. Among the identified DEGs, 11 genes were significantly altered in both hypothalamic tissue and mHypoE44 cells (Fig. 5B). One gene of significant interest was the thioredoxin interacting protein (TXNIP), a known negative regulator of TXN and mTOR-dependent signaling (18, 28), which was found downregulated in both tissue and cells. Moreover, of particular relevance to our study, TXNIP has also been implicated in the modulation of hypothalamic leptin signaling (3, 4).
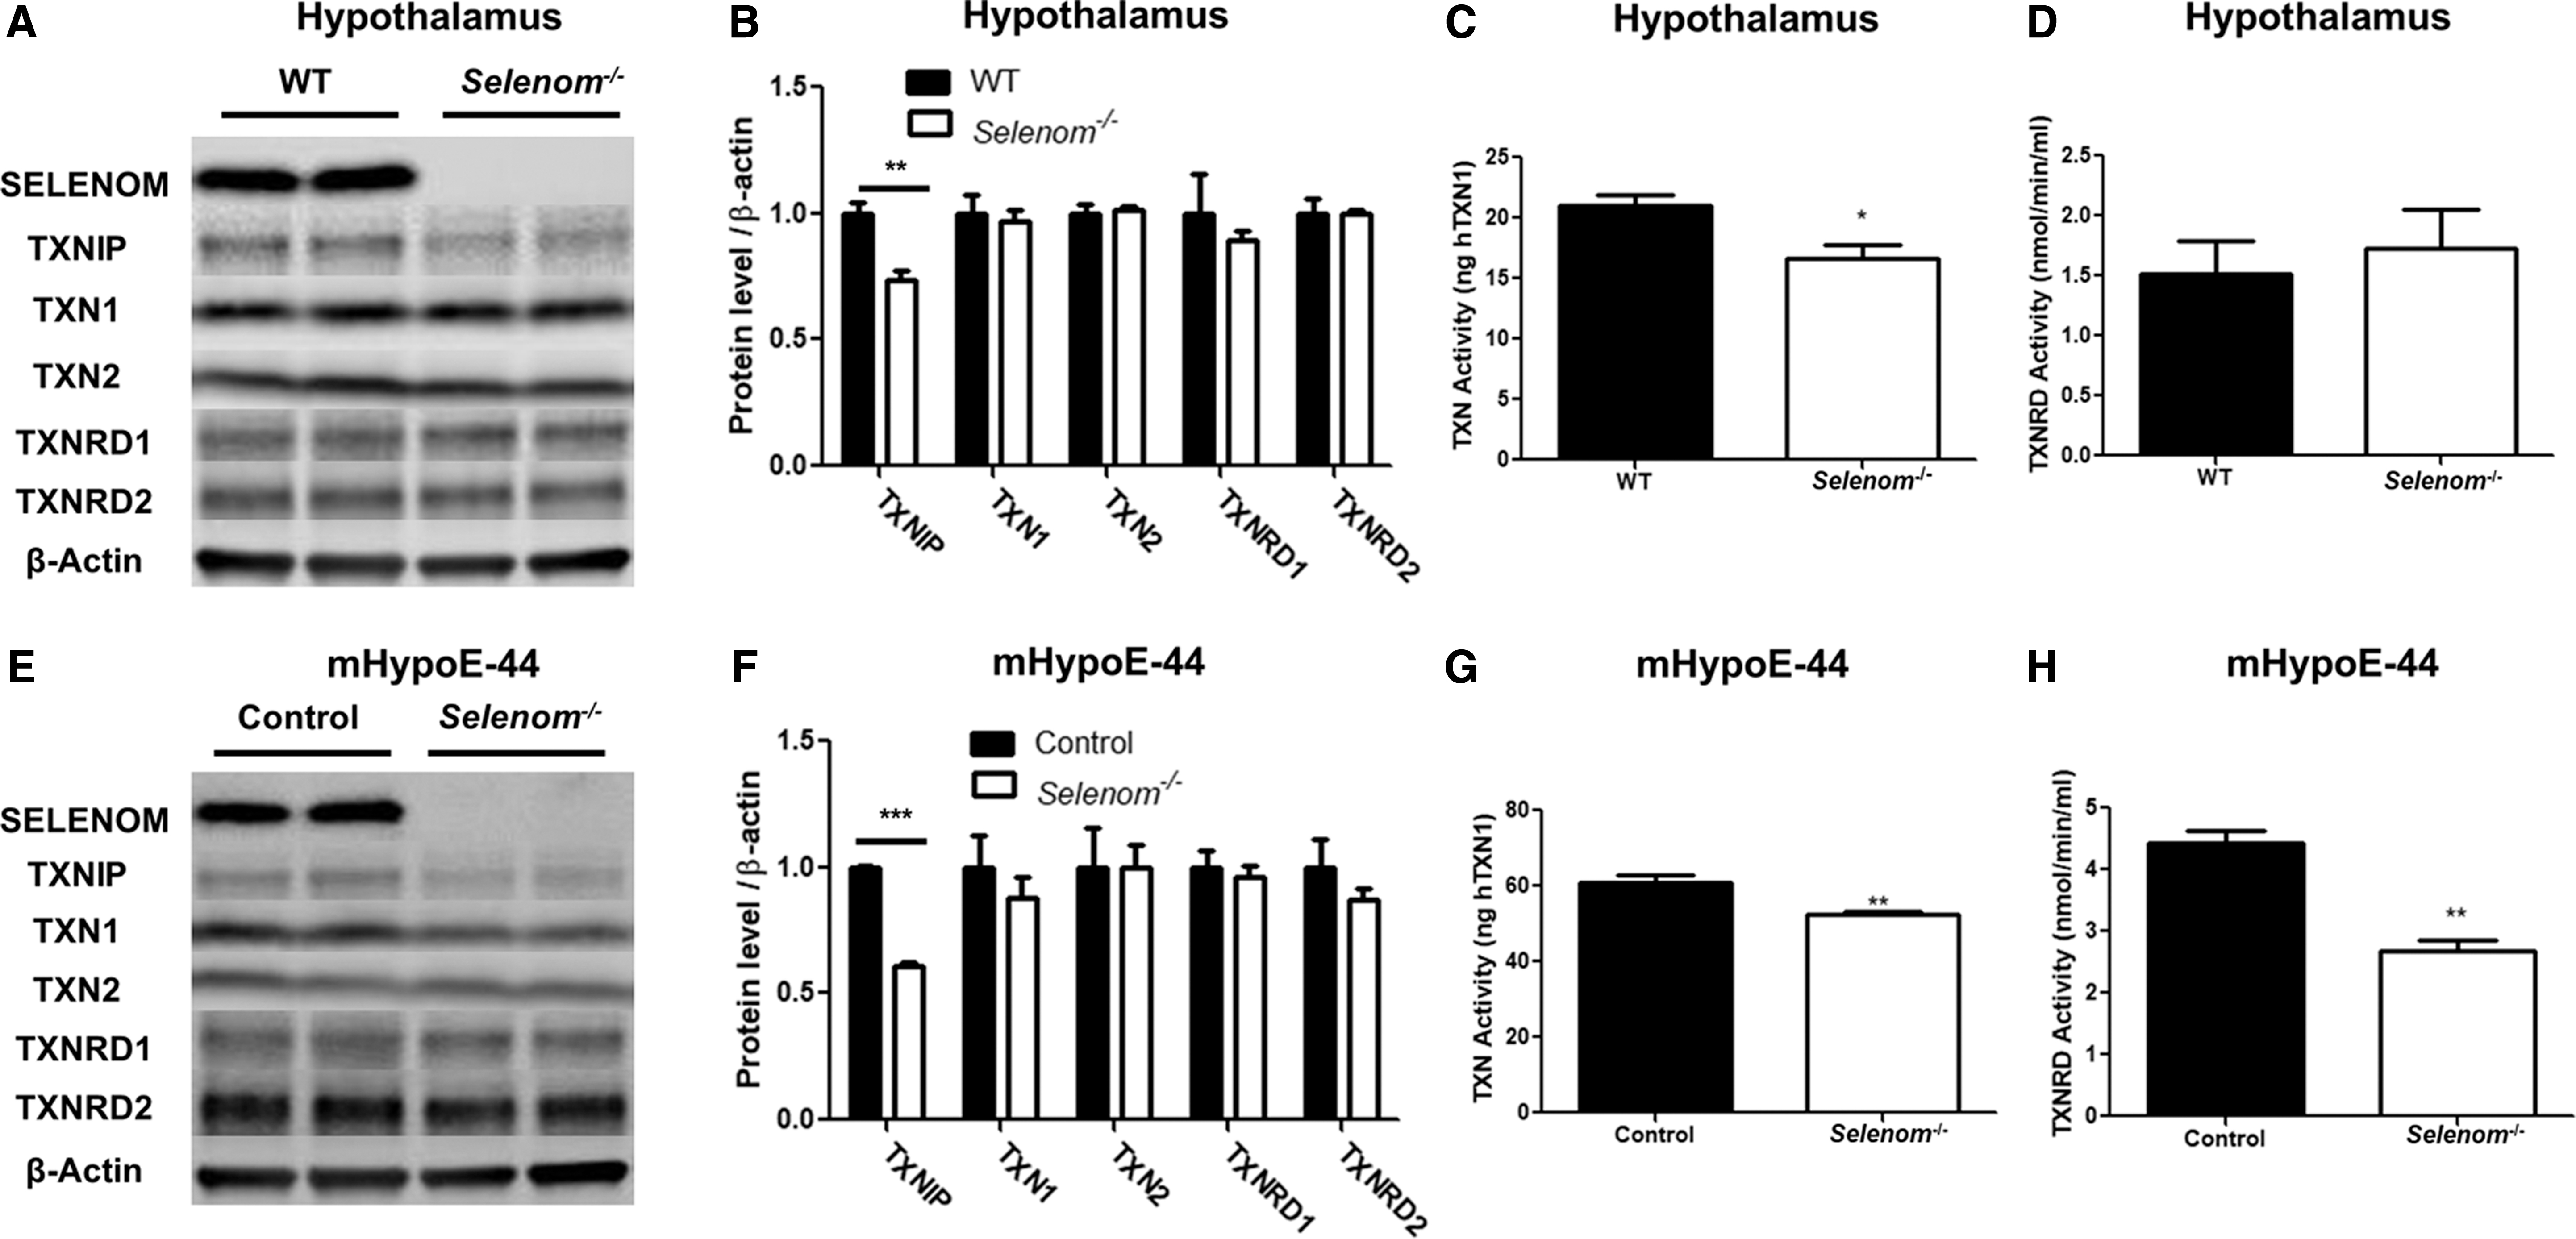
Given that SELENOM is considered a member of the TXN superfamily, we speculated that decreased TXNIP expression may be a compensatory response to SELENOM ablation. To examine the influence of SELENOM on the TXN system, we performed a comprehensive evaluation of the TXN system in the samples used for our microarray analysis. Western blot analysis of hypothalamic samples confirmed that TXNIP expression was significantly attenuated by SELENOM deficiency, whereas levels of TXN1, TXN2, TXNRD1, and TXNRD2 were comparable between genotypes (Fig. 6A, B). In hypothalamic samples, TXN activity (Fig. 6C) was significantly lower in Selenom−/− samples, whereas TXNRD activity (Fig. 6D) did not differ. Parallel analysis of mHypoE-44 samples provided verification of reduced TXNIP levels in SELENOM-deficient cells (Fig. 6E, F). Likewise, no differences between genotypes were observed in the protein levels of TXN1, TXN2, TXNRD1, and TXNRD2 in cell culture samples. Activity assays showed both reduced TXN and TXNRD activity in mHypoE-44 cells lacking SELENOM (Fig. 6G, H). The reason that SELENOM deficiency would impact TXNRD activity in cell culture and not hypothalamic tissue is not entirely clear, but it is likely related to the vast differences between an actual brain structure consisting of multiple cell types and a clonal, immortalized cell line.
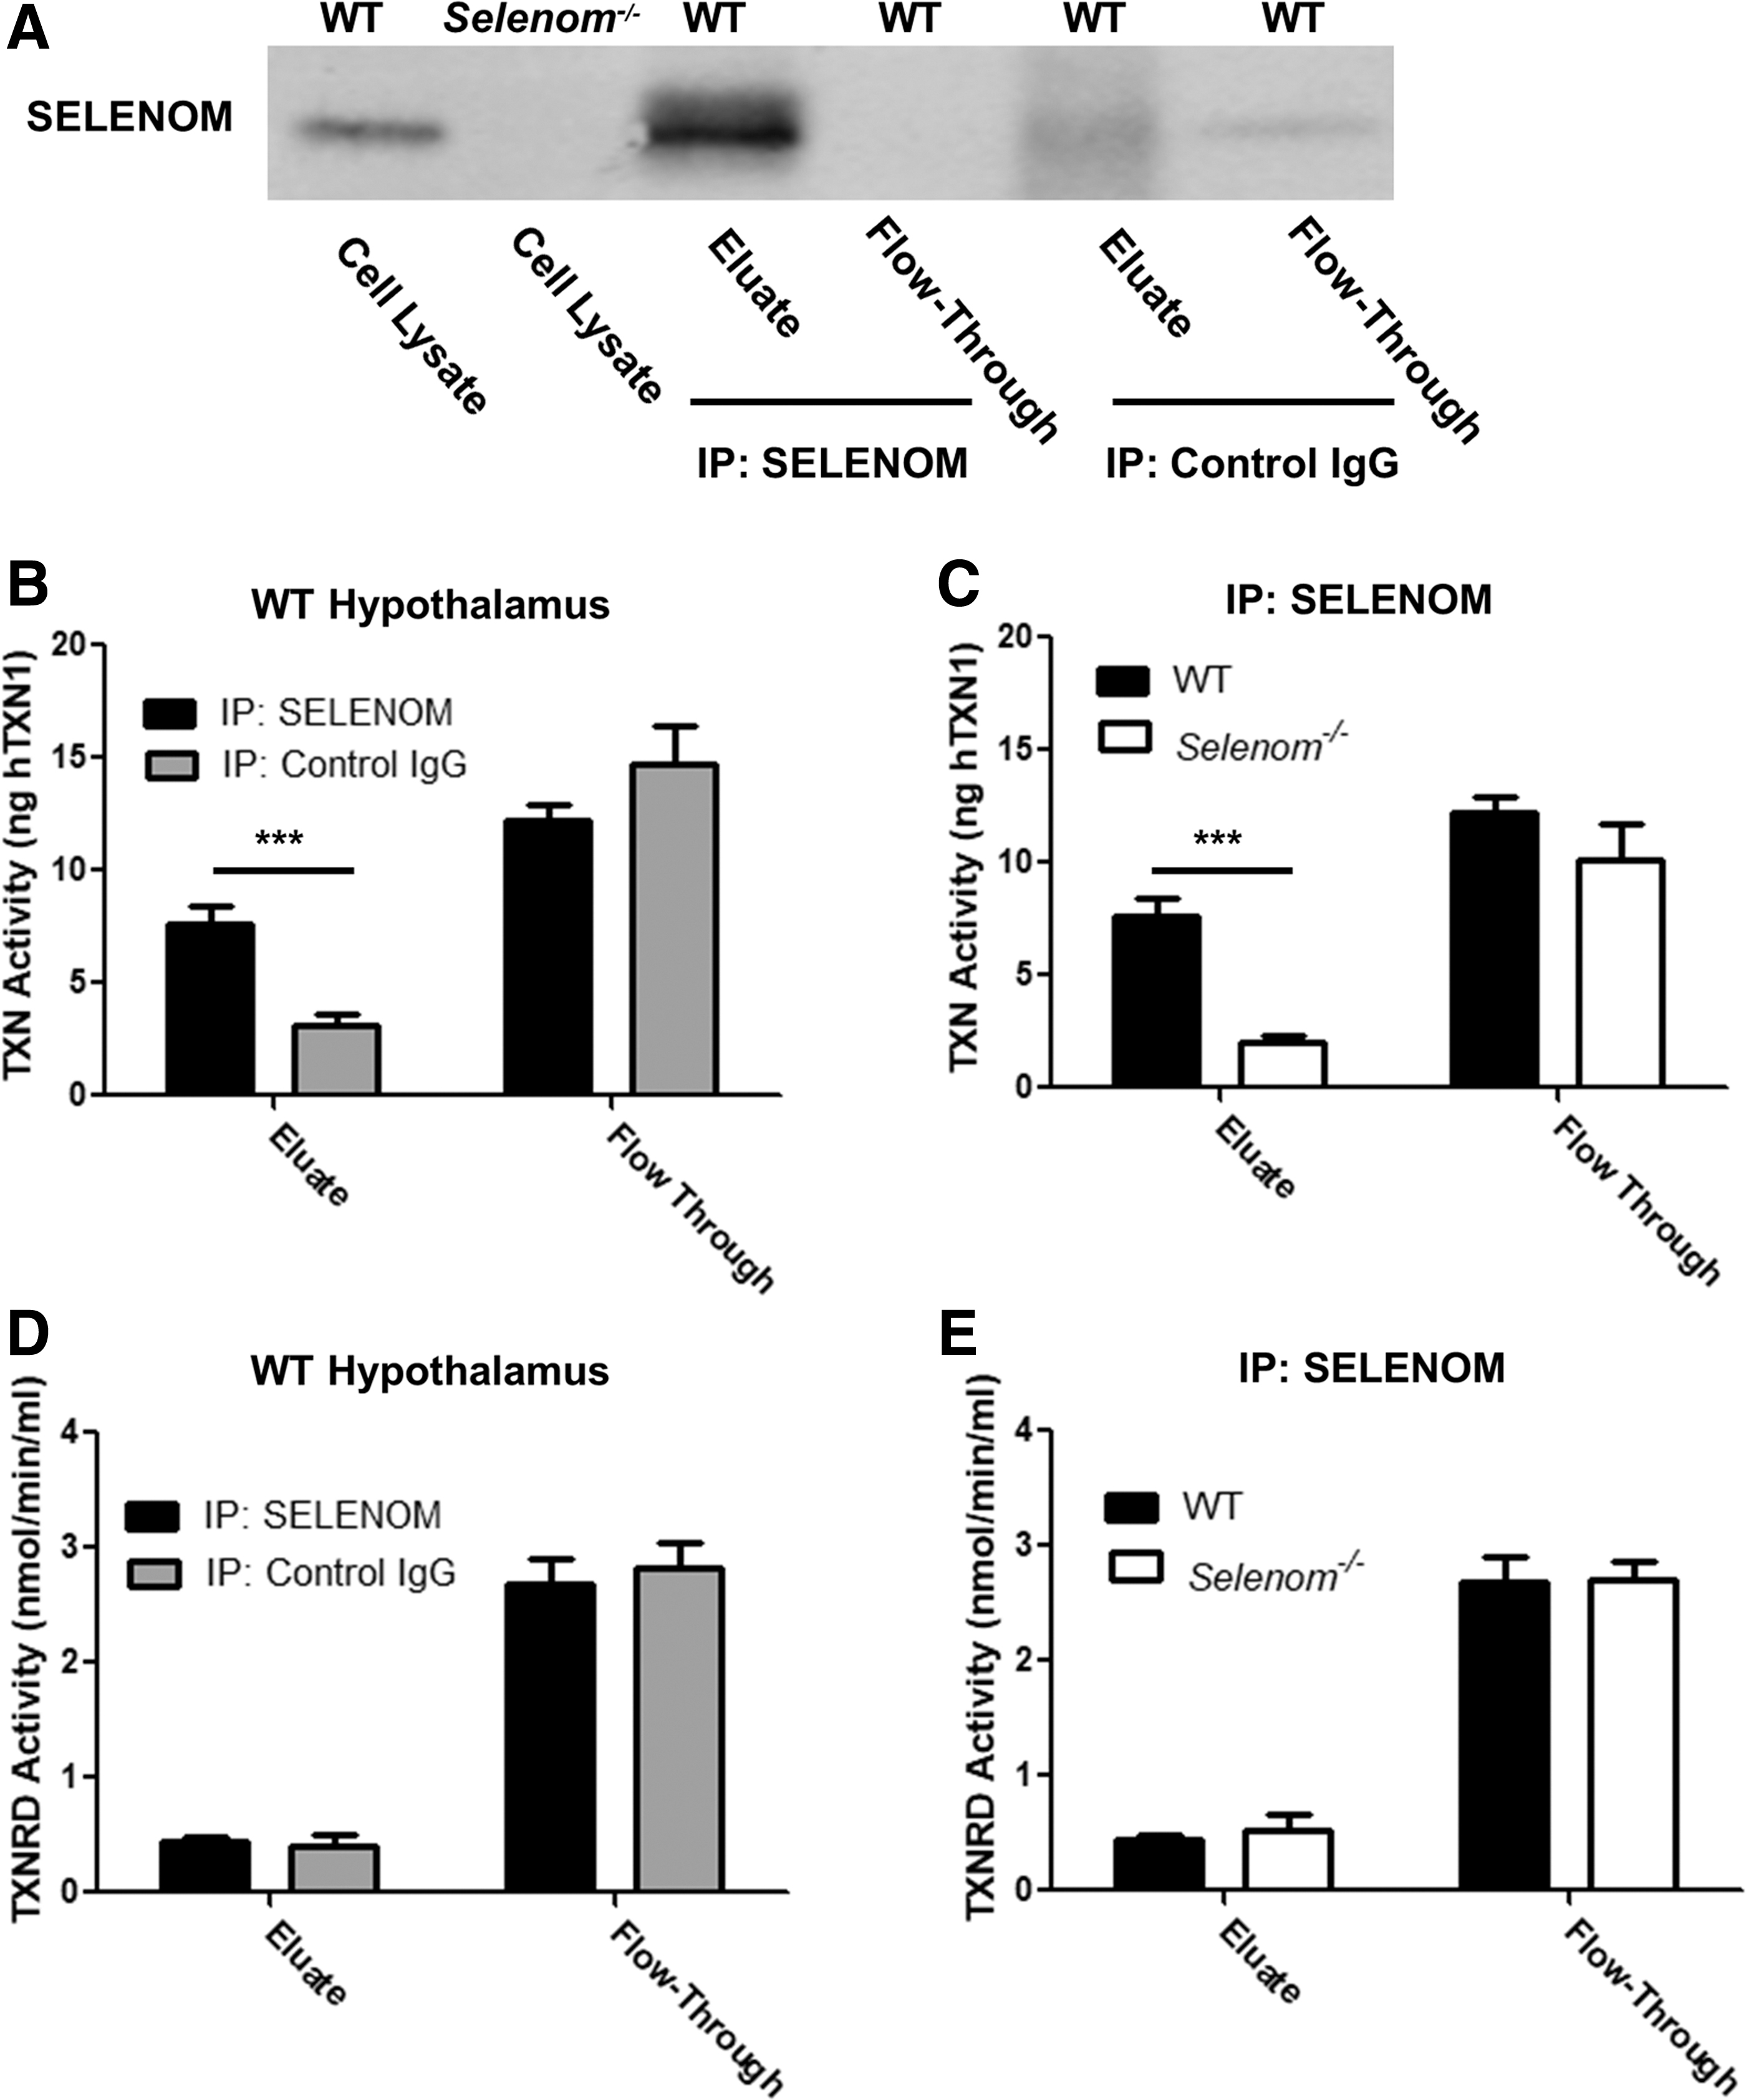
We next performed an additional set of studies to assess whether SELENOM possesses intrinsic TXN and/or TXNRD activity. First, using anti-SELENOM conjugated agarose beads, we immunoprecipitated SELENOM from hypothalamic tissue samples (Fig. 7A). Levels of SELENOM were enriched in the eluate fraction, whereas SELENOM was undetected in the unbound flow-through sample. In contrast, SELENOM was present in the flow-through when beads were conjugated with control Immunoglobin G (IgG). We then evaluated TXN activity in samples either enriched (eluate) or depleted (flow-through) of SELENOM (Fig. 7B). Eluates from WT mice displayed significantly higher levels of TXN activity in comparison to both WT samples immunoprecipitated with control IgG (Fig. 7B) and Selenom−/− samples immunoprecipitated with anti-SELENOM (Fig. 7C). TXN activity was comparable in the flow-through fractions from all groups analyzed. Similar experiments were conducted to evaluate TXNRD activity in SELENOM-enriched samples (Fig. 7D, E). Levels of TXNRD activity were similar in all eluate fractions analyzed and were several fold lower than those observed in flow-through fractions. In summary, these experiments show that SELENOM contributes to the hypothalamic TXN system by means of intrinsic TXN activity.
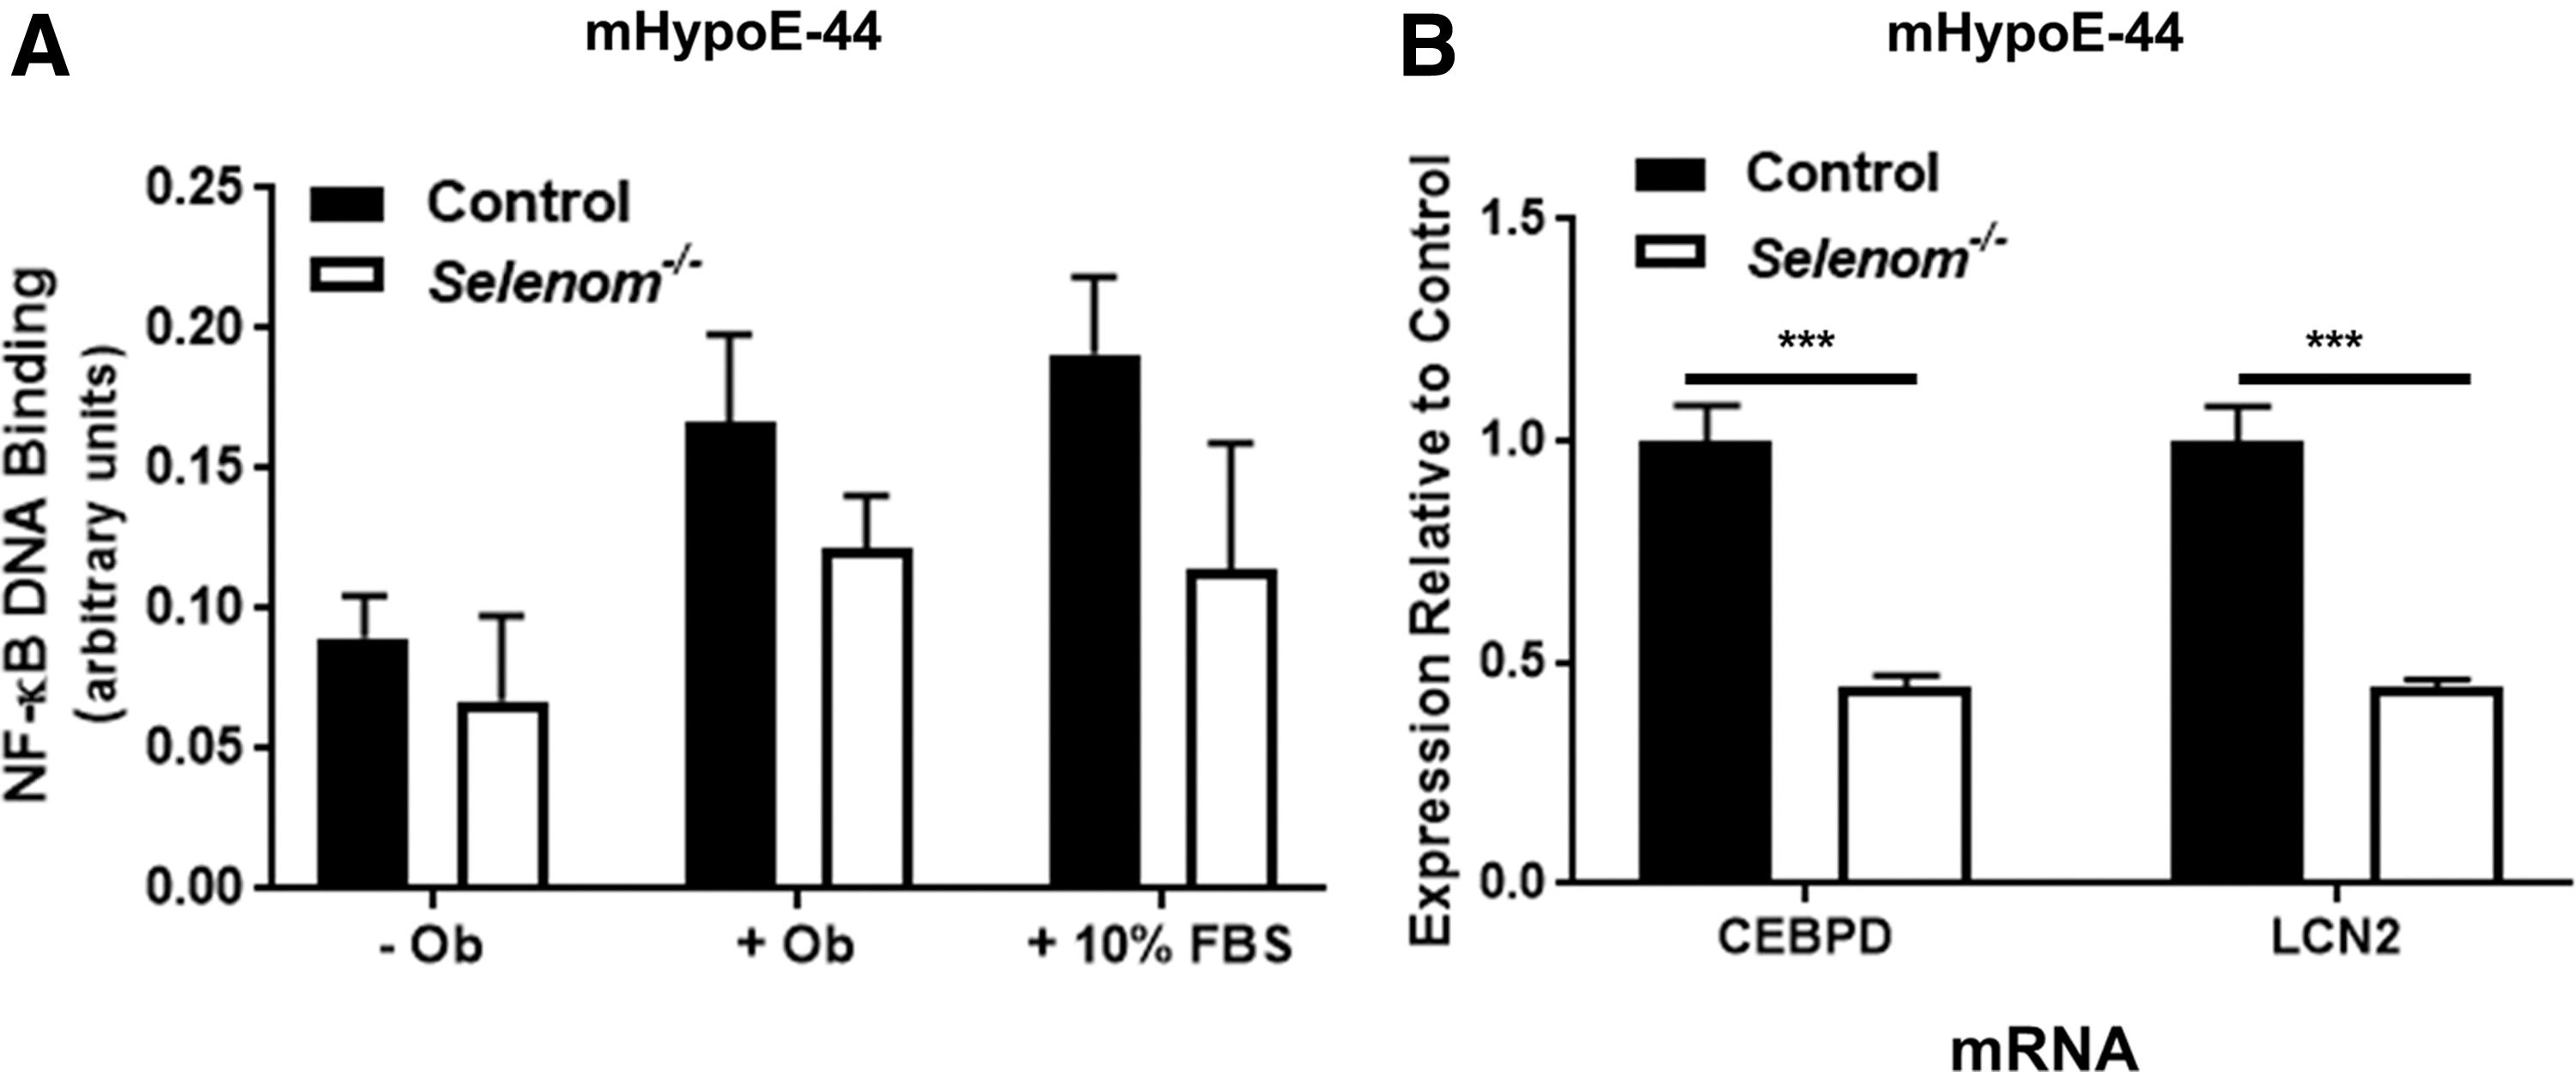
To further validate the functional contribution of SELENOM to TXN activity, we also assessed nuclear factor kappa-light-enhancer of activated B-cells (NF-κB) activation in our mHypoE-44 cell line. TXN has been previously shown to promote NF-κB DNA binding by means of disulfide bond reduction and denitrosylation on the p50 and p65 subunits, respectively (19, 25). Moreover, leptin is also known to stimulate NF-κB activation (6, 17). Thus, we examined NF-κB DNA binding under baseline conditions (-Ob) and in response to treatment with either leptin or 10% fetal bovine serum (FBS). As anticipated, both leptin and FBS promoted NF-κB activation (Fig. 8A), as two-way analysis of variance (ANOVA) analysis showed a significant main effect for treatment. We also observed a significant main effect for genotype, with Selenom−/− cells exhibiting lower levels of NF-κB activation across all treatment conditions. Of additional significance, two important NF-κB target genes, CCAAT/enhancer-binding protein delta (CEBPD) and lipocalin 2 (LCN2), were found to be significantly downregulated by SELENOM deficiency in our microarray analysis. These changes in expression were validated by quantitative polymerase chain reaction (PCR) in our mHypoE-44 cell line, providing additional corroboration that SELENOM facilitates activation of the NF-κB pathway (Fig. 8B).
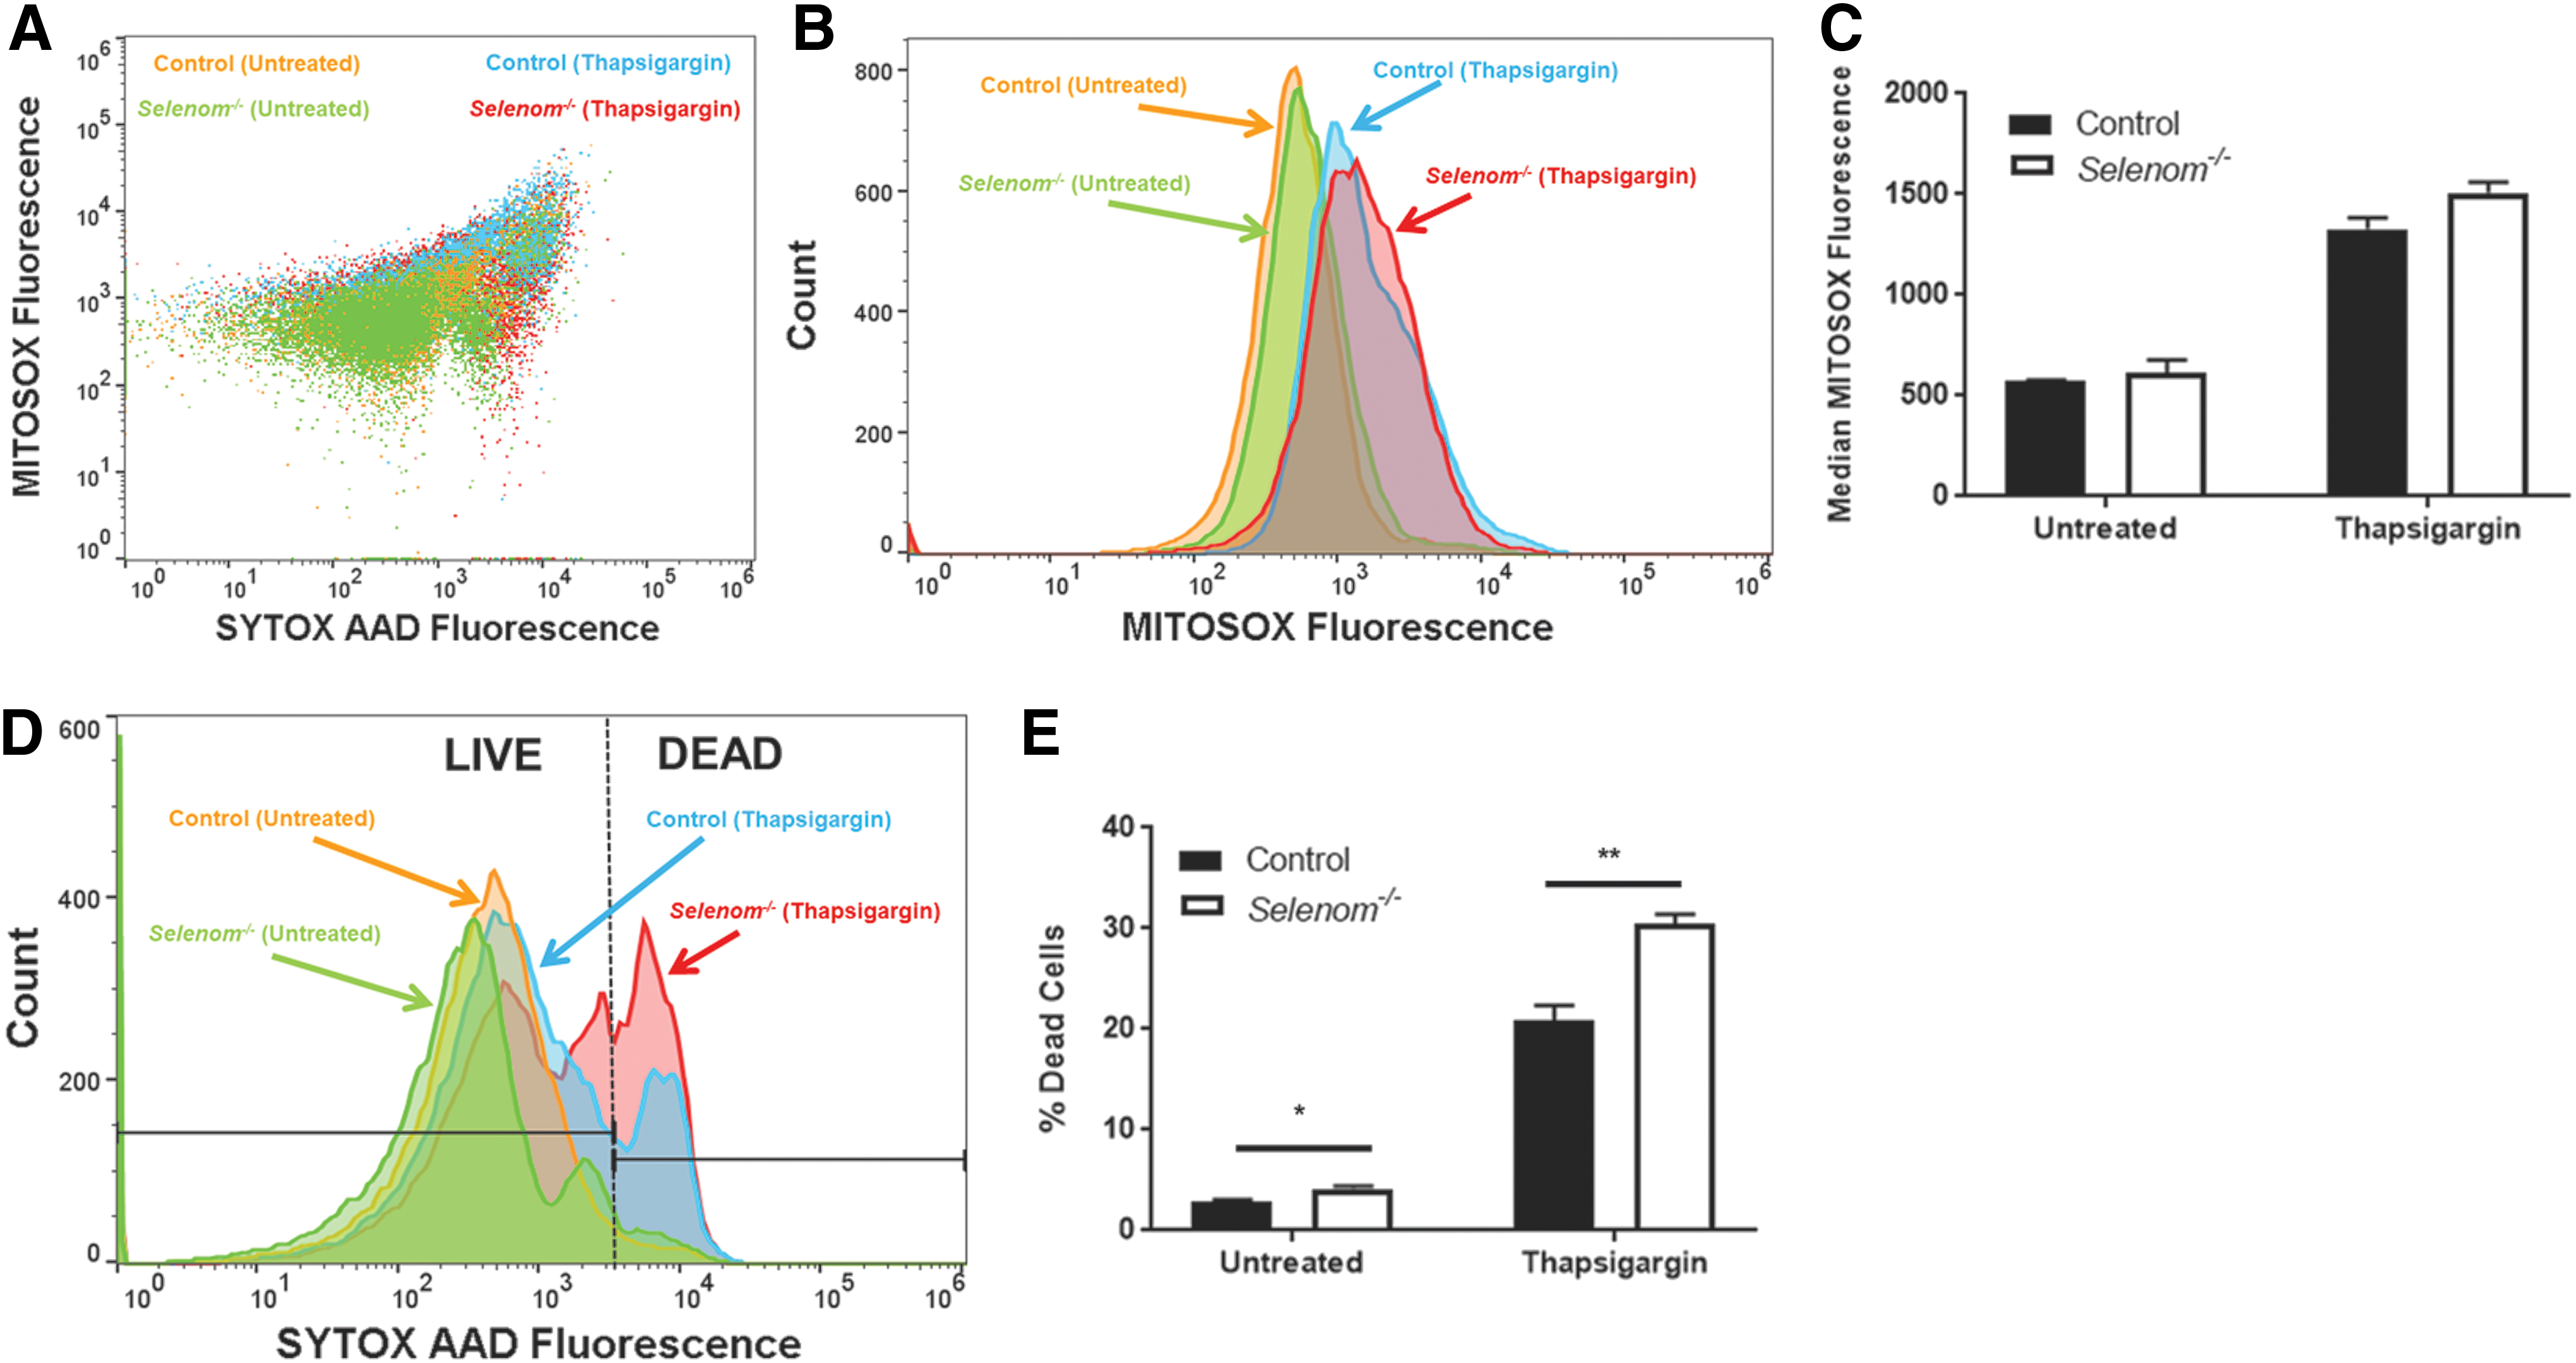
Our final set of experiments utilized flow cytometry to assess the influence of SELENOM on mitochondrial ROS (mtROS) and cell viability in the presence of ER stress. ER stress was induced by treating mHypoE-44 cells with the SERCA pump inhibitor, thapsigargin (Tg) (4 μM), for ∼2 h before analysis. For this study, we utilized the fluorescent indicators, MitoSOX and SYTOX AADvanced (SYTOX AAD), to measure mtROS and cell death, respectively. This allowed for simultaneous detection of mtROS and cell viability in individual cells using separate fluorescent channels (Fig. 9A). We found that baseline mtROS levels were comparable between control and Selenom−/− cells and that Tg treatment led to a significant elevation in mtROS production (Fig. 9B, C). In response to Tg, Selenom−/− cells showed a trend toward increased mtROS that approached statistical significance relative to controls (p = 0.056). More apparent was the observation that Selenom−/− cells were especially vulnerable to the deleterious effects of ER stress, as indicated by increased levels of SYTOX AAD, a cell-impermeable nucleic acid stain for the detection of dead cells (Fig. 9D). On setting a threshold of SYTOX AAD fluorescence for dead cells using Fluorescence Minus One gating analysis, a significantly greater percentage of Selenom−/− cells were nonviable relative to corresponding control cells. This difference was observed in the untreated condition and further enhanced by ER stress (Fig. 9E). Overall, these cumulative results demonstrate that when confronted with ER stress, the presence of SELENOM allows cells to tolerate higher levels of mtROS and remain viable.
Discussion
The importance of hypothalamic selenoproteins to leptin signaling was recently illuminated in a study involving conditional deletion of the Sec-specific tRNA (Trsp) in cells expressing Cre-recombinase under the control of the rat insulin promoter (RIP-Cre) (43). The resulting mouse model (TrspRIP-Cre ) had disrupted selenoprotein synthesis in both hypothalamus and pancreas, as RIP is usually expressed in pancreatic β-cells and within certain hypothalamic cells. On challenge with a high-fat diet (HFD), TrspRIP-Cre mice displayed increased hypothalamic levels of oxidative stress and diminished leptin sensitivity relative to controls. Comparable results were not observed in another mouse model (TrspIns1-Cre ) where Cre-recombinase expression was restricted to pancreatic β-cells by an alternative promoter (Ins1-Cre), leading the authors to conclude that selenoprotein synthesis within the hypothalamus, but not the pancreas, is necessary for normal leptin sensitivity (43). Our results build on these findings and specifically delineate SELENOM as an important mediator of hypothalamic leptin signaling.
The data presented herein add to an accumulating body of evidence indicating that cellular redox status is a critical influence on leptin sensitivity. SELENOM is a member of the TXN superfamily, a group of oxidoreductases that catalyze disulfide bond formation by means of a thiol-disulfide exchange. The two defining features of TXNs are: (i) a CxxC active site motif and (ii) a characteristic tertiary structure consisting of four antiparallel beta sheets sandwiched between three alpha helices referred to as a TXN fold (24). In the case of SELENOM, the second cysteine residue of the active site motif is replaced by Sec, a substitution believed to accelerate thiol-like/disulfide exchange reactions (16). Disulfide bonds in TXNs are reduced by TXNRDs through an NADPH-dependent mechanism where electrons are taken from NADPH by TXNRDs and transferred to TXNs. TXN, TXNRD, and NADPH together constitute the TXN system, an antioxidant system essential to mammalian life (1). Disturbances in the TXN system have been linked to metabolic syndrome (38), most prominently through TXNIP (31). This protein binds TXN with high affinity and effectively silences its ability to reduce target substrates (28). In response to severe ER stress, TXNIP is rapidly upregulated through the IRE1 and PERK pathways, leading to activation of the NLRP3 inflammasome and subsequent cell death (21, 29). Hypothalamic TXNIP also appears to be a significant player in energy metabolism, as experimental studies found that hypothalamic-specific knockdown of TXNIP protects against an HFD (4). Further studies by the same research group also demonstrated that overexpression of TXNIP in AGRP neurons reduces energy expenditure and impairs leptin sensitivity (3). In our study, TXNIP levels were significantly attenuated by SELENOM deficiency, an outcome that we hypothesize was a countermeasure to boost TXN activity and mitigate redox imbalance. Nevertheless, the reduction in TXNIP expression was not sufficient to normalize TXN activity, as reduced TXN activity was observed in Selenom−/− samples.
To our surprise, SELENOM deficiency did not alter the expression of PTP1B or SOCS3, two established suppressors of intracellular leptin signaling known to be upregulated by ER stress (2, 33, 41, 44). In both our microarray studies on hypothalamic tissue and mHypoE-44 cells, neither of these genes was significantly affected, even when we decreased the stringency of the p-value to 0.05 for additional analysis. However, of the four genes found significantly downregulated in cells and tissue, three (CEBPD, LCN2, TXNIP) represent documented NF-κB target genes (7, 22, 35). These array results are consistent with our finding that SELENOM promotes both TXN and NF-κB activity, as TXN is known to facilitate NF-κB signaling by reducing redox-sensitive cysteine residues in the p50/p65 heterodimer through disulfide bond reduction and denitrosylation (19, 25). Extensive crosstalk occurs between the NF-κB and ER stress pathways, and both these pathways converge to stimulate transcriptional programs that promote antioxidant defense, cell survival, and inflammation (12, 42). There is also broad dialogue between the NF-κB and STAT3 pathways, which can be either antagonistic or cooperative in nature depending on the cell type and physiological context (14). For example, forced activation of the NF-κB pathway in the hypothalamus has been shown to occlude leptin-induced STAT3 signaling (45). Conversely, both the NF-κB and STAT3 pathways are constitutively active in many cancers and serve to promote cell survival and proliferation (5, 8, 13).
It is plausible that the decreased leptin sensitivity observed in Selenom−/− samples may result from disrupted communication between the leptin receptor and ER proteins involved in Ca2+ signaling. This notion is supported by our Ca2+ imaging data, in which SELENOM-deficient cells showed no discernible response to leptin. Of potential importance, two other ER-resident selenoproteins, SELENOK and SELENON, have been recently found to indirectly regulate Ca2+ signaling via interactions with the inositol triphosphate receptor (11) and the SERCA2 pump (23), respectively. Although the precise mechanism remains to be established, it is conceivable that SELENOM acts by means of a similar redox mechanism involving the reduction of thiol groups on specific ER Ca2+ channels and/or pumps.
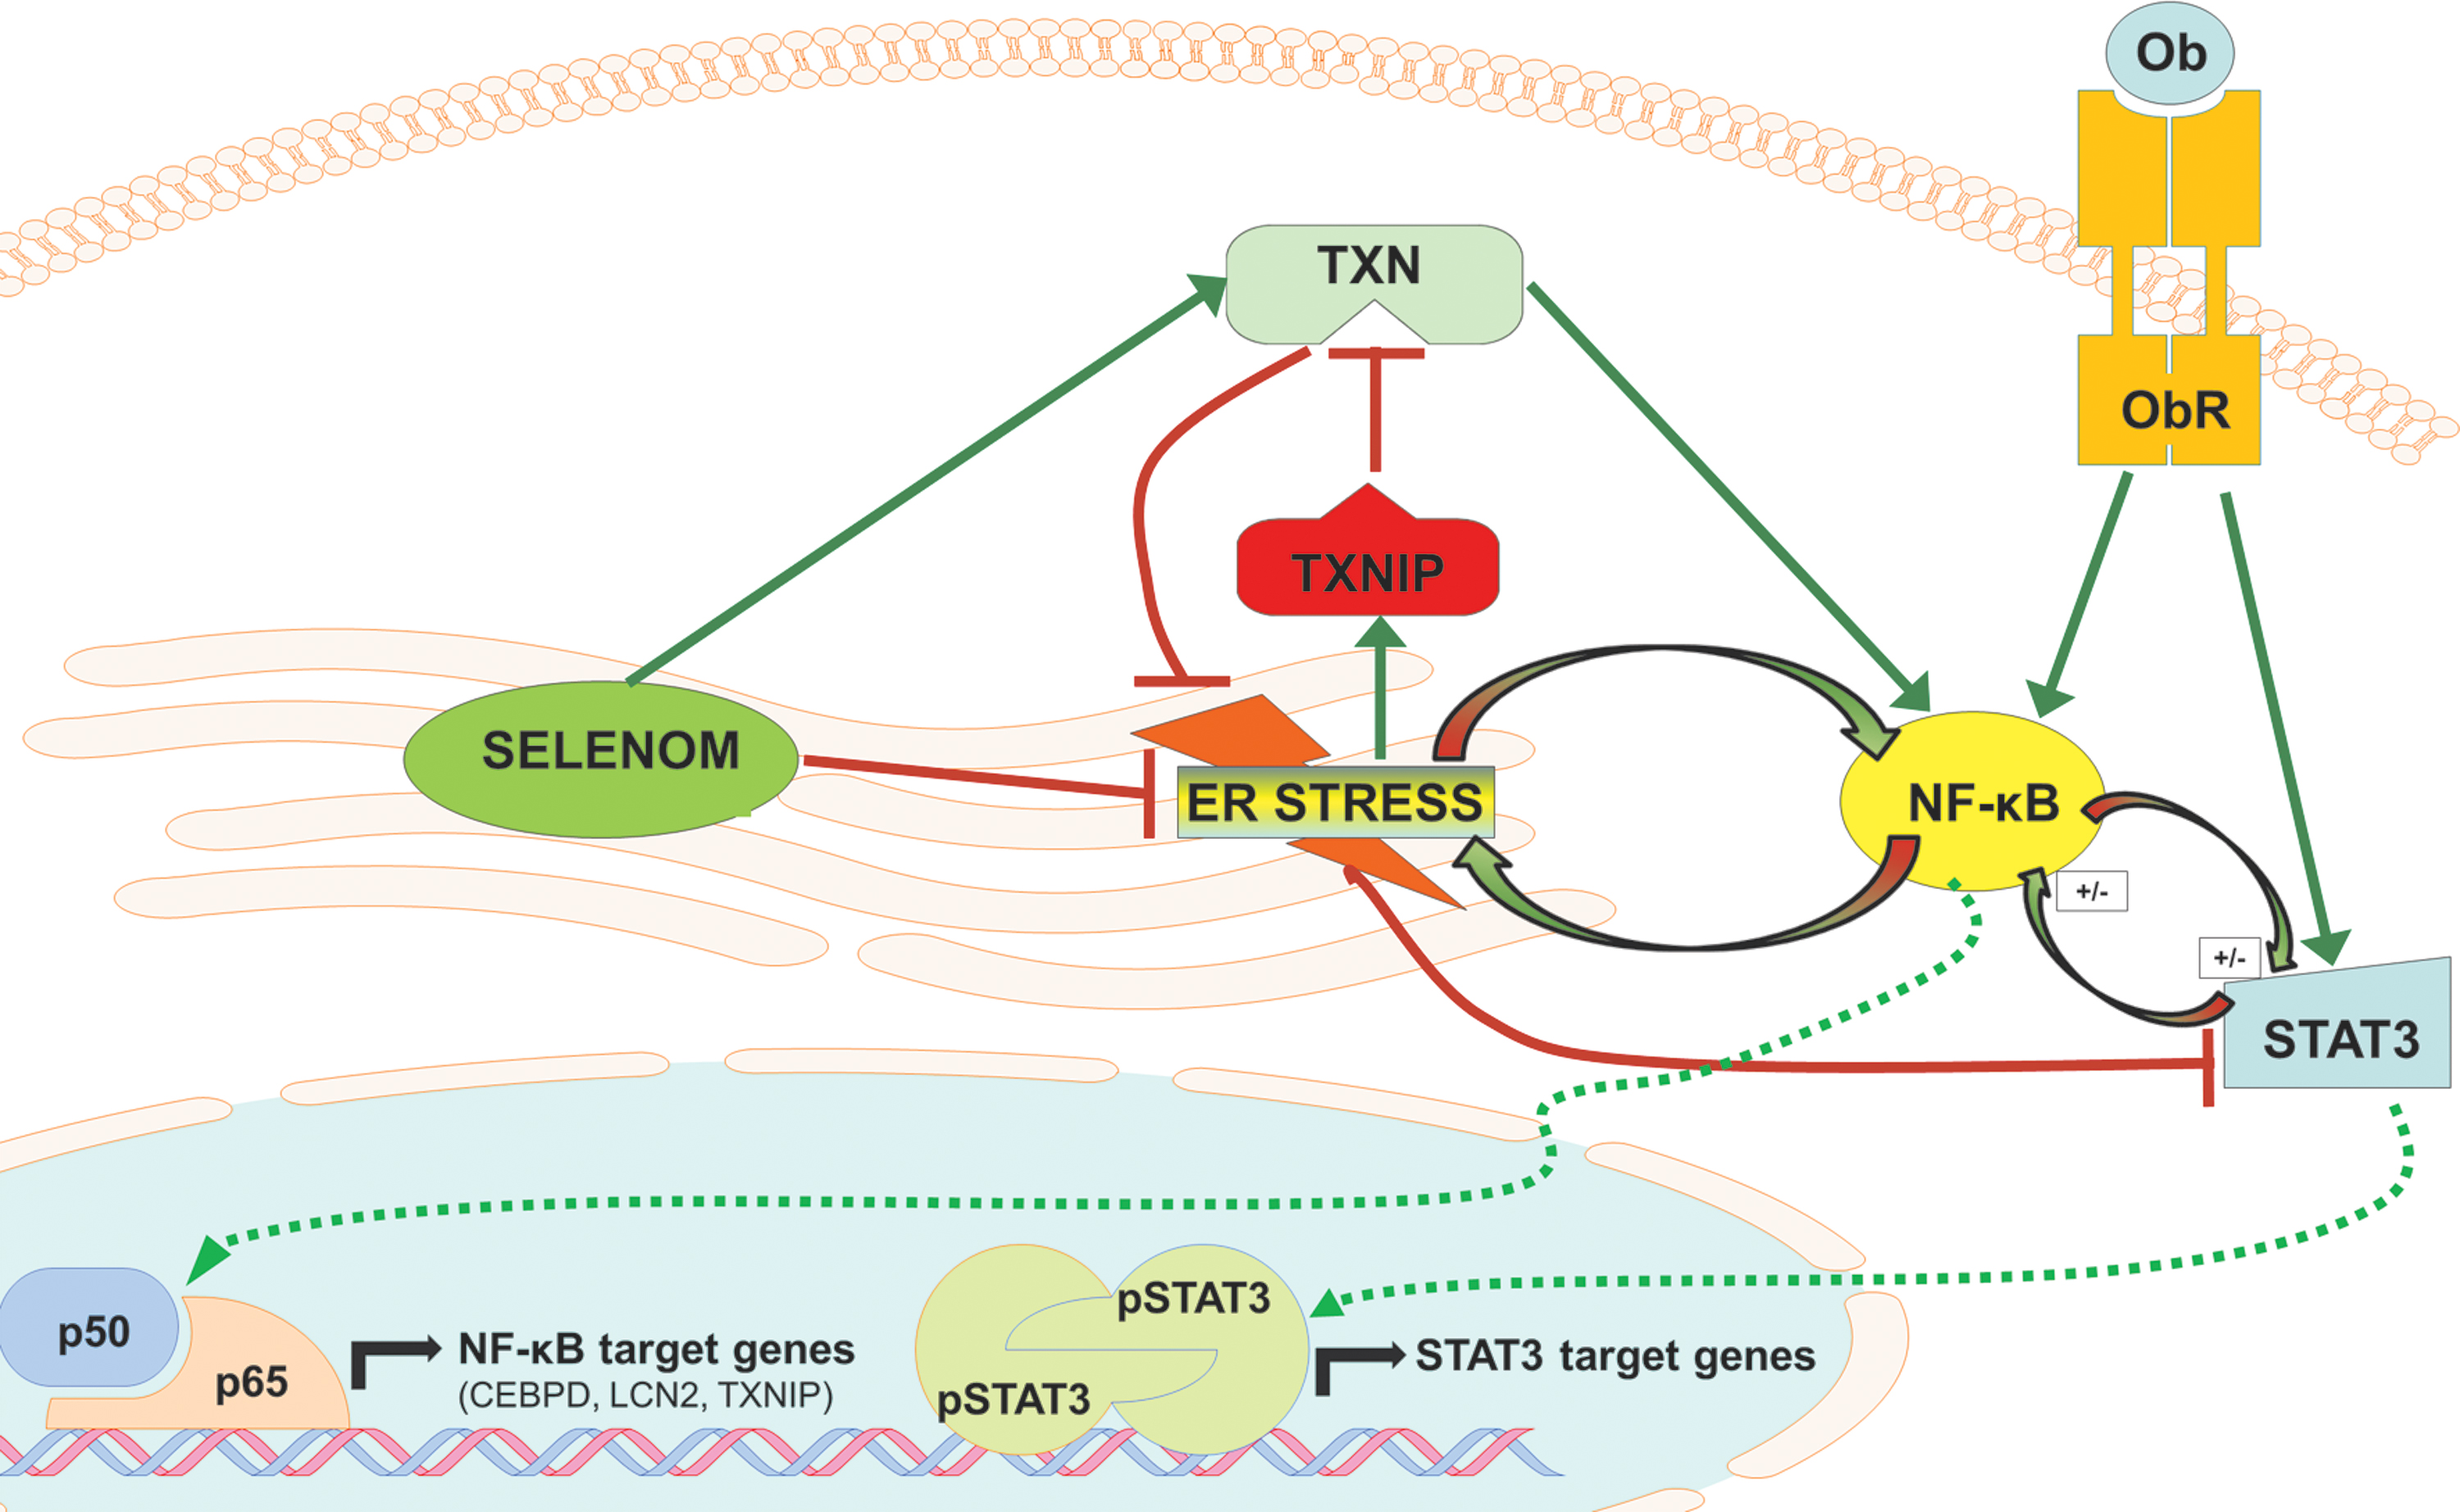
In conclusion, our findings provide novel evidence revealing that SELENOM is a positive modulator of both leptin signaling and TXN activity in the hypothalamus (Fig. 10). Selenom−/− mice were observed to develop obesity and leptin resistance in earlier studies, but whether impairments in leptin signaling were the cause or a consequence of obesity was undetermined (32). The results of this study conclusively show that SELENOM deficiency impairs leptin signaling both in vitro, in immortalized hypothalamic cells, and in vivo, in 10-week-old nonobese mice. Moreover, our data demonstrate that SELENOM exhibits intrinsic TXN activity and represents an important contributor to the overall TXN antioxidant system in the hypothalamus.
Materials and Methods
Mice
Male wild-type and Selenom−/− mice on a C57BL/6N background were born and bred in the University of Hawaii Vivarium as previously described (32). All animals were group-housed and fed standard lab chow containing ∼0.25 ppm Se. All procedures and experimental protocols were approved by the University of Hawaii's Institutional Animal Care and Use Committee.
In vivo leptin challenge
Ten-week-old mice were fasted overnight, given an intraperitoneal injection of leptin (1 μg leptin/g body weight), and sacrificed 1 h later by CO2 asphyxiation. Whole brains were quickly removed, and the hypothalamus was isolated under a dissecting microscope and snap-frozen for later analyses.
Hypothalamic dissection
Mouse brains were briefly immersed in 0.32 M ice-cold sucrose and then placed ventral side up in a mouse brain matrix with slice intervals of 1 mm. A 3-mm-thick coronal section containing the hypothalamus was obtained by placing one razor blade at the level of the optic chiasm and a second blade 3 mm posterior to the first. The resulting section was placed on filter paper, and the hypothalamus was extracted with a scalpel under a dissecting microscope. Cuts were made at the roof of the third ventricle dorsally and at the fornix laterally to dissociate the hypothalamus from surrounding tissue.
Antibodies and chemicals
The primary antibodies used in these experiments were rabbit anti-phospho-Stat3 Tyr705 (Cat # 9145, 1:1000; Cell Signaling Technology, Danvers, MA), rabbit anti-Stat3 (Cat # 8768, 1:1000; Cell Signaling), mouse anti-SELENOM (Cat # sc-514952, 1:500; Santa Cruz Biotechnology, Dallas, TEX), mouse anti-TXN (Cat # sc-166393, 1:500; Santa Cruz), mouse anti-TXN 2 (Cat # sc-13320, 1:500; Santa Cruz), rabbit anti-TXNRDs 1 (Cat # NBP1-96738, 1:1000; Novus Biologicals, Littleton, CO), mouse anti-TXNRDs 2 (Cat # 365714, 1:500; Santa Cruz), mouse anti-TXNIP (Cat # sc-13320, 1: 500; Santa Cruz), and mouse anti-β-Actin (Cat # 3700, 1:5000; Cell Signaling). Species-specific secondary antibodies were purchased from LI-COR Biosciences (Lincoln, NE). Recombinant mouse leptin (Ob) was purchased from R&D Systems (Cat # 498-OB, Minneapolis, MN) and diluted to a stock concentration of 1 mg/mL in 20 mM Tris-HCl, pH 8.0. For all in vitro studies, cells were serum-starved for 4 h and then treated with 100 nM Ob for 45 min before harvesting.
Western blotting
Samples were lysed by sonication in CelLytic MT buffer (Cat # C3228; Sigma-Aldrich, St. Louis, MO) containing protease/phosphatase inhibitors (Cat # 5872; Cell Signaling) and centrifuged at 14,000g to remove insoluble material. Forty micrograms protein samples were resolved on a denaturing 4–20% sodium dodecyl sulfate-polyacrylamide gel electrophoresis (SDS-PAGE) gel (Cat # 345003; Bio-Rad, Hercules, CA) and transferred to polyvinylidene fluoride membranes by electroblotting. The membranes were then blocked in Odyssey blocking buffer in PBS (LI-COR) for 30 min and incubated with specific primary antibodies at 4°C overnight. Blots were incubated with secondary antibodies (LI-COR) at room temperature for 30 min in the dark the next day. Signals were detected and analyzed by Image Studio Version 4.0 (LI-COR Odyssey).
Quantitative PCR
RNA was isolated by using the RNAeasy micro kit (Cat # 74004; Qiagen, Hilden, Germany). cDNA was synthesized by using a High-Capacity cDNA Reverse Transcription Kit (Cat # 4368814; Thermo Fisher). Amplification of cDNA (10 ng) was conducted in duplicate by using SYBR green kits (Cat # 4309155; Thermo Fisher) on a 480 real-time PCR machine (Roche Applied Science, Penzberg, Germany). Results were calculated by using the ΔΔ −CT method and normalized to the hypoxanthine guanine phosphoribosyltransferase (HPRT) housekeeping gene. The sequences of the forward and reverse primers used in our quantitative polymerase chain reaction studies were as follows: CEBPD (Forward 5′-TCAGCGCCTACATTGACTCC-3′; Reverse 5′-TTGTGGTTGCTGTTGAAGAGG-3′), HPRT (Forward 5′-TCCTCCTCAGACCGCTTTT-3′; Reverse 5′-CCTGGTTCATCATCGCTAATC-3′), LCN2 (Forward 5′-CAATAGCTACAATGTCACCTCC-3′; Reverse 5′-AGGATACCTGTGCATATTTCCC-3′), and SELENOM (Forward 5′-GACATTCAACTGTACCACAACC-3′; Reverse 5′-CTGGTAATTTCGGCTTAACAGC-3′).
Cell culture
The hypothalamic cell line, mHypoE-44, was purchased from Cellutions (Cat # CLU136, Toronto, OR) and grown in Dulbecco's modified Eagle medium (Cat # D5671; Sigma) containing 10% FBS (Cat # 16140089; Thermo Fisher) and 1% penicillin/streptomycin (Cat # 10378016; Thermo Fisher) in a humidified incubator with 5% CO2 at 37°C. These are immortalized hypothalamic neurons derived from mouse embryonic hypothalamic primary cultures by retroviral transfer of SV40 T-Ag. Although mHypoE-44 cells express the leptin receptor (ObR), we found that leptin responses were weak unless cells were transfected with an exogenous plasmid expressing the ObR. Therefore, for all leptin stimulation studies, cells were transfected with an ObR-expressing construct (gift from Christian Bjorbaek's Lab). For overexpression studies, we utilized a SELENOM overexpression vector (pSELENOM) that was created by subcloning SELENOM cDNA into the pSelExpress1 vector (gift from Vadim Gladyshev's Lab). In all studies involving leptin stimulation, cells at 70% confluency were transfected 2 days before imaging/treatment by using Lipofectamine 2000.
Generation of stably transfected mHypoE-44 cell lines
Constructs of shRNA for mouse SELENOM and an NTC were subcloned into the pTRIPZ vectors with the Tet-On inducible system with red fluorescent protein (Thermo Fisher Scientific). Hypothalamic cells at 70–80% confluency were transfected with pTRIPZ vectors containing either SELENOM or NTC shRNA by using Lipofectamine 2000. Stably transfected cells were selected by incubating in media containing puromycin (Cat # P8833, 1.5 μg/mL; Sigma) for 7 days. For experiments using stably transfected cells, doxycycline (Cat # D9891, 2 μg/mL; Sigma) was added to the media 48 h before experimentation to induce TurboRFP/shRNAmir expression.
CRISPR/Cas9-mediated editing of Selenom in mHypoE-44 cells
Cells were first transfected with a pSpCase9(BB)-2A-green fluorescent protein (GFP) (Addgene, Cambridge, MA) plasmid. After 24 h, GFP-positive cells were sorted by using an FACSaria flow cytometer (BD Bioscience, San Jose, CA). GFP-expressing cells were allowed to recover for an additional 24 h period and were then transfected with Integrated DNA Technologies (Coralville, IA) universal tracrRNA and guide crRNA targeting exon 1 of the Selenom gene. After another 24-h recovery period, cells were subjected to a second round of sorting for GFP-positive cells and seeded in 96-well plates at a density of 1 cell/well. These clones were grown into colonies and screened by PCR and Western blot to verify absence of SELENOM.
Calcium imaging
Cytosolic Ca2+ levels were measured by using the Ca2+ fluorescent dye Fluo-4 (Cat # F14201; Thermo Fisher). Cells were loaded with 5 μM Fluo-4 and incubated for 30 min at 37°C immediately before imaging. They were then washed three times with Live Cell Imaging Solution (Cat # A14291DJ; Thermo Fisher), and coverslips were mounted onto RC-25F chambers (Cat # 64-0233; Warner Instruments, Hamden, CT) and placed in the mount of an inverted Nikon PCM 2000 confocal microscope located in the Kakaako Health Sciences Microscopy and Imaging Core Facility. Cells were excited by a 488-nm laser, and images were captured by using a 40 × oil objective and a 515–565-nm emission filter. Responses were recorded as a time course, consisting of confocal images taken at 5 s intervals for a total of 300 s. Leptin (100 nM) was added at 30 s. Using ImageJ software, fluorescence was converted to signal intensity and normalized to baseline (F/F0) for quantification purposes. Ionomycin (Cat # I9657, 1 μg/mL; Sigma) was used as a positive control to elicit maximal Ca2+ responses.
Microarray analysis
RNA samples were sent to the University of Hawaii Cancer Center Genomics Core Facility for microarray analysis. RNA integrity was first validated on an Agilent 2100 Bioanalyzer. One hundred nanograms of total RNA was then used for the GeneChip whole-transcript assay followed by hybridization to Clariom S Mouse Arrays (Cat # 902930; Affymetrix, Santa Clara, CA). Arrays were washed, stained, and scanned by using a GeneChip Fluidics Station 450 and a GeneChip Scanner (Affymetrix). CEL files generated from Clarion S Mouse Arrays were analyzed by Transcriptome Analysis Console software v4.0 (Affymetrix). Genes with fold-changes greater than 1.5 and p-values <0.01 between Selenom−/− and control samples were considered differentially expressed.
Antioxidant activity assays
TXN (Cat # 11527; Cayman Chemical, Ann Arbor, MI) and TXNRD activity (Cat # 10007892; Cayman) were measured by using commercially available kits according to the manufacturer's instructions. For both of these assays, samples were run in duplicate and consisted of 20 μg of total protein per well. TXN activity was determined by measuring the reduction of insulin disulfides in the presence of a relative excess of NADPH and TXNRD. For this assay, human recombinant TXN1 was used both as a positive control and to generate a standard calibration curve. One unit of TXN activity was defined as being equivalent to 1 ng human recombinant TXN1, as determined by the calibration curve (Supplementary Fig. S1). As a negative control for TXN activity, the potent TXN inhibitor, PX12 (Cat # 14192, 5 μM; Cayman Chemical), was also incorporated (Supplementary Fig. S2). TXNRD activity was determined by using a colorimetric assay based on the reduction of DTNB [5,5′-dithio-bis(2-dinitrobenzoic acid); Ellman's reagent] to TNB (5-thio-2-nitrobenzoic acid), which yields a yellow product that is measured at 405 nm. For each sample, DNTB reduction is measured in the absence and presence of sodium aurothiomalate, a specific inhibitor of TXNRD. This allows for the correction of TXNRD-independent reduction of DNTB. A positive control of purified rat liver TXNRD was also included to verify the specificity of this assay (Supplementary Fig. S3).
SELENOM immunoprecipitation
SELENOM was immunoprecipitated from hypothalamic tissue by using a mouse monoclonal SELENOM antibody conjugated to agarose beads (Cat # sc-514952 AC, 500 μg/mL; Santa Cruz). As a negative control, mouse IgG-conjugated agarose beads were also utilized (Cat # sc-2343, 500 μg/mL; Santa Cruz). For immunoprecipitation, 500 μg of total protein was incubated overnight at 4°C with 50 μL of antibody-conjugated beads. The next morning, samples were spun and supernatants (flow-through) were captured. Beads were then washed and spun three times. After the wash steps, each sample was allocated into three separate tubes (15 μL each) to assess protein levels (Western blot), TXN activity, and TXNRDs activity. For Western blotting, 15 μL of beads were mixed with 15 μL of loading dye and boiled at 95°C for 10 min. Samples were then spun, and supernatants were resolved on a denaturing 4–20% SDS-PAGE gel. For the activity assays (TXN, TXNRD), beads were directly added to the 96-well plate where the assay was conducted.
NF-κB DNA binding assay
NF-κB activation was determined by using a commercially available kit (Cat # 10007889; Cayman) that detects DNA binding of the p65 subunit of the NF-κB complex. For this assay, nuclear fractions were first isolated from mHypoE-44 cells by using a nuclear extraction kit (Cat # 10009277; Cayman). Nuclear protein samples were run in duplicate and consisted of 5 μg of total protein per well. To verify assay specificity and monitor the dynamic range, serial dilutions of a positive control for NF-κB activation were run in parallel to generate a standard curve. One unit of NF-κB activity was defined as being equivalent to the response of the undiluted positive control. Also included to verify specificity was a negative control where NF-κB competitor dsDNA was co-administered in conjunction with the undiluted positive control (Supplementary Fig. S4).
Flow cytometry
For measurement of mtROS, samples containing 4 × 10⁵ cells (volume = 1 mL) were incubated at 37°C for 15 min with 1 μM of MitoSOX Red Superoxide Indicator (Cat # 36008; Thermo Fisher). ER stress was induced in select samples at the time of MitoSOX incubation by co-administration of 4 μM Tg (T9033; Sigma). Cells were then pelleted, washed, and resuspended in PBS supplemented with 25 mM 4-(2-hydroxylethyl)-1-piperazineethanesulfonic acid, 1 mM ethylenediaminetetracetic acid, and 1% FBS. Immediately before analysis with the flow cytometer, 1 μM of SYTOX AAD (Cat # S10349; Thermo Fisher) was added to samples for identification of dead cells. Cells were analyzed by using an Attune NxT flow cytometer (Thermo Fisher) and FlowJo software v10 (FlowJo LLC, Ashland, OR) housed in the Molecular and Cellular Immunology Core Facility at the University of Hawaii. Forward and side scatter gating was used to exclude debris, and single-cell discrimination was done to restrict analysis to single cells. Compensation was applied to correct for spectral overlap between MitoSOX and SYTOX AAD. For each condition, analysis was conducted on four separate samples consisting of 20,000–30,000 single cells.
Statistical analysis
Data were analyzed and plotted by using GraphPad Prism software 7.0. Statistical tests varied according the experiment and are indicated in the text and/or figure legends. Results are represented as means ± standard error of the mean. A statistically significant difference was considered present at p < 0.05, unless otherwise noted.
Footnotes
Acknowledgments
This work was supported by National Institutes of Health Grants G12 MD007601, U54 MD007584, U54 MD007601, P20 GM103466, P30 GM114737, and pilot funds from G12 MD007601 and P20 GM113134 to M.W.P. The authors also thank Marla Berry for providing mentoring and access to facilities and experimental materials.
Author Disclosure Statement
No competing financial interests exist.
Supplementary Material
Supplementary Figures S1
Supplementary Figures S2
Supplementary Figures S3
Supplementary Figures S4
Supplementary Table S1
Abbreviations Used
References
Supplementary Material
Please find the following supplemental material available below.
For Open Access articles published under a Creative Commons License, all supplemental material carries the same license as the article it is associated with.
For non-Open Access articles published, all supplemental material carries a non-exclusive license, and permission requests for re-use of supplemental material or any part of supplemental material shall be sent directly to the copyright owner as specified in the copyright notice associated with the article.