




Abstract
Aims:
The naive or primitive states of stem cells (SCs) residing in specific niches are unstable and difficult to preserve in vitro. Vitamin C (VitC), in addition to suppressing oxygen radicals, exerts pleiotropic effects to preserve the core functions of SCs. However, this compound is labile and readily oxidized, resulting in cellular toxicity and preventing its reliable application in this context. We found that a VitC derivative, ascorbic acid 2-glucoside (AA2G), stably maintains the naive pluripotency of murine embryonic SCs (mESCs) and the primitiveness of human mesenchymal SCs (hMSCs) without cellular toxicity.
Results:
The beneficial effects of AA2G and related molecular mechanisms were evaluated in mESCs, induced pluripotent-SCs (iPSCs), and hMSCs. AA2G was stable in aqueous solution and barely induced cellular toxicity in cultured SCs, unlike VitC. AA2G supplementation recapitulated the well-known effects of VitC, including induction of ten–eleven translocation-dependent DNA demethylation in mESCs and suppression of p53 during generation of murine iPSCs. Furthermore, supplementation of hMSCs with AA2G improved therapeutic outcomes in an asthma mouse model by promoting their self-renewal, engraftment, and anti-inflammatory properties. Particularly, activation of the cAMP-responsive element-binding protein-1 (CREB1) pathway contributed to the ability of AA2G to maintain naive pluripotency of mESCs and functionality of hMSCs.
Innovation and Conclusion:
Given its long-lasting effects and low cellular toxicity, AA2G supplementation is useful to support the naive pluripotency of mESCs and the primitiveness of hMSCs, affecting their developmental potency and therapeutic efficacy. Furthermore, we demonstrate the significance of the CREB1 pathway in the mechanism of action of AA2G.
Introduction
Embryonic development and subsequent rejuvenation of adult tissues are orchestrated by the coordinated activity of stem cells (SCs), which undergo self-renewal, maintain their own pool, and give rise to differentiated progenitors that replace cells lost over the course of the life span (37). Due to these unique properties, SCs provide an invaluable resource for basic developmental studies and regenerative therapies: they serve as source material for the generation of somatic cells in SC-based therapies, and embryonic SCs (ESCs) and induced pluripotent SCs (iPSCs) can be used to generate relevant disease models and various types of tissue organoids (58).
However, over the course of in vitro maintenance, these cells gradually lose genetic and epigenetic integrity due to excess oxidative stress (25, 27, 41), unfavorable genetic mutations, and DNA methylation, which alter and attenuate their molecular and cellular phenotype (37). The regulatory elements of several developmentally crucial genes, including imprinted genes, lineage markers, and tumor suppressors, are among the targets of epigenetic instability observed in murine ESCs (mESCs) (20). Given the roles of these genes in proliferation and differentiation, as well as tumorigenesis, molecular damage and ensuing alterations in gene expression induced by long-term cultivation of SCs can adversely affect outcomes in terms of both the developmental potency and the safety of their therapeutic derivatives.
The primitiveness of stem cells (SCs), unlike in specific niches in vivo, is extremely difficult to maintain in vitro, and this has delayed the development of strategies for the optimized and safe use of SCs for basic research and therapeutic purposes. Here, we show that ascorbic acid 2-glucoside, a vitamin C (VitC) derivative, stably promotes the primitiveness of embryonic and mesenchymal SCs while overcoming critical drawbacks of VitC, including its chemical instability in culture medium and its high level of cellular toxicity. Thus, this study provides an optimal method and related molecular insights for capturing/maintaining SC primitiveness, which could critically influence their developmental potency and therapeutic efficacy.
Reactive oxygen species (ROS) generated as a by-product of mitochondrial respiration are the major source of cellular damage to genetic and epigenetic integrity (26). Thus, to preserve the self-renewal process, SCs have intrinsically high antioxidant activity, which ensures a low level of intracellular ROS (25). In addition, ESCs and quiescent adult SCs (ASCs) minimize oxygen consumption by decreasing mitochondrial biogenesis (28). Because SCs generally reside within specialized microenvironments known as SC niches, which have relatively low concentrations of oxygen (1–8%) (12, 39), the current standard method of cultivating SCs under 21% ambient oxygen produces oxidative stress that severely impairs the core functions of SCs, including hematopoietic SCs (22, 24), neural SCs (42), astrocyte progenitor cells (47), mesenchymal-SCs (MSCs) (7, 34), and airway basal SCs (43). Importantly, the defects in self-renewal and differentiation potency observed under oxidative stress are reversed by cultivation under hypoxia (7, 27, 34) or treatment with antioxidants. Therefore, definition of the optimal culture conditions to capture SCs in their naive or primitive states in vitro, as well as the identification of key mediator(s) involved in maintaining these states, would not only advance our understanding of the molecular nature of stemness but would also facilitate the development of strategies for the optimized and safe use of SCs for basic research and therapeutic purposes.
Vitamin C (VitC), a well-known antioxidant, exerts pleiotropic effects on both murine and human pluripotent SCs (PSCs) and ASCs (5, 60). In addition to suppressing ROS, VitC supplementation during cultivation modulates the epigenetic properties of SCs, including stimulating ten–eleven translocation (TET)-dependent DNA demethylation to induce a naive state in mESCs (2). VitC promotes somatic cell reprogramming through epigenetic mechanisms, including activation of TET (4) and Jhdm1a/1b-dependent H3K36me2/3 demethylation (53) as well as modulation of p53 (11). In particular, VitC prevents loss of Dlk1–Dio3 genomic imprinting, preserving the pluripotency of human parthenogenic ESCs and enabling the generation of entirely iPSC-derived adult mice (49, 61). However, VitC is extremely unstable in vitro because it is readily oxidized to dehydroascorbate, which after import into cells induces toxicity by depleting glutathione (GSH), the most abundant antioxidant (62). These critical drawbacks of VitC hinder its reliable application to the maintenance of naive pluripotency or the primitive state in cultured PSCs or ASCs, respectively.
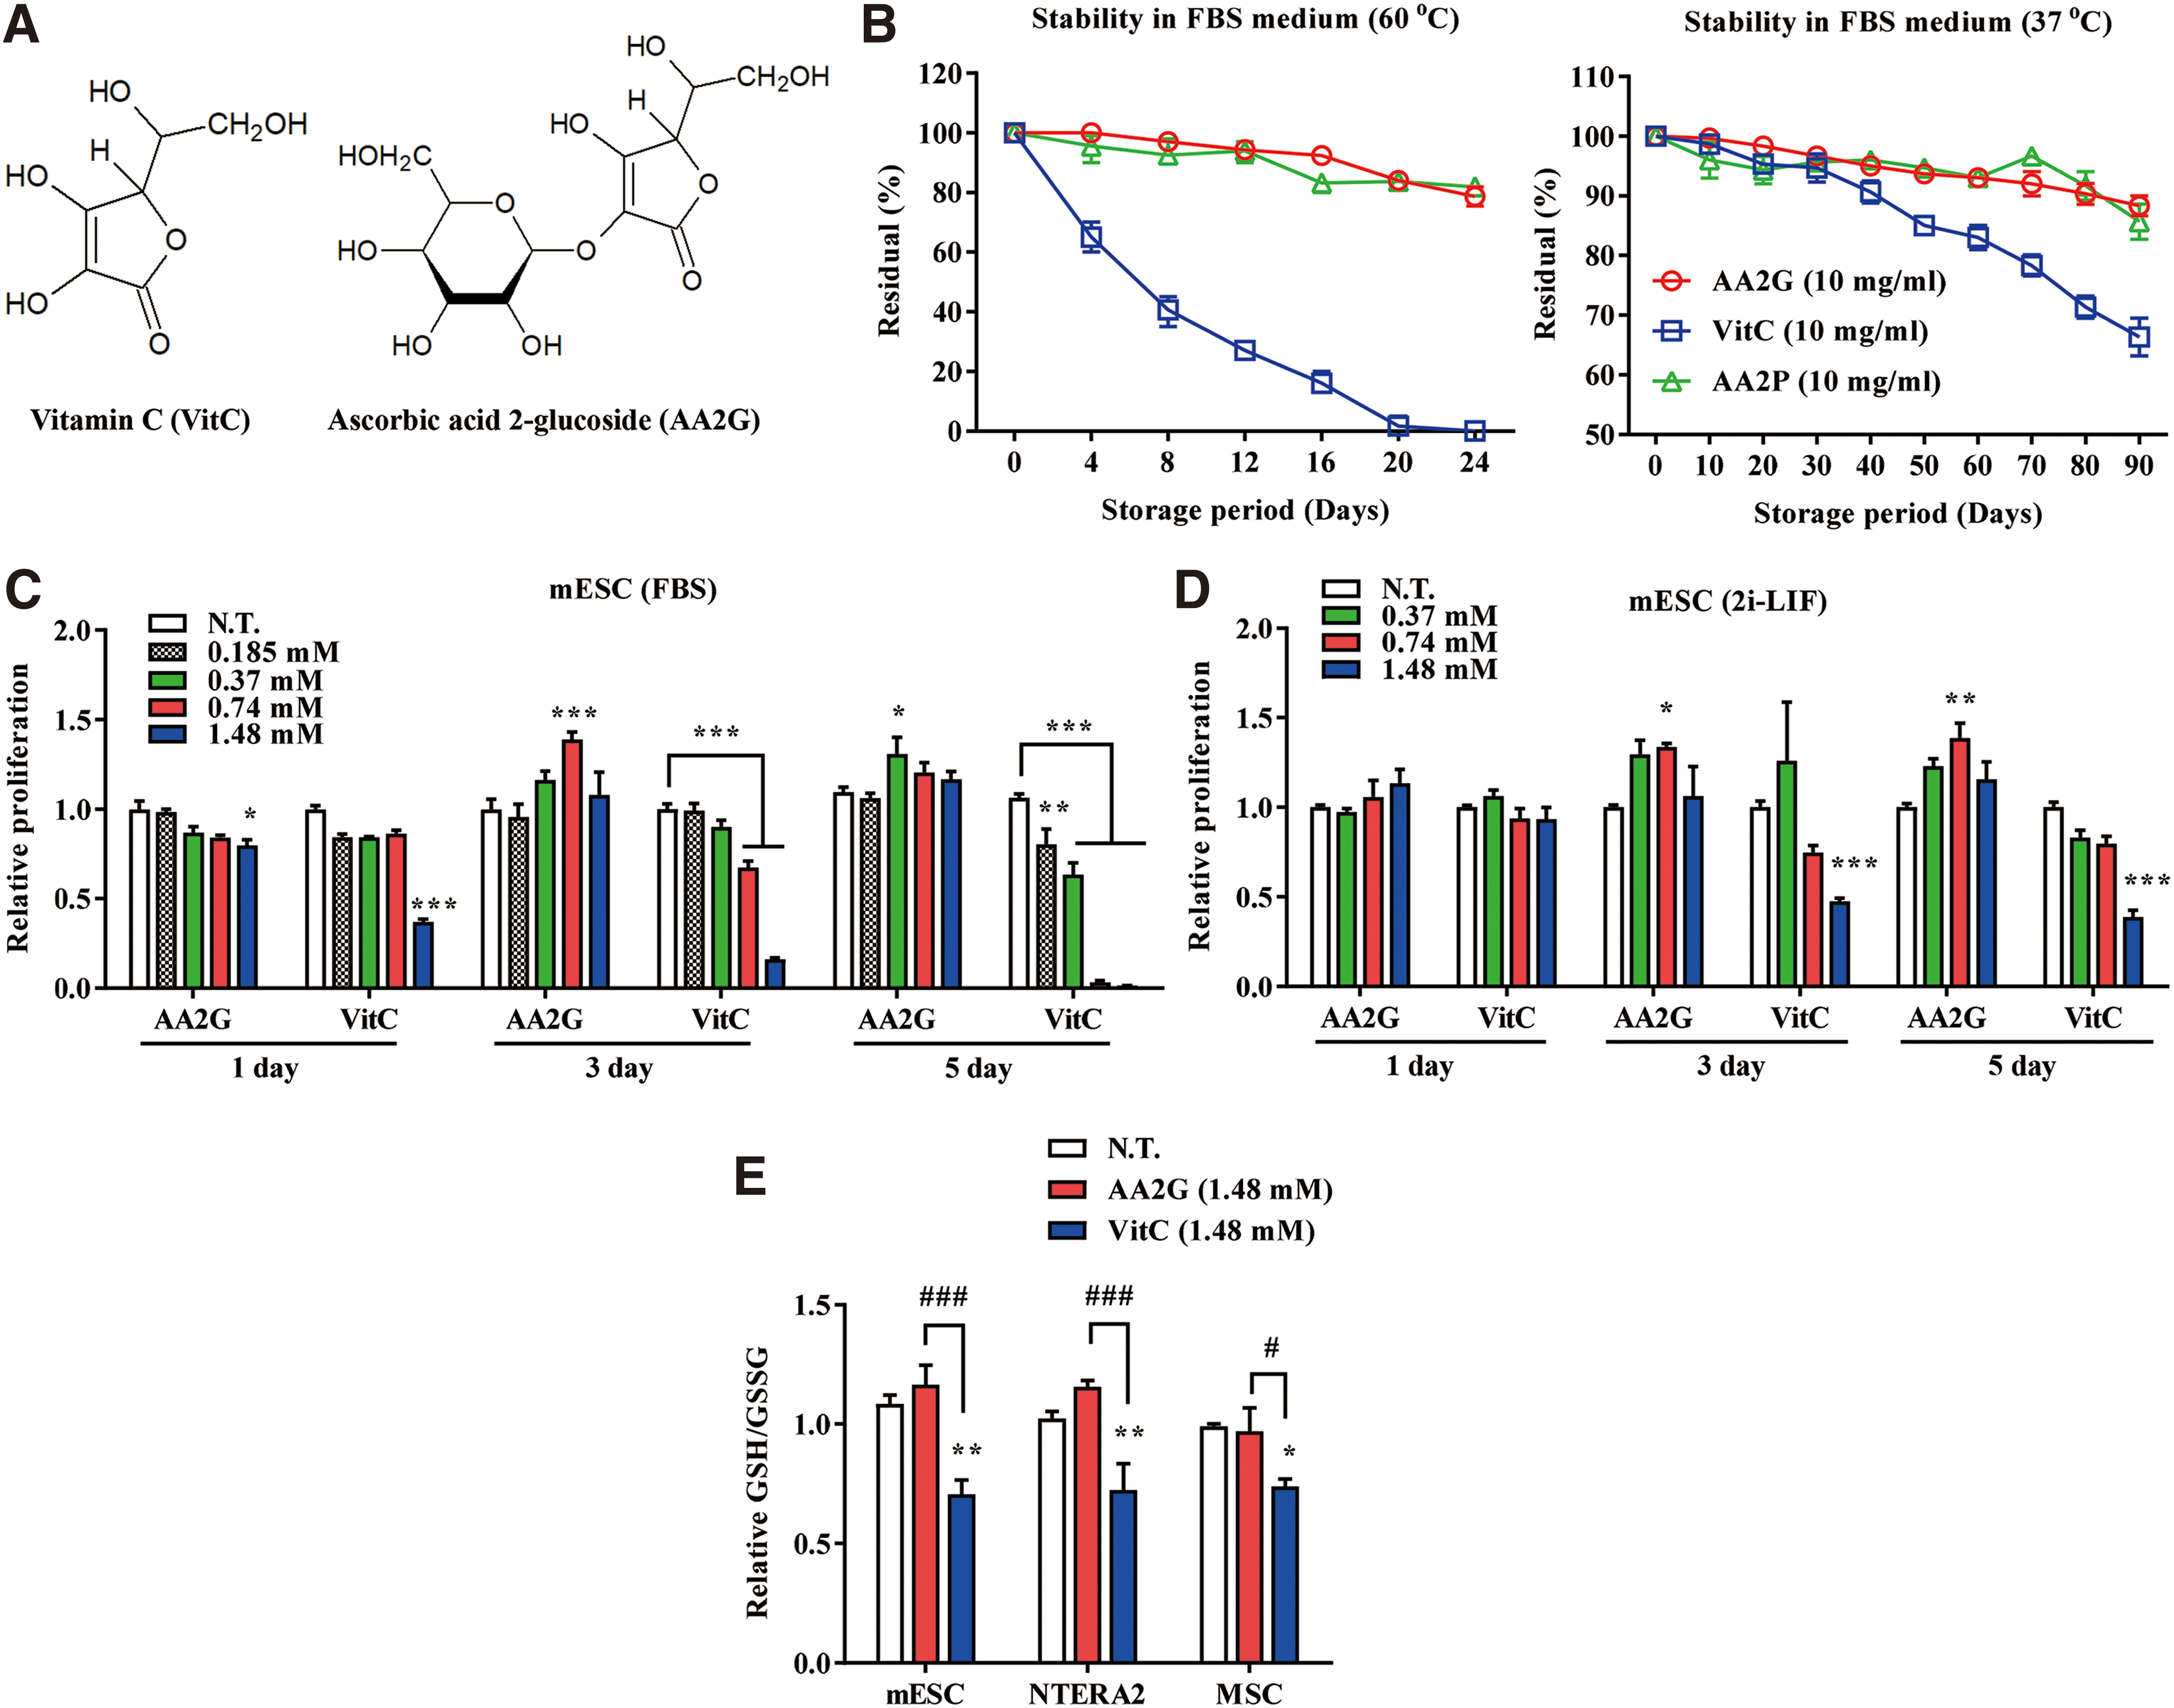
Ascorbic acid 2-glucoside (AA2G), a stable ascorbic acid derivative (Fig. 1A) produced by the action of cyclomaltodextrin glucanotransferase (57), is stable in aqueous solutions and exerts its biological effects after being hydrolyzed to ascorbic acid by mammalian α-glucosidase following addition to cell cultures or gastrointestinal absorption (56). Importantly, AA2G exerts long-lasting biological effects similar to those of VitC, including promoting collagen synthesis, inhibiting oxidation, and supporting the functionality of terminally differentiated cells (5, 18). However, the beneficial effects and the underlying mechanisms of AA2G on SCs have not been elucidated.
In this study, we show that AA2G, with superior stability and minimal cellular toxicity, recapitulated the well-known effects of VitC to promote the naive pluripotency of mESCs and reprogram murine somatic cells. In addition, AA2G supplementation improved the core functions of human MSCs (hMSCs) derived from human embryonic stem cells (hESCs) or umbilical cord (UC) cells, and the in vivo significance of these effects was demonstrated using a murine asthma model. Along with TET-dependent DNA demethylation, the cAMP-responsive element-binding protein-1 (CREB1) pathway also played a critical role in the effect of AA2G on mESCs and hMSCs. Together, our results demonstrate that AA2G supplementation provides a simple and efficient way not only to preserve the naive pluripotency of mESCs but also to improve the primitive state of hMSCs through both epigenetic and signaling mechanisms that critically influence the developmental potency of these cells and the safety of their use in therapeutic applications.
Results
AA2G overcomes the drawbacks of VitC in cultures of murine PSCs and hMSCs
AA2G is refractory to oxidation, ensuring that it is stable in aqueous solution and exerts minimal cellular toxicity. To confirm that these benefits accrued during cultivation of murine PSCs, including ESCs and iPSCs, we first compared the stability of AA2G and VitC in fetal bovine serum (FBS)-containing or 2i-leukemia inhibitory factor (LIF) culture media after storage at different pH values and temperatures for various periods of time. A considerable amount of AA2G (more than 80%) persisted in both types of culture media at neutral pH, even after 24 days at 60°C, whereas VitC was completely degraded under these conditions (Fig. 1B and Supplementary Fig. S1A). AA2G was also more stable than VitC at a physiological temperature (37°C).
Next, we examined the cellular toxicity of AA2G in a subset of SCs, including murine PSCs and hESCs, the pluripotent teratocarcinoma cell line NTERA2, and UC-derived MSCs (UC-MSCs) by comparison with VitC at concentrations used in previous studies (2, 8, 62). Although a high dose of VitC progressively induced cell death in both murine PSCs and human NTERA2 cells, AA2G significantly increased the viability of mESCs and NTERA2, starting from 3 days following AA2G treatment (Fig. 1C and Supplementary Fig. S1B–D). The viability of mESCs was increased by AA2G supplementation in FBS-containing (Fig. 1C) and 2i-LIF media (Fig. 1D). Under these conditions, the viability of AA2G-stimulated murine iPSCs (Supplementary Fig. S1C) or hESCs (Supplementary Fig. S1E) was reduced, although to a significantly lesser extent than that of VitC-stimulated iPSCs.
The beneficial effect of AA2G on viability was also observed in human UC-MSCs (Supplementary Fig. S1F, G), although VitC-mediated toxicity is less prominent in UC-MSCs than in mESCs or NTERA2 cells. As previously reported (62), VitC treatment induced the depletion of GSH in these SCs, which was significantly protected in SCs cultivated under AA2G supplementation (Fig. 1E). These data demonstrate that AA2G overcomes the critical drawbacks of VitC, specifically its low stability and deleterious effects on cellular viability, both of which hinder the successful culture of SCs. These beneficial effects of AA2G were particularly apparent in cultures of mESCs and hMSCs.
AA2G induces naive status in mESCs
Next, we investigated whether AA2G could recapitulate the beneficial effects of VitC in preserving the core functions of SCs. To this end, we first examined the effects of AA2G on the naive pluripotency of mESCs. In line with results obtained using VitC (2), AA2G supplementation in FBS-containing medium increased the frequency of dome-like compact round colonies with strong alkaline phosphatase (AP) activity, which are morphological hallmarks of naive pluripotent cells, in two independent mESC lines, R1 (Fig. 2A) and E14 (Supplementary Fig. S2A). Accordingly, AA2G treatment increased the expression of a subset of markers of naive pluripotency, including Nanog, Tfcp2l1, and Klf2, at both the mRNA (Fig. 2B) and protein levels (Fig. 2C, D), along with an increase in the protein expression of Oct4 and Sox2. Upregulation of naive pluripotency genes was also observed in AA2G-treated mESCs (AA2G-mESCs) cultivated in 2i-LIF medium (Supplementary Fig. S2B). Although transcription of DNA methylation—and demethylation—mediating enzymes was affected to a lesser extent (Supplementary Fig. S2C), AA2G treatment decreased the levels of the DNA methyltransferase (Dnmt)-3a and Dnmt3-like (Dnmt3L) coactivator proteins (Fig. 2C, D). AA2G also reduced the Dnmt enzymatic activity, although this difference was not statistically significant (Supplementary Fig. S2E). We chose the optimal dose of AA2G as 0.74 mM based on its effects on naive pluripotency and cellular viability. The effects of AA2G at 0.74 mM were sustained for 2 days without media replacement and were rapidly detectable (within 12 h) (Supplementary Fig. S2D).

To further validate these data, we used epiblast SCs (EpiSCs) established from OG2 mice (OG2-EpiSCs). These mice carry the heterozygous Oct4-GFP (ΔPE) transgene (6, 33), which allows reprogramming of naive status to be easily monitored by GFP expression. AA2G treatment, like VitC treatment, significantly increased the frequency of reprogrammed (i.e., GFP+) naive cells (Fig. 2E, F), but the efficacy of AA2G was higher.
When we analyzed the transcriptome of AA2G-mESCs by Gene Set Enrichment Analysis (GSEA), we observed upregulation of sets of genes induced by VitC treatment (Fig. 2G and Supplementary Dataset S2) and silenced by DNA methylation (Supplementary Fig. S2G). Furthermore, gene ontology analysis also showed that AA2G treatment, similar to VitC, predominantly affected genes related to germ line development and reproductive processes (Fig. 2H and Supplementary Fig. S2F, Supplementary Dataset S1). Taken together, these results indicated that AA2G recapitulates the biological effects of VitC on the naive pluripotent state of mESCs, but is superior in terms of stability and toxicity.
AA2G promotes TET-dependent DNA demethylation
To obtain mechanistic insight into the effects of AA2G, we examined DNA demethylation, a well-known effect of VitC on murine PSCs (2, 4). Immunofluorescence and dot blot assays indicated that AA2G treatment led to a significant global increase in 5-hydroxy-methylated cytosine (5hmC), a marker of DNA demethylation (16), in a dose-dependent manner (Fig. 3A, B). By contrast, global levels of 5-methylated cytosine (5mC) were decreased by AA2G treatment (Fig. 3B). This reciprocal change in the global levels of 5hmC and 5mC in AA2G-mESCs was further validated by liquid chromatography multiple-reaction-monitoring mass spectrometry (LC-MRM/MS) analysis (Fig. 3C and Supplementary Fig. S3A).
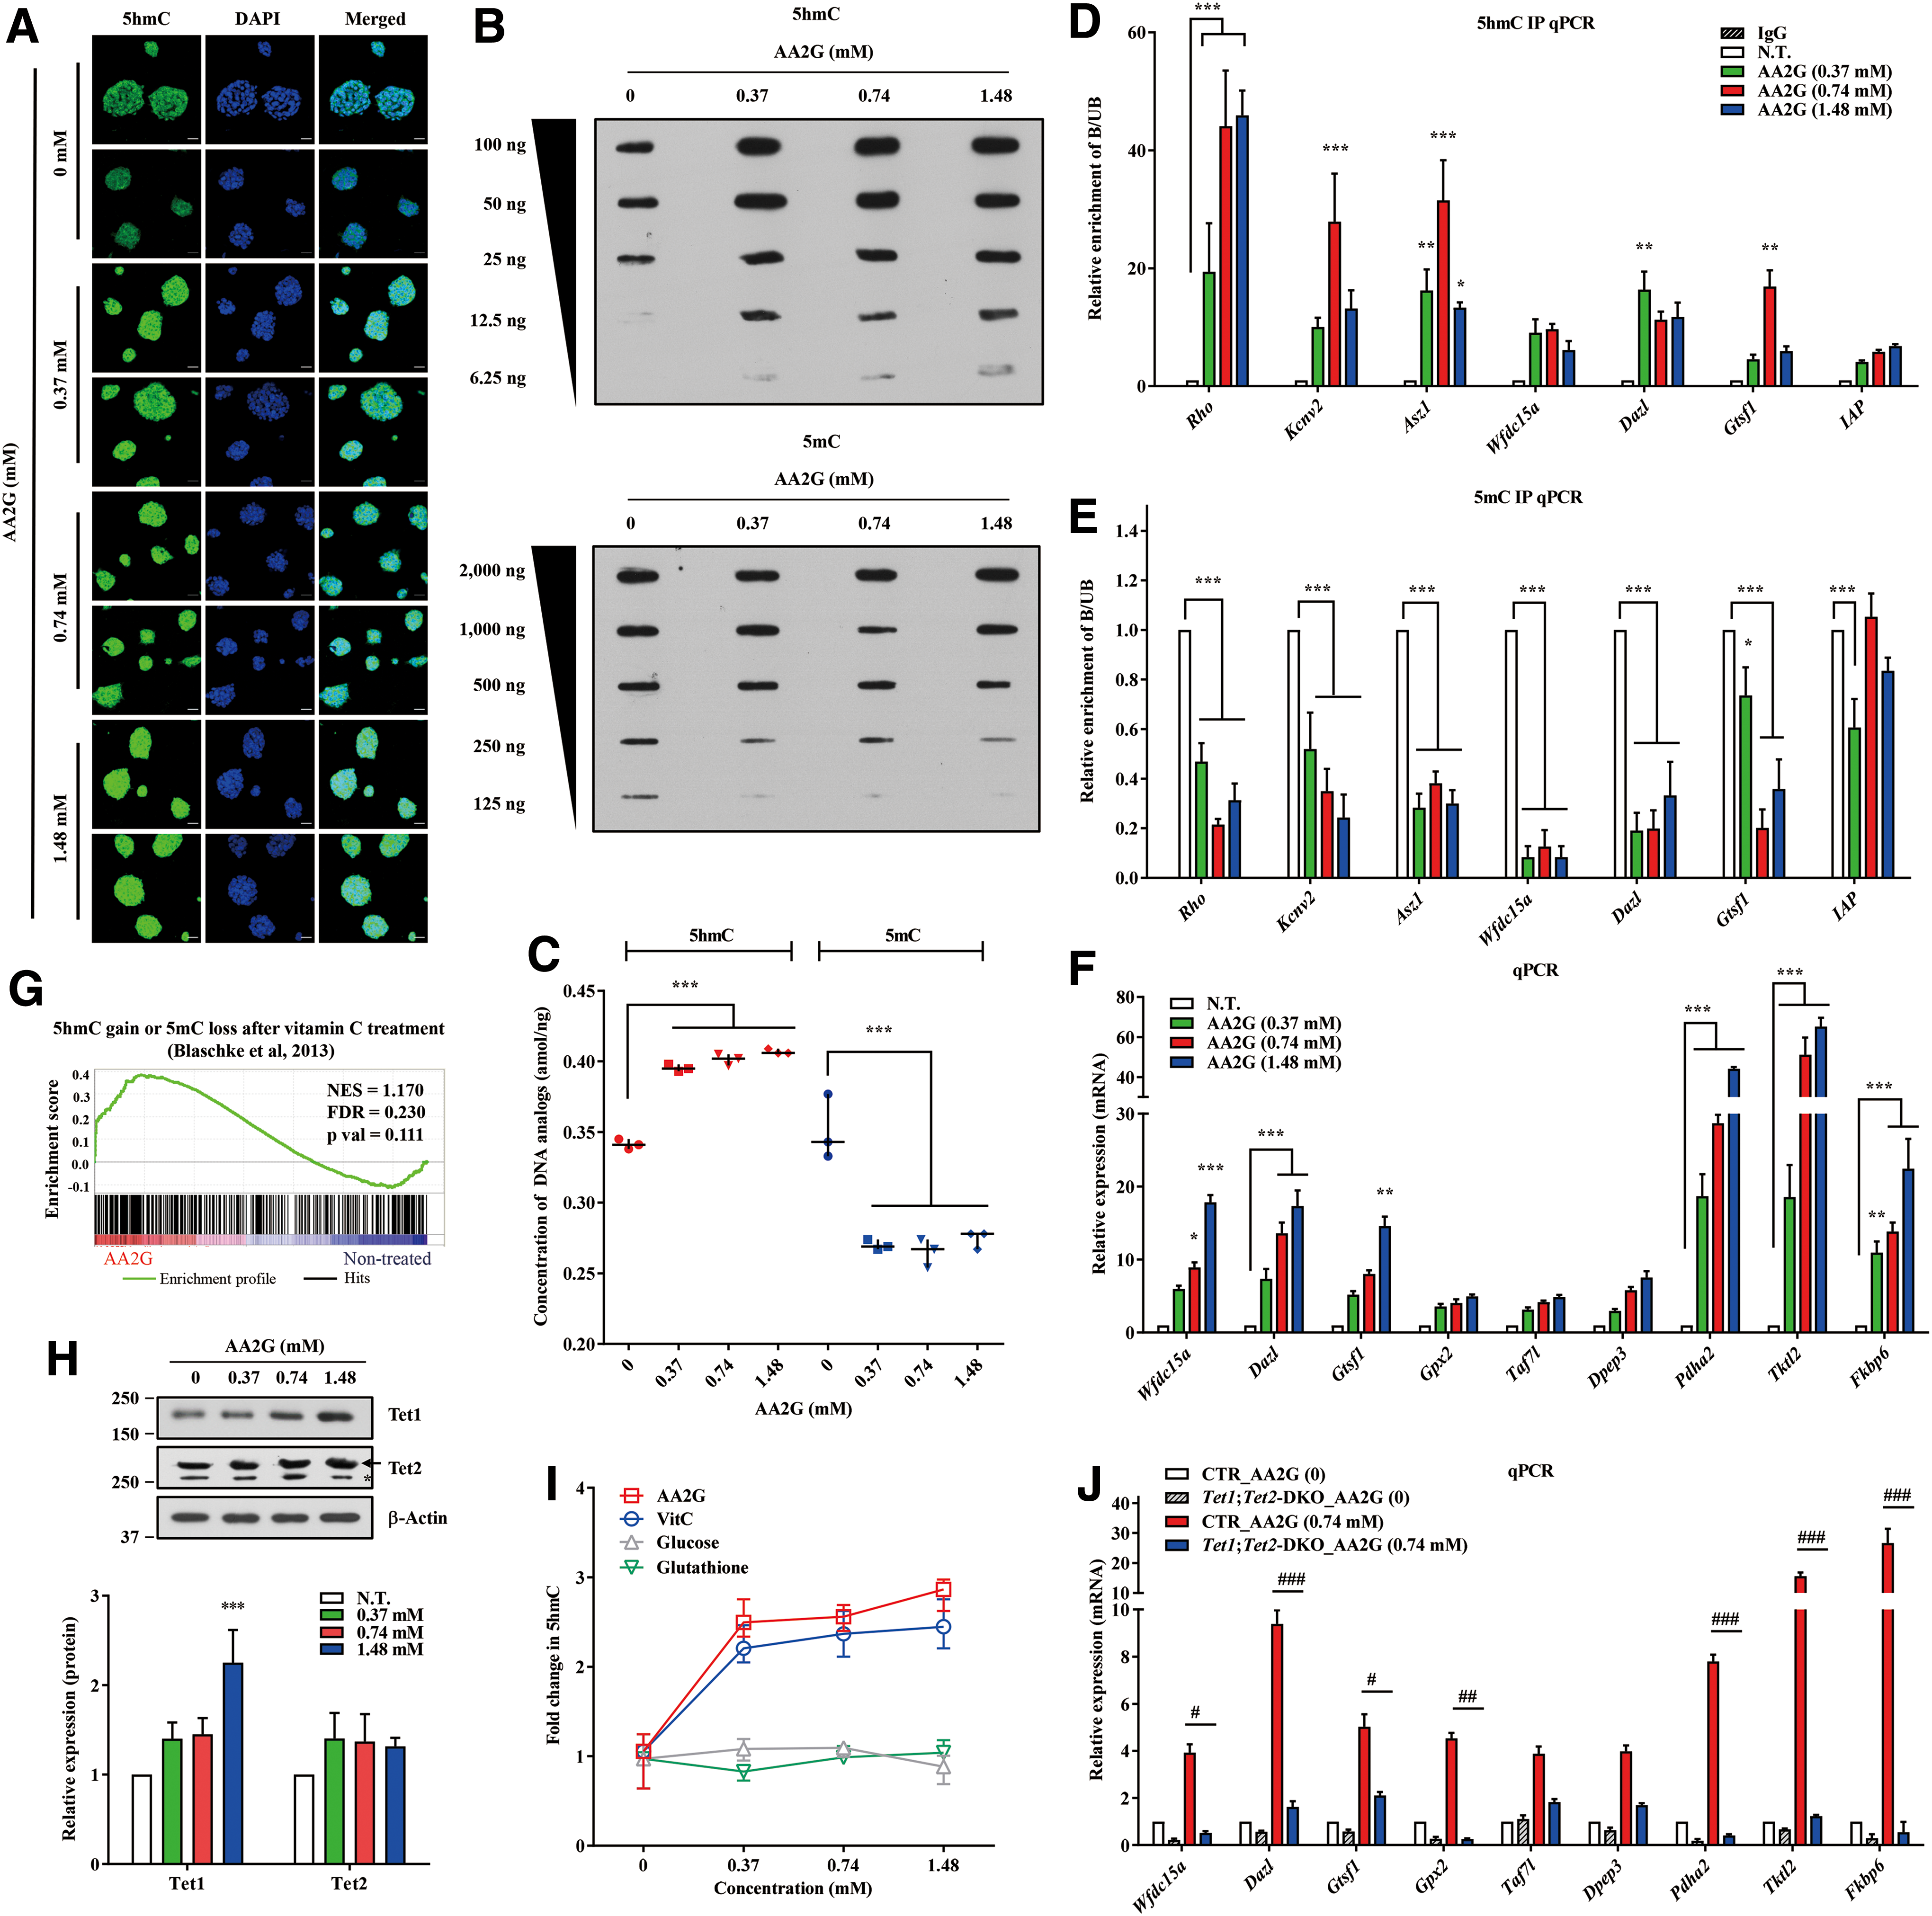
Next, to examine whether AA2G could recapitulate the change in DNA demethylation induced by VitC, DNA immunoprecipitation (DIP) followed by quantitative polymerase chain reaction (DIP-qPCR) was performed for specific loci in which DNA demethylation was induced by VitC (2). As shown in Figure 3D and E, AA2G treatment markedly increased 5hmC levels, but decreased 5mC levels, in VitC-targeted regions. In functional terms, these epigenetic changes promoted the induction of most VitC target genes in AA2G-mESCs (Fig. 3F). This gene expression change was validated at the genome-wide level by GSEA for a set of genes whose promoters gained 5hmC at 12 h and lost 5mC at 72 h after VitC treatment (Fig. 3G). Some VitC target genes, including Gtsf1, Pdha2, Tktl2, and Fkbp6, were further upregulated by AA2G treatment in 2i-LIF medium (Supplementary Fig. S3B).
In a previous study, Sirt1-deficient mESCs exhibited an abnormal increase in DNA methylation in a specific subset of imprinted and germ line developmental genes (20). Based on these gene sets silenced by Sirt1 deficiency, GSEA of transcriptome data revealed that AA2G treatment stimulated the induction of Sirt1-targeted genes, particularly those related to germ line function (Supplementary Fig. S3C). qPCR analysis confirmed that a subset of Sirt1 target genes was upregulated in AA2G-mESCs (Supplementary Fig. S3D). Consistent with these results, AA2G treatment significantly increased the expression of both Sirt1 transcript and protein (Supplementary Fig. S3E, F) and increased the Sirt1 enzymatic activity in AA2G-mESCs (Supplementary Fig. S3G). Taken together, these results indicate that AA2G induces DNA demethylation in mESCs to promote the expression of genes that are targeted by VitC or Sirt1.
AA2G treatment increased the protein levels and enzymatic activities of two TET family members, Tet1 and Tet2 (Fig. 3H, I). To investigate whether the effect of AA2G could be TET-dependent, we established Tet1;Tet2-double knockout (DKO) mESCs using the CRISPR-Cas9 system (Supplementary Fig. S4A). As expected, both cell lines had lower global 5hmC levels than control cells (Supplementary Fig. S4B). In addition, the Tet1;Tet2-DKO cells showed defects in the gain in 5hmC and loss of 5mC induced by AA2G treatment (Supplementary Fig. S4C, D) and the resultant expression of VitC target genes (Fig. 3J) and naive pluripotent markers (Supplementary Fig. S4E). These results demonstrate that AA2G, similarly to VitC, promotes TET-dependent DNA demethylation to induce naive pluripotency of mESCs.
AA2G induces the naive state in ESCs via the CREB1 pathway
DNA demethylation induced by VitC or AA2G predominantly promoted the upregulation of germ line-related genes (Fig. 2H), implying an interaction with other epigenetic silencing mechanisms or activating transcription factors. As previously observed in mESCs treated with VitC (2), the promoter regions of pluripotency genes showed a gain in 5hmC and a loss of 5mC in response to AA2G treatment (Supplementary Fig. 5). However, the transcription of these pluripotency genes was only slightly increased by AA2G treatment (Fig. 2B), suggesting a complex interplay between the epigenetic and transcriptional machineries. To address this issue, we further characterized the transcriptome of AA2G-mESCs by MetaCore pathway analysis, which revealed that a CREB1-associated gene network was characteristically regulated in response to AA2G treatment (Fig. 4A). Indeed, AA2G treatment upregulated several genes involved in this CREB1 network (Fig. 4B), significantly increased the level of phosphorylated Creb1 (Fig. 4C, D), and also induced the activity of a reporter containing eight tandem cAMP response elements (CREs) (48) (Supplementary Fig. S6A). In line with these data, naive mESCs cultured in 2i-LIF media had higher levels of Creb1 phosphorylation and CREB1 reporter activity (Fig. 4E, F), and the majority of genes constituting the CREB1 gene network were upregulated (Fig. 4G). When the effects of AA2G on upstream activators of CREB1, including cAMP and cAMP-dependent protein kinase A (PKA), were examined, AA2G treatment led to a significant increase in the amount of cAMP (Fig. 4H) and to a concomitant increase in PKA enzymatic activity (Fig. 4I). The effects of AA2G on the CREB1 pathway were specific, based on the observation that the other antioxidants tested had minimal effects on CREB1 reporter activity (Supplementary Fig. S6B, C).

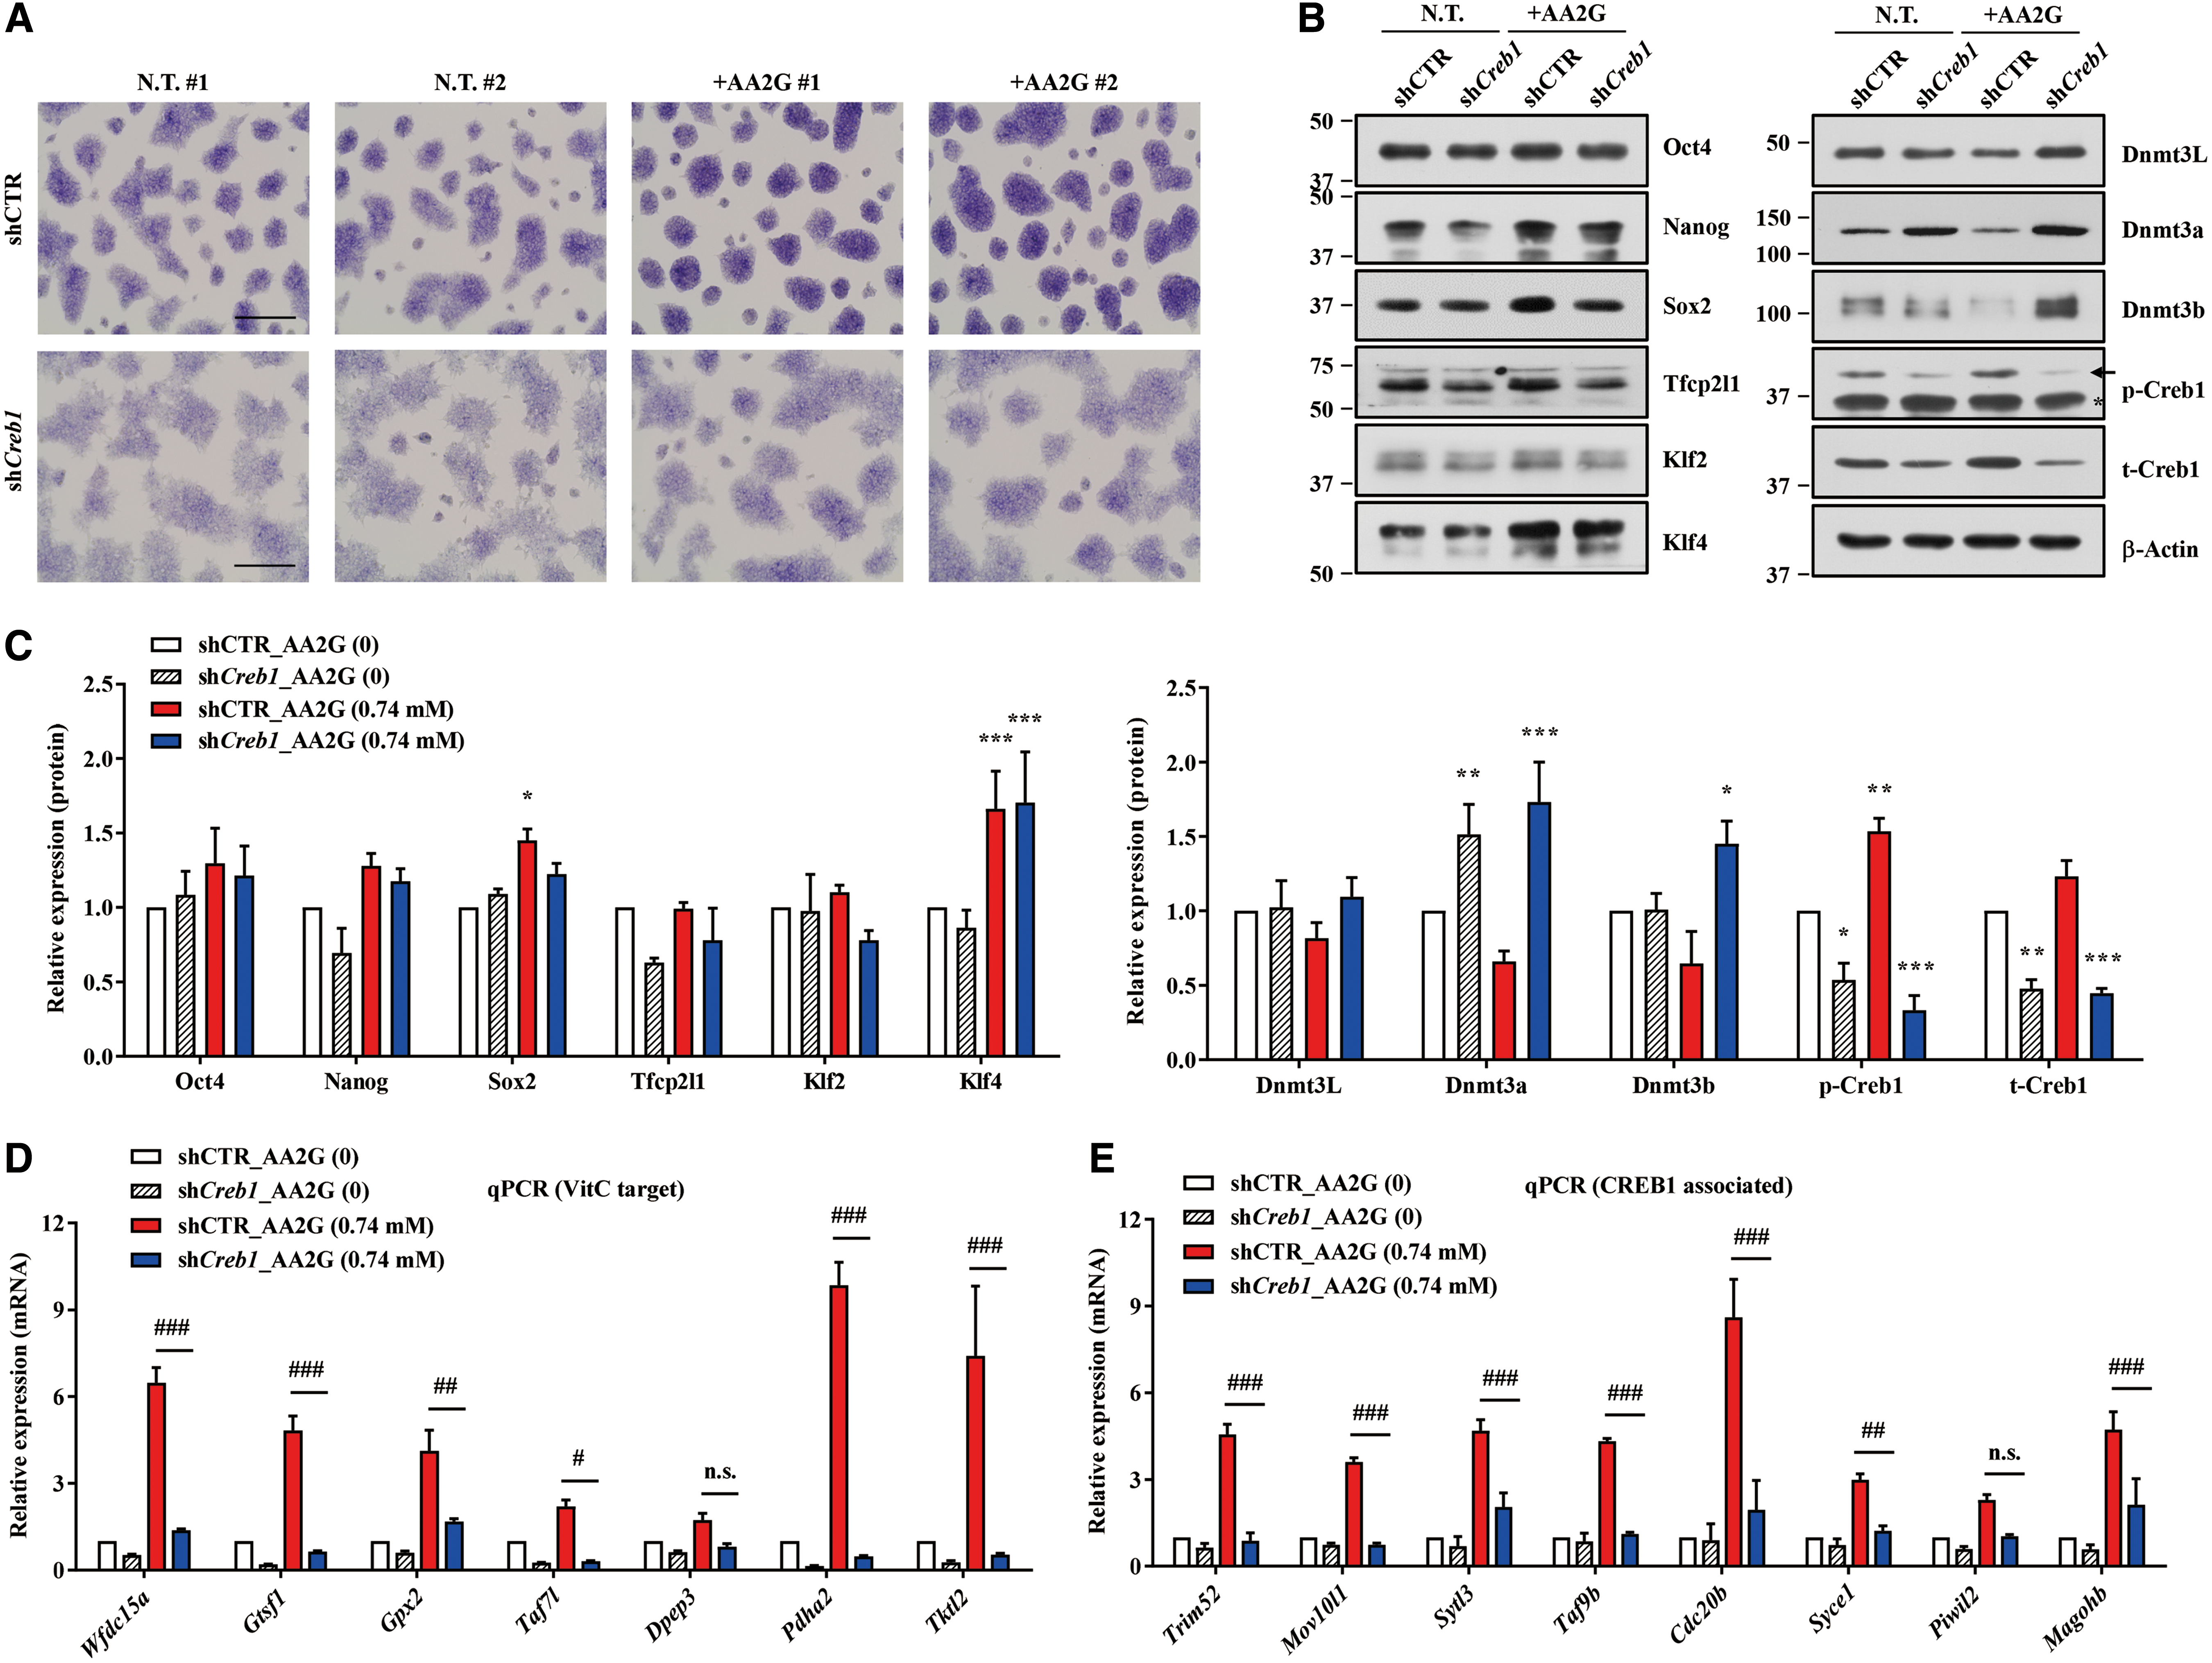
Next, we stably knocked down Creb1 in mESCs (Creb1-knockdown [KD]) (Supplementary Fig. S6D). Although pluripotency was not dramatically affected by silencing of Creb1 (Supplementary Fig. S6E), Creb1-KD mESCs were significantly impaired with respect to the beneficial effects of AA2G, that is, induction of naive status (Fig. 5A–C) and upregulation of CREB1-associated (Fig. 5D) and TET-dependent VitC target genes (Fig. 5E), supporting the idea that Creb1 plays a critical role in the biological potency of AA2G. Together, these results indicate that the CREB1 pathway is activated by AA2G treatment, and is required to induce naive pluripotency.
Consistent with the results of gene expression analysis (Fig. 5E), silencing of Creb1 prevented DNA demethylation in VitC target genes (Fig. 6A). In addition, the induction of the majority of CREB1-associated genes by AA2G was severely impaired in Tet1;Tet2-DKO mESCs (Fig. 6B), implying cross talk between the TET and CREB1 systems. Immunoprecipitation (IP) assays indicated that Creb1 physically interacted with Tet2 in mESC and 293FT cells (Fig. 6C). To further investigate this issue, we collected genes encoding CREB1-binding targets from a genome-wide study (63) and filtered them based on whether they were upregulated or demethylated by VitC (Supplementary Dataset S2). GSEA revealed that the transcriptome of AA2G-mESCs was positively enriched in gene sets containing CREB1 targets, which were transcriptionally activated (left panel in Fig. 6D) or demethylated (right panel in Fig. 6D) by VitC treatment. This observation was validated by gene expression analysis (Supplementary Fig. S6F, G). These VitC and CREB1 target genes were characteristically upregulated in 2i-LIF culture media (Supplementary Fig. S6H).

To elucidate the dependence of TET and CREB1 on the induction of these VitC and CREB1 target genes, we assessed their induction by AA2G in Tet1;Tet2-DKO or Creb1-KD mESCs. Half of the genes (10/21) were not upregulated by AA2G in either Tet1;Tet2-DKO or Creb1-KD mESCs, indicating that expression of these genes in response to AA2G required both the TET and CREB1 systems (Fig. 6E, F). The remaining genes, with the exception of Ahsg, were dependent on either the TET system or the CREB1 system alone for induction by AA2G. In summary, these results demonstrate that CREB1 is mechanistically involved in the effects of AA2G, and that it interacts with the TET system to induce the naive pluripotent state of mESCs.
Effect of AA2G on somatic cell reprogramming
VitC promotes somatic cell reprogramming through modulation of p53 (11), TET (4), and Jhdm1a/1b-dependent H3K36me2/3 demethylation (53). To investigate whether AA2G could facilitate reprogramming of somatic cells, we infected mouse embryonic fibroblast (MEF) cells from OG2 mice with a lentivirus containing the four Yamanaka reprogramming factors (plasmid FUW-SOKM). Cultures were supplemented with AA2G starting on day 1 after infection, and fresh AA2G was added every 2 days. AA2G treatment, similarly to VitC treatment, increased the efficiency of AP+ iPSC formation by threefold relative to nontreated controls (Fig. 7A). The AP+ iPSC colonies established by AA2G supplementation showed the typical PSC features, based on the expression of pluripotency markers (Fig. 7B) and differentiation into three germ layers (Fig. 7C). In particular, AA2G dramatically promoted the establishment of GFP+ colonies (Fig. 7D), which represent fully reprogrammed iPSCs. Moreover, AA2G treatment reduced p53 protein levels in the SOKM-infected MEFs at 9 days after infection (Fig. 7E), and conversely, p53 overexpression significantly inhibited the formation of GFP+ colonies by these cells at 15 days after infection (Fig. 7F). Compared with mESCs, the murine iPSCs established in this study showed similar expression of pluripotency genes except cMyc, Tfcp2l1, and Dnmt3L, which were reduced in the iPSCs (Supplementary Fig. S7A). In response to AA2G, they upregulated a subset of TET-dependent (Supplementary Fig. S7B) and CREB1-dependent (Supplementary Fig. S7C) VitC target genes, although their induction in murine iPSCs was lower than in mESCs. Taken together, these results demonstrate that AA2G recapitulates the beneficial effects of VitC on the reprogramming of somatic cells, primarily by decreasing p53 levels and alleviating cellular senescence.

AA2G induces the primitive state of hMSCs
The core functions of MSCs are difficult to preserve by current culture methods (52). Since the viability of human UC-MSCs was improved by AA2G treatment (Supplementary Fig. S1F, G), we explored the potency of AA2G in these therapeutic SCs. When hESC-derived multipotent MSCs (M-MSCs) (21) were maintained in AA2G-supplemented medium (AA2G M-MSCs) for three passages, the basic characteristics of M-MSCs in terms of the expression of surface markers (Supplementary Fig. S8A) and in vitro differentiation into chondrogenic, adipogenic, and osteogenic lineages (Supplementary Fig. S8B, C) were not significantly affected. However, AA2G M-MSCs showed increased colony-forming unit-fibroblast (CFU-F) activity, which reflects the presence of true clonogenic progenitor cells (Fig. 8A). The AA2G-treated cells exhibited higher levels of chemoattraction to platelet-derived growth factor (PDGF) (Fig. 8B and Supplementary Fig. S8D), indicative of an improvement in their mobilization and homing capacity. The increase in chemotactic activity was dependent on PDGF receptor (PDGFR), as it was blocked by the PDGFR inhibitor STI571. Accordingly, AA2G M-MSCs expressed elevated levels of PDGFR protein (PDGFRα) at the cell surface (Fig. 8C) and exhibited elevated PDGF signaling activity (Fig. 8D, E). Furthermore, these AA2G-treated cells had improved angiogenic potency in Matrigel tube-forming assays (Fig. 8F).
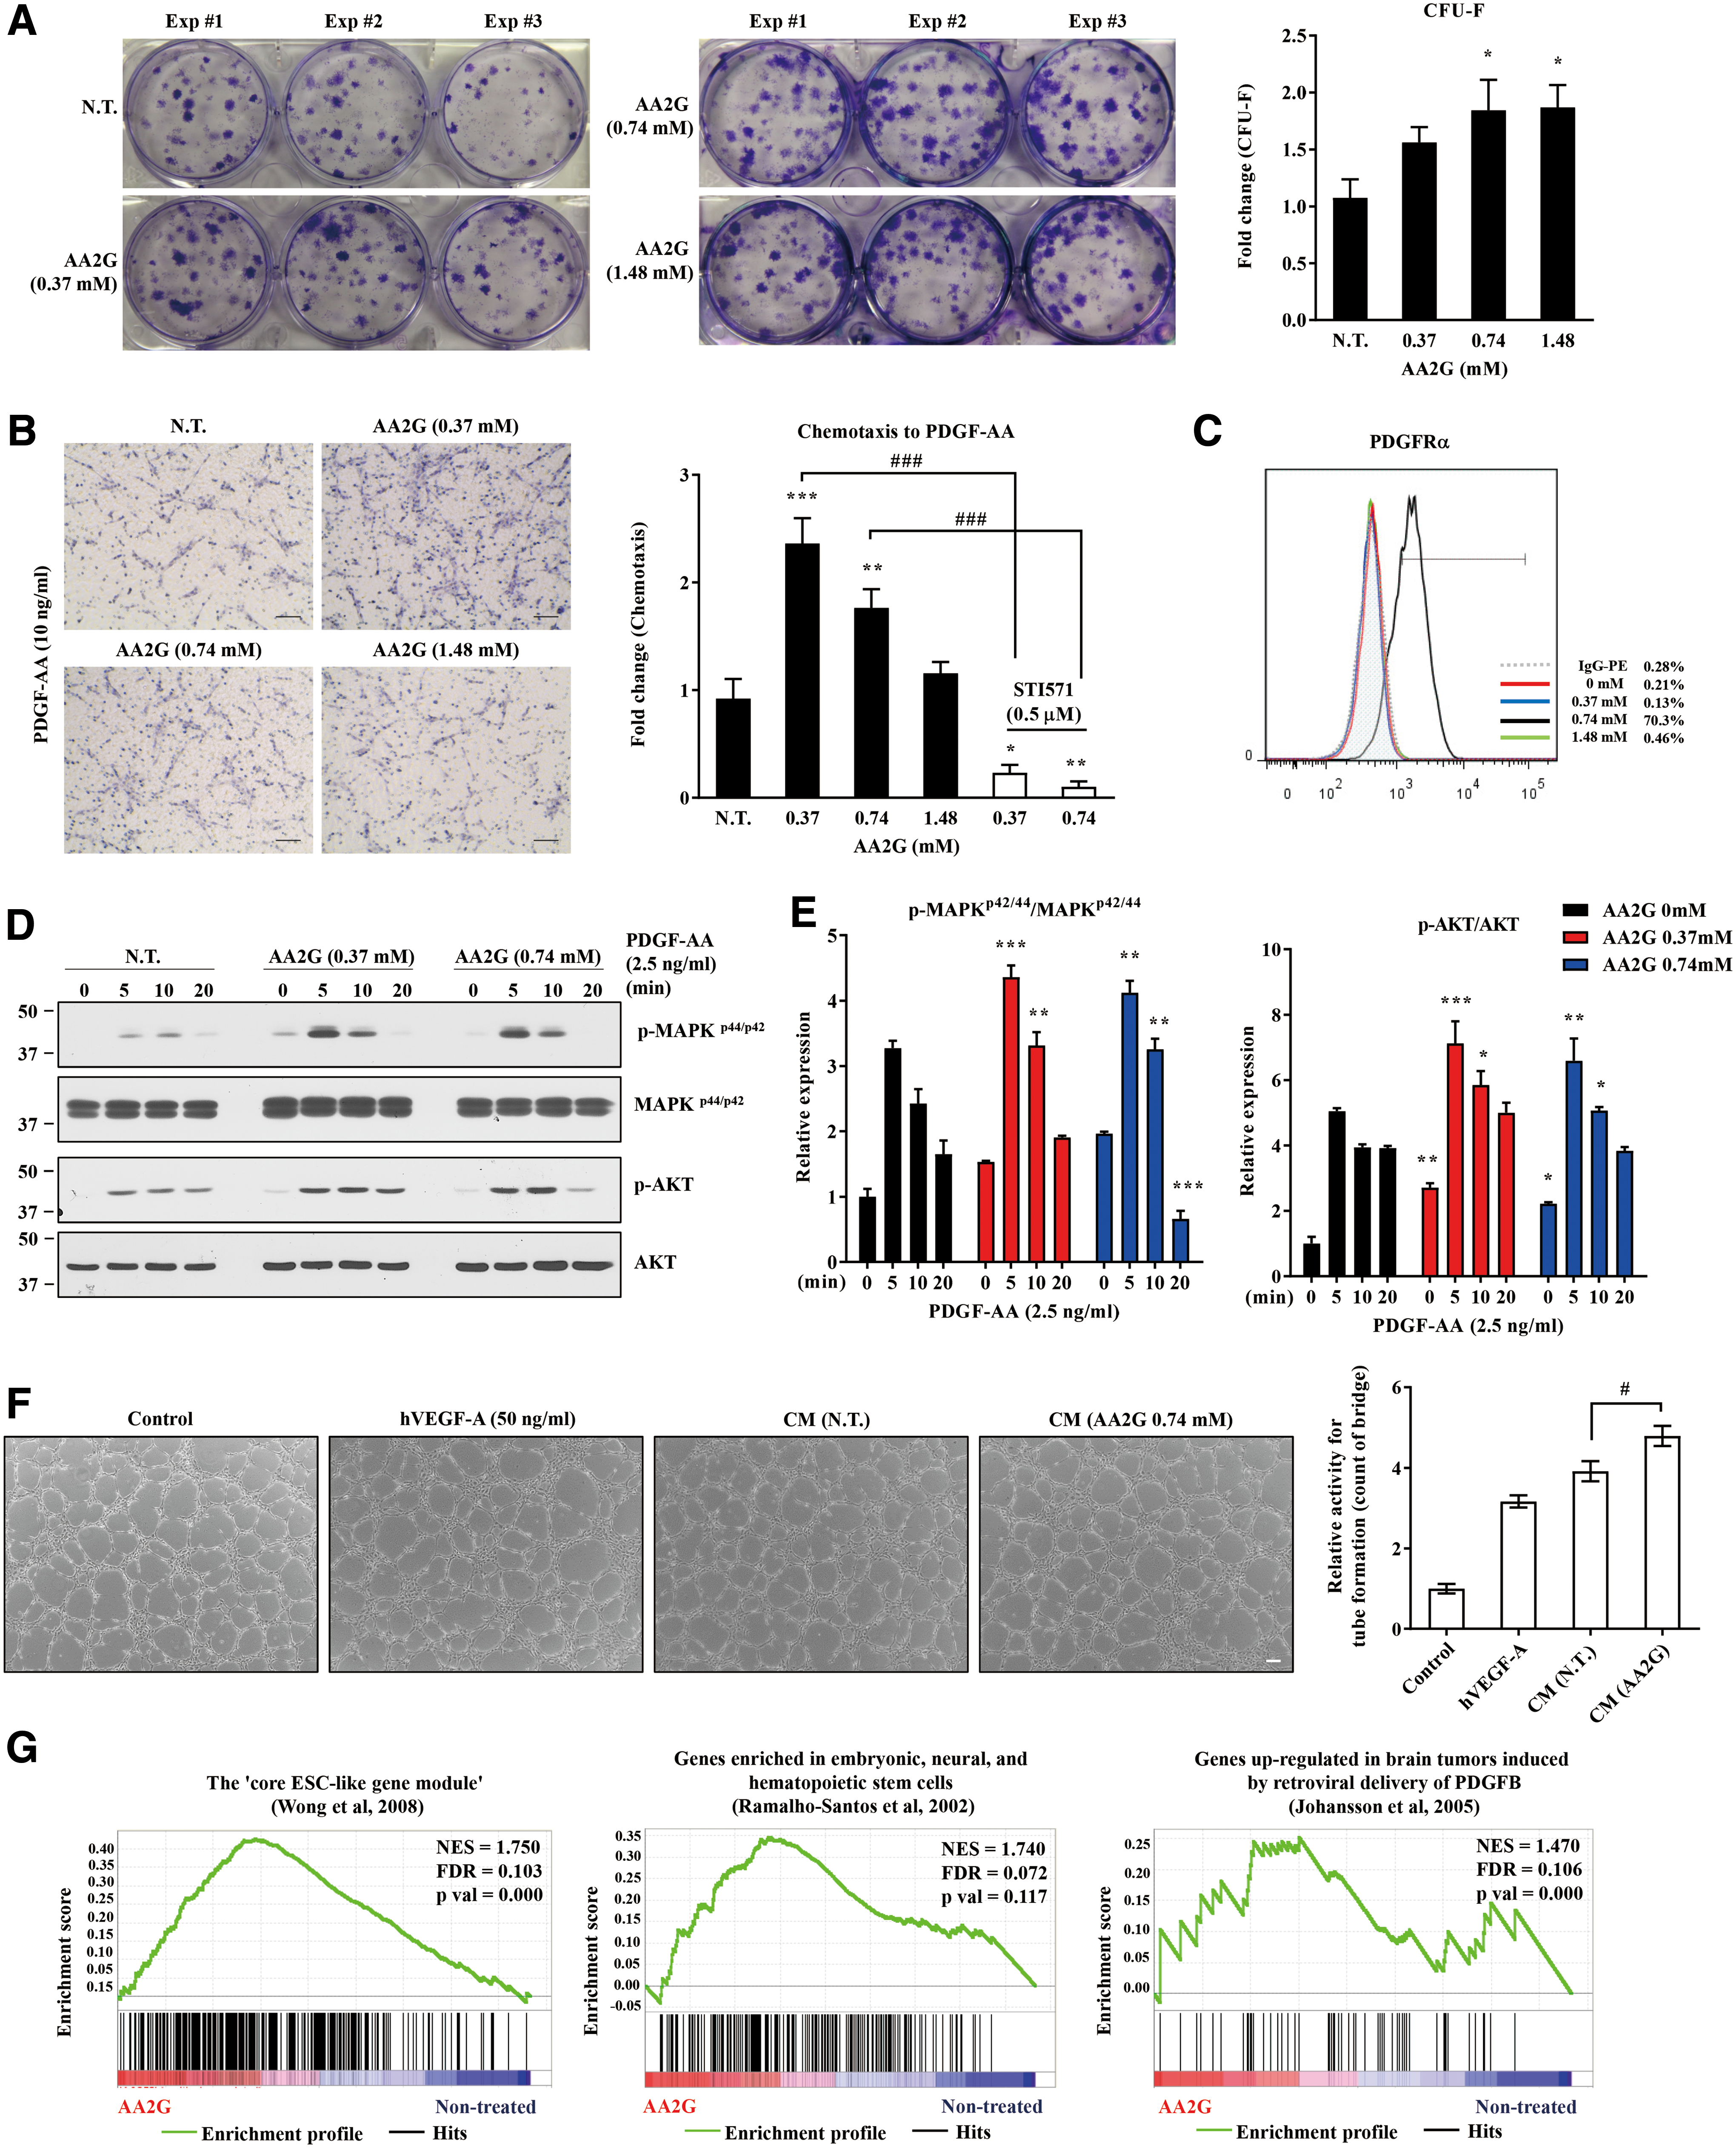
A transcriptome analysis focused on curated gene sets related to SC self-renewal and differentiation potency (Supplementary Data set S2) revealed that AA2G M-MSCs, compared with naive cells, were enriched for gene sets representing core ESC-like gene modules, genes shared by embryonic, neural, and hematopoietic SCs, and genes upregulated by PDGF (Fig. 8G), as well as gene sets related to DNA methylation (Supplementary Fig. S8E).
We next examined the effect of AA2G on hMSCs with different tissues of origin. Consistent with the above data, UC-MSCs treated with AA2G (AA2G UC-MSCs) showed significantly increased proliferation, CFU-F activity, chemotaxis toward PDGF-AA, and proangiogenic capacity (Supplementary Fig. S9A–D). Conditioned medium (CM) collected from AA2G UC-MSCs strongly repressed the secretion of tumor necrosis factor-α (TNF-α) from MH-S cells, an alveolar macrophage cell line, following stimulation with lipopolysaccharide (29), indicating that AA2G increases the anti-inflammatory potency of MSCs. By contrast, CM from IMR90 cells, a type of human lung fibroblast, exhibited little change in in vitro anti-inflammation assays (Supplementary Fig. S9E). Taken together, these results indicate that AA2G also promotes the primitive state of hMSCs derived from ESCs or UC, as evidenced by improvements in their proliferative, self-renewal, migratory, proangiogenic, and anti-inflammatory capacities, all of which are crucial for their therapeutic potency.
Improved therapeutic potency of AA2G M-MSCs in an experimental asthma model
Next, we evaluated the beneficial effects of AA2G M-MSCs in vivo. To this end, we administered these cells in a mouse asthma model (27), and compared their therapeutic effects with those of nontreated cells. OVA- and poly IC-sensitized mice were characterized by severe inflammation in the bronchial and vascular areas of lung tissues (Fig. 9A), and exhibited a significant increase in overall cellularity and the abundance of inflammatory cells in the bronchoalveolar lavage fluid (BALF) (Fig. 9B, C). These deleterious inflammatory responses were ameliorated by administration of all M-MSCs tested. Importantly, AA2G M-MSCs attenuated lung inflammation (Fig. 9A) and the infiltration of inflammatory cells, including macrophages, neutrophils, and lymphocytes, in the BALF (Fig. 9B, C) more effectively than nontreated cells. Accordingly, mice administered AA2G M-MSCs had reduced levels of TNF-α and interleukin-17 (IL-17) (Fig. 9D and Supplementary Fig. S10A), and increased levels of IL-10, an anti-inflammatory cytokine, in the BALF (Fig. 9D). Moreover, the lung tissues of these animals had the lowest levels of transcripts for inflammatory cytokines (e.g., Tnfα, Ccl2, Ccl7, Il1b, Il6, and Il18), but the highest expression of Tsg6, an anti-inflammatory gene (Fig. 9E and Supplementary Fig. S10B).
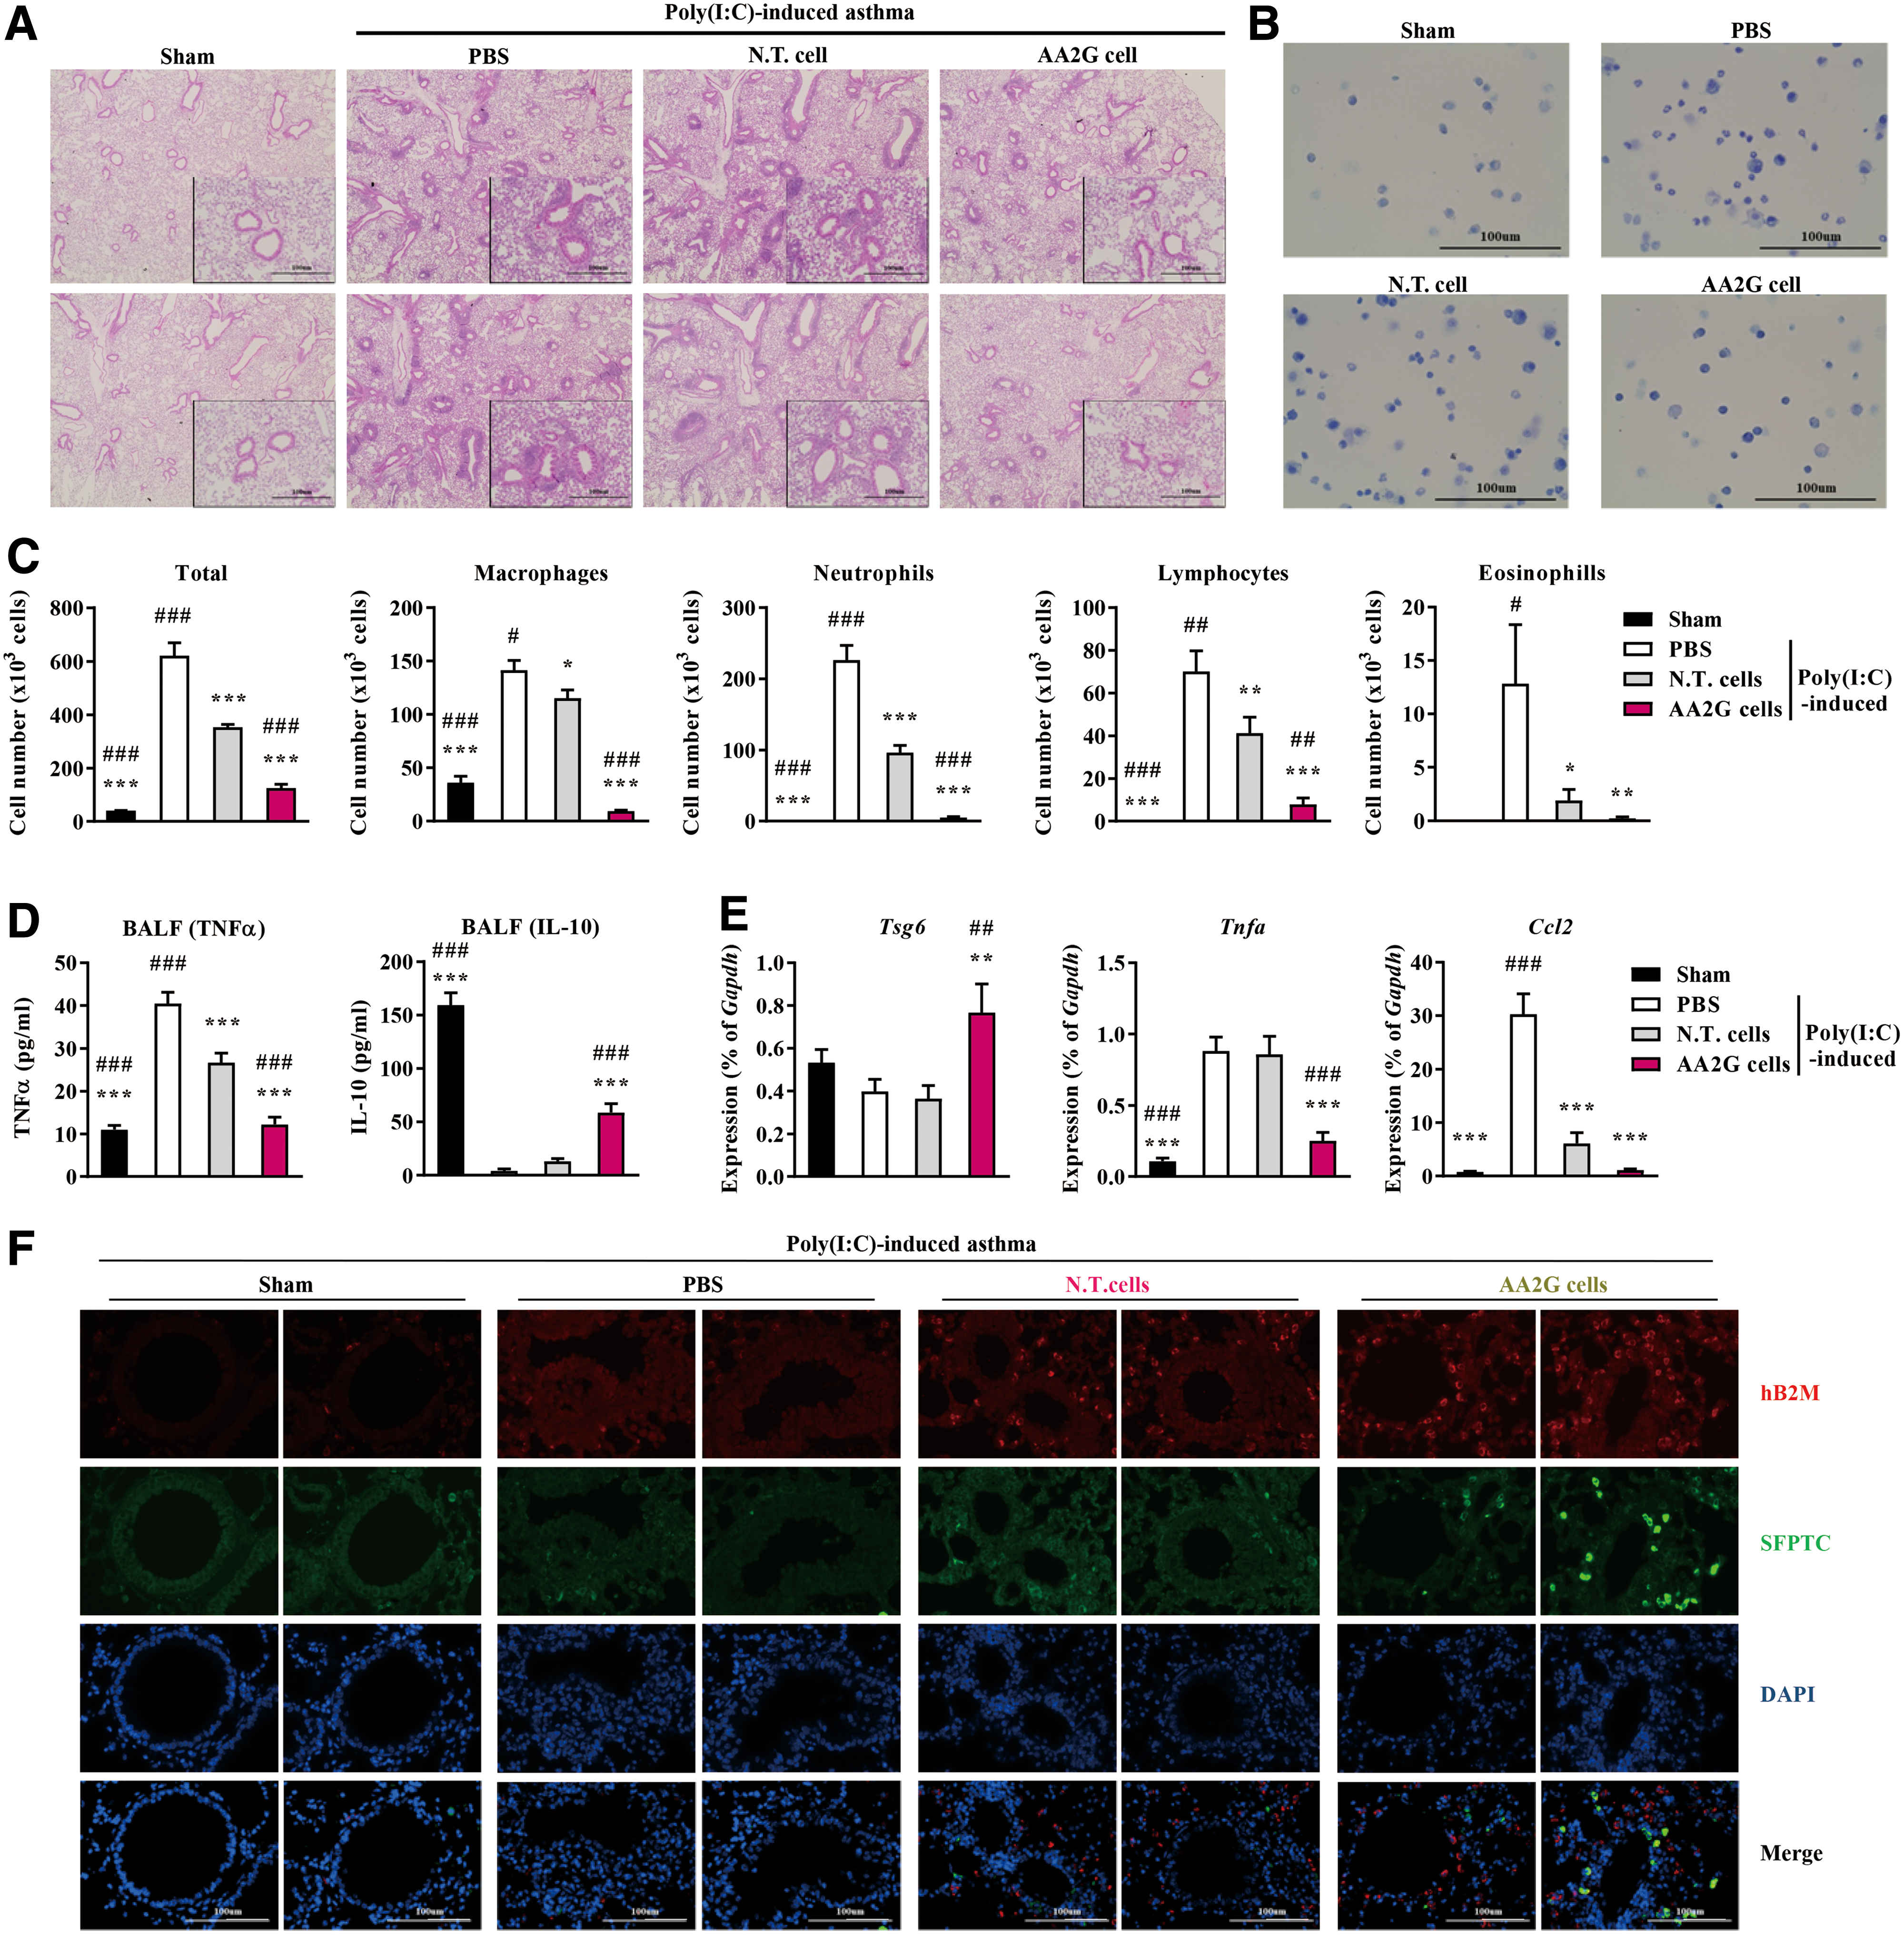
To obtain mechanistic insights into the improved outcomes obtained with AA2G M-MSCs, we compared the number of engrafted cells by staining lung tissue with an antibody specific for human β2-microglobulin (hB2M). Administration of AA2G M-MSCs resulted in greater engraftment in the lung than administration of nontreated cells (Fig. 9F). However, the majority of engrafted cells expressed low levels of prosurfactant protein C (SFTPC) (1), a type 2 alveolar epithelial cell marker, indicating that the engrafted cells promoted the anti-inflammatory response rather than directly transdifferentiating to tissue-resident cells. Together, these results demonstrate that AA2G supplementation of M-MSCs reinforces their therapeutic potency, that is, their ability to alleviate inflammatory responses in an experimental allergic asthma model.
CREB1 modulates the potency of AA2G in M-MSCs
To dissect the molecular mechanisms underlying the potency of AA2G in M-MSCs, we compared the transcriptomes of AA2G M-MSCs and nontreated cells. Consistent with the results of in vitro and in vivo functional assays, AA2G M-MSCs exhibited a characteristic expression pattern, distinct from that of nontreated cells, related to immune responses, neurogenesis, reproduction, and chemotaxis (Fig. 10A, B, and Supplementary Data set S1). MetaCore analysis revealed that the transcriptome of AA2G M-MSCs was characterized by differential regulation of the CREB1 gene network in connection with phospholipase C—activating G-protein-coupled receptors (GPCRs), transcription initiation factor complex (TATA box-binding protein-associated factor 5), and several small nucleolar RNAs (Fig. 10C). Gene expression analysis showed that some of these CREB1-associated genes were upregulated in response to AA2G treatment (Fig. 10D).
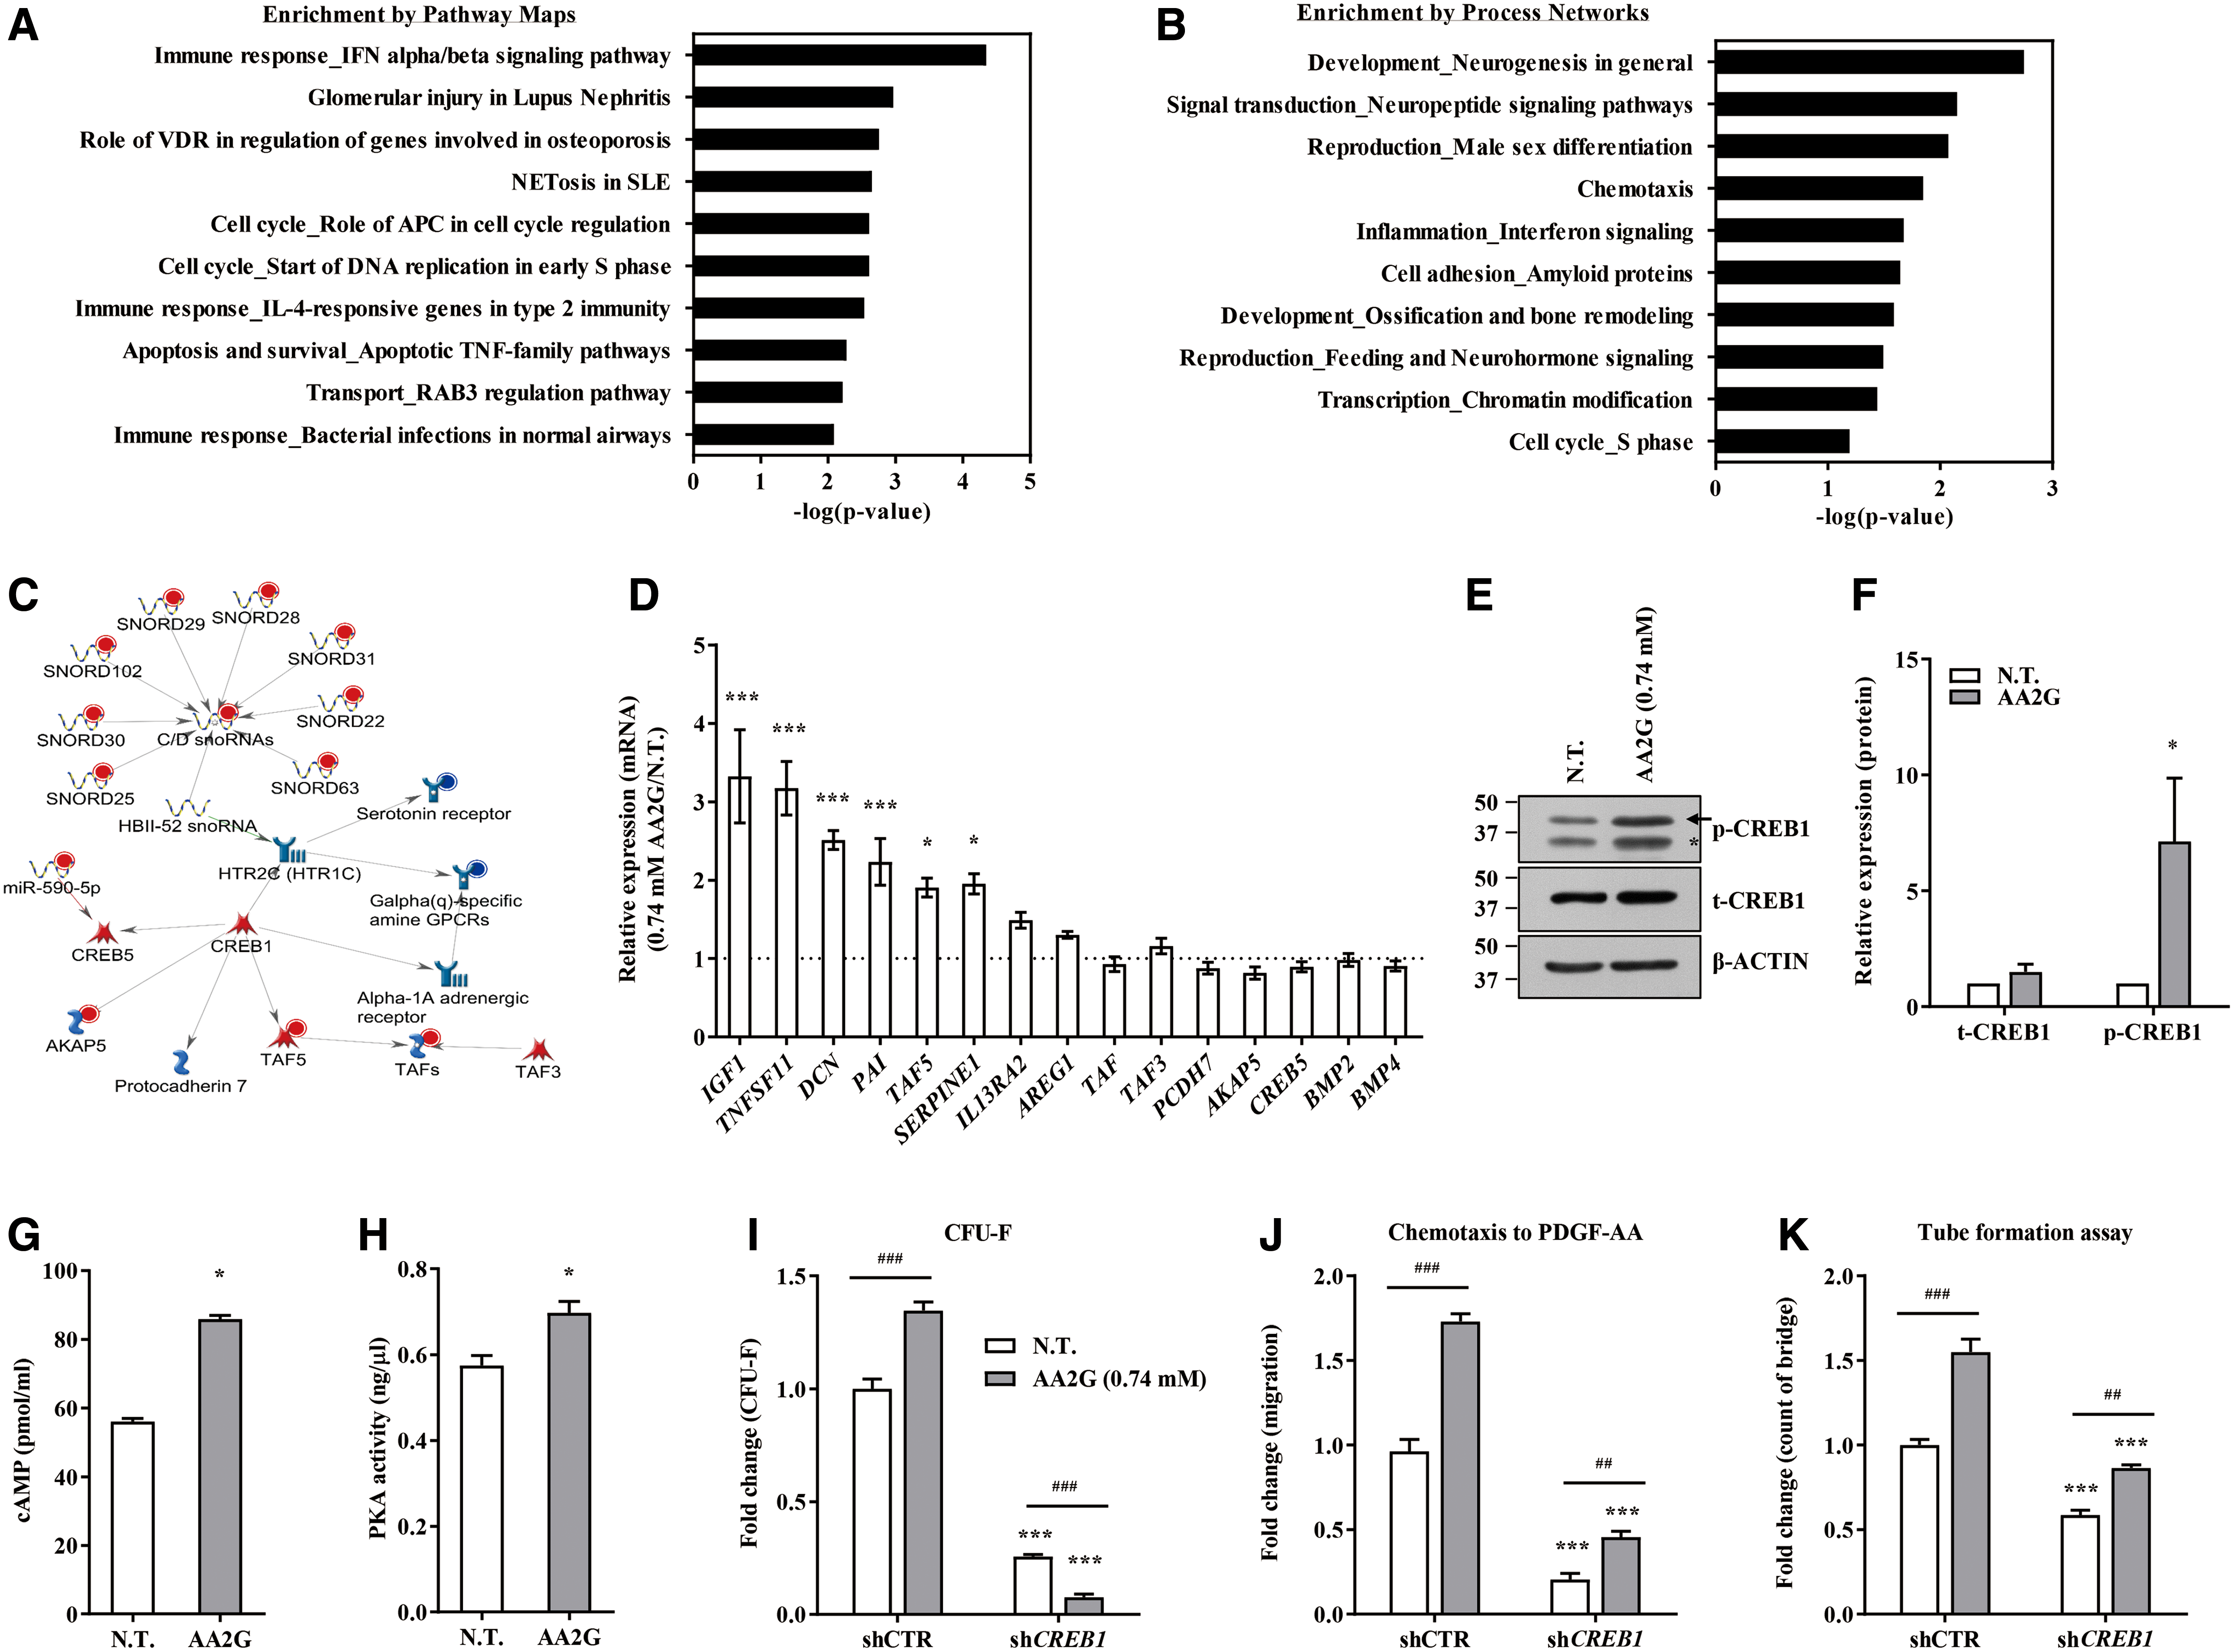
AA2G M-MSCs showed an increase in the amount of phosphorylated CREB1 protein (Fig. 10E, F), as well as increased luciferase reporter activity, which represents CREB1-mediated transcription (Supplementary Fig. S10C). The other antioxidants tested had minimal effects on CREB1 reporter activity in M-MSCs (Supplementary Fig. S10C, D), indicating the specificity of AA2G on the CREB1 pathway. Consistent with these findings, AA2G treatment increased the level of cAMP and related PKA activity in M-MSCs (Fig. 10G, H). Notably, silencing of CREB1 severely impaired the beneficial effects of AA2G on M-MSCs with respect to self-renewal (CFU-F) activity, PDGF-responsive cell migration, and anti-inflammatory potency (Fig. 10I
Discussion
The results of this study demonstrate that AA2G, as a stable component of the culture medium, induces naive pluripotency in mESCs and the primitive state in hMSCs derived from ESCs or UC (Table 1). Mechanistically, along with TET-dependent DNA demethylation, the CREB1 pathway functions as a common modulator of AA2G potency in mESCs and hMSCs (Fig. 11). The in vivo significance of this simple and reliable application of AA2G on therapeutic SCs was demonstrated in an asthma mouse model. Furthermore, we found that AA2G promotes reprogramming of murine somatic cells by suppressing p53 activation. Taken together, these findings indicate that AA2G supplementation facilitates in vitro capture and maintenance of the stemness of SCs within their specialized niches.

Summary of the Effects of Ascorbic Acid 2-Glucoside and Related Mediators in Stem Cells
Up (↑) and down (↓) arrows indicate positive and negative effects of AA2G, respectively. In miPSCs, modes of action of TET and CREB1 are depicted based on the results of the expression analysis of TET- and CREB1-dependent target genes.
AA2G, ascorbic acid 2-glucoside; CFU-F, colony-forming unit-fibroblast; CREB1, cAMP-responsive element-binding protein-1 hESC, human embryonic stem cell; hMSC, human mesenchymal stem cell; mESC, murine embryonic stem cell; miPSC, murine induced pluripotent stem cell; N.D., not determined; PKA, protein kinase A; TET, ten–eleven translocation.
Unlike VitC, AA2G was very stable in several types of culture media (Fig. 1B and Supplementary Fig. S1A), suggesting that it will remain potent over long periods of time without requiring frequent replacement of the culture medium. The stability of AA2G in culture media was similar to that of AA2P, another stable VitC derivative that has been used in many prior studies (2, 5, 8, 60). This advantage of AA2G is consistent with a previous report that compared the antioxidative and antiaging activities of AA2G and VitC on human dermal fibroblasts (50). Furthermore, AA2G promoted the viability of mESCs, hMSCs, and human teratocarcinoma cells, in striking contrast to the cellular toxicity observed upon VitC treatment (Fig. 1C and Supplementary Fig. S1B–G). This can be explained by differences in oxidation and cellular uptake between AA2G and VitC (Fig. 11). For example, VitC-treated fibroblasts incorporate 12-fold more ascorbic acid than AA2G-treated cells, and such high levels of incorporated ascorbic acid can result in ROS generation. In addition, in cultured human colorectal cancers harboring KRAS and BRAF mutations, uptake of the oxidized form of VitC causes oxidative stress because it is reduced to VitC by depleting GSH (62). By contrast, AA2G is gradually converted to ascorbic acid by cellular α-glucosidase, and is therefore only slowly incorporated into cells, so that small amounts of ascorbic acid are supplied continuously, allowing cells to obtain the full benefits of the physiological activity of AA2G (56). VitC-induced ROS inactivate glyceraldehyde 3-phosphate dehydrogenase, thereby specifically inducing cell death of highly glycolytic KRAS- and BRAF-mutant cancer cells. Thus, the lower levels of oxidative stress induced by AA2G (Fig. 1E) are critical for ensuring the viability of primitive SCs, which heavily rely on anaerobic glycolysis (23).
To the best of our knowledge, this is the first study of the effects of AA2G on primitiveness of SCs ranging from mESCs to hMSCs. The beneficial effects of VitC have been investigated in several biological systems. For example, VitC induces naive pluripotency of mESCs by modulating DNA demethylation and microRNA expression (2, 15), and promotes iPSC generation through chromatin (49, 53) remodeling and signaling modulation (11) or their collaborative functions (51). Furthermore, VitC stimulates the stemness and functions of ASCs by increasing their antioxidant capacity and extracellular matrix production (5, 60). Due to its superior stability and beneficial effects on cellular viability (Fig. 1), AA2G recapitulated the majority of functions reported for VitC, such as promotion of TET-dependent DNA demethylation in mESCs (Fig. 3), suppression of p53 during generation of murine iPSCs (Fig. 7), and maintenance of the primitiveness in hMSCs (Fig. 8 and Supplementary Figs. S9 and S10). This is relevant from a practical point of view because the use of AA2G as a stable component of the culture medium could preserve the naive pluripotency of mESCs and enrich primitive hMSCs without the cellular toxicity associated with VitC.
As previously reported, VitC improves the pluripotency of human parthenogenetic ESCs by modifying imprinted gene expression in the Dlk1–Dio3 region (61). In addition, 2i-LIF culture medium supplemented with basic fibroblast growth factor (bFGF), VitC, and forskolin induced naive pluripotency in hESCs (9). Although the cellular toxicity of VitC was minimal in cultures of hESCs (Supplementary Fig. S1E), its beneficial effects are limited by its chemical instability in culture medium; therefore, whether AA2G can recapitulate the beneficial effects of VitC on hESCs and iPSCs must be determined to broaden its application in regenerative medicine.
Interestingly, VitC protects against abnormal DNA methylation of the Dlk1–Dio3 imprinting region in mESCs and iPSCs (15, 49), as well as hESCs (61). We reported previously that SIRT1, a nicotinamide adenine dinucleotide+-dependent class III histone deacetylase, protects against aberrant DNA methylation in a subset of imprinted and germ line developmental genes that are susceptible to epigenetic instability in PSCs (20). Consistent with this, the transcriptome of mESCs cultured with AA2G supplementation was characteristically enriched for gene sets representing Sirt1-targeted germ line developmental genes (Supplementary Fig. S3C). Moreover, AA2G supplementation significantly promoted the upregulation of these Sirt1 target genes, especially Meg3, H19, and Lit1 (imprinted), as well as Ddx3y, Uty, Stra8, Serpinb6c, and Sycp3 (germ line) (Supplementary Fig. S3D). Indeed, AA2G induced the expression of Sirt1 transcript and protein, leading to increased Sirt1 enzymatic activity in mESCs (Supplementary Fig. S3E−G). The activation of SIRT1 was also observed in AA2G-treated hMSCs (Supplementary Fig. S10I). VitC stimulates the activity of SIRT1 (13), and SIRT1 acts as a key mediator in the protective effect of VitC in several biological systems, including human retinal pigmented epithelium and dermal fibroblasts (50). The association between VitC and SIRT1 can be attributed primarily to the modulation of the antioxidant balance. This considerable overlap between VitC and SIRT1 target genes suggests the role of a mechanism other than the TET system in the biological effects of VitC and AA2G on SCs.
Based on our transcriptome analysis, we conclude that the CREB1 pathway is involved in inducing naive pluripotency in mESCs (Figs. 4
Interestingly, the expression of Dnmt3a and Dnmt3L was reduced in mESCs treated with AA2G (Fig. 2C), possibly suggesting an interplay between the CREB1 and DNMT pathways. Using previously published data sets from a 5mC DIP followed by deep sequencing (DIP-seq) study of VitC-treated mESCs (1) and from a genome-wide study of CREB1-binding target genes (63), we identified the promoter regions of Dnmt1, Dnmt3a, and Dnmt3L that could be affected by DNA methylation and CREB1 binding (Supplementary Fig. S11). DIP-qPCR and CREB1 chromatin immunoprecipitation (ChIP) assays revealed that the region near the transcription start site of Dnmt3L was characterized by increased CREB1 binding in AA2G-mESCs, but that a gain in 5mC may prevent induction of Dnmt3L expression. At the Dnmt3a and Dnmt1 loci, AA2G treatment markedly increased 5hmC levels and CREB1 binding, but decreased 5mC levels (Supplementary Fig. S11). The regions that were not targeted by the CREB1 protein were also characterized by increased 5hmC and decreased 5mC in response to AA2G treatment. However, although these changes were expected to lead to increased transcription, there was minimal induction of genes encoding Dnmts in AA2G-mESCs (Supplementary Fig. S2C). These results suggest that other epigenetic or transcriptional mechanisms are responsible for the effects of AA2G on the expression of Dnmts in mESCs. Furthermore, AA2G induced the expression of both TET- and CREB1-dependent VitC target genes in mESCs even when Dnmt enzymatic activity was inhibited by knockout of Dnmt3L using CRISPR-Cas9 or by treatment with 5-azacytidine, a known DNMT chemical inhibitor (Supplementary Fig. S12). Therefore, further study is required to investigate the complex mechanisms involved in the induction of VitC target genes, which may depend on the epigenetic context or the expression of certain transcription factors.
In our transcriptome analysis, genes related to GPCRs were represented in the CREB1-associated gene networks characterized by AA2G treatment. GPCRs are responsible for transducing extracellular signals underlining different pathophysiological conditions via their coupling to heterotrimeric G proteins consisting of α, β, and γ subunits (44). In particular, the Gs alpha subunit protein (Gαs), unlike Gi (Gαi/o), activates adenylyl cyclase and stimulates cAMP- and PKA-dependent pathways, which were activated in both AA2G-treated mESCs and hMSCs. Indeed, AA2G treatment of mESCs decreased the expression of Gnai1 encoding adenylate cyclase-inhibiting Gα protein (Supplementary Fig. 13A). Melittin inhibits Gαs and stimulates Gi/o. In both mESCs and hMSCs, melittin inhibited the effects of AA2G on cell viability and the induction of TET- and CREB1-dependent VitC target gene expression, indicating that Gαs and Gαi/o subunits are involved in AA2G-mediated activation of the cAMP-PKA-CREB1 signaling cascade (Supplementary Fig. 13B−F). In addition, the results of the CREB1 gene network assay indicated repression of HTR2B, a Gq alpha subunit (Gαq)-specific amine GPCR (Fig. 10C), in M-MSCs treated with AA2G, which was validated by the results of the qPCR assay (Supplementary Fig. 13G). It is known that Gαq activates protein kinase C by inducing the release of calcium ions (Ca2+) from the endoplasmic reticulum, which results in the phosphorylation of p40phox and the promotion of NADPH oxidase complex assembly, resulting in ROS generation (44). Interestingly, high intracellular Ca2+ is detrimental to the preservation of the primitiveness of hematopoietic SCs because it promotes the cleavage of TET2 by calpain proteases (36).
However, the present study has several limitations that need clarification: (i) the precise role and downstream effectors of the Gαq and Ca2+ signaling cascades remain to be investigated and (ii) the distinct contribution and detailed mechanism of each Gα subunit signaling cascade in mediating the biological effects of AA2G in different cellular contexts need to be addressed. In addition, the in vivo effects of AA2G-treated M-MSCs were evaluated only by examining their effects on airway inflammation. Other crucial asthma pathologies, such as airway hyper-responsiveness and remodeling, were not examined in this study. Therefore, further study is necessary to overcome these limitations to provide precise insights into the mechanistic and therapeutic outcomes of AA2G or other VitC derivatives in determining the primitiveness of SCs.
In summary, we show that AA2G exerts long-lasting pleiotropic effects that promote the naive pluripotency of mESCs, the primitive state of hMSCs, and the generation of murine iPSCs. Along with TET-dependent DNA demethylation, the CREB1 pathway serves as a common modulator of AA2G potency in mESCs and hMSCs. Given that AA2G recapitulates well-recognized effects of VitC with no cellular toxicity in highly glycolytic cells, it could provide a stable environment favorable for the maintenance of naive pluripotency in mESCs or primitiveness in hMSCs, which in general are difficult states to maintain in vitro. Thus, AA2G represents a simple and reliable tool for ensuring the developmental potency and clinical safety of SCs.
Materials and Methods
Study approval
All animal experiments were approved by the Institutional Animal Care and Use Committee of the University of Ulsan College of Medicine (IACUC-2016-12-103). Human UC samples were obtained from healthy, normal, full-term newborns after obtaining written, informed parental consent in accordance with the guidelines approved by the Ethics Committee on the Use of Human Subjects at Asan Medical Center. Informed consent was obtained from all pregnant mothers before UC collection.
Cell culture
Murine R1 ESCs and ES-E14TG2a cells (purchased from ATCC, Manassas, VA) were grown in 15% heat-inactivated FBS (HyClone, Pittsburgh, PA) and 100 IU/mL ESGRO/LIF (Millipore, Billerica, MA), or in 2i-LIF medium containing the ESGRO-2i Supplement Kit (Millipore), on 0.1% gelatin-coated tissue culture dishes, as previously described (20). The NTERA2 human teratocarcinoma cell line (purchased from ATCC) was cultured in Dulbecco's modified Eagle's medium (DMEM)–high-glucose medium (HyClone) supplemented with 2 mM
In vitro characterization of SCs
Cell viability after treatment with the indicated concentrations of AA2G or VitC (Sigma-Aldrich) was determined by MTT assay (Sigma-Aldrich). The activity of AP in undifferentiated ESCs or established iPSCs was assessed using the AP Staining Kit (Sigma-Aldrich). The frequency and size distribution of AP-stained PSC colonies were analyzed using the GelCount colony counter (Oxford Optronix, Sanborn, NY) at its default settings. Cell proliferation, self-renewal (CFU-F), multipotency (in vitro differentiation into chondrogenic, osteogenic, or adipogenic lineages), surface marker expression, transwell migration, in vitro anti-inflammation assays for MSCs (25, 34), and quantification of angiogenesis in the in vitro Matrigel assay (17) were performed as previously described. Chemotactic activity was measured using an 8-μm-pore Boyden chamber (Corning) with 10 ng/mL PDGF-AA (R&D Systems, Minneapolis, MN) in the lower chamber. The PDGF signaling cascade was inhibited using the PDGFR inhibitor STI571 (Selleckchem, Houston, TX). Cell function assays were quantified by digital image analysis using Image Pro 5.0 software (Media-Cybernetics, Rockville, MD).
RNA interference
For the RNA interference-mediated gene KD assay, shRNAs against murine or human CREB1 were cloned into the pLenti6/Block-iT lentiviral vector (Invitrogen/Thermo Fisher Scientific, Waltham, MA) as previously described (34). The sequences of the oligonucleotides in each shRNA are indicated in Supplementary Table S1.
CRISPR-Cas9-based gene knockout
For the CRISPR-Cas9-based gene silencing, guide RNAs (gRNAs) designed against murine Tet1 or Tet2 were cloned into pLX-sgRNA (Addgene plasmid 50662) (54) or pSpCas9(BB)-2A-Puro (PX459) (Addgene plasmid 48139) (45), respectively. After cotransfection, Tet1- and Tet2-deficient mESCs (Tet1;Tet2-DKO) were selected with 1 μg/mL puromycin and 4 μg/mL blasticidin (Invitrogen), and cloned by limiting dilution. The sequences of each gRNA are provided in Supplementary Table S1.
Transcriptome microarray analysis
Total RNA from various cells was isolated using the RNeasy Mini Kit (Qiagen, Hilden, Germany), including treatment with DNase I (Qiagen). One microgram of total RNA was subjected to analysis using the Affymetrix GeneChip Mouse (for comparison between AA2G-treated and nontreated mESCs; Figs. 1–6) or Human (for comparison between AA2G-treated and naive M-MSCs; Figs. 8–10) 2.0 ST Array (Affymetrix, Santa Clara, CA). Microarray image data were processed on a GeneChip GCS3000 Scanner and Command Console software (Affymetrix). CEL files for six samples (three biologically independent replicates from each group) for each murine and human SC type were separately imported, and the data were summarized and normalized using the robust multiaverage method using Affymetrix Expression Console software.
Functional analysis of transcriptomes and core analyses of gene networks, biofunctions, and canonical pathways were performed using MetaCore (Clarivate Analytics, Philadelphia, PA) or GSEA (Broad Institute, Cambridge, MA) microarray software with default settings. In the MetaCore analysis, 1.5-fold up- or downregulation with p < 0.05 was defined as the cutoff value for significant change. Details of the statistical values and significant genes for biological processes and pathways in the MetaCore analysis are described in Supplementary Data set S1. For GSEA, gene sets were obtained from published literature or filtered from a curated functional gene set (C2) database. Significant differences were determined based on a false discovery rate <0.25. A detailed list of gene sets with the corresponding genes and references is described in Supplementary Data set S2.
Real-time qPCR
Total RNA (400 ng) was reverse-transcribed with the TaqMan Reverse Transcription Reagent (Applied Biosystems/Thermo Fisher Scientific). Quantification of the indicated transcripts was performed as previously described (20, 46).
5mC or 5hmC DIP and ChIP analysis
DNA modified with 5mC or 5hmC was enriched using the MethylCollector Ultra or Hydroxymethyl Collector Kit, respectively (Active Motif, Carlsbad, CA), using 1 μg of genomic DNA fragmented with the MseI restriction enzyme (New England Biolabs, Inc., Ipswich, MA). ChIP analysis was performed using the Magna ChIP G kit (Millipore). The immunoprecipitated DNA was quantified by quantitative real-time qPCR as previously described (20). All primer sequences used in gene expression or epigenetic assays are described in Supplementary Data set S3.
Measuring the level of 5hmC or 5mC
Genomic DNA was isolated using the DNeasy Kit (Qiagen), and the amount of 5hmC or 5mC was quantified by dot blot assay using a rabbit anti-5hmC polyclonal or a mouse anti-5mC monoclonal antibody (Active Motif; 1:500), as previously described (2).
For immunocytochemistry assays, ESCs were fixed with 4% paraformaldehyde (Sigma-Aldrich) for 30 min and stained using an antibody specific for 5hmC (Active Motif; 1:100). Immunostaining was visualized using an Alexa Fluor 488-labeled anti-rabbit secondary antibody (Invitrogen). Nuclei were counterstained with 6-diamino-2-phenylinodole (DAPI; Thermo Fisher Scientific). Stained samples were photographed on a Zeiss LSM710 confocal microscope (Carl Zeiss, Munich, Germany).
Liquid chromatography multiple-reaction-monitoring mass spectrometry
The LC system comprised an Agilent 1290 Infinity UHPLC System with a reverse-phase ultraperformance liquid chromatography column (Agilent ZORBAX Eclipse Plus C18 Column, 95 Å, 2.1 mm i.d. × 100 mm, packed with 1.8 μm of C18 resin) at a temperature of 50°C. The mobile phases used in this study were 0.1% formic acid in water (solvent A) and 0.1% formic acid in acetonitrile (solvent B). A gradient of 0–2% solvent B for 5 min, 2–3% solvent B for 5 min, 3–50% solvent B for 1 min, 50–50% solvent B for 4 min, 50–0% solvent B for 1 min, and 0–0% solvent B for 9 min was applied at a flow rate of 0.1 mL/min. The sample injection amount was 50 ng of hydrolyzed DNA and isotope-labeled internal standards (2H3-5hmC, H946632; 2H3-5mC, M295902; Toronto Research Chemicals, Ontario, Canada). The UHPLC system was coupled with a triple quadrupole mass spectrometer (Agilent 6495 QQQ) by a standard-flow Jet Stream electrospray source operated in positive ion mode. Additional parameters are as follows: capillary voltage, 3.5 kV; nozzle voltage, 1 kV; gas temperature, 290°C; drying gas flow rate, 11 L/min at 350°C; nebulizer gas pressure, 40 PSI at 350°C; and unit resolution for Q1 and Q3. MRM transitions used were as follows: 2H3-5hmC: m/z 261.2 to >145.1; 5hmC: m/z 258.2 to >142.1; 2H3-5mC: m/z 245.2 to >129.1; 5mC: m/z 242.2 to >126.1; C: m/z 288.1 to >112.1; T: m/z 243.1 to >127.0; A: m/z 252.2 to >136.0; and G: m/z 268.3 to >152.1. The collision energy of all transitions was set to 5 V, and the cell accelerator voltage was set to 7 V. Quantification experiments were performed in triplicate using nonscheduled MRM with 100 dwell time and an ∼1.5 s total cycle time. The mass spectrometer was operated with MassHunter software (version B.08.00; Agilent), which generated MRM/MS data (*.d). Skyline (64-bit, version 4.2.0.18305) (38) was used to analyze MRM results from extracted ion chromatograms.
Calibration of MRM measurements using isotope-labeled standards
Calibration of standards was carried out by performing LC-MRM/MS on varying amounts of 2H3-5hmC and 2H3-5mC on a background of 50 ng of pooled hydrolyzed DNA. The background gDNA sample was prepared by mixing equal volumes of samples treated with 0, 0.37, 0.74, or 1.48 μM AA2G (four samples in total). The 2H3-5hmC concentrations were 0.05, 0.1, 0.5, 5, 25, 50, 100, 500, and 1500 fmol, and the 2H3-5mC concentrations were 0.0025, 0.005, 0.01, 0.05, 0.2, 1.0, 5.0, 10.0, and 20.0 fmol. Measurements were performed in triplicate. Calibration curves were obtained relating the peak area ratios of heavy (standard) to light (endogenous). The linear response range, within which triplicate quantification data at each concentration showed a coefficient of variation of <25% and linear regression showed an R 2 regression coefficient of >0.999, was determined.
Absolute LC-stable isotope dilution-MRM-MS quantification
We assumed that the total amount of genomic DNA (A, T, C, and G content) was equal across all samples. In each sample, the normalization factor, the ratio of the geometric mean of the four nucleotides (A, G, T, and C) divided by the corresponding median value of all samples, was calculated. 5hmC and 5mC were absolutely quantified by applying the normalized peak area (endogenous nucleoside/normalization factor) to the heavy (spiked standard) ratio in the linear equation generated from the calibration curves.
For analyses using descriptive statistics, analysis of variance (ANOVA) and Tukey's multiple comparisons tests were performed within RStudio (version 1.1.456) using R (version 3.3.2). Other packages used in RStudio included ggplot2 and ggpubr for drawing scatterplots.
In vitro TET, DNMT, and SIRT1 activity assays
Recombinant TET2 protein (0.5 μg; Abcam) was used for measurement of TET enzymatic activity at various concentrations of AA2G or VitC using the Epigenase 5mC Hydroxylase TET Activity/Inhibition Assay Kit (Epigentek Group, Inc., Farmingdale, NY). The effect of AA2G on DNMT and SIRT1 enzymatic activity was examined using the EpiQuik DNA Methyltransferase Activity/Inhibition Assay Kit (Epigentek Group, Inc.) and the Sirtuin Activity Assay Kit (Fluorometric) (BioVision, Exton, PA), respectively. The data are presented as the fold change relative to untreated samples.
Quantification of cAMP and PKA activity
The intracellular amount of cAMP was measured in 20 μg cell extract using the Parameter cAMP Assay Kit (R&D Systems), and the PKA activity was measured using cell extracts prepared from 5 × 10⁵ cells using the PKA Kinase Activity Assay Kit (Abcam). Assays were performed according to the manufacturer's instructions.
Luciferase reporter assay
The functional activity of CREB1 protein was measured using a luciferase reporter with eight tandem cAMP response elements (8 × CRE-Luc), which was kindly provided by Dr. Youngsup Song, University of Ulsan College of Medicine, Seoul, Korea (48). This construct was cotransfected with a vector expressing β-galactosidase. After 24 h of transfection into ESCs using Lipofectamine 2000 (Invitrogen), luciferase activity was measured using a luciferase assay kit (Promega, Madison, WI) and normalized to the amount of β-galactosidase activity.
Western blot analysis
Cell extracts (30 μg) were prepared in RIPA lysis buffer (Santa Cruz Biotechnology, Santa Cruz, CA) supplemented with protease and phosphatase inhibitor cocktails (Roche, Indianapolis, IN) and 2.5 mM NaB (Millipore) and separated on 12% sodium dodecyl sulfate/polyacrylamide gel electrophoresis gels. The levels of the indicated proteins were assessed by probing with monoclonal antibodies specific to Oct4 and HA epitope (Santa Cruz Biotechnology), β-actin and Flag epitope (Sigma-Aldrich), Dnmt-3b (Abnova, Walnut Creek, CA), Dnmt3a, Dnmt3-like (Dnmt3L), Klf4, phosphorylated or total Creb1, phosphorylated or total MAPKp42/44, and AKT (Ser473) (Cell Signaling Technology, Danvers, MA), Nanog (ReproCELL, Kanagawa, Japan), Sox2, Tet2 (Abcam), Tet1, Klf2 (Millipore), and Tfcp2l1 (Aviva, San Diego, CA). To quantify the density of protein bands, quantitative digital image analysis was performed using ImageJ software (National Institutes of Health, Bethesda, MD). Relative protein expression was calculated by normalization to β-actin.
IP assay
Twenty-four hours after transfection with HA-tagged mouse Creb1 (kindly provided by Dr. Youngsup Song, University of Ulsan College of Medicine, Seoul, Korea) or cotransfection with Flag-tagged mouse Tet2 (Addgene plasmid 60939) (55), cell extracts were prepared using IP lysis buffer (50 mM Tris-Cl [pH 7.4], 0.5% NP-40, 150 mM NaCl, 1.5 mM MgCl2, 2 mM dithiothreitol, and 2 mM ethylene glycol tetraacetic acid) supplemented with protease/phosphatase inhibitors (Roche) and then centrifuged (12,000 g for 10 min at 4°C). The extracts were incubated with Protein G magnetic beads (Millipore) mixed with 1 μg of anti-HA antibody (clone HA-7; Sigma-Aldrich) for 3 h at 4°C. The immunoprecipitated proteins were washed four times with IP lysis buffer, and the bound proteins were eluted with 0.1 M glycine-HCl (pH 3.0) buffer according to the manufacturer's instructions. For immunodetection of the IP products, mouse or rabbit IgG-HRP TrueBlot (Rockland Immunochemicals, Inc., Limerick, PA) was used to prevent interference from the immunoglobulin heavy and light chains included in the IP products.
Somatic cell and naive pluripotency reprogramming assay
MEFs from B6;CBA-Tg(Pou5f1-EGFP)2Mnn/J mice (also known as OG2; purchased from The Jackson Laboratory, Bar Harbor, ME) were transduced (5000 cells) at passage 2 with FUW-SOKM lentivirus (kindly provided by Dr. Jongpil Kim, Dongguk University) in 24-well culture dishes, as previously described (31). Starting 2 days after transduction, MEFs were maintained in ESC culture media supplemented with 0.74 mM AA2G. AP staining of the established iPSC colonies was performed 21 days after transduction.
For overexpression of p53 protein, murine p53 cDNA (kindly provided by Dr. Eun Young Choi, University of Ulsan College of Medicine) (30) was cloned into the pLEX307 lentiviral vector (Addgene plasmid 41392) using the Gateway Technology reaction (Invitrogen). Lentivirus was produced by a four-plasmid transfection system (Invitrogen), concentrated by precipitation using the Lenti-X Concentrator kit (Clontech, Mountain View, CA), and used to infect MEFs 2 days before SOKM induction with 6 μg/mL polybrene (Sigma-Aldrich).
For conversion to naive pluripotency, OG2-EpiSCs were dissociated using 0.5 mM ethylenediaminetetraaceticacid (Gibco BRL/Thermo Fisher Scientific) and plated on a feeder layer or feeder-free in EpiSC medium consisting of N2B27 media with 1% KnockOut Serum Replacement (Life Technologies), 12 ng/mL bFGF (Invitrogen), and 20 ng/mL ActivinA (Invitrogen). The next day, OG2-EpiSCs were cultured in 15% heat-inactivated FBS (HyClone) and 1000 U/mL ESGRO/LIF (Millipore) with the indicated concentrations of AA2G or VitC.
Immunostaining
The mESCs or cells differentiated from mESCs were fixed with 4% paraformaldehyde (Sigma-Aldrich) for 30 min, permeabilized, and then stained using antibodies specific for Oct4 (Millipore; clone 7F9.2, 1:500), Nanog (Abcam; ab80892, 1:200), Sox2 (Millipore; AB5603, 1:500), anti-tubulin, beta III (Tuj1, MAB1637, 1:1000; Millipore), α-smooth muscle actin (Abcam; ab7817, 1:200), or Sox17 (R&D Systems; AF1924, 1:200). Alexa Fluor 488-conjugated or Alexa Fluor 546-conjugated anti-mouse or anti-rabbit antibodies were used as secondary antibodies (Molecular Probes/Thermo Fisher Scientific). Nuclei were counterstained with DAPI. The stained samples were photographed using an inverted fluorescence microscope (Zeiss AxioObserver.Z1; Carl Zeiss Microscopy).
Asthma animal model
Six-week-old BALB/c mice (OrientBio, Gapyong, Gyeonggi-do, Korea) were sensitized and challenged by intranasal administration of 75 μg of OVA (Sigma-Aldrich) and 10 μg of polyI:C (Calbiochem, San Diego, CA) at days 0, 1, 2, 3, 7, 14, 21, 22, and 23. M-MSCs (3 × 10⁵) cultured with basal media (nontreated) or supplemented with AA2G were intravenously administered on day 15. Histological examination and BALF analysis were performed as previously reported (25). Engraftment of the administered M-MSCs was determined by immunofluorescence analysis of hB2M (mouse monoclonal, SC80668; Santa Cruz Biotechnology) and visualized using an Alexa Fluor 546-labeled anti-mouse secondary antibody (Invitrogen). Differentiation lineage was evaluated by costaining for hB2M and SFTPC (rabbit polyclonal, ab90716; Abcam, Cambridge, United Kingdom), which was visualized with an Alexa Fluor 488-labeled anti-mouse secondary antibody (Invitrogen). Nuclei were counterstained using DAPI (Sigma-Aldrich).
Measurement of stability of AA2G and AA2P in culture media
AA2G, AA2P (Sigma-Aldrich), or VitC (10 mg/mL) was added to the indicated culture medium and then stored for 90 days at 37°C or 60°C. The amount of AA2G or VitC was measured on an Agilent 1260 system with an injection volume of 20 μL. High-performance liquid chromatography was performed using a YMC-Triart C18 column (150 × 4.6 mm) with a mobile phase of 0.1 M potassium phosphate–phosphoric acid (pH 2.0) at a flow rate of 0.7 mL/min.
Data and software availability
The transcriptome data discussed in this study have been deposited into the NCBI Gene Expression Omnibus and are accessible through GEO Series accession number GSE106186. To review these data sets, please go to
Statistical analysis
All data were analyzed by one- or two-way ANOVA with Bonferroni post hoc tests. The nonparametric Mann–Whitney U test was used when comparing two groups. GraphPad Prism 6.0 (GraphPad Software, La Jolla, CA) was used to perform all analyses. Statistical significance was defined as p < 0.05 or p < 0.01.
Detailed information on all materials, antibodies, assay kits, and cell lines used in this study is provided in Supplementary Data set S4.
Footnotes
Acknowledgments
We thank Dr. Jongpil Kim (Dongguk University, Seoul, Korea) for the FUW-SOKM lentiviral construct, Dr. Eun Young Choi (University of Ulsan College of Medicine, Seoul, Korea) for the murine p53 cDNA construct, and Dr. Youngsup Song (University of Ulsan College of Medicine, Seoul, Korea) for the 8 × CRE-Luc reporter and the HA-tagged murine Creb1 cDNA construct. UC-MSCs were kindly provided by the Stem Cell Institute, Asan Medical Center, Seoul, Korea.
Author Contributions
Conceptualization: D.-M.S., J.S., and J.S.K.; Methodology: D.-M.S., S.L., J.L., and K.K.; Investigation: D.-M.S., S.L., J.L., J.-H.L., H.J., J.H., Y.K., S.K., H.Y.Y., C.-M.R., S.-Y.L., J.-M.H., T.-J.Y., K.K., T.-J.Y., H.-S.A., and H.-R.K.; Writing—Original Draft: D.-M.S., J.S., J.S.K., S.L., and J.L.; Writing—Review and Editing: D.-M.S., S.L., and J.L.; Funding Acquisition: D.-M.S., J.L., and J.-S.R.; Resources: Y.-M.O., H.L., H.J., T.-J.Y., and H.-M.C.; Data Curation: D.-M.S., H.J., and J.-S.R.; Supervision: D.-M.S., J.S., and J.S.K.
Author Disclosure Statement
No competing financial interests exist.
Funding Information
This research was supported by the National Research Foundation of Korea (NRF-2018R1A2B2001392 and NRF-2018R1C1B6003133); by a National Research Foundation Medical Research Center grant funded by the Korean government (Ministry of Science and ICT) (2018R1A5A2020732); by a grant from the Ministry of Education of the Republic of Korea (2017R1D1A1B03031379); by a grant from the Korean Health Technology R&D Project, Ministry of Health and Welfare, Republic of Korea (HI18C2391); and by the T.J. Park Science Fellowship of POSCO T.J. Park Foundation (to J.-S.R.).
Supplementary Material
Supplementary Data
Supplementary Table S1
Supplementary Table S2
Supplementary Figure S1
Supplementary Figure S2
Supplementary Figure S3
Supplementary Figure S4
Supplementary Figure S5
Supplementary Figure S6
Supplementary Figure S7
Supplementary Figure S8
Supplementary Figure S9
Supplementary Figure S10
Supplementary Figure S11
Supplementary Figure S12
Supplementary Figure S13
Supplementary Data set S1
Supplementary Data set S2
Supplementary Data set S3
Supplementary Data set S4
Abbreviations Used
References
Supplementary Material
Please find the following supplemental material available below.
For Open Access articles published under a Creative Commons License, all supplemental material carries the same license as the article it is associated with.
For non-Open Access articles published, all supplemental material carries a non-exclusive license, and permission requests for re-use of supplemental material or any part of supplemental material shall be sent directly to the copyright owner as specified in the copyright notice associated with the article.
