




Abstract
Metformin is an effective drug against type 2 diabetes (T2D), a pathogenesis in which mitochondrial dysfunction is one of the main players. Thus, our first aim was to describe the effect of metformin on mitochondrial function in an outpatient population with T2D. For analyzing this hypothesis, we performed a preliminary cross-sectional study complying with the STROBE requirements. We studied leukocytes from 139 healthy controls, 39 T2D patients without metformin treatment, and 81 T2D patients who had been on said treatment for at least 1 year. Leukocytes from T2D patients displayed higher total and mitochondrial reactive oxygen species levels, lower mitochondrial membrane potential, and lower oxygen consumption. Moreover, their mitochondria expressed lower mRNA and protein levels of fusion proteins mitofusin-1 (MFN1), mitofusin-2 (MFN2), and optic atrophy 1 (OPA1), and higher protein and gene expression levels of mitochondrial fission protein 1 (FIS1) and dynamin-related protein 1 (DRP-1). In addition, we observed enhanced leukocyte/endothelial interactions in T2D patients. Metformin reversed most of these effects, ameliorating mitochondrial function and dynamics, and reducing the leukocyte/endothelial interactions observed in T2D patients. These results raise the question of whether metformin tackles T2D by improving mitochondrial dysfunction and regulating mitochondrial dynamics. Furthermore, it would seem that metformin modulates the alteration of interactions between leukocytes and the endothelium, a subclinical marker of early atherosclerosis. Antioxid. Redox Signal. 35, 377–385.
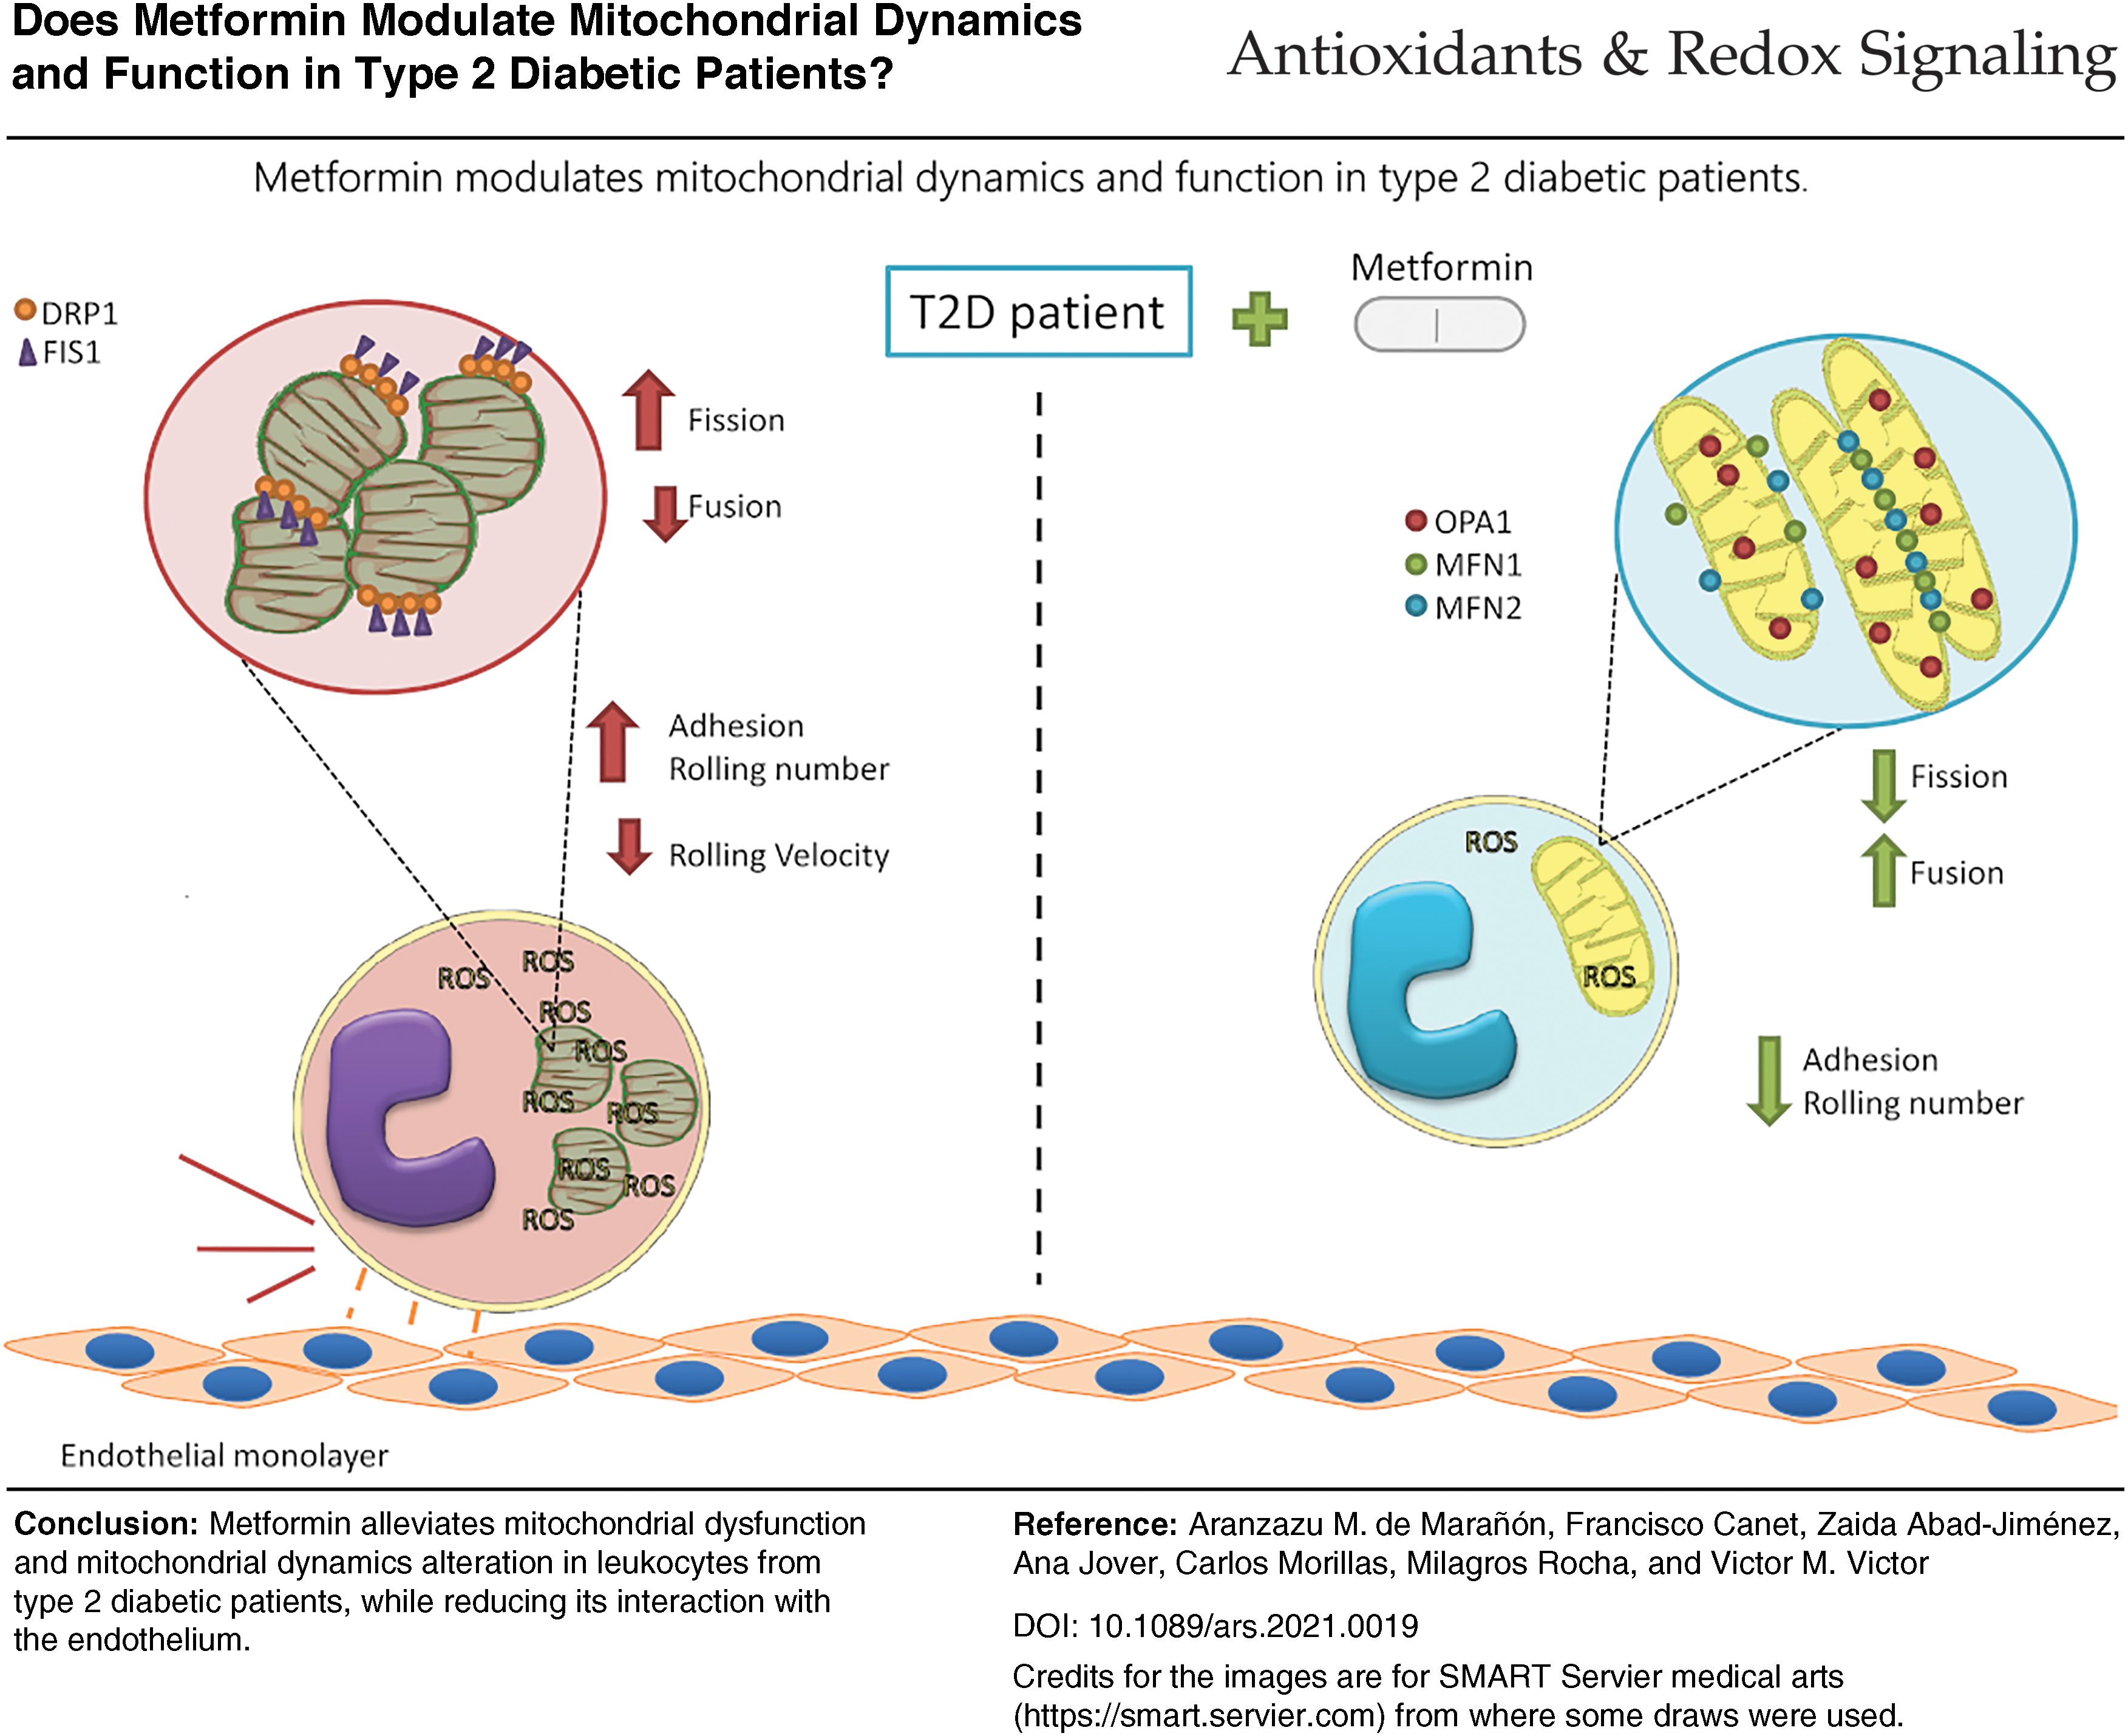
Color images are available online.
Innovation
Alterations in mitochondrial function and dynamics and the inflammatory events, which take place as a consequence, are key to the diabetic pathology, but the nature of the effects exerted by metformin on these parameters is unclear. Thus, it is relevant to study them in primary type 2 diabetes (T2D) leukocytes, which are central to the immune response. Our results suggest that metformin effectively palliates alterations of leukocyte mitochondrial function and dynamics due to T2D and reduces their activation. Our results contribute to the knowledge of the mechanisms that explain the deregulated immune function in T2D. Future research will need to detangle the precise molecular pathways at work and the exact target of metformin in this scenario.
Introduction
Type 2 diabetes (T2D) is a chronic inflammatory disease characterized by hyperglycemia and hyperinsulinemia. Accumulating evidence suggests that mitochondrial dysfunction is one of the main contributors to diabetic disease (7). However, there are controversies about whether mitochondrial dysfunction is the trigger or a consequence of metabolic deregulation.
Mitochondria are essential double-membrane organelles involved in different cell processes such as adenine triphosphate (ATP) synthesis, apoptosis, stress regulation, and lipid and carbohydrate metabolism, among others (7). They are responsible for meeting the enormous energy demands of vital tissues by facilitating cellular respiration, which is carried out in the mitochondrial cristae through electronic transport complexes (ETC) and the electrons obtained mainly as a result of glycolysis and fatty acid oxidation. Thus, ETC-mediated electron transport pumps protons to the intermembrane space to maintain the protonmotive force. Once the electrons reach the ATP synthase, ATP is synthesized, but only if there is an adequate protonmotive force.
It is now widely accepted that cellular energy demand affects mitochondria by causing changes to their shape, location, and/or mitochondrial mass (5). These processes are known as mitochondrial dynamics and are facilitated by mitochondrial transport through microtubules, and mitochondrial fusion and fission.
Fusion is carried away by three guanylyl triphosphatases (GTPases): mitofusin 1 (MFN1), mitofusin 2 (MFN2), and optic atrophy 1 (OPA1). Although MFN1 and MFN2 share similar sequences and functions, slight but critical differences have been identified: while MFN1 exerts its function in the outer membrane, MFN2 regulates mainly endoplasmic reticulum/mitochondria contact. Similarly, OPA1, a dynamin-related protein associated with inner mitochondrial membrane fusion and maintenance of the structure of respiratory supercomplexes, helps to regulate the shape of mitochondria through the fusion process (5).
On the contrary, fission machinery is mediated by dynamin-related protein 1 (DRP1), a GTPase protein located in the cytosol as a dimer or tetramer (5) that is recruited to the outer mitochondrial membrane by protein fission protein 1 (FIS1) and other receptor proteins in response to specific cellular cues (5).
Defects in these mitochondrial dynamics can lead to a substantial production of reactive oxygen species (ROS), which, in turn, leak into the cytosol and affect the cellular environment and molecular signaling. Subsequently, these stress stimuli expedite recruitment of the immune cells to the activated vascular endothelium, thus promoting further atherosclerotic changes and the development of macrovascular complications (2, 6). In particular, the activation of leukocytes, mediated by chemokine-dependent and chemokine-independent mechanisms, leads to leukocyte/endothelial cell adhesion. During this process, adhesion molecules on rolling leukocytes bind to their counter-receptors on endothelial cells, thus promoting their firm adhesion to the wall. This persistent condition contributes to the initiation and progression of atherosclerotic lesion development (2, 9).
To date, many different treatments have been used to ameliorate T2D. However, since its discovery in 1950, metformin has remained the first-line treatment. Although the exact mechanisms by which metformin exerts its actions are unknown, a wide range of theories have been put forward (3). Of note, metformin seems to alleviate cell activation, thus palliating the inflammatory response (2). However, this aspect has not been assessed in primary leukocytes, and so, the precise effect of metformin is still unclear.
In light of the research described above, we hypothesized that mitochondrial function and dynamics are altered in T2D, thus affecting leukocyte/endothelial interactions, and that metformin can mitigate these alterations.
Biochemical and anthropometrical parameters
Table 1 shows the results obtained when we analyzed the anthropometrical and biochemical data in our study population. One hundred thirty-five healthy subjects and 120 T2D patients were recruited from the Endocrinology Outpatients Service of the University Hospital Doctor Peset (Valencia, Spain). The T2D group was divided into patients with metformin treatment (81) or without treatment (39). In relation to anthropometrical parameters, T2D patients presented higher weight (p < 0.05), body mass index (BMI; p < 0.05), waist circumference (p < 0.05), and diastolic blood pressure (DBP) and systolic blood pressure (SBP; p < 0.05).
Biochemical and Anthropometrical Profile of Control Subjects and Type 2 Diabetes Patients With or Without Metformin Treatment
Kolmogorov/Smirnov or Shapiro/Wilk normality tests were carried out depending on the sample size. For normally distributed data, mean ± SD shown, and for non-normally distributed data, the median is shown (first and third quartile). Analysis of variance and Tukey post-test were performed to outline statistically significant differences between groups.
p < 0.05 versus control group.
p < 0.05 versus T2D group.
BMI, body mass index; CT, cholesterol; DBP, diastolic blood pressure; HbA1c, glycated hemoglobin; HDL, high-density lipoproteins; HOMA-IR, homeostatic model assessment of insulin resistance; LDL, low-density lipoproteins; SBP, systolic blood pressure; T2D, type 2 diabetes; VLDL, very low-density lipoproteins.
Metformin had a significant effect on SBP (p < 0.05), while DBP showed nonsignificant differences with respect to the control group. Insulin concentrations and homeostatic model assessment (HOMA) index were higher in T2D patients (both p < 0.05), with no influence of metformin treatment being observed. HbA1c% and glucose were significantly increased in the T2D group (p < 0.05) and lower among patients receiving metformin treatment (p < 0.05). Regarding lipid metabolism parameters, we found that cholesterol, high-density lipoproteins (HDL), and low-density lipoproteins (LDL) were reduced in T2D patients (p < 0.05) due to the effect of the hypolipemiant treatment (50% of patients in the T2D group and 63.8% of metformin-treated patients). Very low-density lipoproteins (VLDL), cholesterol/HDL ratio, and triglycerides were increased in T2D patients, and were not modified by metformin treatment.
ROS content and mitochondrial function
First, we aimed to determine if T2D induced a change in mitochondrial integrity and functionality, and whether metformin was capable of reducing its effects. Figure 1A depicts how T2D leukocytes exhibited higher total ROS content (p < 0.05), and how this content was diminished by metformin treatment (p < 0.05). Moreover, the results shown in Figure 1B reflect a similar behavior of mitochondrial ROS (p < 0.01 in T2D vs. control samples, and p < 0.05 for T2D + metformin vs.T2D).
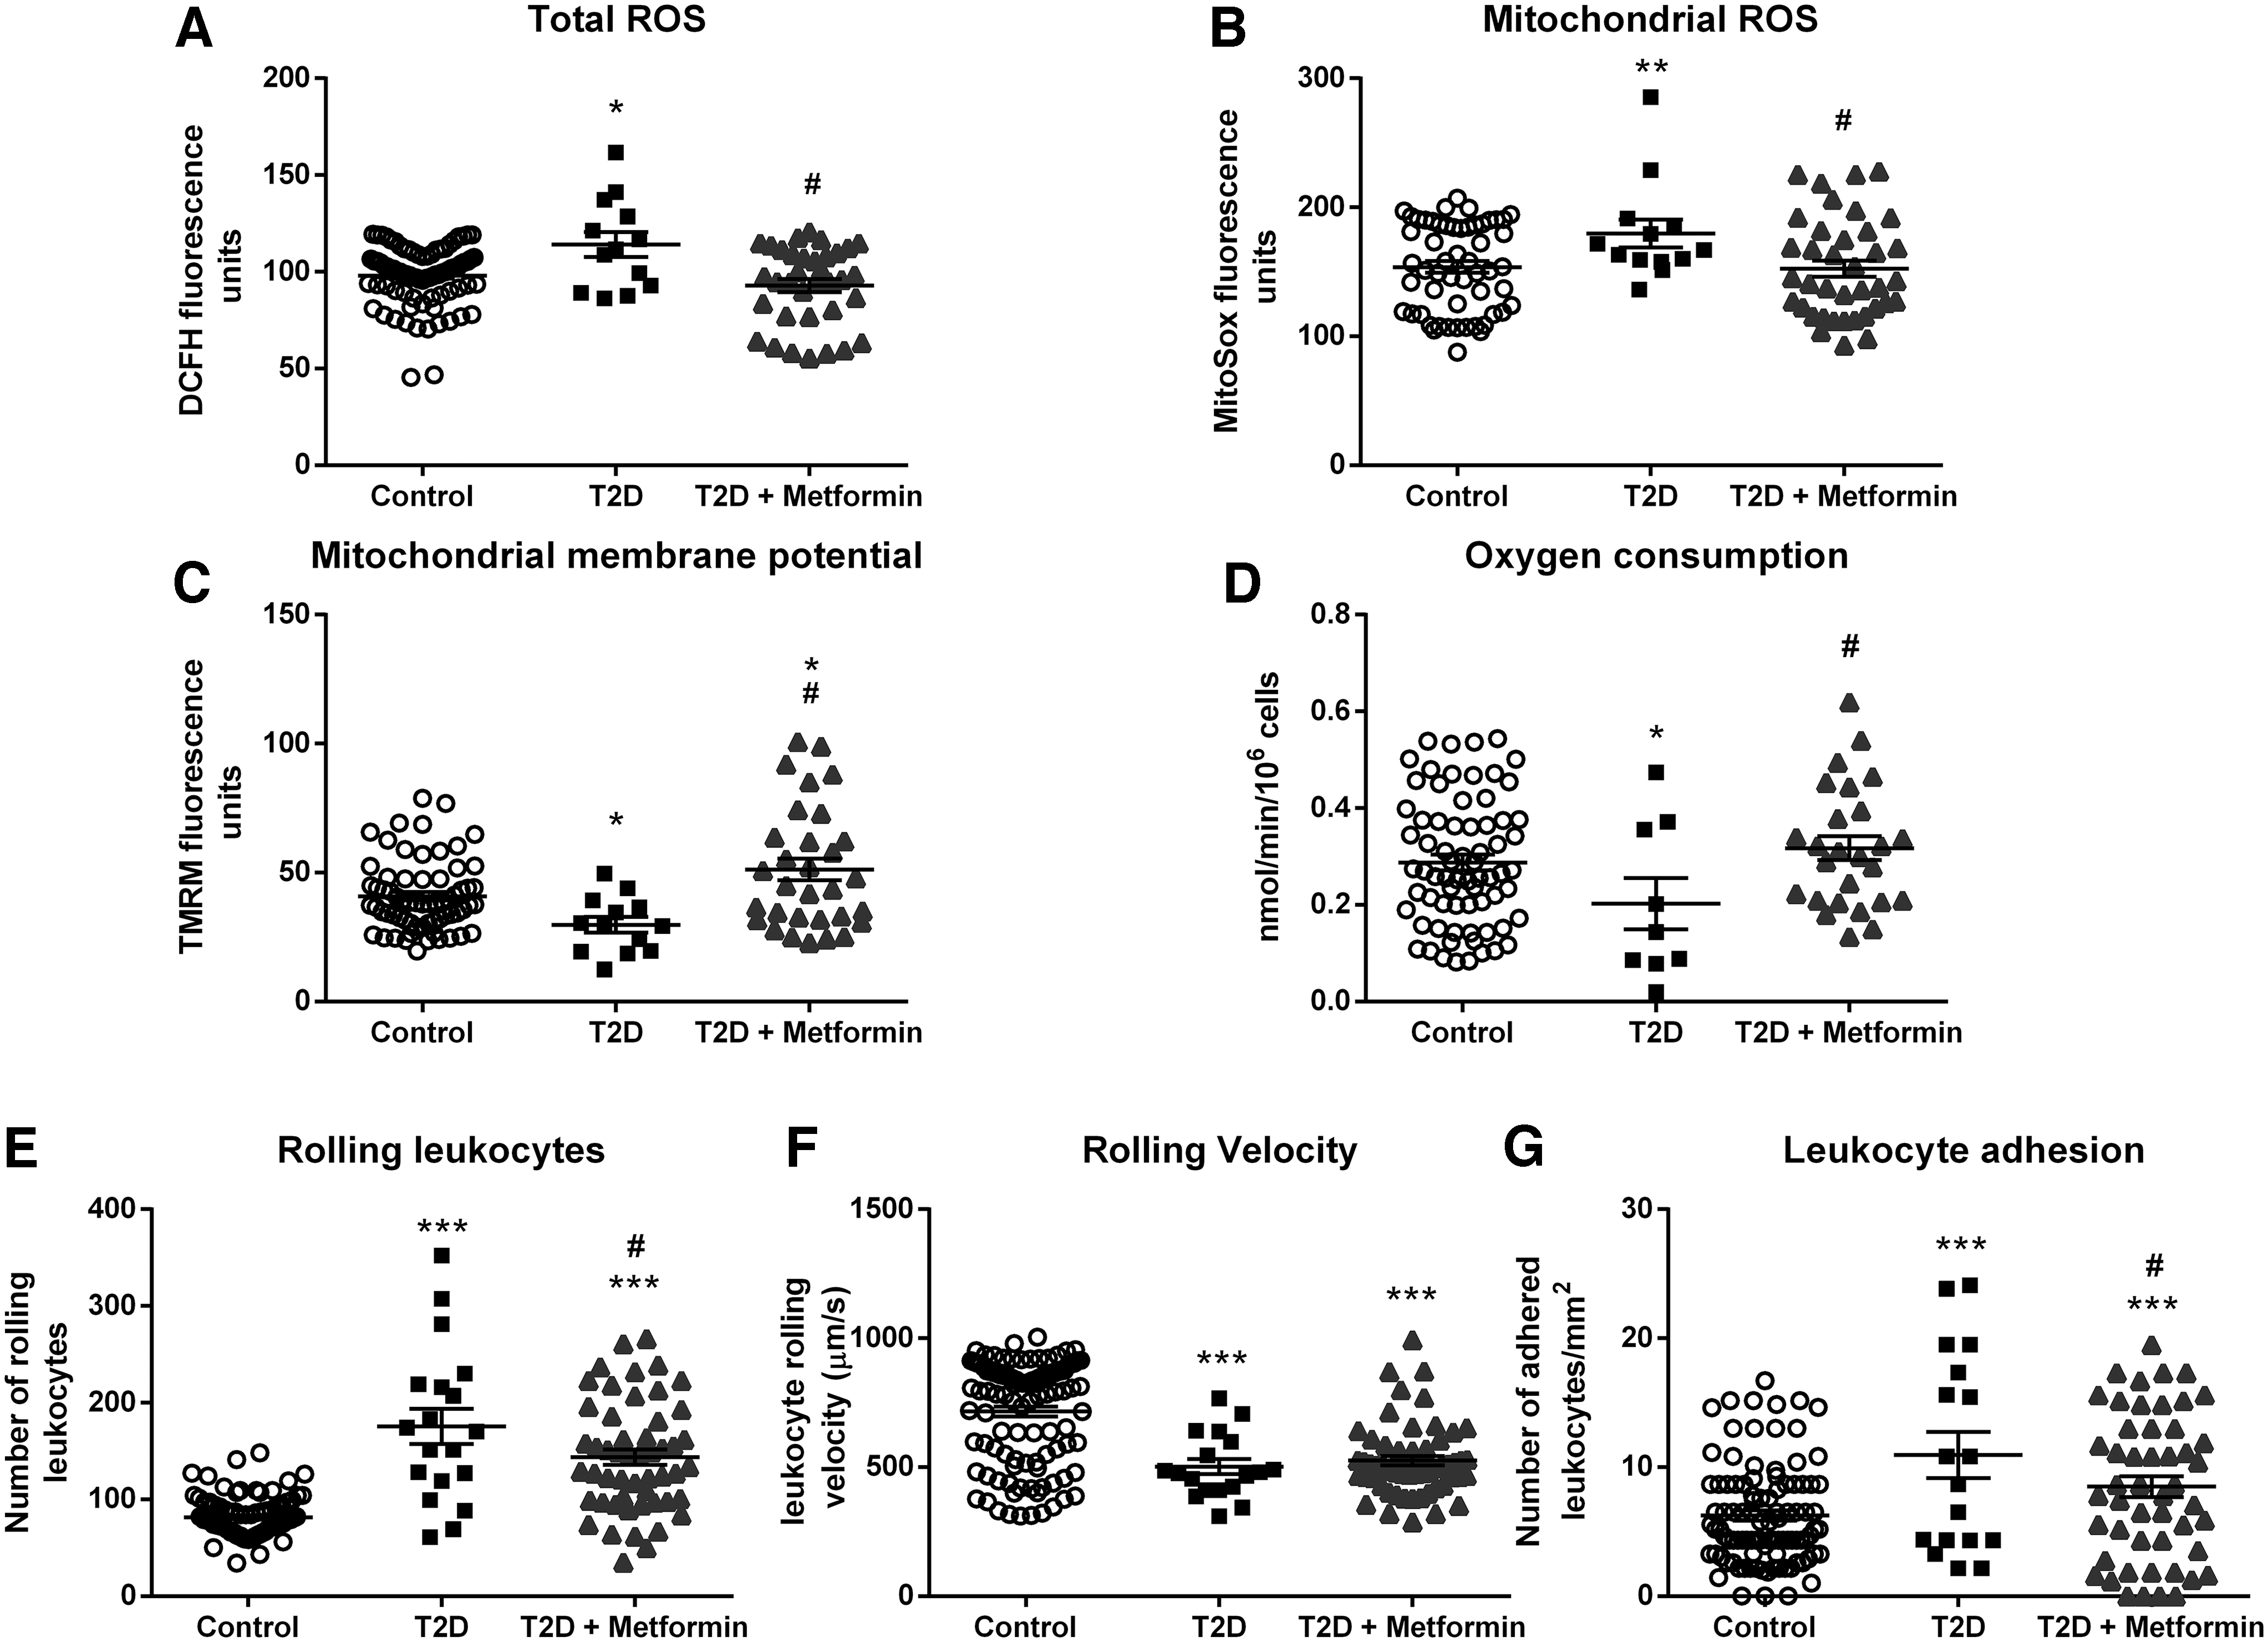
In this respect, metformin tempered the rise in ROS production induced by T2D in leukocytes. Figure 1C shows the reduced mitochondrial membrane potential of T2D leukocytes (p < 0.05), and illustrates that treatment with metformin returned membrane potential to normal levels (p < 0.05). Moreover, as shown in Figure 1D, T2D leukocytes exhibited decreased O2 consumption (p < 0.05), while mitochondria of patients receiving metformin showed normal O2 consumption (p < 0.05).
Leukocyte/endothelial interactions
Figure 1E–G describes how diabetes altered the leukocyte/endothelial interactions and whether metformin restores this phenotype to control levels. T2D leukocyte/endothelial interactions were increased by enhancing rolling (p < 0.001) and adhesion (p < 0.001) and by decreasing rolling velocity (p < 0.001). Metformin treatment reduced leukocyte rolling (p < 0.05) and adhesion (p < 0.05), highlighting the anti-inflammatory effect exerted by metformin.
Mitochondrial dynamics
Figure 2 displays how T2D alters mitochondrial dynamics and how metformin treatment modulates it.
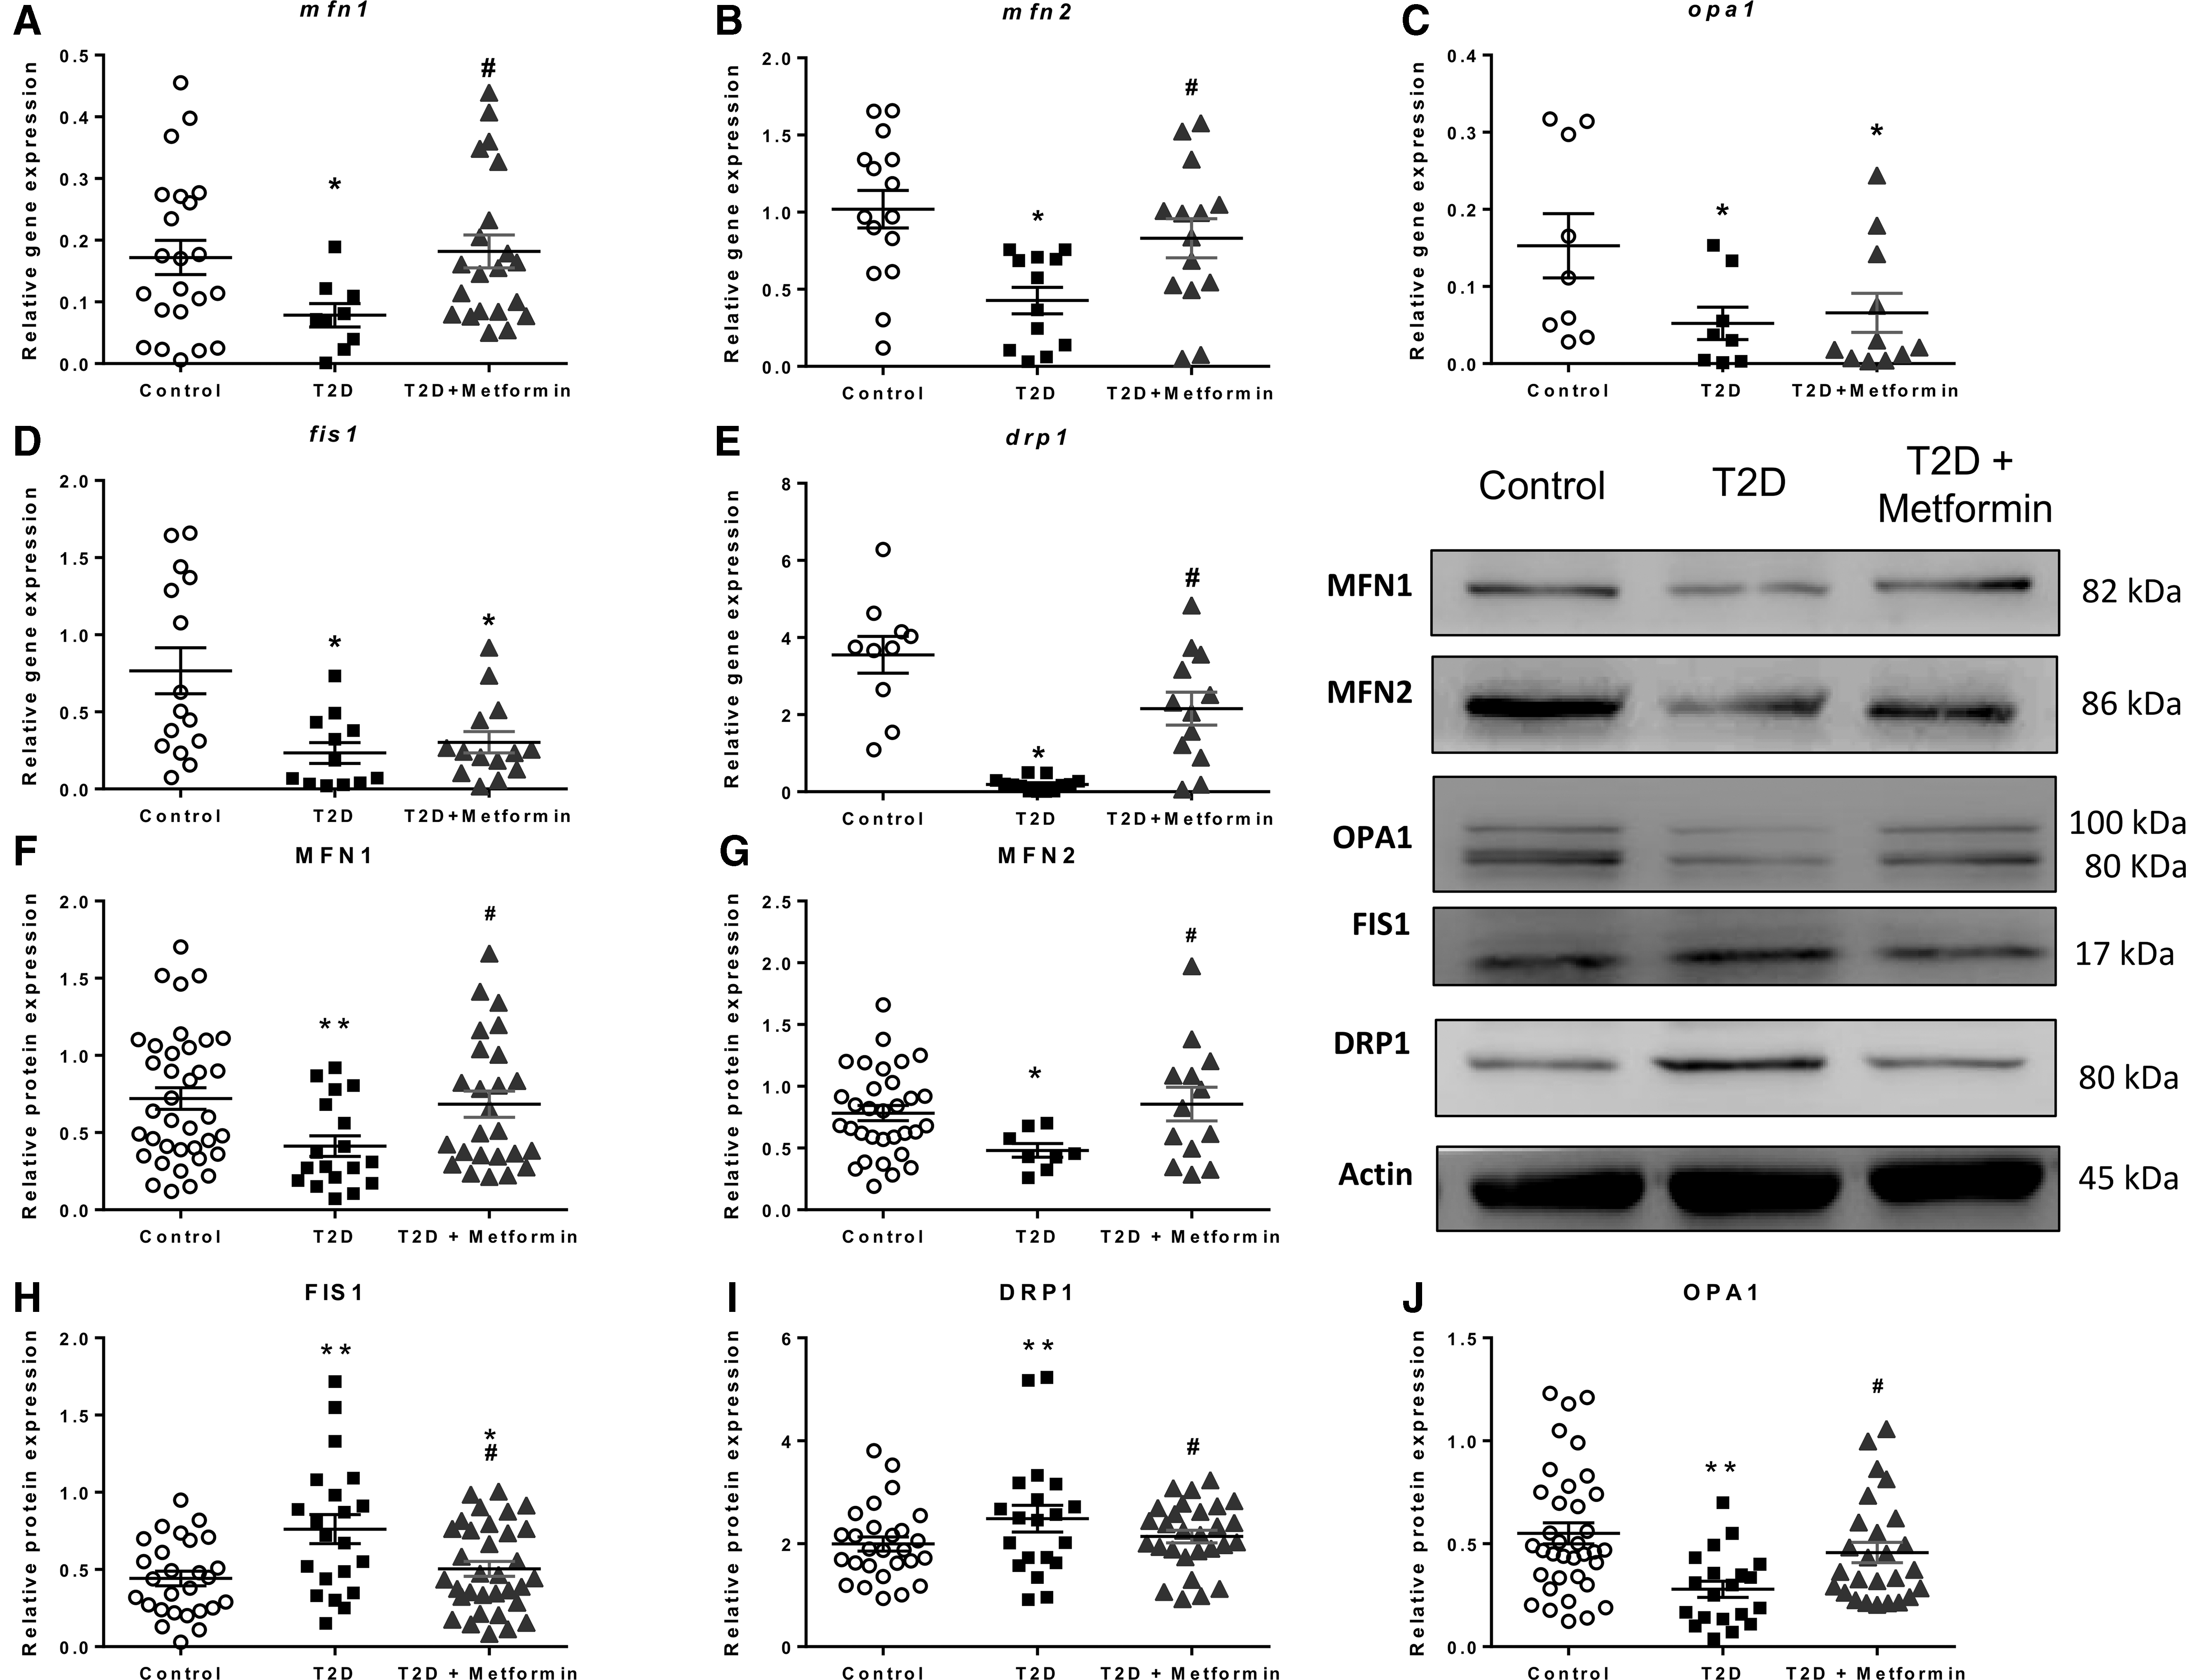
The analysis of mRNA expression of fusion genes was diminished in T2D leukocytes (Fig. 2A–E) (p < 0.05 for mfn1, p < 0.001 for mfn2, and p < 0.05 for opa1), and metformin treatment enhanced their expression (p < 0.05 for mfn1 and p < 0.01 for mfn2), with the exception of OPA1 (p < 0.05 vs. control subjects). Furthermore, T2D leukocytes displayed lower levels of fission gene expression than controls (p < 0.01 for fis1 and p < 0.001 for drp1). fis1 expression levels were not modified by metformin treatment (p < 0.05 vs. control subjects), while drp1 levels returned to normal values (p < 0.001 vs. T2D samples).
Regarding protein expression, mitochondrial fusion (Fig. 2F–J), orchestrated by MFN1, MFN2, and OPA1, was diminished in leukocytes from T2D patients (p < 0.01, p < 0.05, and p < 0.01, respectively). Metformin treatment increased the levels of these proteins significantly (p < 0.05 in all cases). Furthermore, fission protein FIS1 and DRP1 levels were elevated in T2D leukocytes (p < 0.01 in both cases), and metformin treatment reversed this increase (p < 0.05 in both cases), highlighting the beneficial effect of this drug.
Metformin is the gold standard in the management of T2D, thanks mainly to its hypoglycemiant effect (3, 8, 9). Indeed, previous research has shown the remarkable benefits of metformin uptake on some analytical parameters (8). Our T2D patient cohort displayed alterations in classic clinical parameters used to identify the diabetic state; namely, higher weight, BMI, waist circumference, glucose, HbA1c%, SBP, DBP, homeostatic model assessment of insulin resistance (HOMA-IR), and insulin with respect to controls. Metformin treatment reduced glucose and HbA1c%, which is in accordance with the study by van Stee et al.
In the case of lipid parameters, T2D patients displayed increased VLDL and triglyceride levels, but reduced cholesterol, HDL, and LDL levels. Research has shown that this is a result of the hypolipemiant treatment of diabetic dyslipidemia, regardless of whether or not there is metformin treatment (8).
In addition to the biochemical alterations described, we have observed altered mitochondrial function. First, leukocytes from T2D patients expressed increased levels of total and mitochondrial ROS. Although ROS can act as cellular signals, an excess is a signal of cellular stress and can lead to the activation of inflammatory pathways (2). Second, oxygen consumption and mitochondrial potential were altered, suggesting that mitochondrial function was compromised. The loss of membrane potential can be attributed to a leaking mitochondrial membrane, which reduces the electron transport complex's efficiency, thus altering oxygen consumption by leukocytes (4, 7). Such alterations are a sign of mitochondrial dysfunction in T2D leukocytes (1, 7). However, whether it is a cause or a consequence of the pathology of diabetes is still unknown, and future research should address this topic.
In a T2D scenario, the triggers of these mitochondrial alterations are chronic hyperglycemia and hyperlipidemia (2, 7). Therefore, we hypothesized that if metformin can alleviate hyperglycemia, it can also be beneficial for mitochondrial dysfunction. Several previous studies have demonstrated that metformin is beneficial for mitochondrial function and can alleviate the alterations that characterize a diabetic organism. The present study supports this, showing that metformin restores total and mitochondrial reactive oxygen species, mitochondrial membrane potential, and O2 consumption to control levels.
Mitochondrial dysfunction is closely related to inflammation, as a cause or a consequence (2, 4). Excessive ROS production activates key pathways in inflammation, and reduces the antioxidant capacity of the cell. In immune and endothelial cells, this leads to their overactivation and a nonphysiological activity, both of which contribute to the activation of the endothelial/leukocyte interaction pathway and a subatherosclerotic scenario.
It has previously been reported that altered mitochondrial dynamics increases the endothelial dysfunction in venous endothelial cells from T2D patients and a T2D model of human aortic ring culture (6). Moreover, inhibition of fission has been shown to reduce endothelial impairment, suggesting that mitochondrial dysfunction plays a causative role in T2D. Bearing this in mind, we analyzed the functional repercussions of mitochondrial dysfunction on leukocyte biology in our samples. Our procedure involved us examining leukocyte/endothelial interactions, which were enhanced in T2D patients.
The metformin-treated group displayed less rolling and adhering cells, but velocity remained similar to that in the untreated group. These results suggest that metformin has the capacity to reduce generalized low-grade inflammation. The literature backs our results, confirming that metformin has an anti-inflammatory effect at many different levels (7). The precise mechanism through which the drug acts is yet to be deciphered, although several candidates have been proposed.
Mitochondrial dysfunction involves the deregulation of mitochondrial dynamics. Several in vitro and in vivo studies have highlighted hampered mitochondrial dynamics in T2D (2, 4, 9). Altogether, T2D seems to promote a profission phenotype and the inhibition of fusion, resulting in the deregulation of mitochondrial dynamics. Conversely, our data show that metformin treatment induces an increase in MFN1, MFN2, and OPA1, and a decrease in FIS1 and DRP1 at the protein level. An increase in mRNA was detected in mfn1 and mfn2, but we did not observe a recovery of opa-1 mRNA levels in metformin-treated patients, which warrants further research. The inner mitochondrial membrane location of OPA-1 could explain this varying mRNA expression (7).
In the context of these remaining questions, a previous study determined that metformin reduces fission phenotype in diabetic APOE−/− mice and prevents atherosclerotic lesions (9). Based on the present results, we can affirm that metformin restores mitochondrial dynamics in T2D, although we have not identified the exact underlying mechanism. Research to date implicates adenine monophosphate-activated protein kinase (AMPK), which can be effectively activated by metformin (3, 6); whether or not this is the elusive mechanism in question is an object for future research.
Conclusion
In the present study, an improvement in mitochondrial function and dynamics was observed in T2D patients on metformin. Moreover, leukocyte/endothelial cell interactions in the treated subjects were significantly reduced, thus indicating a decrease in inflammation and T2D-related cardiovascular events. Our findings reinforce the idea that metformin plays an important role in modulating the inflammation that occurs in T2D patients. At the same time, it highlights the beneficial effects of this drug, by which it prevents mitochondrial dysfunction and deregulation of mitochondrial dynamics and, in turn, their clinical implications.
Notes
Materials and methods
Subjects
One hundred thirty-five healthy subjects and 120 T2D patients were recruited from the Endocrinology and Nutrition Outpatient's Service of University Hospital Doctor Peset, in Valencia (Spain). Of the 120 T2D patients, 81 had been under 1700 mg/day metformin treatment for at least 1 year. All subjects provided written informed consent to participate in the study. The hospital's Ethics Committee for Clinical Investigation approved the study (ID: 98/19), which was in line with the Helsinki Declaration. T2D was diagnosed following the American Diabetes Association's (ADA) criteria. Exclusion criteria were BMI >35, history of cardiovascular disease, and the presence of autoimmune, infectious, hematological, or malignant disease.
Sample collection and laboratory tests
Subjects attended the Endocrinology Service (Hospital Dr Peset) after 12-h fasting and not having taken any anti-inflammatory drug in the previous 24 h. Peripheral blood was extracted from the brachial vein after measuring blood pressure, weight, height, and waist circumference. Anthropometric parameters were measured as follows: weight and height were measured on a graded scale; SBP and DBP were evaluated with an automatic sphygmomanometer; and waist circumference was evaluated with a measuring tape. BMI was calculated as weight (kg)/(height (m)2.
Insulin was measured with an immunoassay using an Architect Insulin Reagent Kit. Glucose was measured in serum by an automated enzymatic method with a Beckman Synchron LX20 Pro analyzer (Beckman Coulter, Brea, CA). Glycated hemoglobin (HbA1c) was analyzed with an automated Glycohemoglobin analyzer (Arkray, Inc., Kyoto, Japan). HOMA-IR index was calculated as follows: (Fasting Insulin [μUI/mL] × Fasting Glucose [mg/dL])/405. Cholesterol, HDL, and triglyceride levels were analyzed by means of an enzymatic assay (Beckman Coulter). Friedewald's formula was used to calculate LDL.
Leukocyte isolation
Leukocytes were isolated by means of the Ficoll gradient method. The blood was laid over 7 mL of Ficoll (Hystopaque-1119 Ref. 11191 and Hystopaque-1077 Ref. 10771; both from Sigma-Aldrich, St. Louis, MO) and centrifuged for 25 min at room temperature. Leukocytes were subsequently collected and lysed with erythrocyte lysis buffer (Red Blood Cell Lysis Solution, Ref. 130-096-941; Miltenyi Biotec, Germany) for 5 min. Cells were then washed with Hank's balanced saline solution (HBSS) and stored for future experiments.
Static cytometry assay
Three hundred thousand leukocytes/well were seeded in duplicate in 24-well plates for each sample. An internal control (Hep3b cells) was also seeded at the same density in each plate. After 20 min, when cells were attached to the bottom of the plate, 250 μL tetramethylrhodamine (1 μM) MitoSOX (1 μM), 2′7′dichlorofluorescein (DCFH; 1 μM), and nuclear staining HOECHST 33342 (1 μM), all purchased in Thermo Fisher Scientific, were added to each well and incubated for 20 min at 37°C under gentle shaking. The wells were then washed twice with warm HBSS.
Static cytometry visualization was performed using ScanR software coupled to a IX81 Olympus microscope (both from Olympus Corporation, Shinjuku, Tokyo, Japan). Each experiment was performed in duplicate, with 16 images obtained per well in each experiment and calculating the mean fluorescence intensity. The resulting mean was normalized according to the cell number and internal control.
Oxygen consumption assay
Once leukocytes had been isolated, an aliquot of 5 × 10⁶ cells/mL was placed in a gas-tight chamber. A Clark-Type O2 electrode (Rank Brothers, Bottisham, United Kingdom) was used to measure O2 consumption. Sodium cyanide (1 mM), an inhibitor of the electron transport chain, was used to confirm that O2 consumption was mainly mitochondrial (95%–99%). Duo.18 software (WPI, Stevenage, United Kingdom) was used to visualize and collect the data. The maximal O2 consumption rate with endogenous substrates was calculated using GraphPad software (GraphPad software, Inc., San Diego, CA). A trypan blue exclusion test was performed after each experiment to determine cell viability, and revealed no significant cell death.
Leukocyte/endothelial interaction assay
An aliquot of 1.2 × 10⁶ leukocytes resuspended in RPMI medium was used for this experiment. Previously, human umbilical cord endothelial cells (HUVECs) isolated from fresh umbilical cords were seeded and grown until a 95% confluent monolayer formed. On the day of the experiment, the leukocyte suspension was perfused over the surface of HUVECs at 0.3 mL/min using a parallel plate flow system, all of which was observed through an inverted microscope. While interacting, cells were recorded with a microscope-coupled camera for 5 min, and, during the last minute, different fields were observed to count the number of adhered leukocytes. The following data were obtained from the videos: number of leukocytes that crossed a 200 μM surface in 1 min (rolling); the time these leukocytes took to cover this distance (rolling velocity); and the number of leukocytes stably adhering to the HUVEC monolayer (adhesion).
Gene and protein expression analysis
To measure gene expression, a GeneAll Ribospin Total RNA extraction kit (GeneAll Biotechnology, Hilden, Germany) was used to isolate RNA from leukocyte samples, following the manufacturers' protocol. We measured gene expression by means of a quantitative real time polymerase chain reaction method (qRT-PCR) using a FastStart universal SYBR Green Master (Sigma Aldrich, St. Louis, MO) and a 7500 Fast RT-PCR system (Life Technologies, Carlsbad, CA). RNA was quantified in a NanoDrop 200c spectrophotometer (Life Technologies, Thermo Fisher Scientific), and purity was confirmed with the 260 nm/280 nm absorbance ratio (A260/280). Next, cDNA was determined with a RevertAid first-strand cDNA synthesis kit (Life Technologies, Thermo Fisher Scientific).
Quantification was performed by means of the comparative 2−ΔΔCt method, and a sample was used as an internal control and gapdh expression as an endogenous control in all experiments. Data were analyzed with Expression Suite software (Life Technologies, Thermo Fisher Scientific). Table 2 shows the primers used in the study.
Forward and Reverse Sequences of the Specific Primers Used in This Study
Regarding protein analysis, previously isolated leukocytes were lysed with RIPA buffer, homogenized, and sonicated in an ultrasound bath for 30 s, three times. Samples were then left for 15 min on ice and centrifuged for 15 min at 13,000 rpm at 4°C. The supernatant was collected and quantified following the bicinchoninic acid protein quantification assay (Pierce). Twenty-five micrograms of protein was loaded onto 4%–20% gradient sodium dodecyl sulfate/polyacrylamide gels (Novex Wedge Well 4-20 Tris Glycine Gel, Ref. XP04205B0X; Invitrogen-Life Technology, Carlsbad, CA) and separated at 150 V for 90 min at room temperature. Transference to nitrocellulose membranes (BioRad, CA) was carried out by the wet transference method, running for 60 min at constant amperage (400 mA).
Membranes were then blocked with 5% bovine serum albumin or 5% skimmed milk (depending on the protein of interest) for 1 h at room temperature. Specific antibodies against MFN1, MFN2, OPA1, DRP1, and FIS1 were diluted in blocking buffer. Specific antibody dilutions were incubated with the membranes overnight at 4°C under gentle shaking: rabbit polyclonal anti-MFN1 (Ref. ABC41), rabbit polyclonal anti-MFN2 (Ref. ABC42), mouse monoclonal anti-OPA-1 (Ref. MABN737), rabbit polyclonal anti-FIS-1 (Ref. ABC67), all purchased from Merck-Millipore (Burlington, MA), and mouse monoclonal anti DRP-1 (Ref. GR3248679-1; Abcam, Cambridge, United Kingdom). The following day, specific secondary antibodies (goat anti-rabbit antibody [Ref. PI-1000] from Vector Laboratories, Burlingame, CA, and goat anti-mouse antibody [Ref. 31420] from Thermo Fisher Scientific, Waltham, MA) were incubated for 60 min at room temperature.
Images of the resulting proteins were obtained using SuperSignal West Pico Plus (Ref. 34580) or Femto (Ref. 34095) chemiluminescent substrate (Thermo-Fisher Scientific) and the Fusion FX5 (Vilber Lourmat, Marne-La Vallée, France) imaging system. Densitometric quantification of the images was performed with Bio1D software (Vilber Lourmat). Each membrane was checked several times by cutting different fragments following the guide of the molecular size marker and also with homemade glycine stripping buffer to maximize the results for each sample. Whole-membrane fragments used for the images in Figure 2 are included in Supplementary Figure S1.
Statistical analysis
Normality was confirmed with the Kolmogorov/Smirnov test or the Shapiro/Wilk test depending on the size of the sample. Values are expressed as mean ± SD for normally distributed data, and the median ± (25th–75th percentiles) is presented for non-normally distributed data. One-way analysis of variance with a Tukey post-hoc test was used to compare the three groups.
When two groups were compared, a t-test was used for normally distributed data, while a Mann/Whitney U test was used for non-normal distribution. The influence of sex and BMI was corrected with a covariance analysis (univariate general linear model). Significance was confirmed in all comparisons when p < 0.05, with a confidence interval of 95%. SPSS 17.0 (SPSS Statistics, Inc., Chicago, IL) was used in all the tests, and GraphPad (GraphPad, La Jolla, CA) was used to plot the data with bar graphs, representing the media and the standard error of the mean.
Footnotes
Authors' Contributions
Conceptualization: V.M.V. and M.R.; Methodology: A.M.M., Z.A.-J., and F.C.; Resources: A.J., C.M., V.M.V., and M.R.; Data curation: A.M.M., F.C., and V.M.V.; Writing—original draft: A.M.M. and F.C.; Writing—review and editing: V.M.V. and M.R.; Visualization: A.M.M. and Z.A.-J.; Supervision: C.M., V.M.V., and R.M.; Project administration: V.M.V. and M.R.; Funding acquisition: V.M.V. and M.R.
Acknowledgments
The authors thank Brian Normanly (University of Valencia/CIBERehd) for his editorial assistance and Rosa Falcon for her technical assistance.
Funding Information
This study was financed by grants PI19/00838, PI19/0437, and CIBERehd CB06/04/0071 by Carlos III Health Institute and by the European Regional Development Fund (ERDF “A way to build Europe”); UGP-15-220 by FISABIO; PROMETEO/2019/027 by Ministry of Health of the Valencian Regional Government; and by an unrestricted grant from Menarini. A.M.M. and Z.A.-J. are recipients of PFIS contracts from Carlos III Health Institute (FI17/00126 and FI17/00144, respectively). F.C. is a recipient of a Santiago Grisolía contract from the Valencian Regional Government (GRISOLIAP/2019/091). V.M.V. is a recipient of CES/10/030 contract and M.R. is a recipient of CPII16/00037 contract, both from the Ministry of Health of the Valencian Regional Government and Carlos III Health Institute.
Supplementary Material
Supplementary Figure S1
Abbreviations Used
References
Supplementary Material
Please find the following supplemental material available below.
For Open Access articles published under a Creative Commons License, all supplemental material carries the same license as the article it is associated with.
For non-Open Access articles published, all supplemental material carries a non-exclusive license, and permission requests for re-use of supplemental material or any part of supplemental material shall be sent directly to the copyright owner as specified in the copyright notice associated with the article.
