




Abstract
Aims:
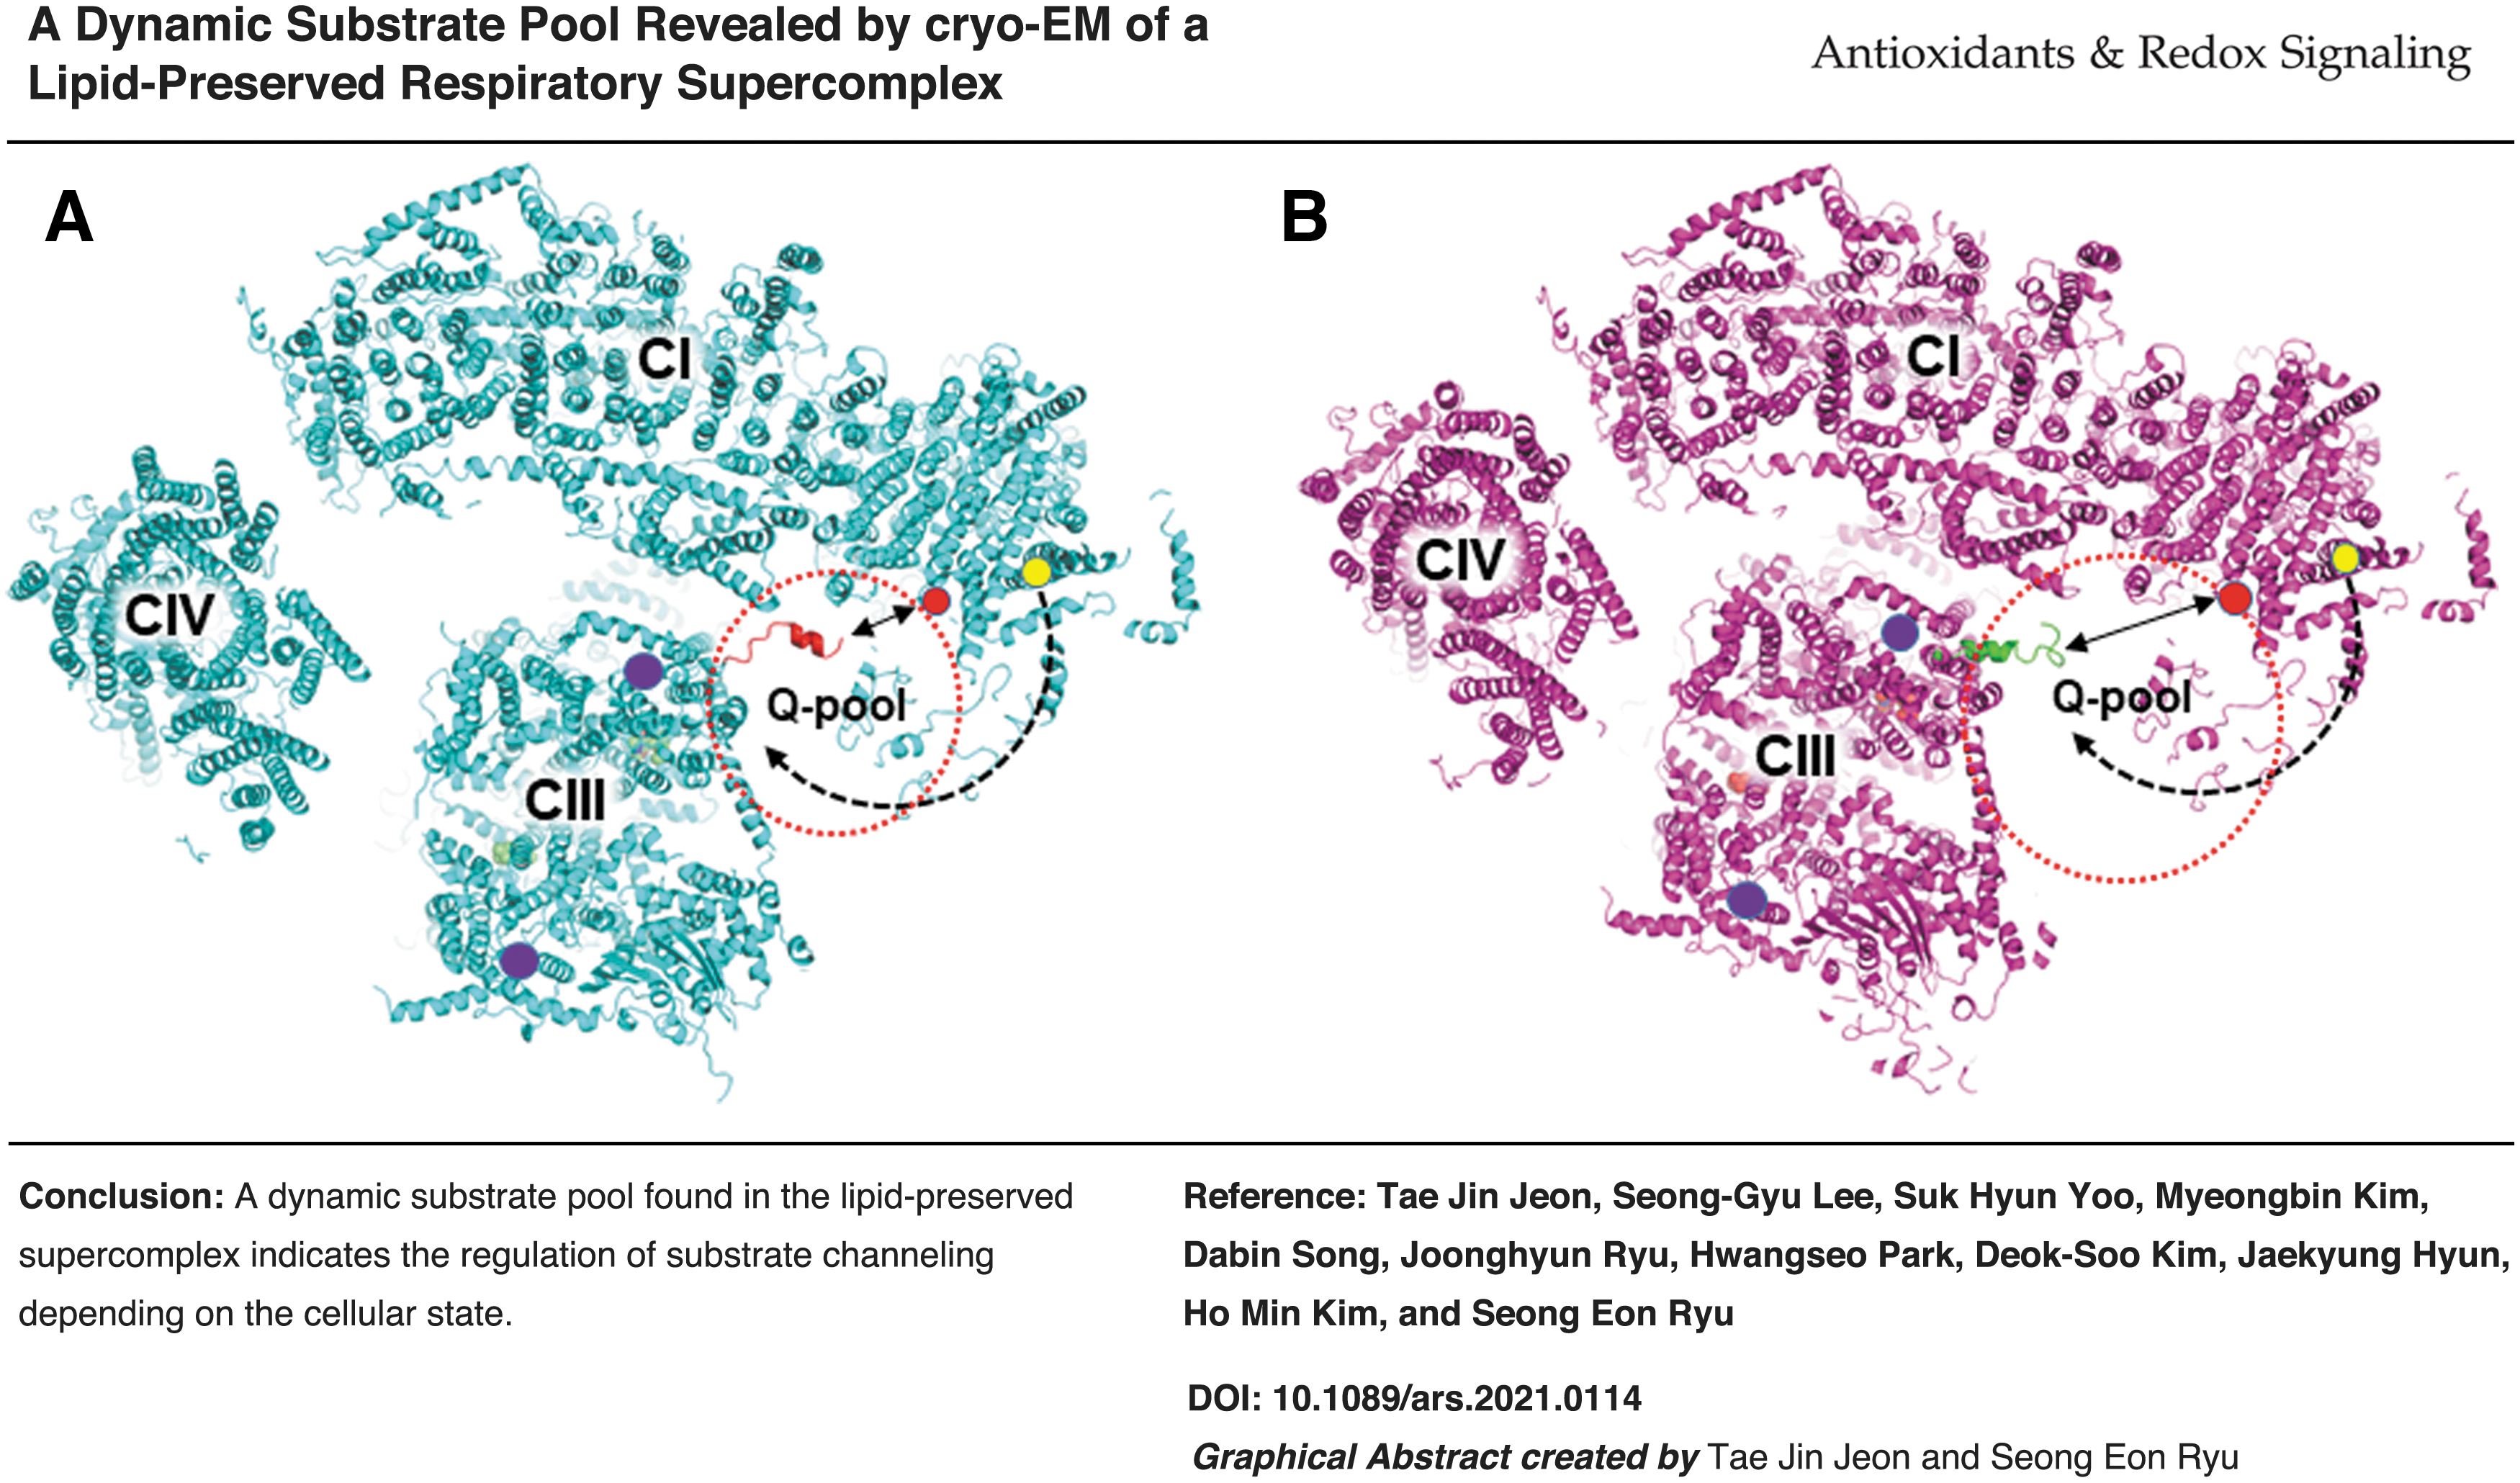
Mitochondrial respiratory supercomplexes mediate redox electron transfer, generating a proton gradient for ATP synthesis. To provide structural information on the function of supercomplexes in physiologically relevant conditions, we conducted cryoelectron microscopy studies with supercomplexes in a lipid-preserving state.
Results:
Here, we present cryoelectron microscopy structures of bovine respiratory supercomplex I1III2IV1 by using a lipid-preserving sample preparation. The preparation greatly enhances the intercomplex quinone transfer activity. The structures reveal large intercomplex motions that result in different shapes and sizes of the intercomplex space between complexes I and III, forming a dynamic substrate pool. Biochemical and structural analyses indicated that intercomplex phospholipids mediate the intercomplex motions. An analysis of the different classes of focus-refined complex I showed that structural switches due to quinone reduction led to the formation of a novel channel that could transfer reduced quinones to the intercomplex substrate pool.
Innovation and Conclusion:
Our results indicate potential mechanism for the facilitated electron transfer involving a dynamic substrate pool and intercomplex movement by which supercomplexes play an active role in the regulation of metabolic flux and reactive oxygen species. Antioxid. Redox Signal. 36, 1101–1118.
Introduction
Respiratory protein complexes mediate electron transfer processes to extract chemical energy from NADH and produce biologically useful ATP molecules (25, 38). In mammalian cells, there are five respiratory protein complexes including complexes I to V, whose molecular weights reach as large as mega-Daltons. Because high-energy electrons travel from one complex to the other in the mitochondrial inner membrane, they often encounter molecular oxygen. Thus, mitochondrial electron transfer paths are prone to reactive oxygen species generation and are regarded as the major source of cellular reactive oxygen species (10, 35, 46).
Innovation
The formation of supercomplexes increases metabolic flux and decreases the generation of reactive oxygen species, indicating efficient substrate channeling in the supercomplex state. However, the structural mechanism of substrate channeling had not been described yet. By using physiologically relevant supercomplex preparation in cryoelectron microscopy structure determination, we show potential mechanism for substrate channeling in respiratory supercomplex through a dynamic substrate pool and novel internal channel. These results are consistent with previous biochemical and physiological expectations, and it would be worth exploiting therapeutic means for facilitating supercomplex formation in vivo to control metabolic and reactive oxygen species-related diseases.
The formation of supercomplexes among individual complexes has been observed in various cells, and has been shown to increase metabolic flux and decrease reactive oxygen species (8, 11, 36, 39). Tissues from aging mice exhibit reduced mitochondrial respiratory supercomplex formation, leading to an increased generation of reactive oxygen species (8, 11, 36, 39).
Supercomplex structures have been reported to reveal an association between complexes I, III, and IV to form a I–III2–IV supercomplex (6, 16, 17, 22, 42, 54, 58). In the supercomplex structure, the complex III dimer associates with the lateral side of the L-shaped complex I, and complex IV interacts with the tip of the membrane domain (the base of L) of complex I and the side of complex III. Atomic-resolution structures of the supercomplexes revealed that the transmembrane regions of complexes I and III make direct contacts exhibiting hydrophobic and hydrophilic interactions (22, 42, 58), and the arrangement of individual complexes in the supercomplex appeared relatively rigid.
Consistent with the tight interactions between individual complexes, all supercomplex structures had a similar arrangement of individual complexes, except for a subclass structure (class B) of the 9 Å structure of the bovine respirasome showing a 20° rotation of complex III about the dimeric diad perpendicular to the membrane plane (54). The rotation did not change the lateral association region of complex I.
A low-resolution tomographic electron microscopy study of the supercomplex of the in situ mitochondrial membrane revealed a loose association between complexes I and III (16), indicating that the tight association observed in atomic-resolution cryoelectron microscopy studies may not represent the physiological arrangement. Intriguingly, in the supercomplex association of atomic-resolution supercomplex structures (22, 42, 58), the electron carrier quinone entrance/exit site of complex I was located >100 Å away from the quinone-binding sites of complex III, indicating that reduced quinone may travel long distances by diffusion.
Furthermore, the quinone entrance/exit site located at the elbow region of the L-shaped complex I was opposite the complex III interaction site, resulting in the extension of the quinone-traveling route from complex I to complex III and dilution of reduced quinones with the surrounding lipids. In these structures, there was no structural indication for substrate channeling for efficient electron transfer (26, 43). Thus, the role of supercomplex formation in mitochondrial function was questioned (26). As a possibility, the supercomplex-mediated stabilization of densely packed mitochondrial cristae membranes has been proposed (26).
Complex I reduces quinones and generates proton gradients using the redox energy of NADH (25, 38). Numerous atomic-resolution structures of complex I have described the quinone-binding channel, quinone reduction-associated conformational changes in complex I subunits, and proton pumping mechanisms (3, 9, 20, 29, 47, 48, 61). The oxidized form of quinone enters the quinone channel starting from the quinone head and reaches the quinone-head binding site near the N2 prosthetic group where electron transfer occurs (48). The reduction of quinone produces a partial negative charge, which is thought to trigger conformational changes in complex I (20, 29). In a structural study of complex I, two forms of structures, termed the active and deactive forms, were found (48).
The active and deactive forms appeared to have closed and open conformations of the elbow angles, respectively. In the deactive structures, the quinone head-associated loops and redox-active ND3 loops are destabilized. The high-resolution structures of complex I in conditions with and without ligands have indicated that the deactive states are bona fide variations of the active states (29). The structure of complex I in the turnover state revealed two molecules of decyl-quinone in the quinone-binding channel (29), which is consistent with the results of previous computational studies (24, 57).
However, how the reduced quinone at the internal position of the quinone channel can efficiently exit for turnover in the presence of another quinone blocking the exit path remains unclear. Thus, despite the wealth of atomic-resolution structures of complex I, questions persist, especially regarding the quinone transfer path, the coupling of quinone reduction and conformational switches, and the function of complex I in the context of supercomplex association.
To provide structural information on the function of supercomplexes in physiologically relevant conditions, we conducted cryoelectron microscopy studies with supercomplexes in a lipid-preserving state. Here, we present the atomic-resolution cryoelectron microscopy structures of the lipid-preserved bovine respiratory supercomplex I1III2IV1, which was prepared with minimal exposure to lipid-extracting detergents. The structures revealed large intercomplex motions involving the lateral movement of complexes III and IV relative to complex I by 45 Å, which resulted in differences in the shape and size of the substrate pool for different supercomplex association states.
In the membrane region, complexes I and III had a gap that could accommodate two layers of phospholipid molecules, indicating that the intercomplex motion is mediated by phospholipid interactions. The intercomplex gap is consistent with the finding of a previous low-resolution in situ tomographic study (16). Despite the gap in the membrane region, specific intercomplex contacts were observed in the off-membrane regions, indicating their roles in the regulation of electron transfer.
The analysis of two different classes of focus-refined complex I structures revealed coordinated loop conformation switches triggered by quinone reduction and a novel channel that could be used for the streamlined transportation of reduced quinones to the substrate pool and complex III. The dynamic substrate pool and novel channel leading to the substrate pool suggest the active roles of supercomplexes in facilitated electron transfer and regulation of reactive oxygen species generation.
Results and Discussion
Overall structure
The bovine mitochondrial respirasome for the cryoelectron microscopy experiments was prepared by using amphipol A8-35. The long polymer amphipol stabilizes macromolecular assemblies by wrapping around them (37, 55). After homogenization of the fresh bovine heart, mitochondria were isolated by fractional centrifugation. The purified mitochondria were solubilized by incubating in digitonin. The total incubation time was kept within 1 h to avoid lipid overextraction. Immediately after the solubilization, the detergent was exchanged with amphipol A8-35. The minimized digitonin-exposure time was critical for preserving optimal supercomplex activity (see Supercomplex activity and lipid quantitation).
The amphipol-exchanged mitochondrial membrane proteins were loaded onto a sucrose gradient, and the supercomplex I1III2IV1 was isolated by ultracentrifugation (Supplementary Fig. S1). The supercomplex I1III2IV1 in an amphipol-containing buffer was subjected to cryoelectron microscopy data collection (Supplementary Tables S1, S2 and Supplementary Figs. S1, S2). Two-dimensional classification of single particles resulted in well-resolved class averages, with some secondary structural features clearly identifiable.
After the 3D classification of ∼900 k particles, ∼225 k particles were subjected to 3D refinement, resulting in an overall resolution of 4.2 Å (Gold-standard FSC 0.143 criterion). The 3D classification of supercomplex particles revealed five different classes. Four major classes (states 1–4) contained the supercomplex I1III2IV1, whereas state 5 contained the supercomplex I1III2. Focused refinement and 3D classification of the complex I region (Supplementary Tables S1, S2 and Supplementary Fig. S2) resulted in two different classes, A and B of 3.8 Å and 4.2 Å resolutions, respectively.
Among the four major classes of the supercomplex I1III2IV1, states 1–3 showed a coordinated movement of complexes III and IV relative to complex I (Fig. 1). The relative orientations of the complexes in state 2 are similar to those of other supercomplex structures (22, 42, 54, 58). However, states 1 and 3 exhibit large deviations from state 2, as newly observed in this study. State 1 had complexes III and IV moving close to the matrix arm of complex I, revealing a closed supercomplex compared with those of other states (Fig. 1).

In states 2 and 3, complexes III and IV moved in the opposite direction from state 1, resulting in open supercomplexes (Fig. 1). The extent of movement between states was 20–45 Å (45 Å for states 1 and 3, 31 Å for states 1 and 2, and 20 Å for states 2 and 3) (Fig. 1). In addition to lateral movements, slight rotations of complexes III and IV around complex I with a pivot at the center of the supercomplex were observed (Fig. 1). State 4 showed a rotation of complex III, which resembled the class 2 structure of the bovine respirasome (54). Thus, states 2 and 4 are similar to classes 1 and 2 of the low-resolution structures reported by Sousa et al. (54), respectively.
In the 9–10 Å resolution structures reported by Sousa et al., one of the two ISP domains in complex III was not resolved, indicating that the ISP was in a moving state for electron transfer, and the structures represented an active state of the supercomplex. In the state 4 structure, the corresponding ISP domain was not visible, which is consistent with that in the low-resolution structure. In states 1–3 structures, both ISP domains were included in the final models; however, one ISP domain corresponding to the invisible ISP in state 4 exhibited a weak density.
Intercomplex interaction switch
Distinct intercomplex interactions were observed in different states (Fig. 2 and Supplementary Table S3). In the matrix region, there were five interaction sites (sites 1–5) (Fig. 2A–C). Site 1 of states 1 and 2 showed dramatic differences in intercomplex interactions due to the sliding motion of complex III relative to complex I (Fig. 3). In state 1, the N-terminal region of the SU7 subunit of complex III interacted with the B14.7, ND6, and 39 kDa subunits of complex I (Fig. 3A). In comparison, in state 2, the SU7 subunit moved away from complex I, resulting in an interaction with only the B14.7 subunit (Fig. 3B). Electron density maps of the regions were relatively well resolved (Fig. 3C, D).

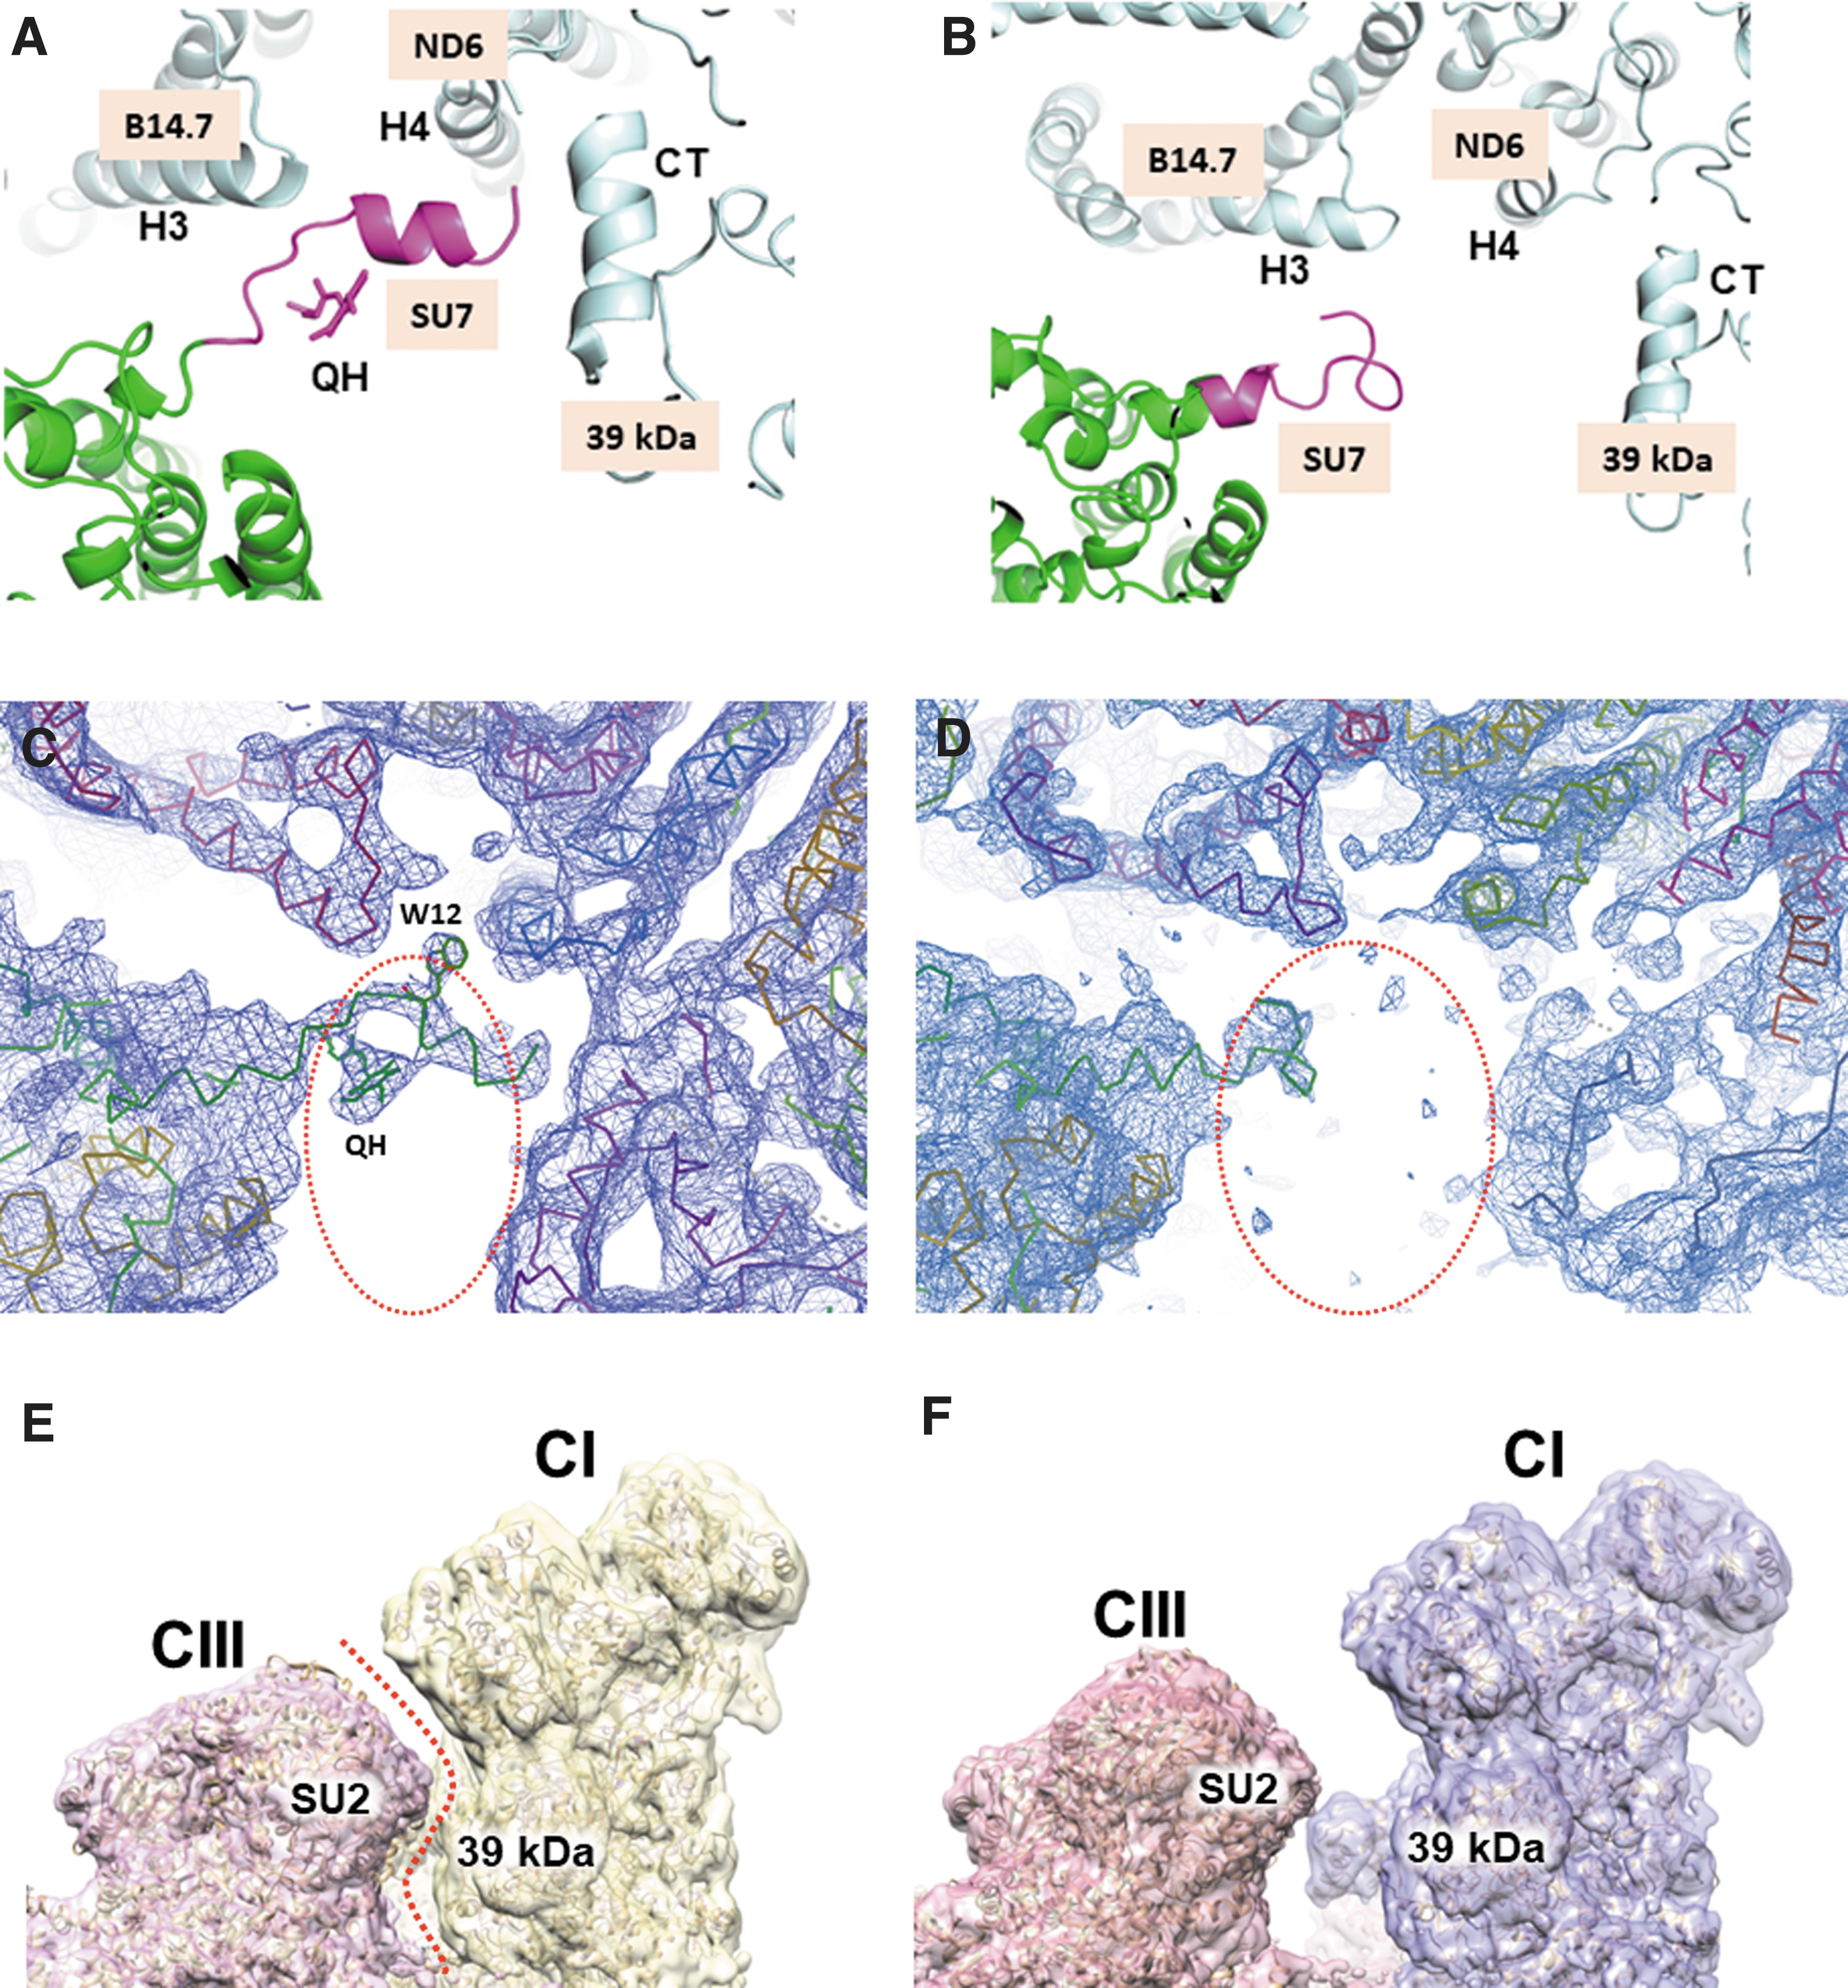
The SU7 subunit corresponds to the UQCRB protein, which has been implicated as a critical mediator of mitochondrial reactive oxygen species generation and hypoxia response (28), suggesting a relationship between reactive oxygen species generation and the intercomplex interaction switch. Site 2 was present in only state 1 (Fig. 3E, F and Supplementary Table S3), and its interaction occurred between the His331 loop of the complex-I 39-kDa subunit and the Gln218 loop of the complex III SU2 subunit (Supplementary Table S3). Surface representations of the electron density maps of these regions showed the presence and absence of the site-2 interactions in states 1 and 2, respectively (Fig. 3E, F). Electron densities of the direct intercomplex interaction regions are presented in Supplementary Figure S3.
The well-defined electron densities and specific interactions in the structural switch regions (Supplementary Fig. S3 and Supplementary Table S3) indicate that different supercomplex states are not from either structural disintegration or nonspecific associations during cryo EM sample preparation. Significant amounts of molecular particles for different supercomplex states (Supplementary Fig. S2) also indicate that those states represent stable structures. However, molecular dynamics simulations using high-resolution structures and functional/biochemical validations would be required for further proofs of physiological relevance of different supercomplex states.
In the membrane region interaction site a (Fig. 2D–F), helices 2 and 3 of the complex I B14.7 subunit interacted with the C-terminal helix of the complex-III SU8 subunit with a 17–18 Å interhelix separation (Fig. 4A). However, the relative orientation of the interacting helices was significantly different depending on the supercomplex states. The SU8 helix showed a lateral movement relative to the B14.7 subunit by ∼20 Å between states 1 and 3 (Fig. 4A). The maintenance of the intercomplex distance of ∼17–18 Å in all three states indicated that the SU8 helix was likely bound to the B14.7 subunit via a lipid-mediated interaction. The separation between the SU8 helix of complex III and the B14.7 helices of complex I is greater (by ∼7–8 Å) than those of previous supercomplex structures (22, 42, 58).
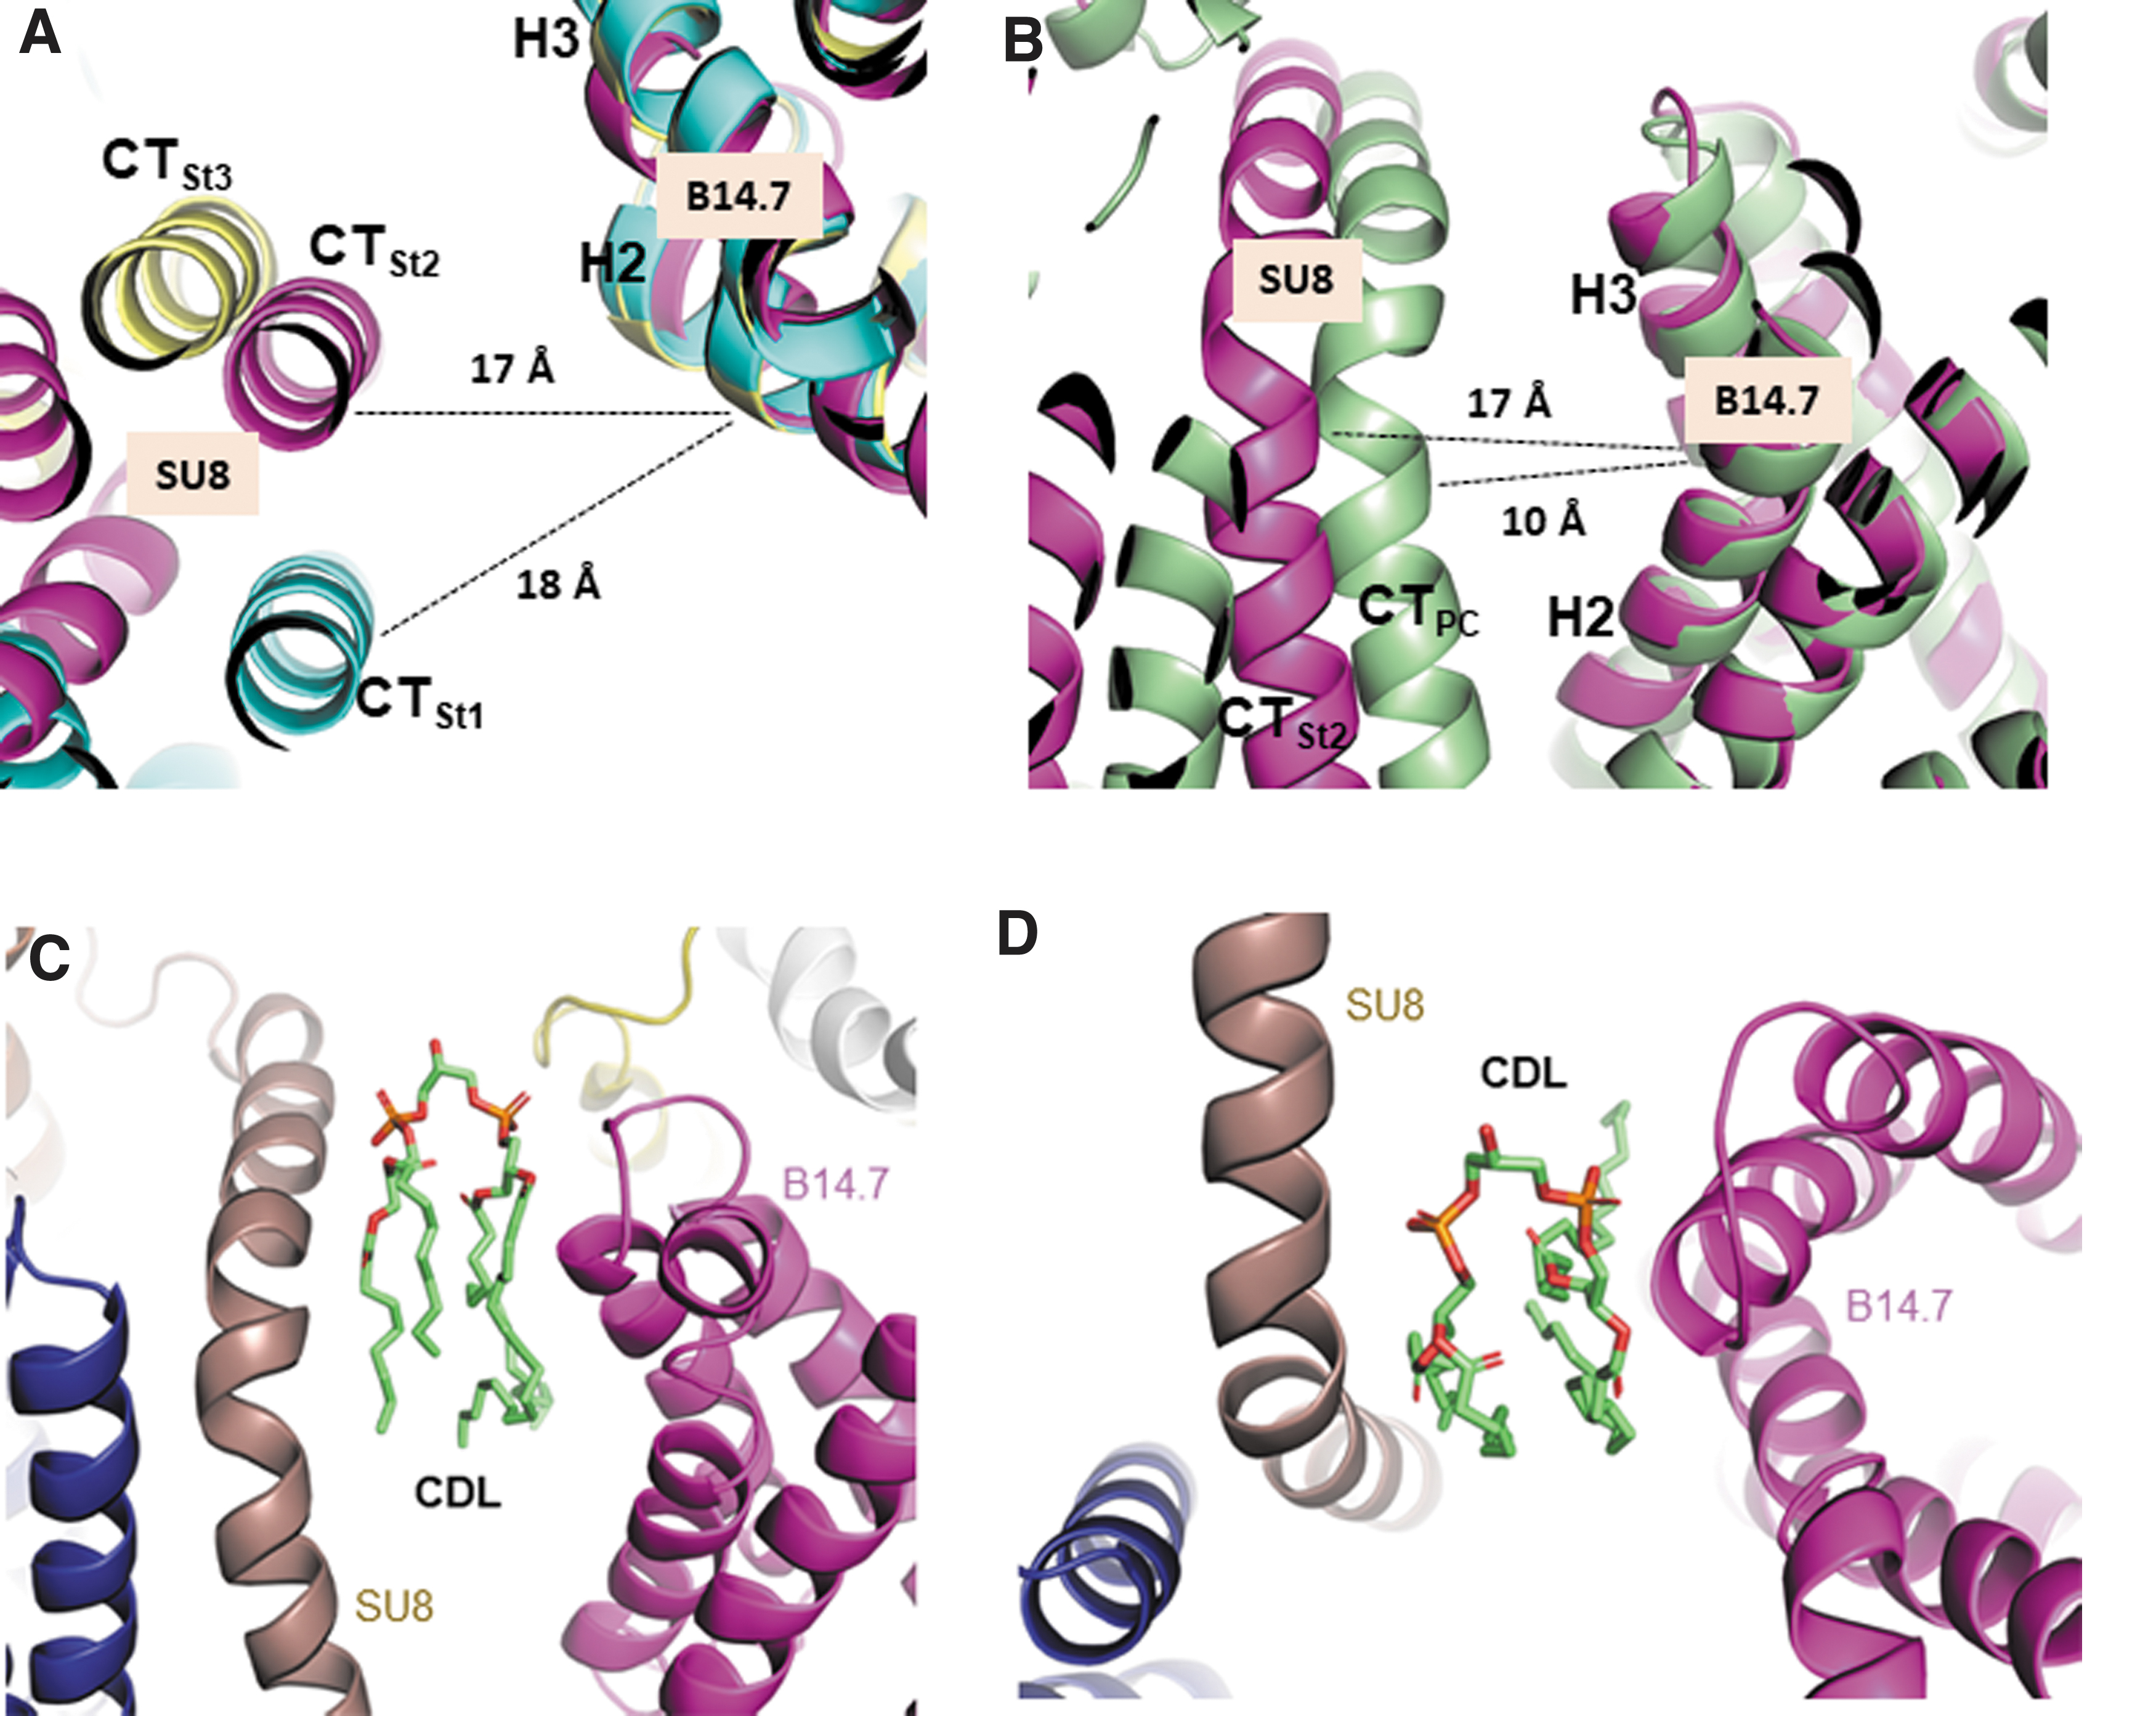
A comparison of the state 2 structure with the porcine supercomplex structure (PDB code: 5GUP) (58) is presented in Figure 4B, showing that the intercomplex distance in the porcine structure is significantly shorter than that of the state 2 structure, and that there is no room for lipid insertion. The lack of lipid-mediated intercomplex interactions in the previous structures might have caused the rigidity of supercomplexes, which did not allow intercomplex movements.
The difference in intercomplex separation is consistent with the results of a low-resolution (∼40 Å) electron cryotomography structure analysis of the supercomplex in the in situ mitochondrial membrane state (16), where the complex-III dimer was displaced by 8 Å from the complex-I matrix arm in comparison with the average position of the complex III dimer in previously reported high-resolution supercomplex structures (see Supplementary Figs in Davies et al.). Because the cryotomography study was performed under conditions close to those of the native mitochondrial membrane, the intercomplex separation observed in our supercomplex structures is likely physiologically relevant.
The intercomplex separation could accommodate lipid molecules. Although we could not model the intercomplex phospholipids due to weak electron density, the separation was observed to be large enough to accommodate two regular phospholipids or a two-phospholipid-containing cardiolipin. We modeled cardiolipin (CDL) in the intercomplex space of the state 2 structure using extra electron densities in the region (Fig. 4C, D and Supplementary Fig. S4A).
Phosphate regions of the modeled cardiolipin (CDL in Fig. 4C, D and CDL1 in Supplementary Fig. S4A) fitted well with the extra densities residing in the intercomplex space (Supplementary Fig. S4A). The states 1 and 3 also showed similar extra electron densities (data not shown). The other side of the membrane also had extra densities that could be modeled as phosphates of cardiolipins (CDL2-4) and a phosphatidylethanolamine (Supplementary Fig. S4B). In the modeled structure, two phosphates of CDL1 (P1 and P2) made charge interactions with R42 of the SU8 subunit of complex III and R106 of the B14.7 subunit of complex I, respectively (Supplementary Fig. S4C), and an ester group of CDL1 (ES) made hydrogen bond interaction with R58 (B14.7) (Supplementary Fig. S4C).
Four aliphatic tails of cardiolipin made well-formed hydrophobic interactions with hydrophobic helices of SU8 and B14.7 (Supplementary Fig. S4D). More phospholipids can line through lateral separation, resulting in two layers of phospholipids. These intercomplex phospholipids can function as a lubricant for the intercomplex structural switches. If there were no lubricant phospholipids in the intercomplex space, the intercomplex structural switch would be difficult to occur.
In studies on supercomplex structures (22, 42, 58), except for those on low-resolution bovine respirasome structures (6, 54), digitonin has been used in sample preparation. In comparison, we substituted the initial detergent (digitonin) with amphipol immediately after digitonin solubilization of the mitochondrial proteins. A previous study that reported a 19-Å-resolution bovine structure (6) used a procedure similar to ours; however, the structure could not reveal intercomplex motions due to its limited resolution.
Another study on a low-resolution (9 Å) bovine structure (54) used PCC-a-M (trans-4-(trans-4′-propylcyclohexyl)cyclo-hexyl-α-D-maltoside) for solubilization and exchanged the detergent with amphipol. The 9-Å bovine structure revealed a rotational movement of complex III, similarly to the state 4 structure. However, the large intercomplex movements seen in the states 1–3 structures were not observed, possibly due to differences in the solubilizing detergent (PCC-a-M vs. digitonin) and limited cryoimage quantity (Sousa et al.'s 3592 images and 137,606 particles vs. our 9228 images and 225,000 particles).
Supercomplex activity and lipid quantitation
To analyze the functional relevance of supercomplex preparation with different detergents, we compared the activities of the supercomplexes prepared either with digitonin alone (used for previous atomic-resolution structures, D) or with amphipol exchange (used for our structures, AE) (Fig. 5A). We also compared the supercomplex sample with the late-amphipol exchange method (LAE). When equal amounts of supercomplexes were used in an NADH-consumption activity assay, the AE supercomplex showed higher activity than that of the D sample. Significantly, the difference in the activity of the intercomplex quinone transfer (phase 2 in Fig. 5A) was greater than that of the complex I activity (phase 4 in Fig. 5A). In Figure 5A, the activity of supercomplex is represented as slope (absorbance change/min) of the NADH-consumption curve.

In phase 2, the ratio of the AE and D activities was 0.200/0.111 = 1.80, whereas, in phase 4, the ratio was 0.172/0.146 = 1.18. The significant difference in the ratio indicated that the AE sample had higher intercomplex quinone transfer activity than the D sample, while the complex I activities of two samples were comparable, reflecting their equivalent concentrations. The ratio difference between phases 2 and 4 can not be explained by any possible protein quantitation errors. The LAE sample exhibited a similar activity profile to the D sample (the lower phase-2 slope than that of the AE sample), indicating that an extended exposure to digitonin played a major role in the decrease of intercomplex quinone transfer activity.
Overall activity of the LAE sample was slightly lower than that of the D sample due to possible damage to the sample by the late detergent exchange. Cytochrome C receives electrons from only complex III, and not from complex I. Thus, in phase 2, NADH consumption is dependent on the efficiency of electron transfer between complexes I and III. In comparison, the NADH consumption measured in the quinone addition step (phase 4) can occur within complex I without the contribution of electron transfer between complexes I and III. Thus, the major activity increase of the AE sample in phase 2 indicates that the AE in early stage helped to preserve intercomplex electron transfer.
The long polymer amphipol stabilizes macromolecular assemblies by wrapping around the assemblies (37, 55). Unlike the long exposure to detergents such as digitonin, AE may have stabilized the physiological assembly of supercomplexes and prohibited the overextraction of the phospholipids that reside in the intercomplex space. To analyze the possibility of lipid overextraction by digitonin, we compared the total phospholipid content of different supercomplex samples. In the analysis, to avoid the effects of different detergents in lipid content analysis, we compared the AE and LAE samples that have difference in digitonin-exposure time.
For the preparation of the LAE sample, the initial digitonin sample was amphipol exchanged after the sucrose gradient purification step that took ∼20–24 h. Thus, the resulting two samples [the AE and LAE samples] had a similar molecular environment except for the duration of the exposure to digitonin. The quantitation analysis (Fig. 5B) showed that the LAE sample had significantly fewer phospholipids (by ∼23%) compared with the AE sample, supporting the possibility of lipid overextraction by a long exposure to digitonin. The amount of phospholipids in the AE sample (558 moles/supercomplex) was similar to the previously reported value (623 ± 102 moles/supercomplex) for the AE method purification (53), while that in the LAE sample (430 moles/supercomplex) was significantly lower than the previously reported value.
The amounts of phospholipids in the purified complex I1 and the crystal structures of complexes III2 and IV1 have been reported to be 71, 108, and 13 moles/complex, respectively (45, 51, 52). Phospholipids in individual complexes were found to be tightly associated within protein pockets. The sum of the amount of tightly bound phospholipids in individual complexes (192 moles) is significantly lower than those of the supercomplex samples, suggesting that the difference between the AE and LAE samples arises from the overextraction of loosely bound phospholipids such as intercomplex phospholipids. Using mass spectrometry, we quantified amounts of quinone in the amphipol (AE) and digitonin (D) samples (Supplementary Fig. S5) to test possibility that different amounts of quinone in the samples might have affected the supercomplex activity.
In that analysis, the AE and D samples exhibited similar amounts of quinones (5.64 and 5.27 moles of quinone per supercomplex, respectively). The ratio between quinone amounts of the two samples was 5.64/5.27 = 1.07, significantly lower than the activity difference ratio for phase 2 (1.80) (Fig. 5A). Thus, the quinone amounts in different samples did not contribute to the activity difference of supercomplexes in phase 2 of Figure 5A, corresponding to the intercomplex electron transfer activity.
In digitonin-solubilized supercomplex structures (23), individual complex-associated phospholipids were found only in the intracomplex phospholipid-binding pockets, and no phospholipids were found in intercomplex regions that had no room for phospholipid insertion. The intercomplex lipids are likely prone to overextraction due to the absence of tightly interacting pockets, resulting in a tight association between complexes I and III of the previous supercomplex structures.
In a recent structural study of supercomplex I + III2, the addition of amphipol A8-35 to the supercomplex sample protected the supercomplex from dissociation over time (41). In this study, however, amphipol was added after the ion-exchange chromatography or size exclusion chromatography steps that took extended time, as for the LAE sample previously mentioned, and the resulting structures showed narrow intercomplex separation similar to the previous structures obtained with the digitonin preparation. Thus, the minimization of the digitonin-exposure period is critical for the preservation of the native states and activity of the supercomplexes.
We analyzed activities of different supercomplex samples with externally added phospholipids (Supplementary Fig. S6). The phospholipid addition significantly enhanced the activity of phase 2 in the D sample (the slope changed from 0.077 to 0.150) (Supplementary Fig. S6A), whereas the activity of the AE sample was similar (0.157 vs. 0.160) (Supplementary Fig. S6B). The slope ratio between the AE and D samples before the phospholipid addition (0.157/0.077 = 2.04) was greatly reduced after the phospholipid addition (0.160/0.150 = 1.07).
The activity restoration of phase 2 in the D sample supports that the supercomplex activity difference between the AE and D samples before the phospholipid addition was due to lipid overextraction in the D sample. Because phase 2 of the supercomplex reaction involves electron transfer between complexes I and III, the activity restoration by the phospholipid addition indicates an important role of phospholipids in mediating the intercomplex interactions. In comparison, the activity of the LAE sample was not restored despite the addition of phospholipids, indicating that the late AE locked the supercomplex in the lipid-overextracted state (Supplementary Fig. S6C). This is likely due to characteristics of amphipol that stabilizes macromolecular assemblies by wrapping around them.
Conformational switch in complex I
The class A and B structures of complex I obtained by focused refinement (Supplementary Tables S1, S2 and Supplementary Figs. S2, S7) resembled the active (or closed) and deactive (or open) structures in previous complex I structures, respectively. The elbow angle of the class A structure was 1.1 ° larger than that of the class B structure, and the matrix arm of the class A structure shifted further to the mitochondrial matrix by 2.3 Å (Supplementary Fig. S7). The active structures have an ordered structure in the quinone-binding region (61), whereas the deactive structures exhibit disorder in the corresponding region and associated loops (9, 20). Another characteristic of the deactive structures is disorder of the cysteine-containing ND3 loop between transmembrane helices 1 and 2 (20, 61). The Cys39 residue of the ND3 loop is susceptible to oxidation in the deactive state (14, 21).
In comparison, the cysteine is not susceptible to oxidation in the active state, indicating structural switches in the region between the active and deactive states. Although the class A and B structures showed the characteristics of previously reported structures, there were differences in the details of the main and side chain conformations that may arise from the mobile nature of complex I structures depending on the activity states and supercomplex association.
In class A and B structures, conformational switches were found in loops associated with the His-containing loop of the 49-kDa domain (the His-loop) (Supplementary Fig. S8). His92, which corresponds to His59 reported by Fiedorczuk et al. (20), was implicated in quinone interaction. In the class A structure, the His-loop made tight contact with the Arg114 region of the PSST subunit and Val208 region of the ND1 subunit (Supplementary Fig. S8A). Phe41 of the redox-active ND3 loop (the TMH1-TMH2 loop) also interacted with the Val208 loop in the class A structure (Supplementary Fig. S8A).
In comparison, the class B structure revealed a conformational switch involving reorientation of the His-loop, Arg114 region, and associated interactions (Supplementary Fig. S8B). The conformational switch likely starts from the His-loop reorientation, which could be triggered by the reduction of quinone through electron transfer from NADH. The reduced quinone intermediates, including semiquinones, have negative charges and can attract the positively charged histidine side chains of the His-loop. The conformational switch in the His-loop appeared to propagate toward the ND1 and ND3 loops, which resulted in the destabilization of the two loops.
Further, the quinone reduction-mediated conformational switch appeared to affect quinone channel formation. Channel estimation with the class A structure of complex I resulted in a well-formed quinone channel that started from the tip of the elbow and ended near the N2 prosthetic group (Supplementary Fig. S9A, B). Similar channels have been found in previous studies (3, 7, 20, 29). Unexpectedly, we found that the class B structure did not form a similar channel but exhibited a novel channel connecting the upper middle region of the original quinone-binding channel to the ND3 loop region (Supplementary Fig. S9C, D). The novel channel, named the q-ND3 channel, was found from channel estimation by the program BetaCavityWeb (33), which calculated all possible channels in complex I structures.
The generation of the q-ND3 channel in the class B structure was due to the disruption of the coordinated interaction between the ND1 and ND3 loops during the structural switch from A to B forms. The q-ND3 channel formed not only in the class B structure with the deletion of the destabilized ND1 and ND3 loop regions but also in the class B structure with the deleted ND1 and ND3 loops built back into the model, indicating the structural relevance of the q-ND3 channel (Supplementary Fig. S9E). Using the BetaCavityWeb program, we found the q-ND3 channel in other open-form structures (Supplementary Table S4 and Supplementary Fig. S9F–R).
Interestingly, the q-ND3 channel starts from the tail-end region of the dodecyl quinone (DQ) bound proximal to N2 in the turnover state structure of complex I (29) (Fig. 6A). The long tail of Q10 could also be modeled around the q-ND3 channel start region (Fig. 6A), indicating that the reduced quinone tail (both DQ and Q10) may enter the channel. The q-ND3 channel was found to be surrounded by patches of hydrophobic residues (Phe50 and Val96 of the B14 subunit; Val140 of the PSST subunit; Phe84, Val448, and Leu192 of the 49 kDa subunit; and Val213 of the ND1 subunit) as well as positively charged residues (Lys139 and Arg114 of the PSST subunit and Arg134 of the ND1 subunit) (Fig. 6B).
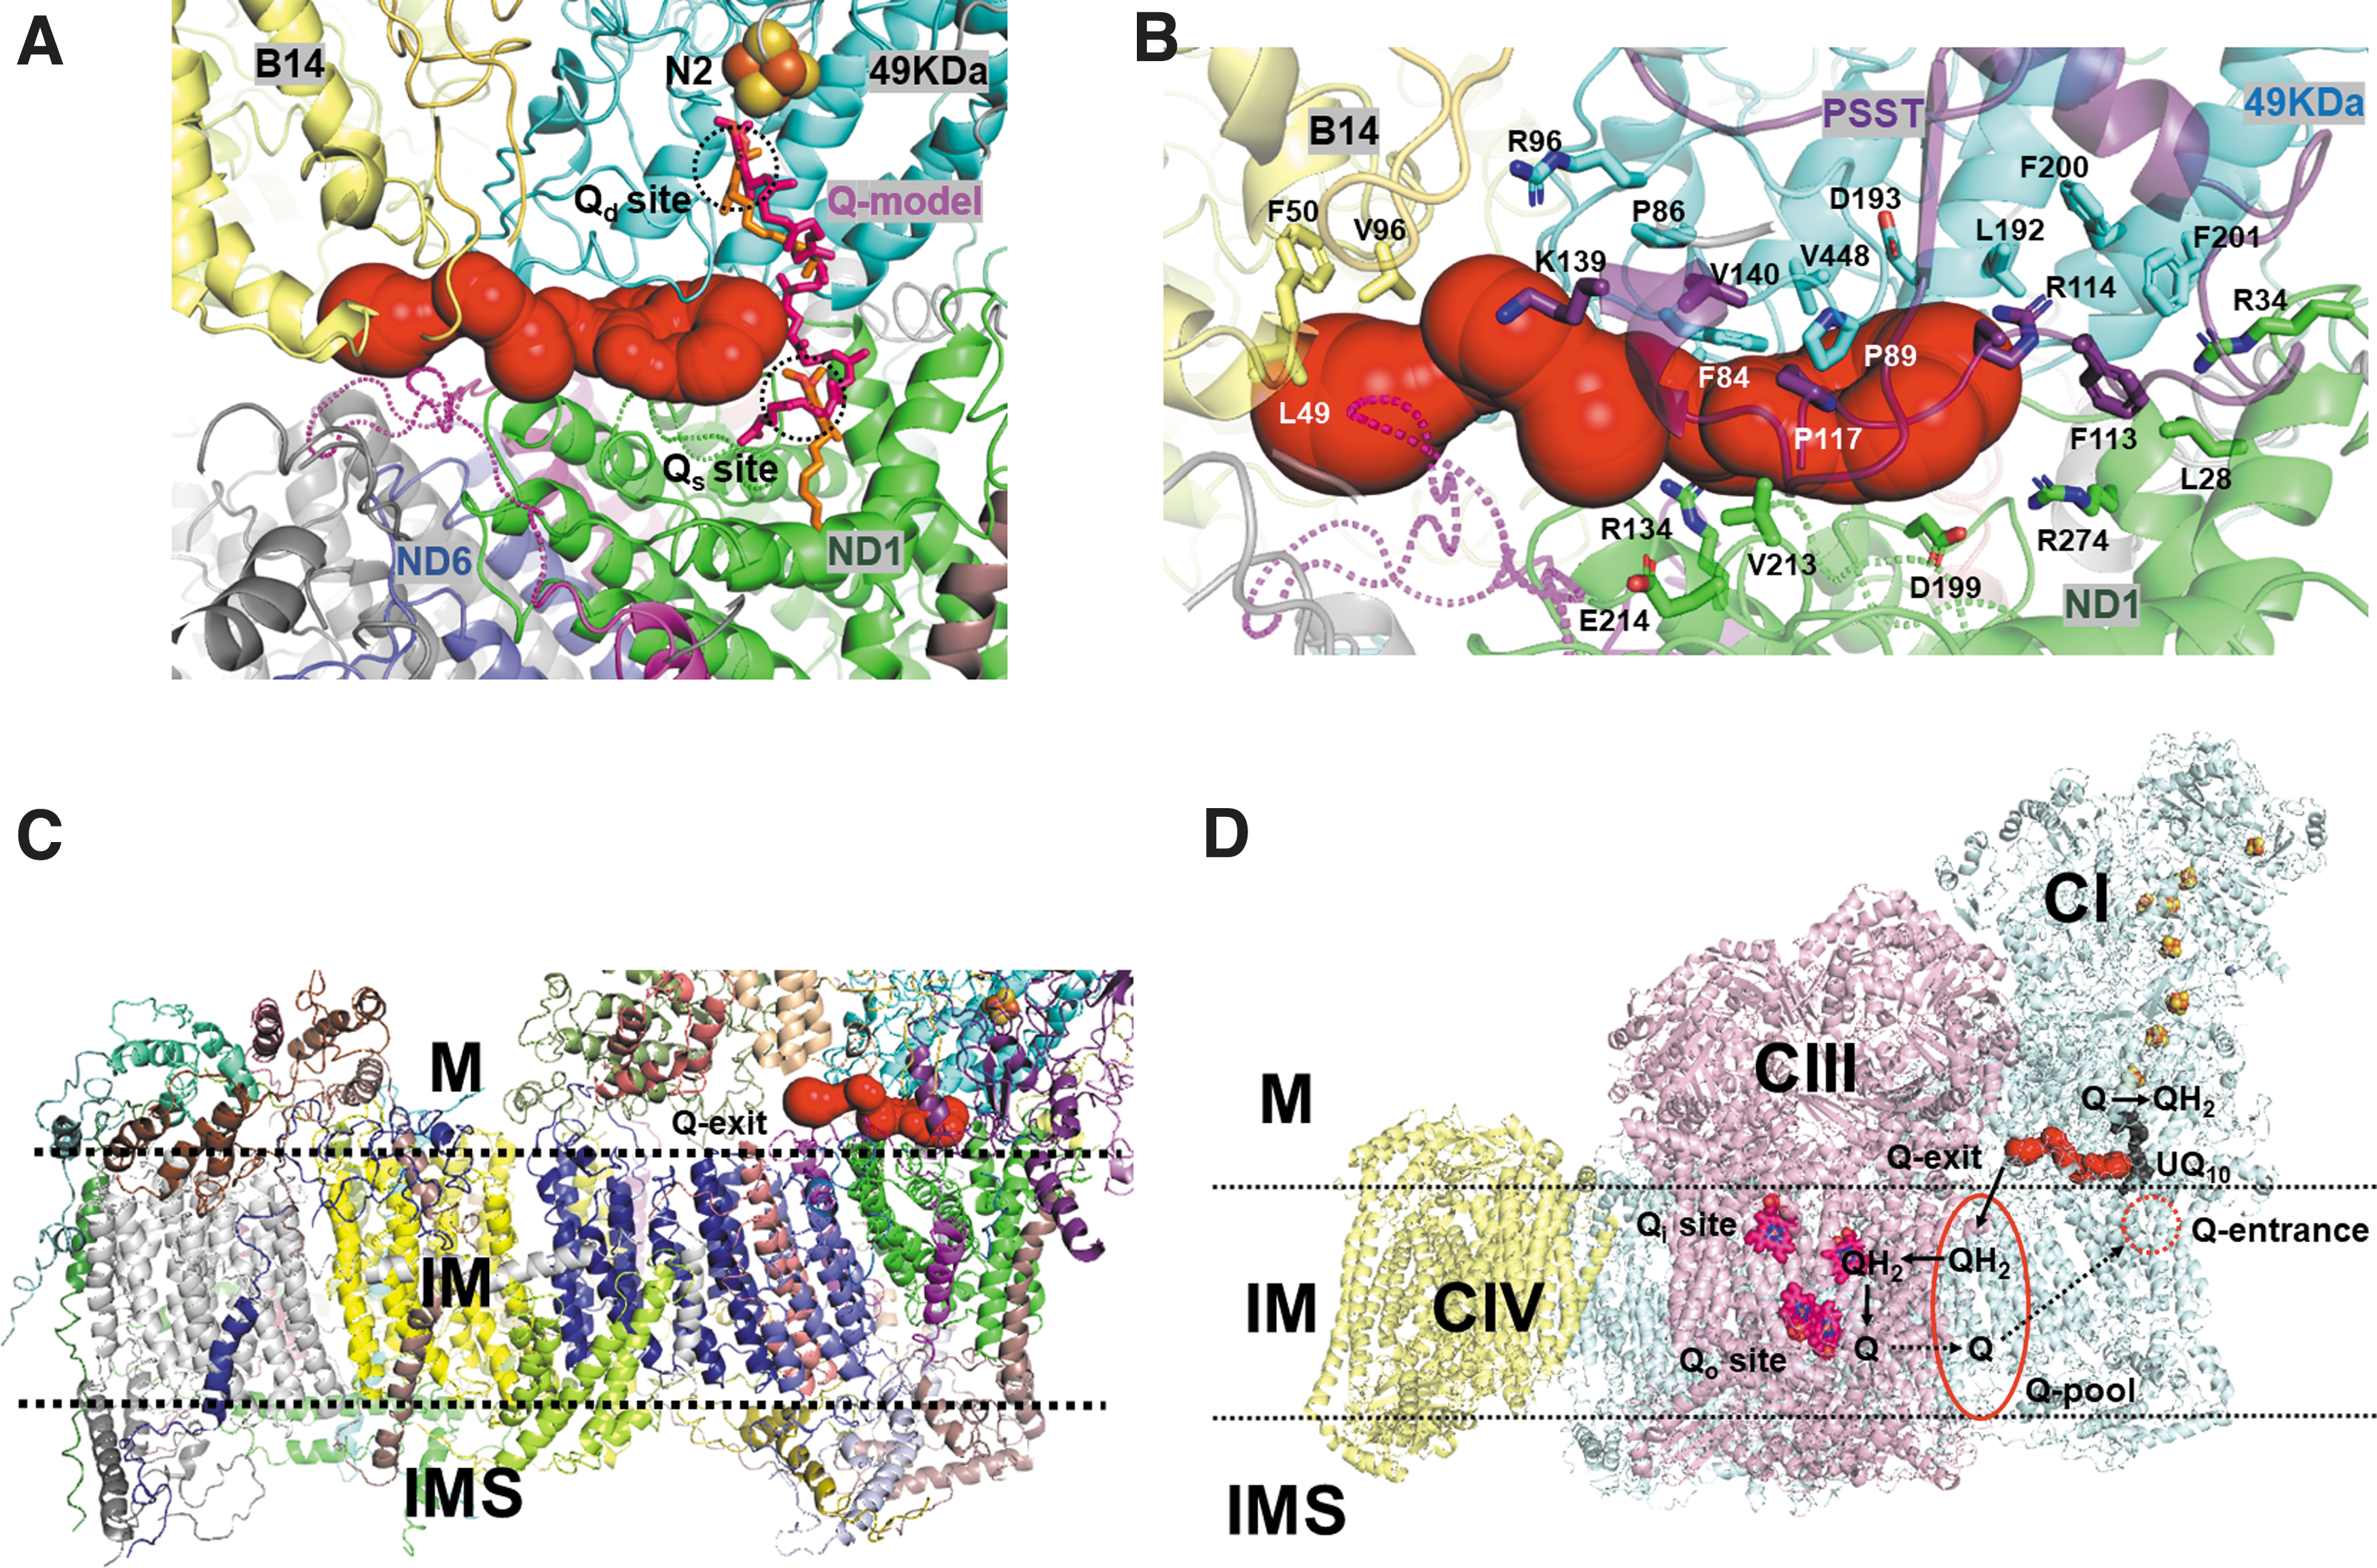
The hydrophobic patches and positively charged residues can stabilize the hydrophobic tail and the negatively charged head of the reduced quinone during quinone transfer, respectively. Dimension of the q-ND3 channel in Figure 6 was ∼38 Å and 9 Å in length and diameter, respectively, and the channel fitted well with one molecule of Q10 (Supplementary Fig. S10). The complex I structure in the turnover state exhibited two DQ molecules in the N2-proximal and distal positions of the quinone-binding channel (29). In the two quinone-bound states, the reduced N2-proximal quinone would have difficulty exiting the original entrance due to blockage of the N2-distal quinone.
For the efficient turnover of the complex I reaction, the reduced N2-proximal quinone may use the q-ND3 channel in the electron transfer reaction instead of exiting back to the original entrance. The q-ND3 channel exits toward the intercomplex space where a quinone substrate pool (q-pool) may form. The exit was observed to be close to the membrane so that the exiting quinone tail can be easily inserted into the membrane (Fig. 6C, D). The quinone-binding site of complex III faces an intercomplex space and can readily receive reduced quinone. The protruding N-terminal region of the complex III SU7/UQCRB subunit (Fig. 3A, C) may also play a role in guiding the exiting quinone to the complex III quinone-binding site.
The formation of the q-ND3 channel by coordinated conformational switch in the residues of the His-, ND1, and ND3 loops suggests that the function of complex I likely involves alternation between class A and B structures. The class A structure binds oxidized quinone, whereas the class B structure provides an exit channel for reduced quinone. Thus, both class A and B structures represent two active forms that are involved in the electron transfer activities of complex I.
To analyze the correlations between supercomplex states and complex I classes, we counted class A/B complex I particles in each supercomplex state (Supplementary Table S5). The analysis revealed that there were significant amounts of both class A and B complex I in all supercomplex states, and it is likely that all three supercomplex states mediate electron transfer reactions involving alternations of classes A and B.
The A/B ratio was found to be higher in state 2 than in states 1 and 3, suggesting that state 2 is more favored for class A. This is either because state 2 is the most stable, or because state 2 is the favored state for quinone binding and other states are more favored for the reduced quinone transfer from complex I to complex III. Because states 1–3 are expected to have different electron transfer efficiencies and quinone equilibration rates (see Quinone transfer paths), cells may choose an appropriate supercomplex state depending on their conditions.
Further structural studies with defined activity states at higher resolutions are necessary to identify the quinone transfer pathways and coordinated conformational switches among supercomplex states. There are complex I populations that do not belong to either of the A and B classes (represented as “others” in Supplementary Table S5). These particles may represent complex I states that are further destabilized, forming true deactive states.
Quinone transfer paths
Different intercomplex assemblies in supercomplex states 1–3 and the novel q-ND3 channel provide information on potential paths for quinone transfer (Fig. 7). The distances between the quinone-acceptance site of complex III [the stigmatellin site (59), CIII_Qo] and quinone exit sites [both the conventional quinone entrance/exit site (CI_Qce) and the novel quinone exit site in the q-ND3 channel (CI_Qne) of complex I] were shorter in state 1 than in state 2 (Fig. 7A, B), indicating that the state 1 supercomplex is more efficient for quinone transfer between complexes I and III than that in the state 2. Thus, different supercomplex states may be suitable for different purposes in electron transfer reactions. For example, state 1, which has short quinone-transfer paths and a narrow substrate pool, is favored for efficient quinone transfer.
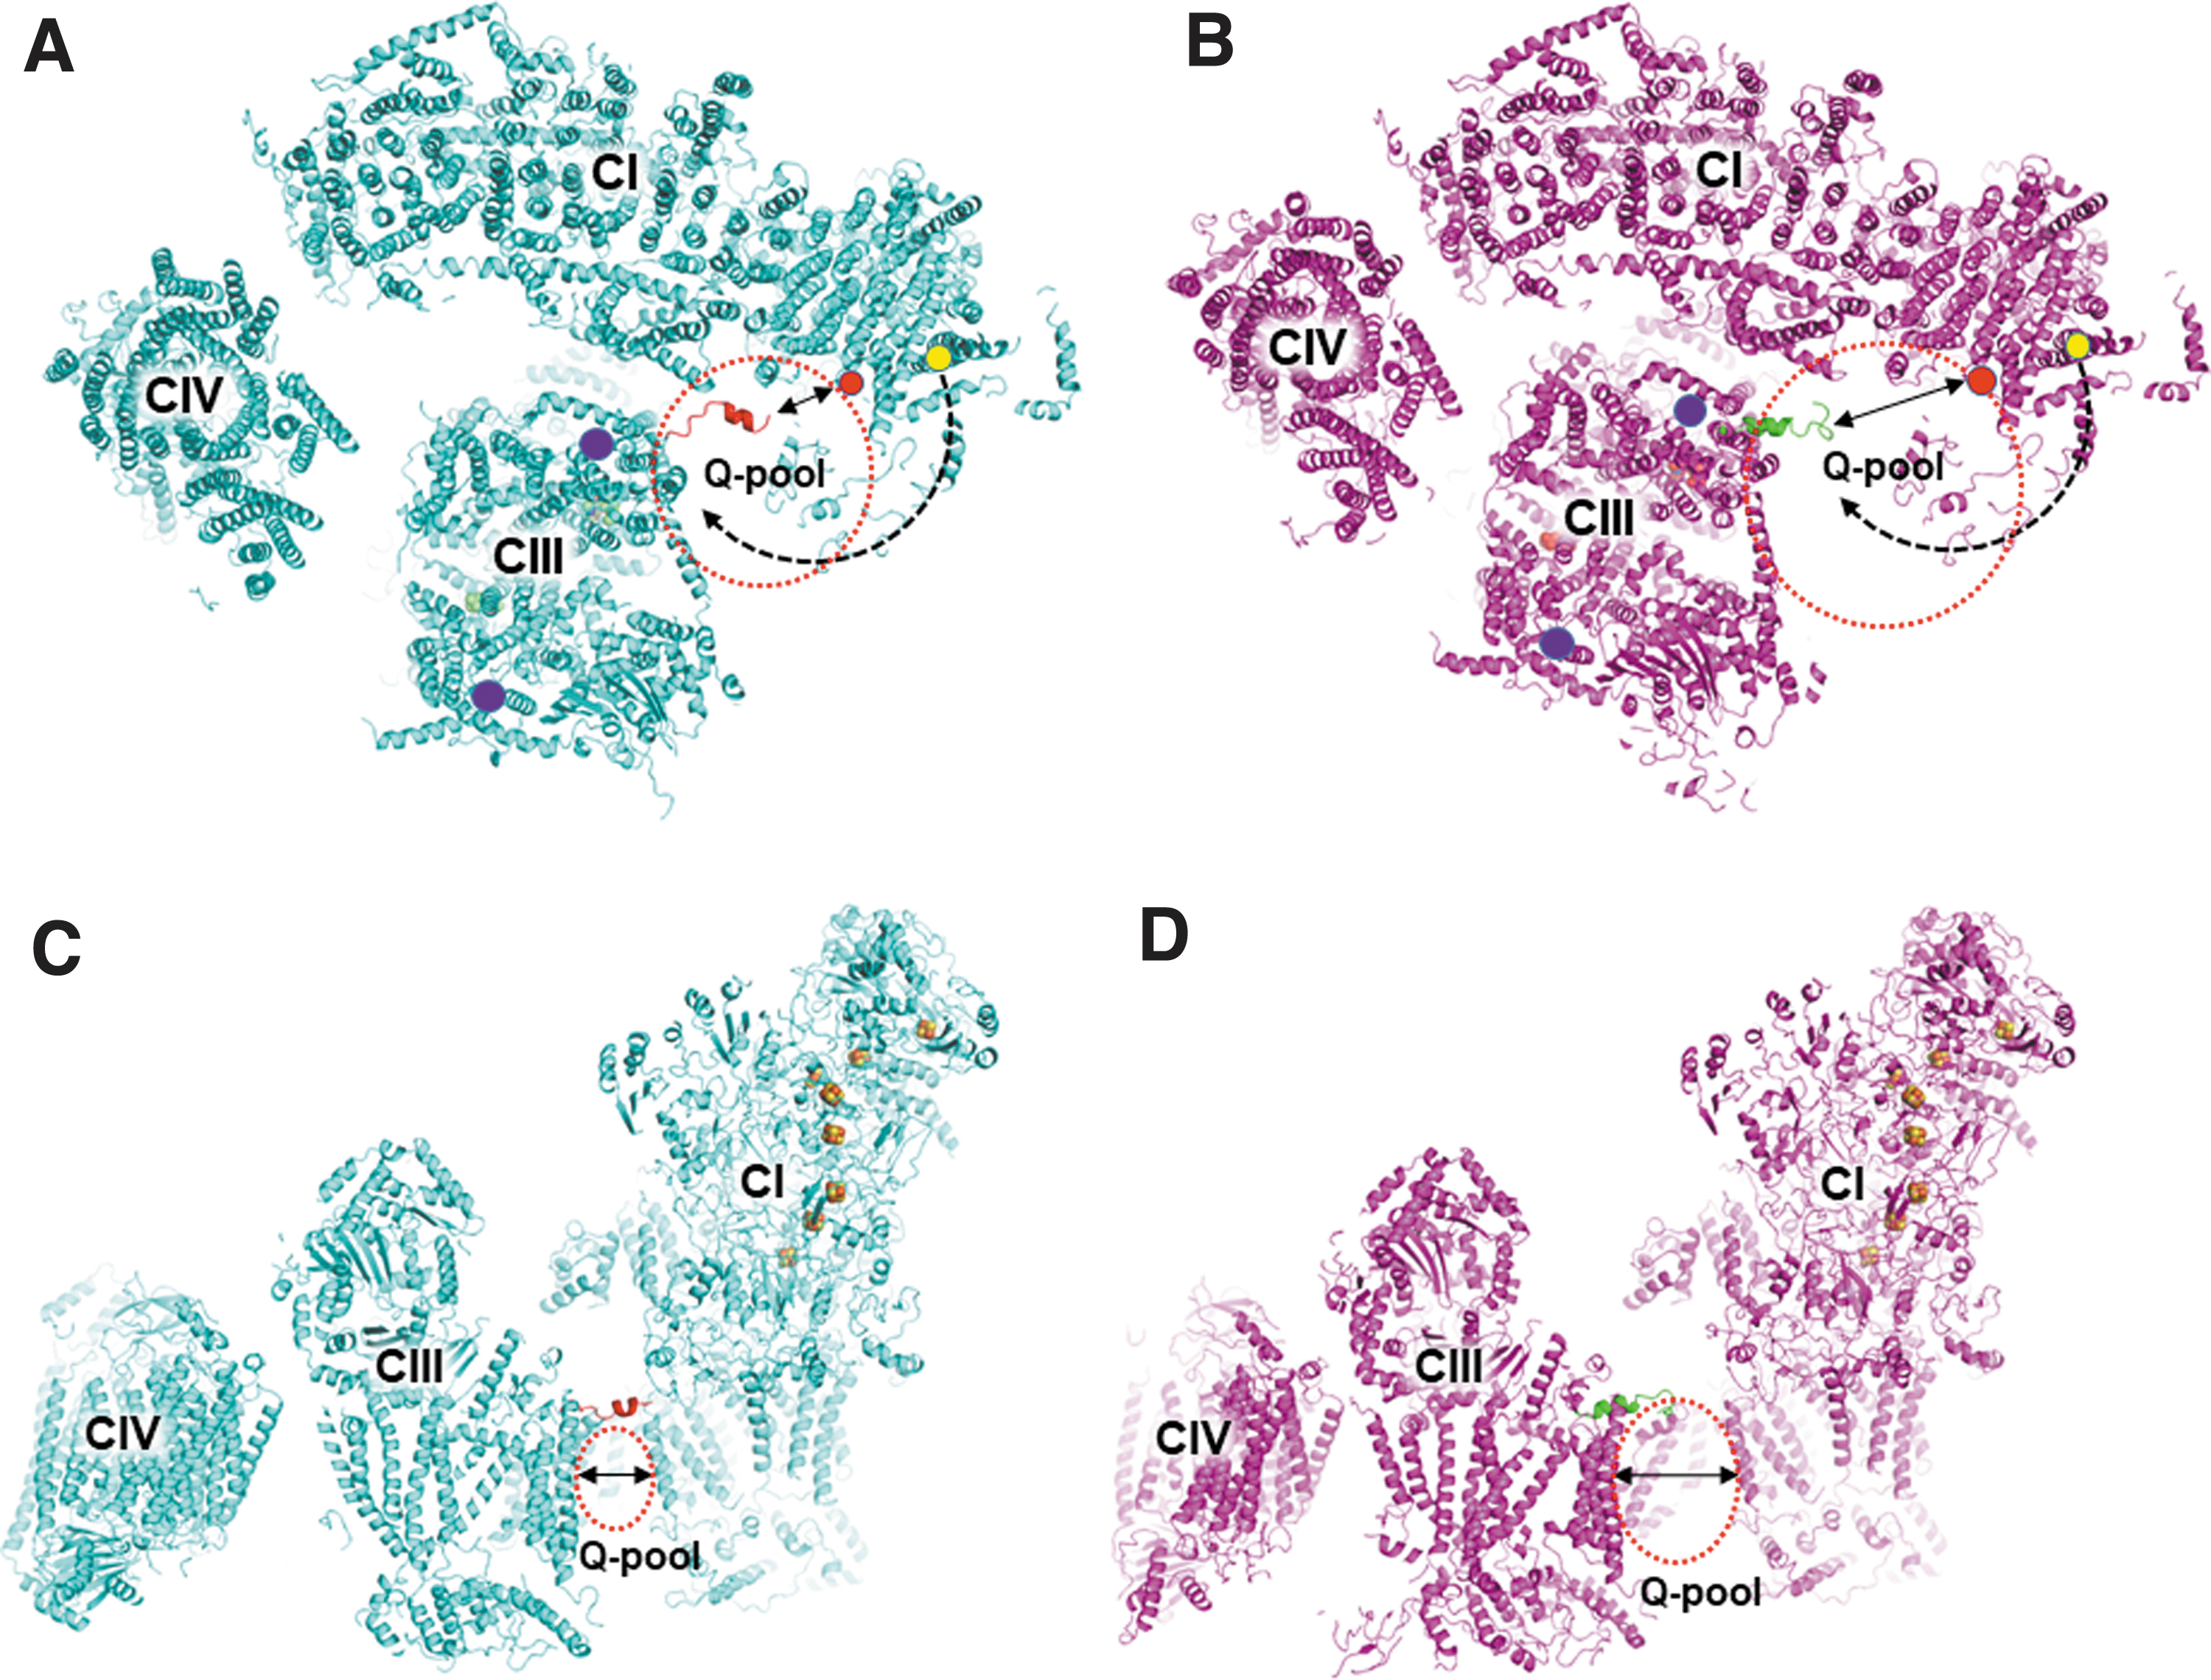
In comparison, state 2 with long quinone-transfer paths and a wide substrate pool (Fig. 7B, D) may be suited for more efficient equilibration of substrates between the intercomplex space and the outside region of the supercomplex assembly. A study reported that reduced quinones were consumed outside the supercomplex assembly (19), suggesting that reduced quinones exit toward the outside region of the supercomplex using the same channel as the quinone entrance (CI_Qce).
Although the novel internal quinone exit (CI_Qne) suggests an internal (intercomplex) substrate pool, the novel quinone exit is also consistent with the experimental results by Fedor and Hirst (19) because reduced quinones exiting from the CI_Qne site can diffuse to the outside region of the supercomplex assembly. The N-terminal region of the complex III SU7 subunit in state 1 protrudes toward the CI_Qne site (Fig. 7A, C), suggesting a role for this region in transferring reduced quinones from the CI_Qne site to the CIII_Qo site.
The conventional quinone transfer path proceeds via the lipid milieu outside the supercomplex assembly because the exit is open to the outside region, which dilutes the reduced quinone concentration, leading to a reduced efficiency of quinone transfer (Fig. 7A, B). However, the direct transfer of reduced quinones from CI_Qne to CIII_Qo greatly enhances the transfer efficiency.
Because supercomplex states 1–3 are expected to exhibit differences in electron transfer efficiency and substrate pool formation, it is likely that each state is more favored than others depending on cellular states and regulators. For example, the mitochondrial deacetylase Sirt3 was found to directly bind the complex-I 39-kDa subunit, and enhance NADH consumption and ATP generation (4). The complex-I 39-kDa subunit interacts with the complex-III SU2 subunit (Fig. 3E and Supplementary Table S3). The Sirt3-mediated deacetylation of the 39-kDa subunit may favor a specific interaction with the SU2 subunit occurring in state 1, resulting in more efficient electron transfer from complex I to complex III. In the human megacomplex structure (23), complex II was modeled into the space between complexes I and IV.
The interspace between complexes I and IV was significantly different in different supercomplex states (Supplementary Fig. S11), indicating that complex II binding to megacomplex is likely dependent on supercomplex states. In state 1, complex II fitted well into the interspace, forming a stable holomegacomplex, whereas in state 2 there was a large gap between complex II and complex I (Supplementary Fig. S11B, C), suggesting the formation of a less stable holomegacomplex. It has been observed that supercomplex contents in mitochondrial inner membrane vary depending on metabolic states (26). When cells require maximum yields of ATP generation or reverse electron transfer (40), complex II binding to the supercomplex state 1 may stabilize the holomegacomplex.
The holomegacomplex formation seals the interior Q-pool, and blocks the exchange of reduced quinones inside and outside of the holomegacomplex. In this case, the novel q-ND3 channel of complex I and CI_Qne play an essential role in the electron transfer from complex I to complex III because the reduced quinones from CI_Qce cannot enter the intercomplex substrate pool. The sealed interior Q-pool accelerates the electron transfer by minimizing the diffusion of reduced quinones to the lipid milieu outside the holomegacomplex boundary.
Conclusion
Our results show potential mechanism for substrate channeling in respiratory supercomplex through a dynamic substrate pool and novel internal channel. The formation of supercomplexes increases metabolic flux and decreases the generation of reactive oxygen species, indicating efficient substrate channeling in the supercomplex state (8, 11, 36, 39). However, the structural mechanism of substrate channeling had not been described yet. Previous supercomplex structures showed that the transmembrane regions of complexes I and III make direct contacts exhibiting hydrophobic and hydrophilic interactions (22, 42, 58), and the arrangement of individual complexes in the supercomplex association appeared relatively rigid.
In addition, the conventional quinone entrance/exit site in complex I was located far away from the quinone-acceptance sites of complex III, indicating that there was no substrate channeling (26, 43). Thus, active roles of supercomplex formation in electron transfer catalysis were in question (26). Our cryo-EM study of a lipid-preserved bovine respiratory supercomplex I1III2IV1 (LP-supercomplex) provides structural indication for substrate channeling, which was proposed in previous biochemical and physiological studies. A dynamic substrate pool found in the LP-supercomplex indicates the regulation of substrate channeling depending on the cellular state.
In state 1, the quinone transfer path was shortened due to the narrowed substrate pool, thus facilitating quinone transfer and internal exchange between oxidized and reduced quinones, whereas states 2 and 3 showed wide-open substrate pools that can facilitate the equilibration of quinones of the intercomplex substrate pool with those of the outside region of the supercomplex assembly. The novel internal channel found in the focus-refined complex I of the LP-supercomplex reveals how reduced quinone could be seamlessly transferred to the intercomplex substrate pool without diffusion to the lipid milieu outside the supercomplex. In a model of holomegacomplex consisting of the state 1 supercomplex and complex II, the internal substrate pool is sealed off, and the role of the novel internal channel would be essential for quinone transfer.
The novel channel is formed only in the class B (open) form of complex I due to structural switches caused by quinone reduction. These observations indicate that the active function of complex I involves alternation between classes A (closed) and B (open) form structures for oxidized quinone binding and reduced quinone transfer, respectively. Given the structural indication for substrate channeling by supercomplex formation, which is consistent with previous biochemical and physiological expectations, it would be interesting to perform further analysis on the active roles of supercomplexes in cells and worth exploiting therapeutic means for facilitating supercomplex formation in vivo to control metabolic and reactive oxygen species-related diseases.
Materials and Methods
Purification of supercomplex I1III2IV1 from bovine heart mitochondria
Mitochondria were purified from fresh bovine heart through homogenization and fractional centrifugation. In brief, freshly dissected bovine heart (100 g) was cut into small sections. One hundred fifty milliliters of buffer A (10 mM Tris-Cl pH 7.8, 0.25 M sucrose, and 0.2 mM EDTA) was added to the tissue sections. The tissues were homogenized at 4°C by an Ultra-turrax blender in 30 s bursts and 30 s rests until there were no chunks left.
The pH was adjusted to 7.8 with 1.0 M Tris base during homogenization. The homogenate was centrifuged at 1000 g for 10 min at 4°C. The supernatant was filtered and centrifuged again at 1000 g for 15 min at 4°C. Then, the resulting supernatant was collected and centrifuged at 12,000 g for 15 min at 4°C, and the pellet was collected. The collected pellet was washed in four volumes of buffer A supplemented with a protease inhibitor cocktail. After repeating the wash step twice, the pellet was resuspended in a 50 mL of buffer A supplemented with a protease inhibitor cocktail.
The purified mitochondria were solubilized with 1% (w/v) digitonin (Sigma Aldrich) at a detergent-to-protein ratio of 28:1 (w/w). After 45 min incubation with gentle agitation at 4°C, the solubilized mitochondrial membrane proteins were concentrated to 2 mg/mL with an Amicon Stirred Cell (Millipore) using a 100 kDa cutoff ultrafiltration disk (Millipore). The total digitonin-exposure time was kept within 1 h. The concentrated sample was immediately subjected to a detergent exchange to amphipol. For the detergent exchange, 0.2% amphipol A8–35 (Anatrace) and 2% γ-cyclodextrin (Sigma Aldrich) were added to the sample with gentle mixing, and the mixture was incubated for 45 min on ice.
After the incubation, precipitates were removed by centrifugation at 21,500 g for 10 min at 4°C. Then, 2.0 mL of the supernatant containing mitochondrial membrane proteins (1.0 mg/mL) was loaded onto 0.3–1.2 M sucrose gradient in a buffer containing 15 mM HEPES pH 7.7 and 10 mM KCl, and centrifuged at 150,000 g for 21 h at 4°C using a SW32i rotor (Beckman). Gradients were fractionated and analyzed by 3–12% BN-PAGE (Invitrogen). To remove sucrose, the fractions of supercomplex I1III2IV1 were diluted 25 times in a buffer containing 15 mM HEPES pH 7.7, 10 mM KCl, and 0.02% amphipol A8-35, and then were concentrated to 0.1 mg/mL for electron microscopy analysis.
Negative-stain transmission electron microscopy
A 2.0 μL drop of supercomplex I1III2IV1 (0.1 mg/mL) was applied to a glow-discharged carbon-coated 400 mesh copper grid. After staining the grid with 0.75% uranyl formate solution (Electron Microscopy Science), images were acquired using a Tecnai T12 Bio-TWIN transmission electron microscope equipped with an FEI Eagle 4 K by 4 K CCD camera, operating at 120 kV.
Specimen preparation and cryoelectron microscopy data acquisition
A 3.0 μL drop of 0.2 mg/mL graphene oxide solution (Sigma Aldrich) was applied to the glow-discharged side of Quantifoil (R 1.2/1.3, 400 mesh holey-carbon grid, Quantifoil Micro Tools) and incubated for 1 min. After blotting the graphene oxide solution with filter paper and subsequent washing three times with distilled water (twice on the graphene side and once on the reverse side), the grid was air dried for 5 min. Subsequently, 2 μL of supercomplex I1III2IV1 (0.1 mg/mL) was loaded onto the graphene-overlaid grids. Grids were blotted for 2 s and plunge-frozen in liquid ethane using Vitrobot Mark IV (FEI) operated at 4°C and 95% humidity.
Cryoelectron microscopy images were collected using a Titan Krios microscope (FEI) operated at a voltage of 300 kV with a Falcon II direct electron detector (FEI). Automated data acquisition was performed using the EPU package (FEI) at a nominal magnification of 47,000 × (pixel size of 1.3973 Å) and a dose rate of 35 electrons per pixel per second. Each image was exposed for a total of 1.8 s and dose fractionated into 30 movie frames. A defocus range from −1.2 to −2.0 μm was used.
Image processing and statistical analysis
A set of 9,228 micrographs was collected. Motion correction at the micrograph level and the estimation of contrast transfer function (CTF) parameters were performed using the programs MotionCor2 (60) and CTFFIND4 (49), respectively. Particle picking, 2D and 3D classification, and refinement were performed with the program RELION 2.1 (34).
References for template-based particle autopicking were obtained from 2D class averages that were calculated from a manually picked subset of the micrographs (4112 particles, 280 × 280 pixels). The initial dataset containing ∼1300 K particles (280 × 280 pixels) were subjected to reference-free 2D classification to discard false positives from the autopicking. The selected 900 K particles were then submitted to subsequent 3D classification with 60 Å low-pass filtered map of bovine respirasome (PDB code: 2YBB) (6) as an initial reference.
A set of relatively homogeneous 225 K particles was subjected to the final 3D autorefinement, resulting in an overall structure of supercomplex I1III2IV1 at a resolution of 4.2 Å. The 225 K particles were further classified into six subsets by 3D classification, revealing four different conformations of supercomplex I1III2IV1 (defined as states 1–4) and one supercomplex I1III2. Four different classes of supercomplex I1III2IV1 contained 48,729 (state 1), 57,806 (state 2), 24,810 (state 3), and 11,651 (state 4) particles. The overall resolutions of the four states after 3D autorefinement were 5.0 Å (state 1), 4.6 Å (state 2), 7.8 Å (state 3), and 8.3 Å (state 4).
We further improved the resolution of both complexes I and III by soft-mask–based subregion 3D classification and 3D autorefinement (50). The threshold was set to 0.02, and the initial binary mask was extended by three pixels in all directions and was further extended with a soft edge of the three-pixel width. The modified soft masks for complexes I and III were applied to the particle images in 3D autorefinement process, leading to resolutions of 3.8 and 3.9 Å for complexes I and III, respectively.
Three-dimensional classification of complex I after applying soft masks revealed two different classes of complex I. Both classes were subjected to the 3D autorefinement, resulting in a resolution of 3.8 and 4.2 Å for classes A and B of complex I, respectively. All resolutions are based on the gold standard (two halves of data refined independently) Fourier shell correlation (FSC) = 0.143 criterion (13), and the masked FSC curves were corrected for the effect of a soft mask using high-resolution noise substitution. Temperature-factor estimation and map sharpening were also performed by postprocessing in the program RELION 2.1 (34) using an automated procedure.
Model building and refinement
Manual model building was performed by the program COOT (18) using Ramachandran restraints and real-space refinement after docking the previous bovine complex I (PDB code: 5LDW) (61) structure and the bovine complex III (PDB code: 1BGY) (27) structure into the subregion-refined density maps of complexes I (3.8 Å) and III (3.9 Å), respectively. The resulting models were transferred to density maps of different states of supercomplex I1III2IV1. The models for complexes I and III were further improved by iterative manual adjustments using the program COOT and real-space refinement in the program PHENIX (1).
For complex IV, we directly docked the crystal structure of the complex IV monomer (PDB code: 1OCC) (56) into the density maps of supercomplex I1III2IV1; however, could not further optimize this model due to limited resolution of the density map for complex IV. The final models were subjected to the program RAMPAGE for structure validation (44).
For the subclass refinement of the two classes of complex I, initial model (PDB 5LDW) was subjected to the 3D-classified maps of complex I (3.8 Å and 4.2 Å for classes A and B forms, respectively). These maps and models were initially rigid-body fitted into the cryo-EM map using the “fit in map” function in the program UCSF Chimera, which can be used to facilitate manual fitting (5). The initial rigid-body refinement was performed manually in the program COOT (18) through repetitive model fixation rounds due to the difference in the angle formed by the membrane and matrix arms.
In this step, the transition of the Cα backbone was arranged in the correct position using bulky amino acids such as Phe, Tyr, and Trp as indicators. After several rounds of rigid-body refinement, the models were refined with the “phenix.real_space_refine” program in the program PHENIX (2) for five macrocycles with a resolution cutoff of 3.8 Å (class A) and 4.2 Å (class B). The models were manually fitted using the program COOT (18). Map and model validations were performed using the program PHENIX (2) with refined models, full maps, and half maps of each class of complex I. The FSC curve for the combined map versus of the refined models showed that the models matched the maps well (FSC = 0.5 at 4.0 and 4.5 Å for classes A and B of complex I, respectively).
Activity assay
Supercomplex samples using the AE (see above Methods section) and digitonin (D) methods were prepared in parallel. In the digitonin method, the initial digitonin-solubilized mitochondrial proteins were subjected to sucrose gradient purification without AE. The sucrose gradient buffer used for the digitonin method included 0.2% digitonin. For the preparation of the LAE sample, the digitonin sample (D) was detergent exchanged with amphipol after sucrose gradient purification. The concentration of each purified supercomplex was measured using the Bradford assay method (12). The activity assay was performed according to previously reported protocols (53) with slight modifications.
In brief, 1.0 mL of the reaction buffer (100 mM potassium phosphate pH 8.0) containing 150 μM NADH was loaded onto a UV/VIS spectrophotometer cuvette (Optizen POP, Mecasys), and 10 μL of 200 μM cytochrome C was added to the cuvette before absorbance was measured at 340 nm for 10 min to establish the baseline of NADH absorbance. After baseline establishment, 9.0 μg of the supercomplex was added to the cuvette, and absorbance was measured for 10 min. The 10 min absorbance measurements were repeated with the addition of (1) sodium azide (complex IV inhibitor) to a final concentration of 20 mM, (2) coenzyme Q1 to a final concentration of 50 μM, and (3) piercidin A (complex I inhibitor) to a final concentration of 20 μM.
For assaying the supercomplex activity with an external phospholipid addition, 0.25 mg/mL of the dioleoylphosphatidylcholine (Avanti Polar Lipids) and bovine heart cardiolipin (Sigma Aldrich) 4:1 mixture was added to the initial reaction buffer (1.0 mL of 100 mM potassium phosphate pH 8.0) containing 150 μM NADH. To the mixture, 9.0 μg of the supercomplex was added, and the resulting mixture was mixed thoroughly to allow integration of the lipids into the supercomplex.
The supercomplex sample was added in the first step to allow enough time for lipid integration. The mixed sample was placed in the cuvette, and absorbance was measured at 340 nm for 10 min to establish the baseline of NADH absorbance. After baseline establishment, 10 μL of 200 μM cytochrome C was added to the cuvette and absorbance was measured for 10 min. Next, sodium azide (complex IV inhibitor) to a final concentration of 20 mM was added to the cuvette, and absorbance was measured for 10 min.
Phospholipid quantitation
The supercomplex samples (the AE and LAE samples) used for phospholipid quantification were prepared in parallel as in the activity assay. Total phospholipid amounts in supercomplex samples were quantified using the amidol method (53).
In brief, 214 μL of perchloric acid was mixed with 136 μL of 16.5 μg supercomplex proteins or 136 μL of standard solutions each containing 2, 5, 10, 15, and 20 nmol of K2HPO4. The mixture was incubated at 155°C with a glass marble on the lid for vapor condensation for 6 h, which resulted in a transparent solution. Once the solution was cooled to room temperature (∼25°C), 1.2 mL of 0.22% ammonium molybdate was added to the mixture, followed by the addition of 50 μL of 1% amidol in 20% sodium bisulfate. The mixture was then heated to 100°C for 12 min. Subsequently, the solution absorbance at 830 nm was determined. K2HPO4 served as the standard for determining the amount of phosphorous in the solution. The amount of phosphorous was translated to moles of phospholipids per mole of supercomplex.
Quinone quantitation
The supercomplex (2.12 μg) in 20 μL buffer (15 mM HEPES pH 7.7, 10 mM KCl, and 0.02% amphipol for the AE sample or 0.1% digitonin for the D sample) was mixed with 40 μL of 1-propanol. The mixture was vortexed thoroughly and centrifuged at 21,500 g for 10 min at 4°C. The supernatant was collected and outsourced to NICEM for mass spectrometry analysis. Oxidized Q10 was used as an external standard. Oxidized Q10 powder was dissolved in hexane to a concentration of 0.5 g/L. The oxidized Q10 solution was diluted in 1-propanol to a final concentration of 1 μM and was used to prepare the calibration curve.
Quantitation of oxidized Q10 was performed as described by Claessens et al. (15). A Thermo™ TSQ Altis™ mass spectrometer coupled to a Thermo™ Vanquish™ UHPLC and a Thermo Scientific™ Accucore™ C18 (2.1 × 50 mm, 2.6 μm) column was used in the selected reaction monitoring analysis. An atmospheric pressure chemical ionization source with a positive ion electrospray mode was used. The mass transition of m/z 863.8 → 197.2 for oxidized Q10 was recorded.
Channel calculation
To estimate the internal quinone channels, we used the program BetaCavityWeb (33), which recognizes molecular channels and calculates their geometric properties such as volume and surface area. The program uses the Voronoi diagram of atoms where atoms of different types are associated with different van der Waals radii, providing accurate and efficient spatial proximity information among molecular atoms (30) compared with other popular programs that model each atom with one or more same-sized spherical balls. We used the default parameters of the program except for the probe radius of 2.3 Å, which reflected the size of the ring structure of the quinone head, for both classes A and B structures. Unlike other programs, BetaCavityWeb does not require a starting point for a channel and efficiently identifies all potential channels correctly.
The BetaCavityWeb program ranks channels by measuring how deeply each channel is buried throughout the complex I structure. The channel depth is defined as the average of the depths of all atoms that contribute to the channel boundary. The depth of an atom corresponds to the number of shells that are removed from the structure through an onion-peeling-like process until the atom is encountered. The onion-peeling process is applied after the compact and efficient beta-complex of the structure is created by reflecting an appropriate probe radius (2.3 Å) (31, 32). Recognized channels were visualized using PyMOL (version 2.4.1, Schrödinger, LLC) by importing the script files produced by BetaCavityWeb and superimposed onto the input structure.
Electronic Notebook
Electronic laboratory notebook was not used.
Data Availability
The coordinates for the supercomplex states 1–4, and the complex I class A (closed) and class B (open) forms have been deposited in the Protein Date Bank under the accession codes 7DGQ, 7DGR, 7DGS, 7DKF, 7DGZ, and 7DH0, respectively. The corresponding electron density maps have been deposited in the Electron Microscopy Data Bank (EMDB) under the accession codes EMD-30673, EMD-30674, EMD-30675, EMD-30706, EMD-30676, and EMD-30677, respectively.
Footnotes
Acknowledgments
We thank the staff of the cryo-EM facility at KBSI and Doo-Hee Lee at NICEM for cryo-EM data collection and mass spectrometry analysis, respectively. We also thank Global Science experimental Data hub Center (GSDC) at Korea Institute of Science and Technology Information (KISTI) for computing resources and technical support.
Authors' Contribution
T.J.J. and S.E.R. conceived these experiments. T.J.J. and S.E.R. prepared supercomplex samples for cryoelectron microscopy. T.J.J., S-G.L., S.H.Y., M.K., H.P., J.H., H.M.K., and S.E.R. collected and analyzed cryoelectron microscopy data. T.J.J., S.H.Y., D.S., and S.E.R. performed the activity analysis and phospholipid quantitation of supercomplexes. T.J.J., J.H.R., D.S.K., and S.E.R. performed the quinone channel estimation. T.J.J., H.M.K., and S.E.R. wrote the article.
Funding Information
This work was funded by the Hanyang University internal grant to S.E.R., the biomedical technology development project, National Research Foundation, Korea [NRF-2015M3A9B5030302 and 2021M3A9G8024747 to S.E.R. and 2017R1A3B1023591 to J.H.R. and D.S.K.], and the Institute for Basic Science (IBS) [IBS-R030-C1 to H.M.K. and S-G.L.].
Author Disclosure Statement
No competing financial interests exist.
Supplementary Material
Supplementary Figure S1
Supplementary Figure S2
Supplementary Figure S3
Supplementary Figure S4
Supplementary Figure S5
Supplementary Figure S6
Supplementary Figure S7
Supplementary Figure S8
Supplementary Figure S9
Supplementary Figure S10
Supplementary Figure S11
Supplementary Table S1
Supplementary Table S2
Supplementary Table S3
Supplementary Table S4
Supplementary Table S5
Abbreviations Used
References
Supplementary Material
Please find the following supplemental material available below.
For Open Access articles published under a Creative Commons License, all supplemental material carries the same license as the article it is associated with.
For non-Open Access articles published, all supplemental material carries a non-exclusive license, and permission requests for re-use of supplemental material or any part of supplemental material shall be sent directly to the copyright owner as specified in the copyright notice associated with the article.
