




Abstract
Aims:
During calcific aortic valve stenosis (CAVS) progression, oxidative stress and endothelial dysfunction mark the initial pathogenic steps with a parallel dysregulation of the antioxidant systems. Here, we tested whether oxidation-induced protein S-glutathionylation (P-SSG) accounts for a phenotypic switch in human aortic valvular tissue, eventually leading to calcium deposition. Next, we tested whether countering this reactive oxygen species (ROS) surge would prevent these perturbations.
Results:
We employed state-of-the-art technologies, such as electron paramagnetic resonance (EPR), liquid chromatography-tandem mass spectrometry, imaging flow-cytometry, and live-cell imaging on human excised aortic valves and primary valve endothelial cells (VECs). We observed that a net rise in EPR-detected ROS emission marked the transition from fibrotic to calcific in human CAVS specimens, coupled to a progressive increment in P-SSG deposition. In human VECs (hVECs), treatment with 2-acetylamino-3-[4-(2-acetylamino-2-carboxyethylsulfanylthiocarbonylamino)phenylthiocarbamoylsulfanyl]propionic acid triggered highly oxidizing conditions prompting P-SSG accumulation, damaging mitochondria, and inducing endothelial nitric oxide synthase uncoupling. All the events conjured up in morphing these cells from their native endothelial phenotype into a damaged calcification-inducing one. As proof of principle, the use of the antioxidant N-acetyl-L-cysteine prevented these alterations.
Innovation:
Borne as a compensatory system to face excessive oxidative burden, with time, P-SSG contributes to the morphing of hVECs from their innate phenotype into a damaged one, paving the way to calcium deposition.
Conclusion:
Our data suggest that, in the human aortic valve, unremitted ROS emission along with a P-SSG build-up occurs and accounts, at least in part, for the morphological/functional changes leading to CAVS. Antioxid. Redox Signal. 37, 1051–1071.
Innovation
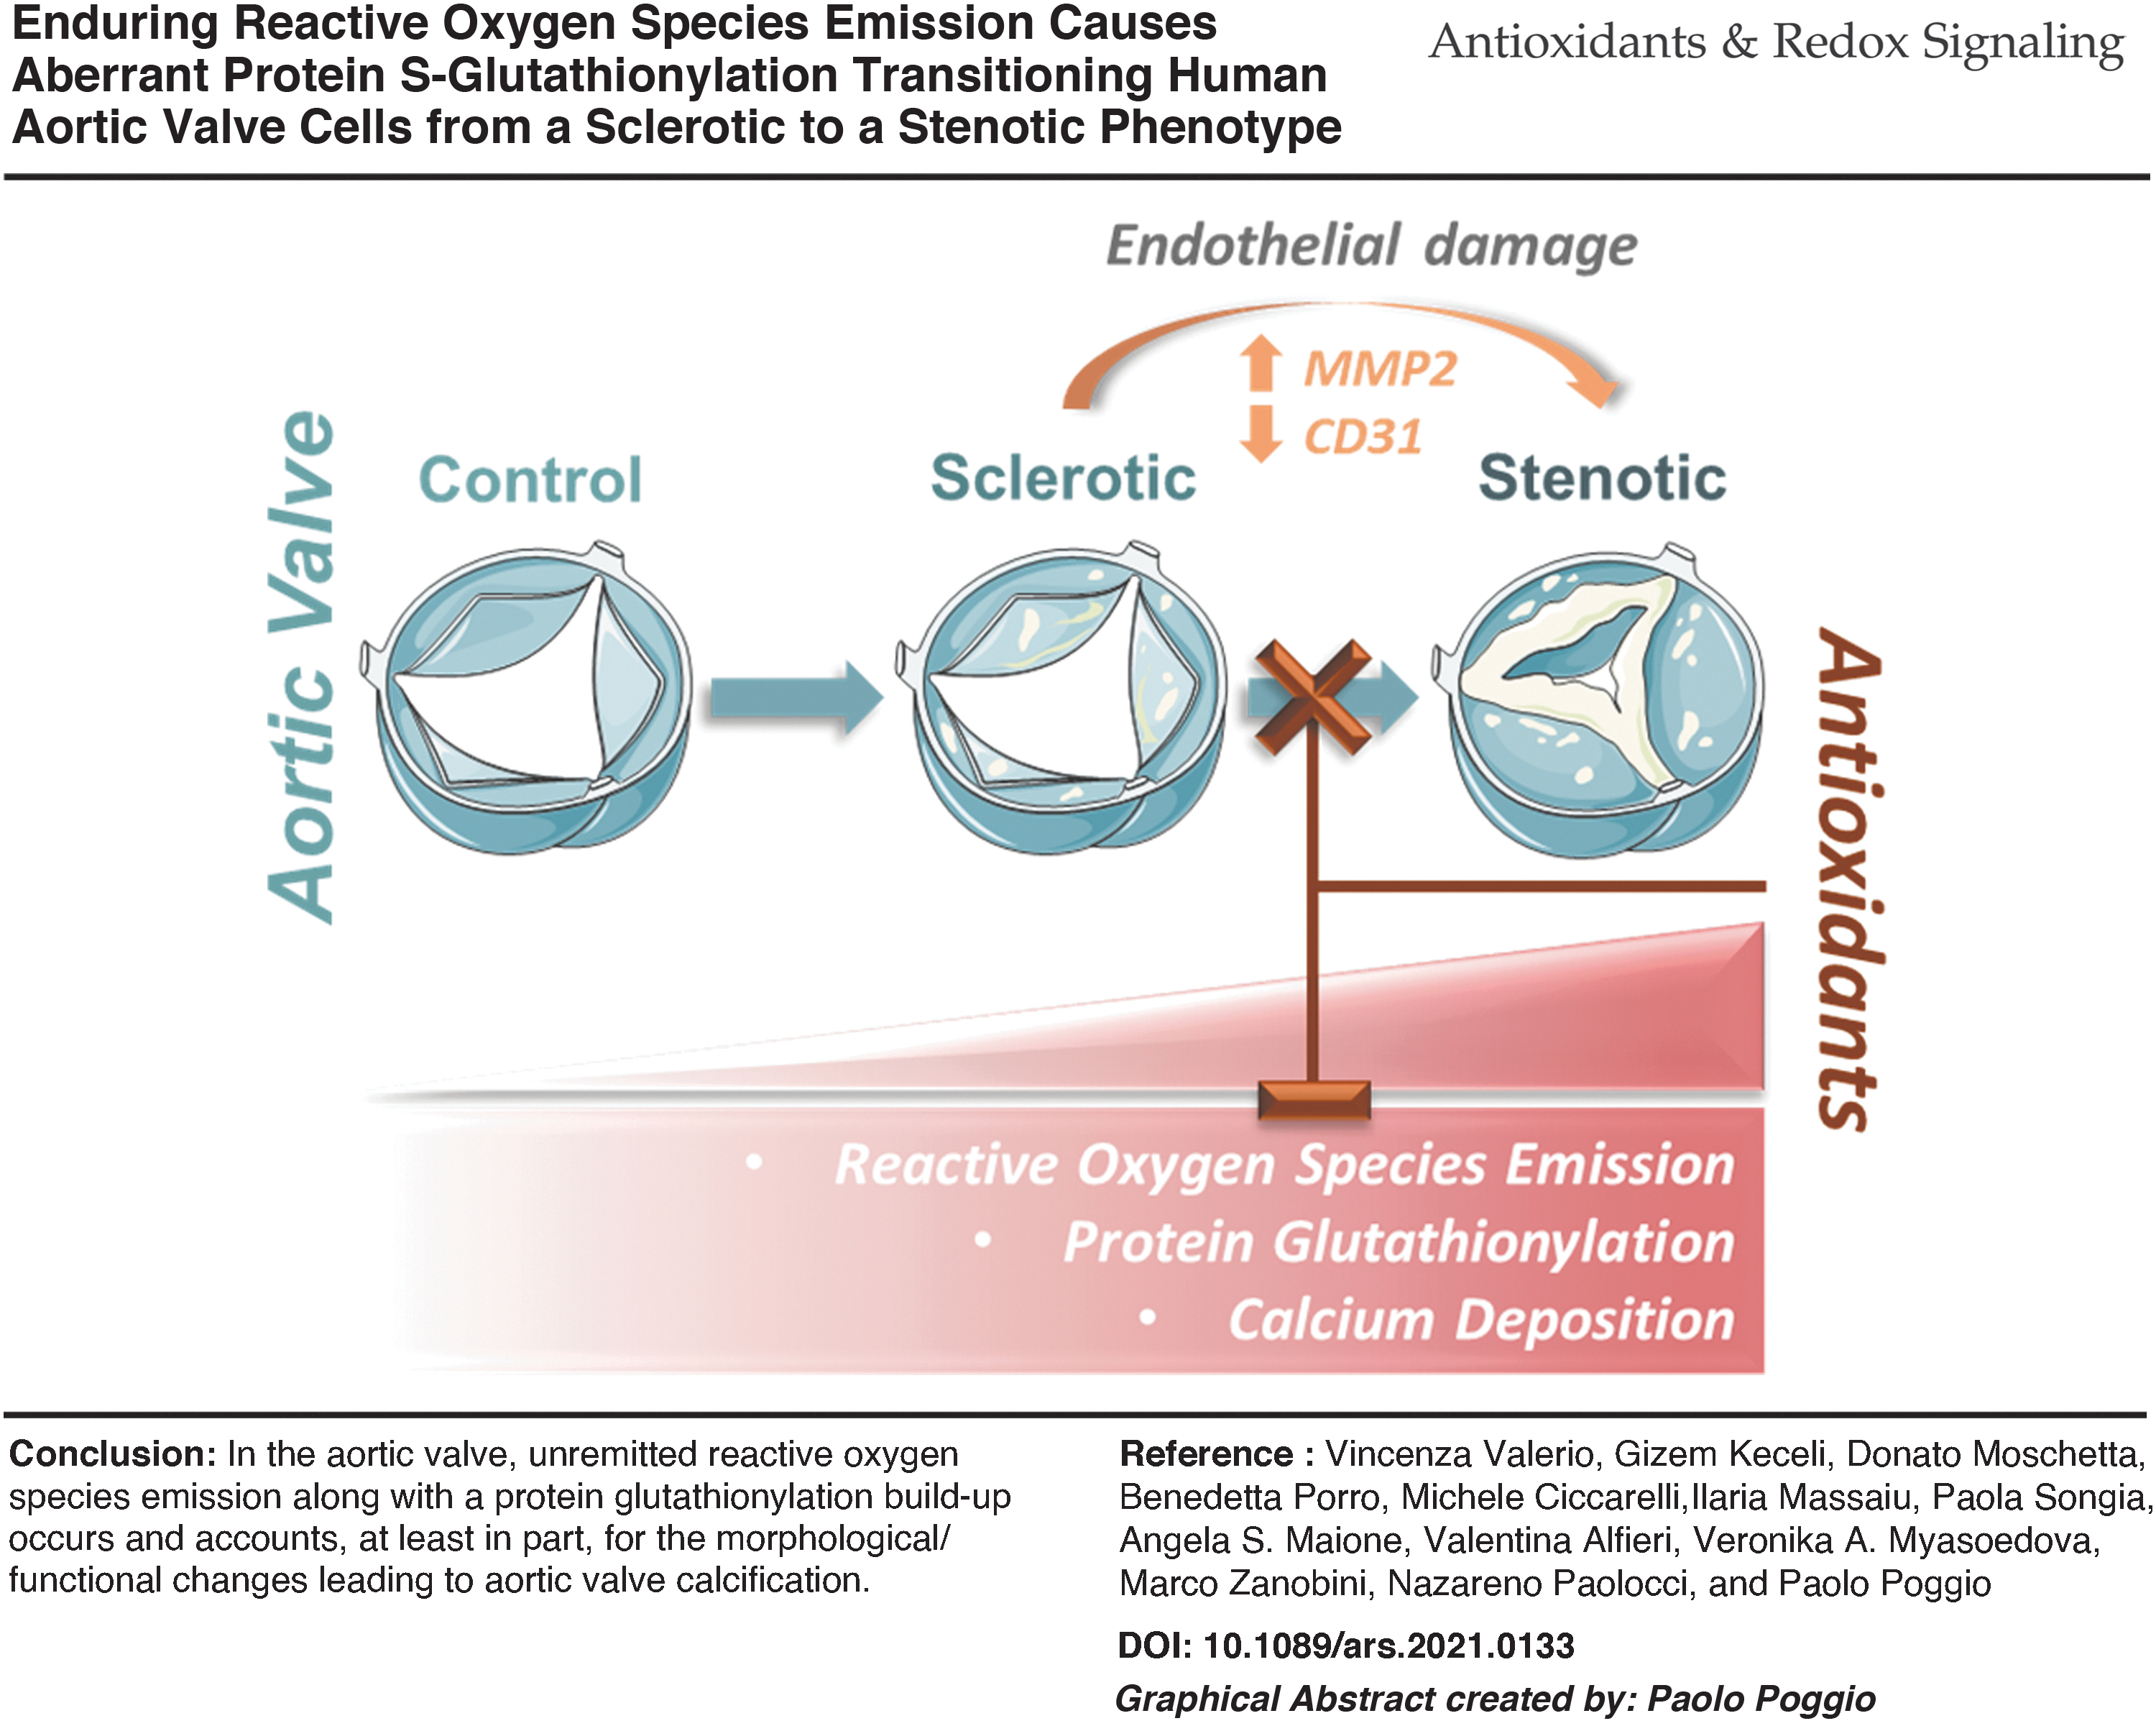
Calcific aortic valve stenosis remains a challenging clinical condition and factor accounting for the valve leaflets' progressive remodeling, from fibrotic to calcific, elusive. Our study demonstrates that unremitted reactive oxygen species (ROS) emission from endothelial cells, along with a protein S-glutathionylation build-up, occurs and accounts, at least in part, for the morphological/functional changes occurring in the human aortic valves when they switch from a sclerotic to a stenotic phenotype, thus increasing the calcification chance. Our in vitro data suggest that it is possible to de-activate this mechanism, leveraging endogenous signaling or exogenous compounds that are able to counter ROS emission and MMP expression/activity.
Introduction
Calcific aortic valve stenosis (CAVS) is the most common heart valve pathological condition worldwide (1). The CAVS is age-related (45), with a prevalence of almost 3% in the general population older than 65 years (51). The disease's natural history evolves from an initial asymptomatic phase characterized by a thickening of the leaflets bearing possible micro-calcifications and a preserved left ventricle outflow tract still (24).
This condition, known as aortic valve sclerosis (AVSc), has a prevalence of about 30% in adults older than 65 years of age (26). About 10% of these cases morph into aortic stenosis (AS), displaying massive calcifications and overt hemodynamic impairment (52). The only therapeutic option available for AS patients is surgery or transcatheter aortic valve replacement (AVR) (7). Therefore, penetrating CAVS pathogenic mechanisms would pave the way to new treatment opportunities and reduce its socioeconomic burden.
The CAVS unfolding is a complex process entailing many different cell types (71). Valve interstitial cells (VICs), during CAVS progression, transdifferentiate and trigger the disruption of the extracellular matrix homeostasis, prompting calcium deposition (44). Alterations in valve endothelial cells (VEC) play a pivotal role in this process. Indeed, the endothelial dysfunction of the aortic valve leaflets is the ineludible first step of CAVS development and progression (66). Oxidative stress, stemming from an imbalance between reactive oxygen species (ROS) formation and scavenging, is one factor that chiefly accounts for this alteration (22, 32, 59).
The antioxidant armamentarium encompasses a battery of enzymatic and non-enzymatic activities tailored to maintain tissue/cell redox homeostasis (10). Among them, soluble glutathione is the primary non-enzymatic antioxidant system present in all cells' compartments, and the ratio between its reduced (GSH) and oxidized (GSSG) form typically serves to index tissue oxidative stress and redox status (3, 10).
However, when dysregulated, the glutathione system can contribute to the pathogenesis of several cardiovascular diseases, including hypertension, atherosclerosis, and aortic valve degeneration (20, 68). In the presence of highly oxidizing conditions, redox-sensitive proteins involved in many, if not all, cell functions may undergo post-translational modifications, including protein S-glutathionylation (P-SSG) (28).
This reversible modification consists of the interaction between molecules of GSH and/or GSSG with susceptible cysteine residues of proteins (55). P-SSG has been found in various structural and functional proteins, including actin (28), modifying their characteristics and functions (27). P-SSG can be part of many alterations affecting signaling mechanisms at the foundation of different cardiovascular disorders, serving as an early biomarker of pathological conditions (50). A progressive rise in the pro-oxidative milieu intervenes in the human valvular tissue during CAVS involution toward stenosis (22).
However, direct specific quantification of ROS emission from human aortic valve leaflets is lacking. At the same time, previous reports relied on the evidence that both superoxide dismutase and catalase are downregulated in CAVS (11, 43). Regardless of this, no reports have yet tested whether the ROS burden eventually varies with the disease stages, along with the possible role of P-SSG post-translational modification in the CAVS disease progression.
Therefore, we designed the present study to test three main outstanding hypotheses. First, we aim at determining whether an unremitted ROS emission from valve tissues underscores the sclerotic-to-stenotic switch in human CAVS, leading to a P-SSG build-up. Second, we tested whether this alteration, in turn, prompts endothelial damage, causing morphological/functional changes of VECs, ultimately promoting calcium deposition. Finally, we assessed whether preventing this ROS surge and P-SSG maladaptive response via an exogenous thiol compound prevents this sclerosis-to-stenosis transition and, ultimately, calcification in human VECs (hVECs).
Results
Increased ROS emission and P-SSG mark the transition from sclerosis to stenosis in human aortic valves
Oxidative stress may herald CAVS onset and progression (22). However, no data are available regarding specific quantification of ROS emission from human aortic valve leaflets at different disease stages. To fill this gap, we used an electron paramagnetic resonance (EPR) approach that is the only method for the direct detection of paramagnetic species, such as ROS (13). We employed this approach in aortic valve specimens obtained from three different patient populations, that is, control subjects and patients with aortic sclerosis or AS (see patients' enrollment description). A one-way ANOVA analysis revealed significant differences between the three groups (ANOVA p = 0.004; p-trend = 0.001).
In detail, AS samples displayed a striking rise in ROS levels over controls (91.5.1 ± 20.7 vs. 21.0 ± 4.3 arbitrary units (AU), respectively; p = 0.003; Fig. 1a–c). However, aortic sclerosis specimens (56.9 ± 12.2 AU), being an intermediate stage of CAVS, were not statistically significant from control or AS ones (p = 0.16). This evidence attests that an increment in valve ROS emission accompanies human CAVS disease progression.

Next, we interrogated whether P-SSG and deregulation of glutathione reductase (GR), one of the enzymes involved in GSH regeneration, parallel the escalation in valve ROS emission, and whether they affect aortic valve tissue biology and function. To this end, we measured P-SSG levels in whole tissue extracts that include proteins from both interstitial and endothelial valve cell types (i.e., VICs and VECs). We found significant differences between the three groups (ANOVA p = 0.02; p-trend = 0.007).
More specifically, aortic samples from AS patients displayed substantially more elevated P-SSG levels than control subjects (log2FC = +0.3 ± 0.09; p = 0.02; Fig. 1d, e). Of note, sclerotic samples did not differ from control or stenotic samples. In parallel, immunohistochemistry analysis showed no difference in the expression of GR at tissue level at different stages of pathology (Supplementary Fig. S1). This data set suggests ROS emission and P-SSG as a new possible signature of aortic valve disease progression toward stenosis.
Blocking GR boosts ROS emission and P-SSG in porcine VECs
We employed an in vitro model of aberrant aortic valve P-SSG by using porcine VECs (pVEC) to get mechanistic insights into P-SSG-induced changes in endothelial cells. To this end, we used 2-acetylamino-3-[4-(2-acetylamino-2-carboxyethylsulfanylthiocarbonylamino)phenylthiocarbamoylsulfanyl]propionic acid (2-AAPA) to disrupt cells' ability to detoxify ROS, leading to increased intracellular oxidative stress, thus enhancing P-SSG formation chance. Figure 2a and b reveals that 2-AAPA treatment significantly augmented P-SSG levels (ANOVA; p < 0.0001).
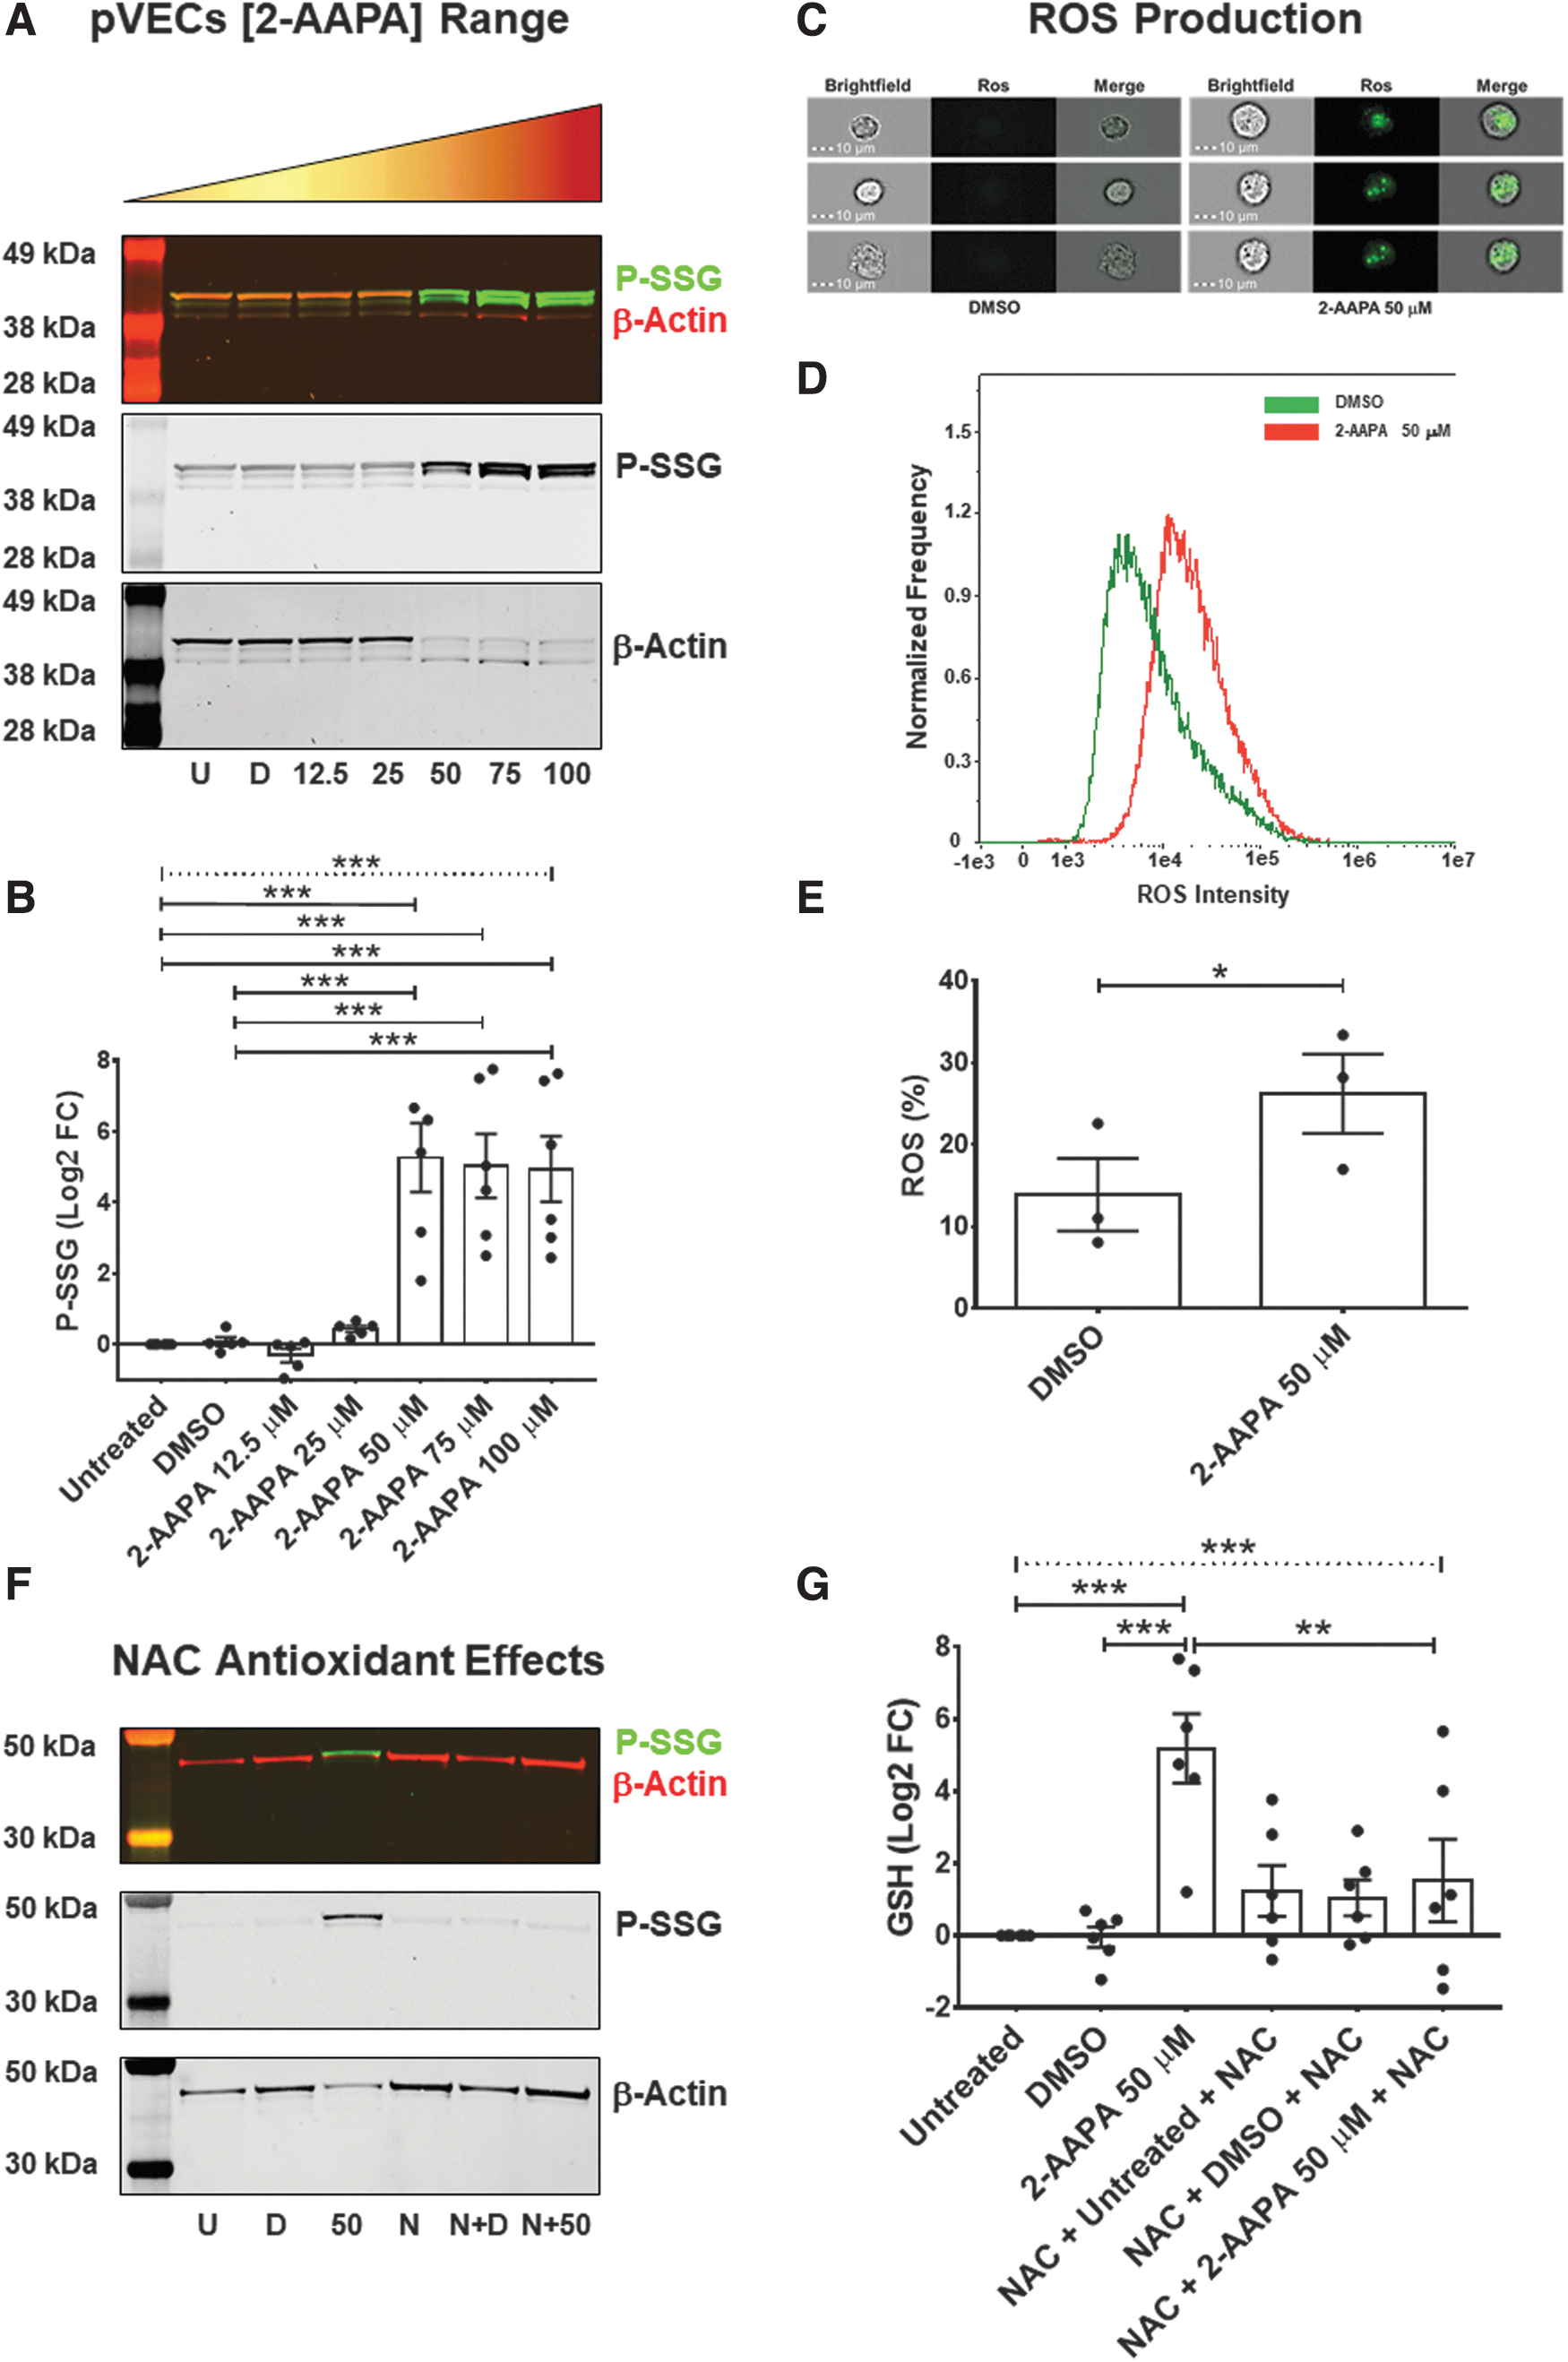
In greater detail, we observed that, compared with untreated and DMSO control conditions, the compound (50 μM) led to a sizable increment in P-SSG (log2FC = +5.3 ± 1.0; p = 0.0001). Moreover, consistent with previous studies (68), the P-SSG positive bands had the same molecular weight as β-actin, which could result in an altered ratio between soluble and polymerized protein, leading to significant cell architecture perturbations (70). We also noticed a marked rise in the phosphorylated form of the histone H2AX (γH2AX; ANOVA p = 0.001; Supplementary Fig. S2), thus denoting the presence of foci of DNA repair due to double-strand brakes.
This effect was dose-dependent (p-trend <0.0001). Indeed, pVECs treated with different concentrations of 2-AAPA (50, 75, and 100 μM) led to significant escalating γH2AX levels when compared with untreated cells (log2FC = +2.6 ± 0.8; log2FC = +2.6 ± 0.7; log2FC = +3.0 ± 0.4, respectively; all p < 0.05). Since 2-AAPA at 50 μM was the minimum effective dose able to induce P-SSG and DNA damage, we next interrogated whether or not this concentration imbalanced “VECs” redox status. To this end, we measured ROS production via a validated colorimetric assay.
As shown in Figure 2c–e, the cytofluorimetric analysis showed that 2-AAPA triggered a sizable ROS production compared with cells treated with DMSO (26.2% ± 4.8% vs. 13.9% ± 4.4%, respectively; p = 0.04). Hand in hand with this finding, the MTT assay revealed that treating pVECs with 2-AAPA abated cell viability drastically (ANOVA p < 0.001; Supplementary Fig. S3). Finally, we sought to determine whether adding N-acetyl-L-cysteine (NAC) would reduce/prevent the extent of this post-translational modification in pVECs. We found that NAC (2 mM) supplementation, before and during 2-AAPA administration, substantially attenuated P-SSG deposition compared with 2-AAPA treatment alone (log2FC = +1.5 ± 1.1 vs. +5.2 ± 1.0, respectively; p = 0.01; Fig. 2f, g).
We interpret these findings to indicate that blocking GR and thioredoxin activity in pVECs via 2-AAPA is sufficient to build up P-SSG in a sizable and likely functionally relevant manner, as suggested by the earlier reported decrement in VECs' viability and mounting oxidative stress.
During CAVS progression, hVECs acquire resilience against oxidative stress
Next, we interrogated whether changes in the ratio between GSH (i.e., reduced glutathione) and GSSG (i.e., oxidized glutathione), a typical metric of oxidative stress in cells, occur in diseased aortic leaflets and whether these alterations are stage-dependent in hVEC due to progressive increments in P-SSG, as mentioned earlier. We used a state-of-the-art methodology to monitor the GSH/GSSG ratio, such as liquid chromatography-tandem mass spectrometry (LC-MS/MS) (68).
In healthy endothelial cells, this ratio typically ranges around 100:1; however, in many pathological conditions and oxidative stress models, this ratio has been shown to decrease to 10:1 or even 1:1 (74, 75). Intriguingly, in hVECs at a different stage of CAVS, we noticed a progressive rise in the GSH/GSSG ratio, escalating with disease worsening. Indeed, group analysis revealed significant differences between the CAVS stages (ANOVA p = 0.0003; Fig. 3a) with an increment during disease progression (p-trend <0.0001).

We also found that sclerotic hVECs had a significantly higher GSH/GSSG ratio than control cells (211.3 ± 16.8 vs. 65.3 ± 17.2, respectively; p = 0.01). However, stenotic hVECs displayed the highest GSH/GSSG ratio (306.4 ± 50.0; p = 0.0002 vs. the control group). Separate analyses of GSH and GSSG showed that, intriguingly and unexpectedly, stenotic hVECs have higher GSH bioavailability than the control group (45.6 ± 4.5 vs. 21.6 ± 6.0, respectively; p = 0.0002; Supplementary Fig. S4a) and at the same time lower GSSG presence than controls (0.1 ± 0.01 vs. 0.3 ± 0.02 respectively; p = 0.008; Supplementary Fig. S4b).
Therefore, the stenotic hVECs appear to be more resilient against oxidative stress, thus probably less prone to P-SSG induction. First, we induced oxidative stress by using 2-AAPA treatment to test this intriguing possibility. In control hVECs, this oxidative challenge led to a drastic (85%) decrease in the GSH/GSSG ratio compared with untreated (p = 0.005) and DMSO conditions (p = 0.02; Fig. 3b). The same substantial drop was overt in sclerotic hVECs in which the ratio declined by 82% and 59% compared with -untreated (p < 0.0001) and DMSO-treated cells (p = 0.001), respectively (Fig. 3c).
Conversely, in stenotic hVECs, we captured a less pronounced decline (36%) in the GSH/GSSG ratio after 2-AAPA treatment compared with untreated stenotic ones (p = 0.052; Fig. 3d). At the same time, no sizable difference was noted compared with DMSO-treated cells. We interpret these findings to indicate that, owing to a higher basal GSH/GSSG ratio (Fig. 3a), due to a higher basal GSH (Supplementary Fig. S4a) and smaller GSSG rise (Supplementary Fig. S4b) after 2-AAPA treatment, the stenotic hVECs are more protected against further oxidative insults (Supplementary Fig. S4c).
Second, regarding P-SSG, we did not find any basal difference among hVECs at the three pathological stages considered (p = 0.505). Notwithstanding, we noticed induction of this post-translational modification after 2-AAPA treatment in all three hVECs groups (Fig. 4a–c and Supplementary Fig. S5). In particular, in control hVECs, P-SSG drastically increased after 2-AAPA treatment (log2FC = +2.3 ± 0.6; p < 0.01) compared with -untreated and DMSO-treated ones (Fig. 4a).
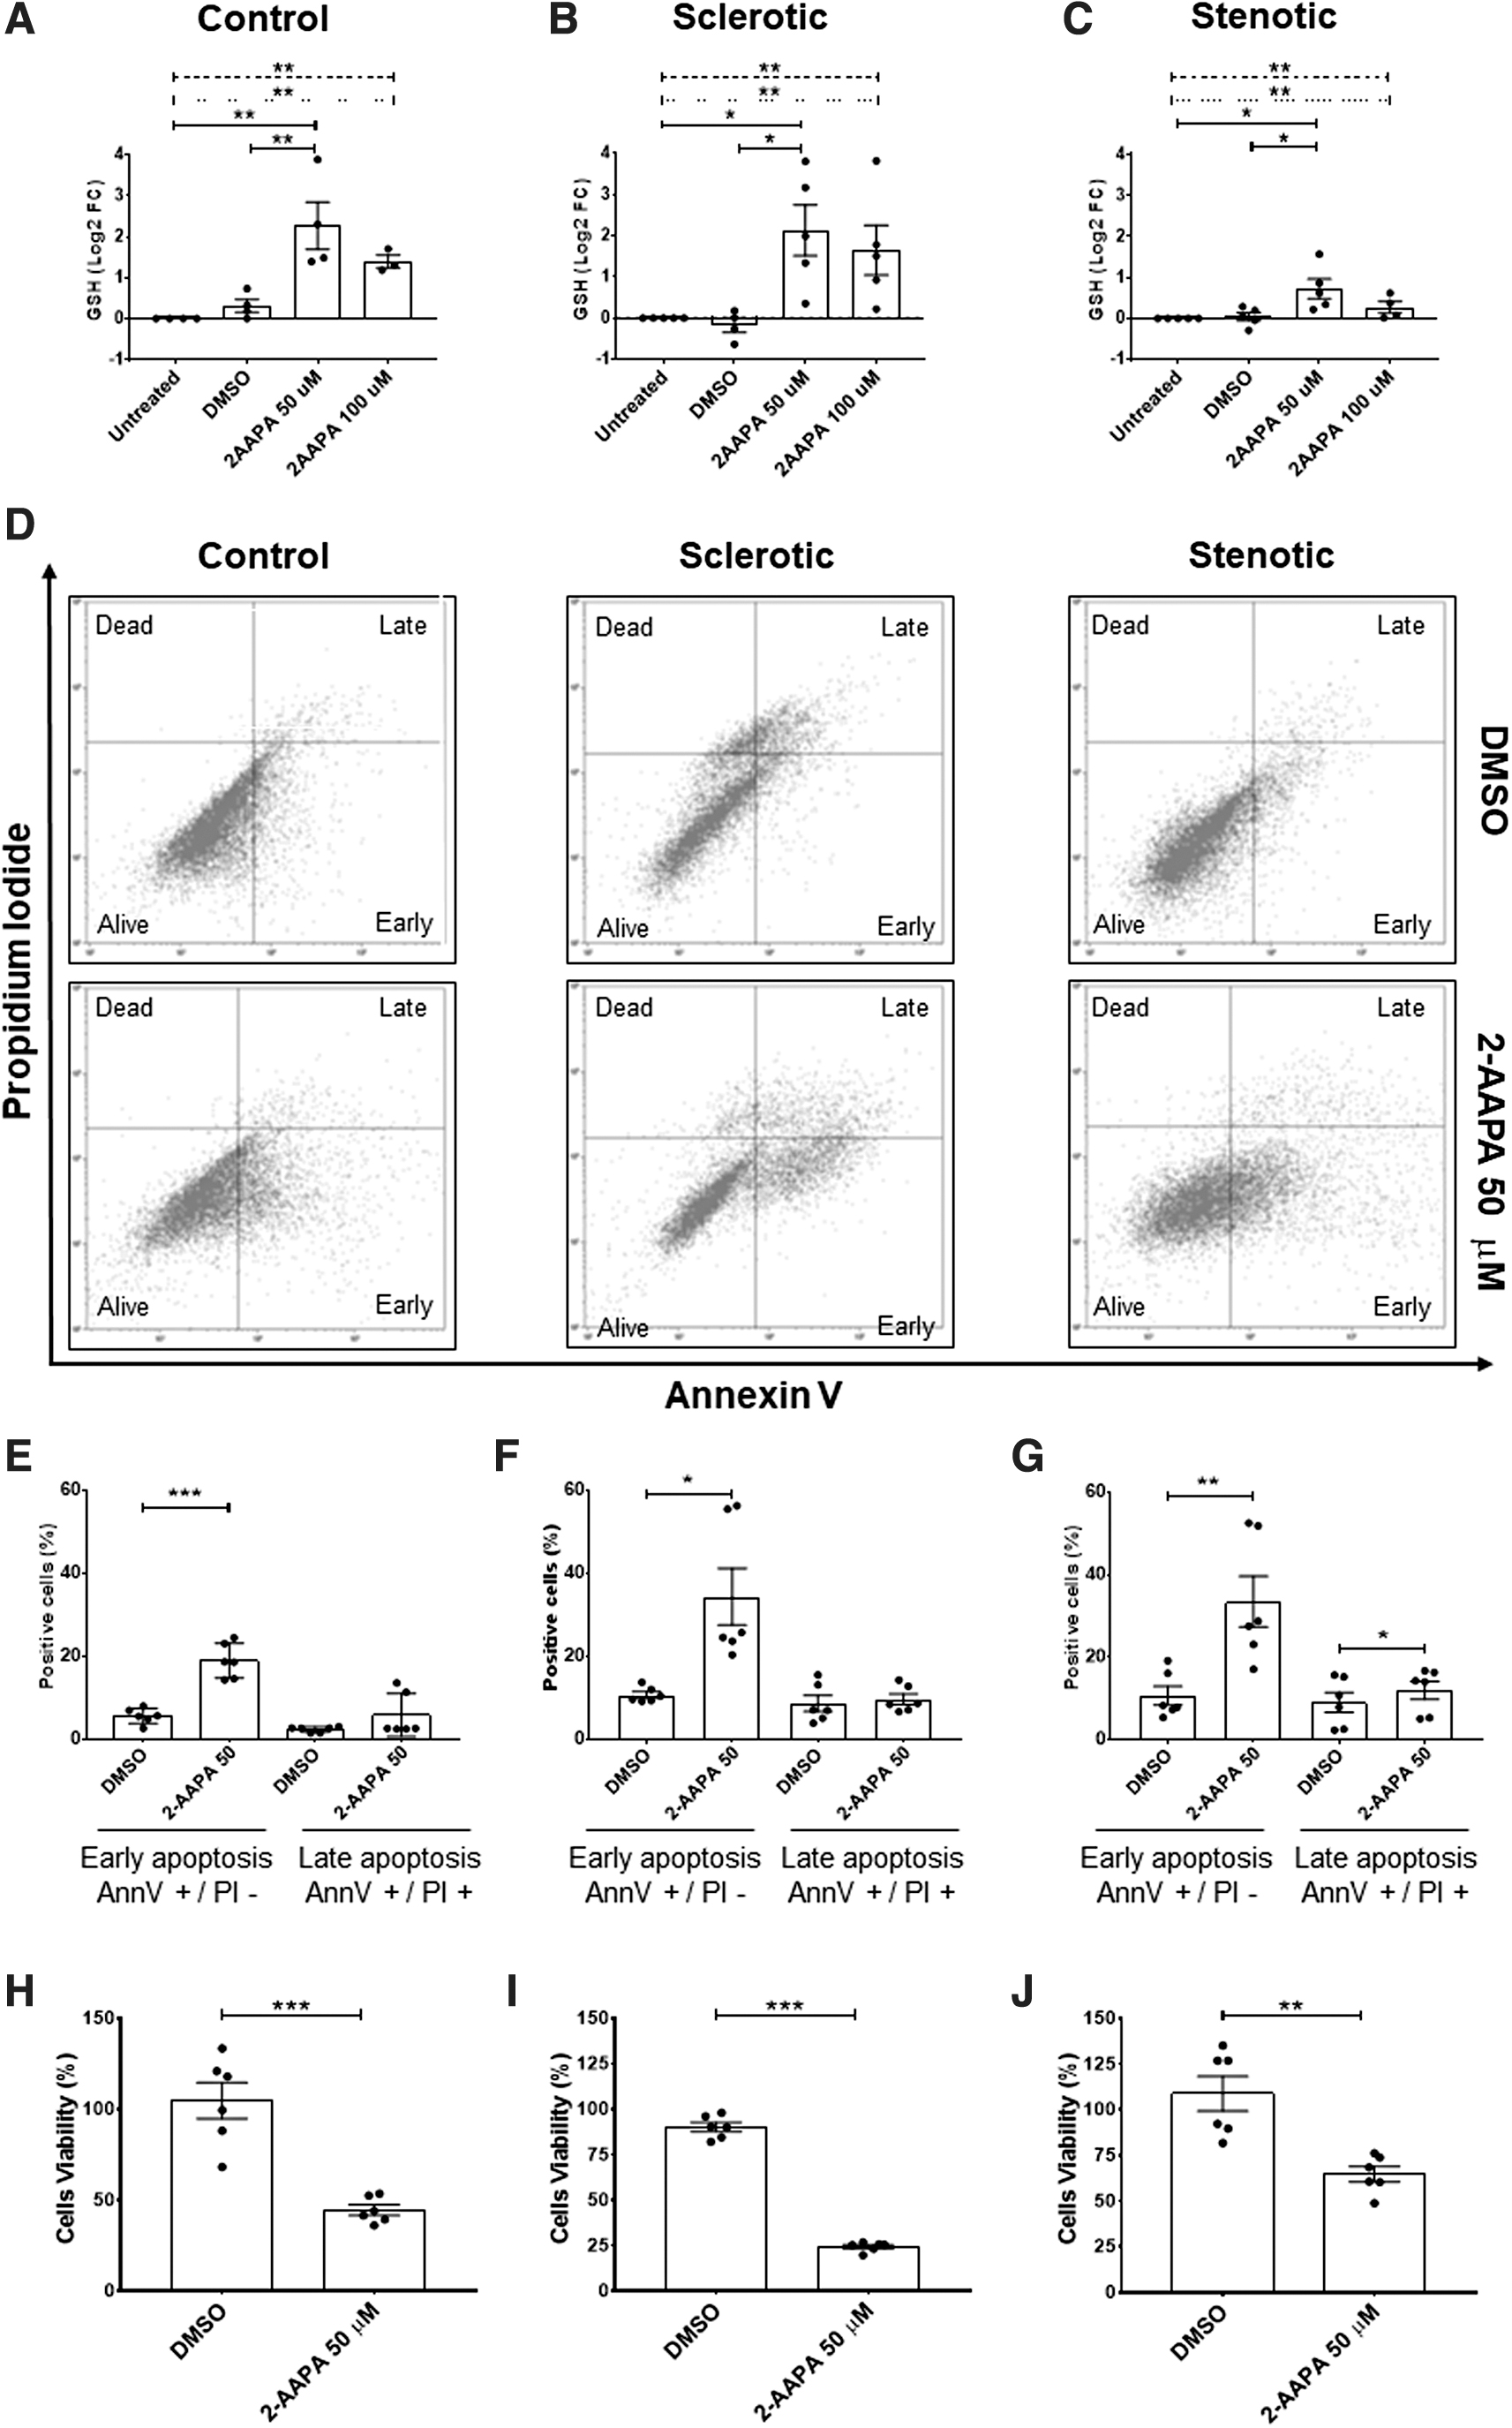
In sclerotic hVECs, we noticed a similar P-SSG rise (log2FC = +2.1 ± 0.6; p < 0.01; Fig. 4b). Conversely, in stenotic hVECs, the P-SSG increment was less manifest (log2FC = 0.7 ± 0.2; p < 0.05; Fig. 4c). To validate that stenotic hVECs are more resistant to oxidative stress than control and sclerotic cells, we tested the extent of 2-AAPA-induced cell apoptosis and viability. As shown in Figure 4d–g, we highlighted the presence of early apoptosis after 2-AAPA treatment compared with DMSO, in control (+13.3% ± 1.5%; p = 0.0003 Fig. 4d, e), sclerotic (+23.62% ± 7.2%; p = 0.02; Fig. 4d, f), and stenotic (+22.75% ± 4.0%; p = 0.002; Fig. 4d, g) hVECs.
However, after 2-AAPA treatment, a slight increase in late apoptosis was detected only in stenotic hVECs (+2.8 ± 0.7, p = 0.01; Fig. 4d, g). Further, to confirm the activation of the apoptotic pathway and understand which apoptotic cascade was activated, we profiled 35 apoptosis-related proteins in stenotic cell lysates (Supplementary Fig. S5b, c). The 2-AAPA treatment induced a significant overexpression of the active form of caspase 3 (Cleaved Casp3), of heme oxygenase 1 (HO-1/HMOX1/HSP32), and of heat shock protein 60 (HSP60).
In particular, after 2-AAPA treatment, the cleaved Casp3 increased by 25% (Supplementary Fig. S5d; DMSO Integrated Density (ID) = 0.08 ± 0.008 and 2-AAPA ID = 0.1 ± 0.02; p = 0.02) and, in relation to its inactive form (pro-caspase), by 50% (Supplementary Fig. S5e; Ratio cleaved Casp3/Pro casp3 ID in DMSO = 0.1 ± 0.01 and in 2-AAPA ID = 0.2 ± 0.03; p = 0.01) with a concomitant overexpression of HO-1 (Supplementary Fig. S5f; DMSO ID = 0.09 ± 0.01 and 2-AAPA ID = 0.2 ± 0.01; p = 0.001).
Indeed, the co-presence of cleaved caspase and HSP60 protein confirms the activation of the apoptotic process and suggests the presence of potential mitochondrial damage (36). On the other hand, the overexpression of HSP60 (Supplementary Fig. S5; DMSO ID = 0.1 ± 0.02 and 2-AAPA = 0.3 ± 0.03; p = 0.004) further confirms the presence of oxidative stress since the cells' attempt to react to the insult caused by oxidative stress status (49).
At the same time, assessing cell viability after 2-AAPA treatment, we noticed that control and sclerotic hVECs exhibited a drastic drop in viability rate versus DMSO-treated ones (control hVECs = −60.1% ± 10.2%, p = 0.0002 vs. DMSO; Fig. 4h; sclerotic hVECs = −65.7% ± 2.3%, p < 0.0001 vs. DMSO; Fig. 4i). However, after 2-AAPA treatment, stenotic hVECs displayed a modest decline in viability compared with DMSO (−44.0% ± 8.5%, p = 0.001; Fig. 4j) as well as versus controls and sclerotic ones (Supplementary Fig. S6). These data collectively suggest that those endothelial cells that survived during CAVS progression over the years harnessed adaptive/compensatory mechanisms, such as boosted antioxidant systems, including the glutathione one.
Protein glutathionylation favors endothelial morphological/functional changes in hVECs
The earlier reported findings suggest that, despite an acquired resistance against oxidative stress, hVECs undergo a profound structural (and likely functional) remodeling during CAVS progression. Therefore, we started dissecting possible mechanisms underlying these alterations by using an immunofluorescent staining approach. First, we observed that hVECs had the classical actin filament configuration under basal conditions (Fig. 5a top and middle panels).
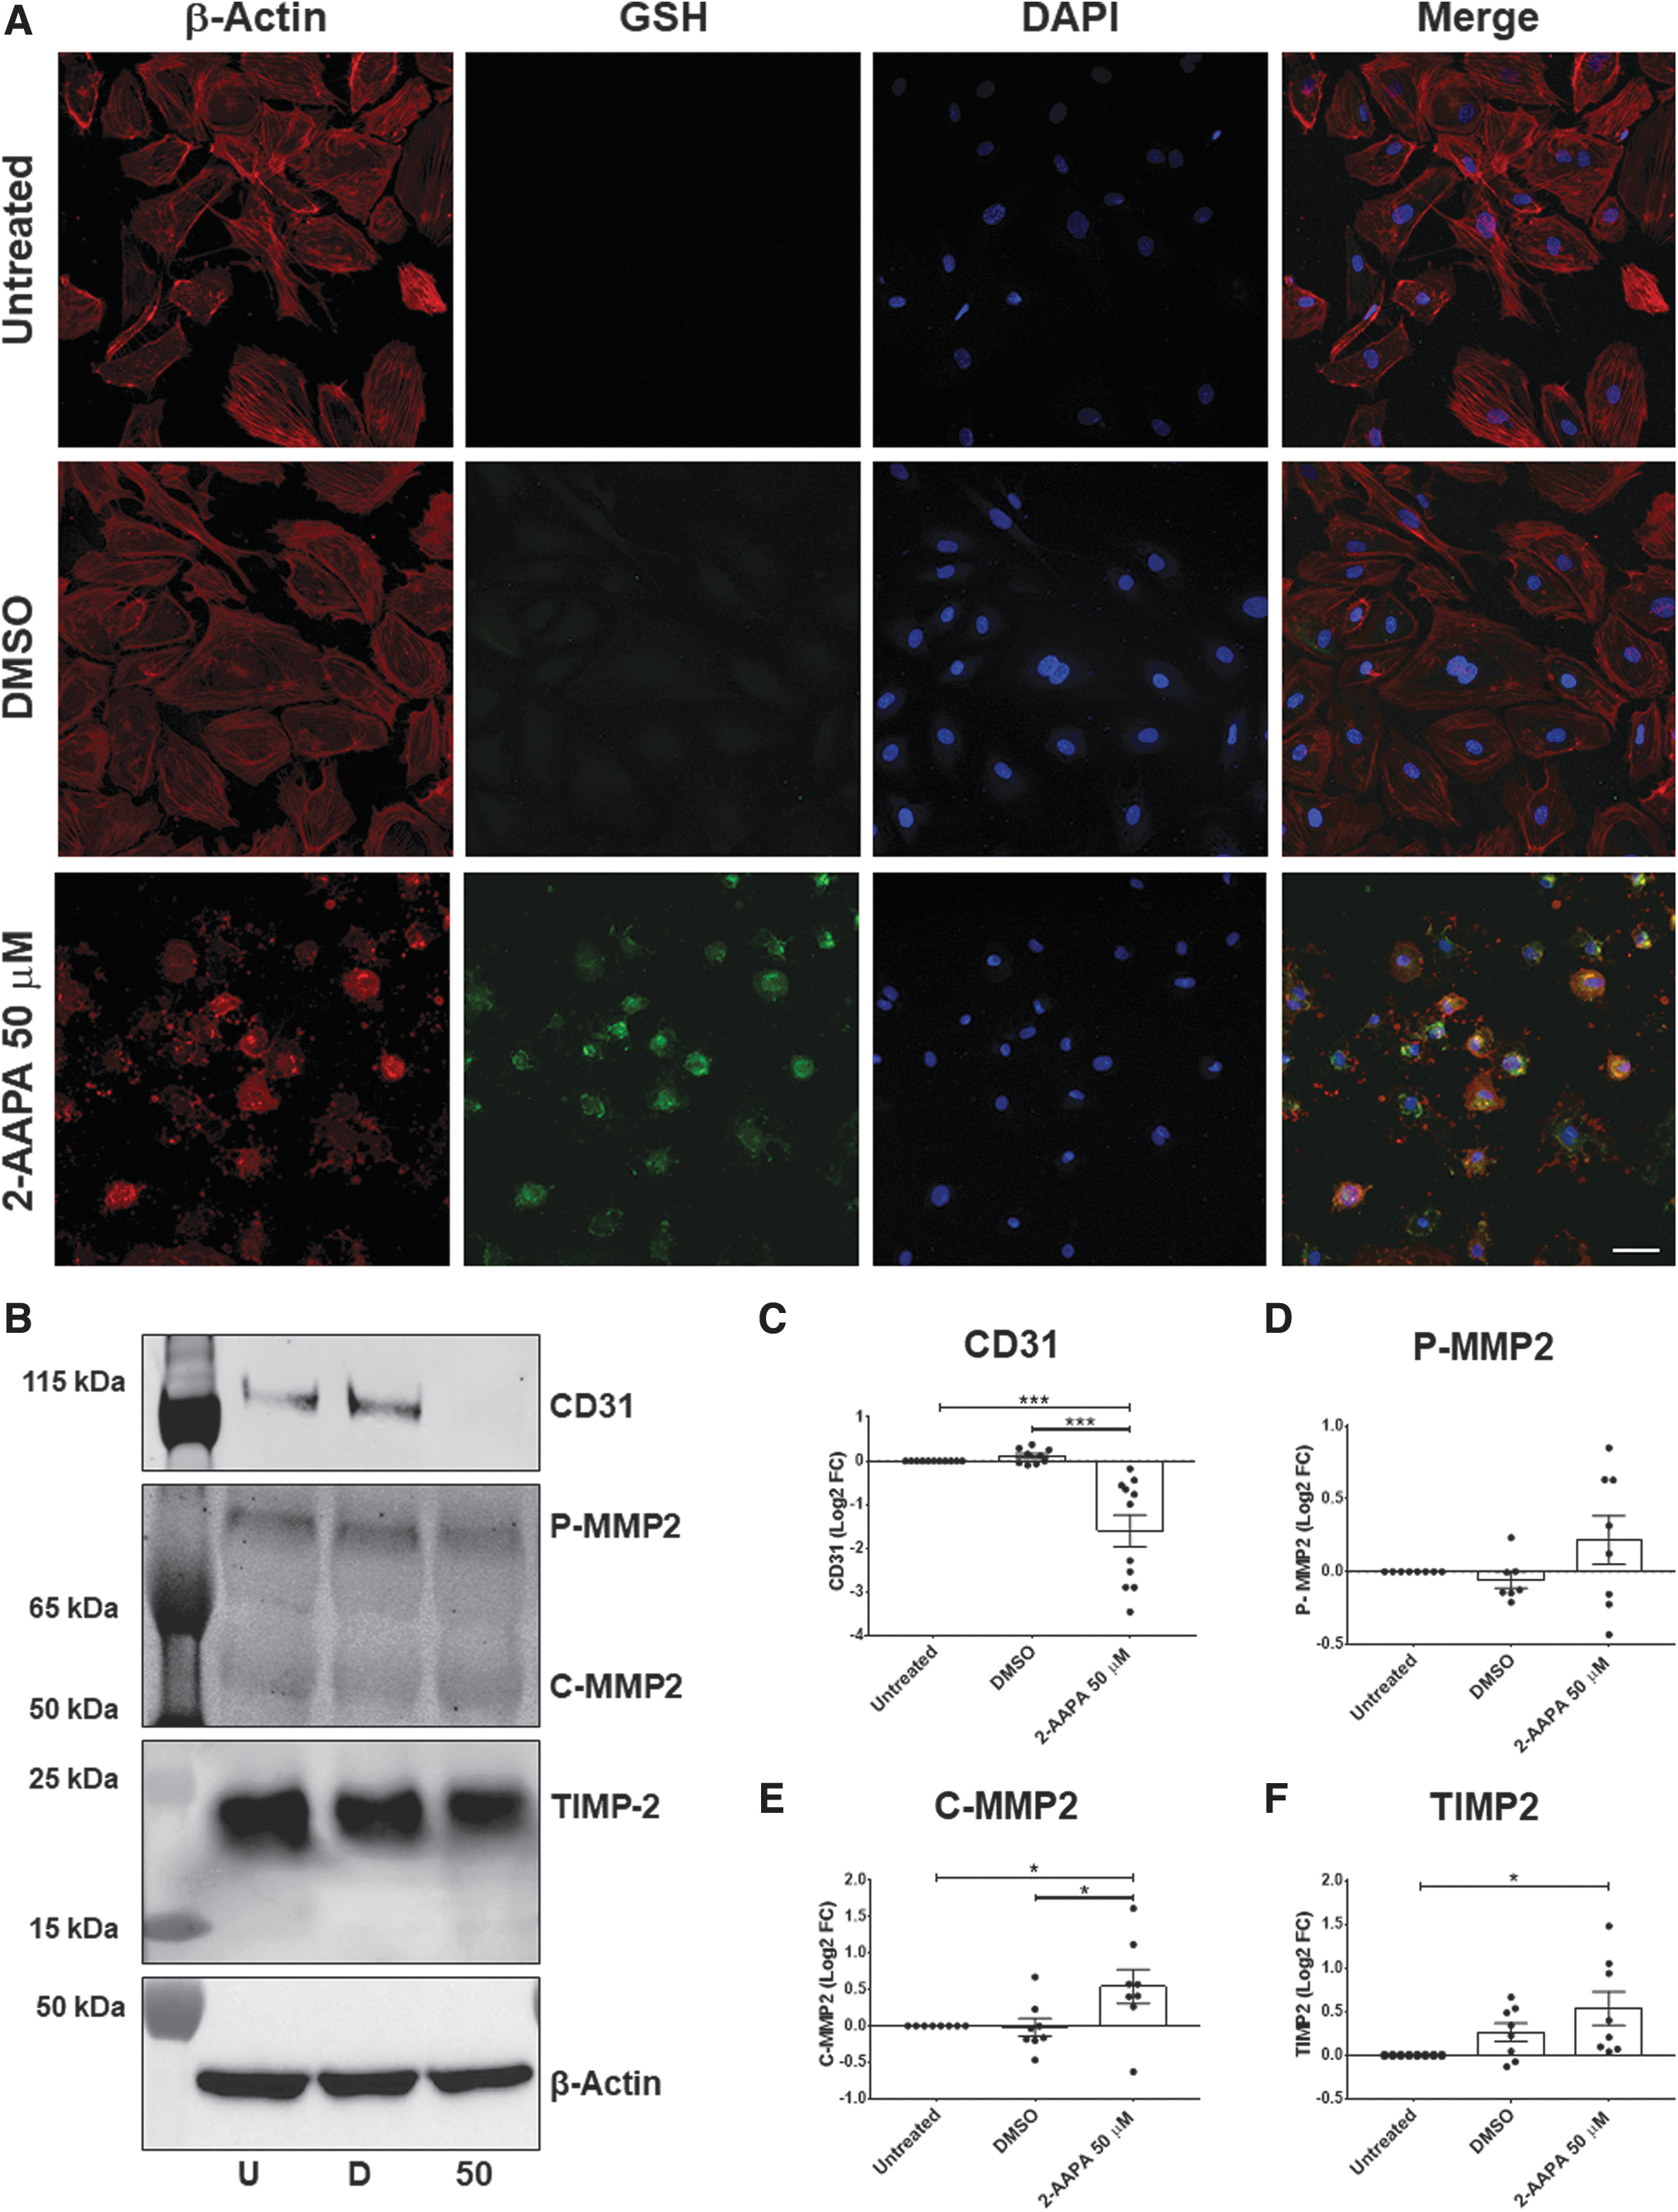
In particular, in the 2D monolayer configuration, actin filaments were arranged below the plasma membrane, thus identifying the cortical actin and in the cytoplasm (56). However, after 2-AAPA treatments, we noticed salient morphological changes besides a P-SSG deposition rise (Fig. 5a lower panels). Namely, the cytoskeleton was de-structured with a predominant colocalization between glutathione and β-actin filaments, suggesting β-actin S-glutathionylation (negative staining control in Supplementary Fig. S7). Correspondingly, we found a significant fall in a specific endothelial marker, CD31 (log2FC = −1.6 ± 0.3; ANOVA p < 0.0001; Fig. 5b, c).
This fact suggests the loss of cell–cell junction and adhesion. Concomitantly, we found a significant increment in metalloproteinase type 2 (MMP2) active form (C-MMP2 log2FC = +0.53 ± 0.2; ANOVA p = 0.03; Fig. 5b, e). On the other hand, we also checked the expression of the tissue inhibitor of metalloproteinase 2 (TIMP2), a specific inhibitor of MMP2, and we observed a slight increase in this protein after 2-AAPA treatment only when compared with the untreated condition (log2FC = +0.5 ± 0.2; ANOVA p = 0.02; Fig. 5f).
Indeed, we noticed no difference in TIMP2 levels between DMSO and 2-AAPA treatment, and thus, MMP2 activation was not followed by a parallel rise in its endogenous inhibitor (i.e., TIMP2). Since MMPs could directly influence cell surface proteins' expression (21), the MMP2 overexpression may help explain the loss of CD31. In aggregate, these data indicate that oxidative stress, inducing P-SSG, is conducive to morphological and functional changes.
Association between P-SSG and ROS emission via mitochondrial damage and endothelial nitric oxide synthase uncoupling in hVECs
Based on the earlier reported data, we measured ROS production in stenotic hVECs after the block of GR with 2-AAPA treatment, combining a colorimetric assay and cell live imaging. As shown in Figure 6a and b, ROS levels drastically increase after 2-AAPA treatment (ROS integrated density/confluence area DMSO = 0.04 ± 0.007 vs. 2-AAPA = 1.0 ± 0.1; p < 0.0001). In light of the increase in ROS emission and the upregulation of the HSP60 protein, an indicator of mitochondrial damage, we wondered whether the increase in ROS could stem from mitochondrial damage.
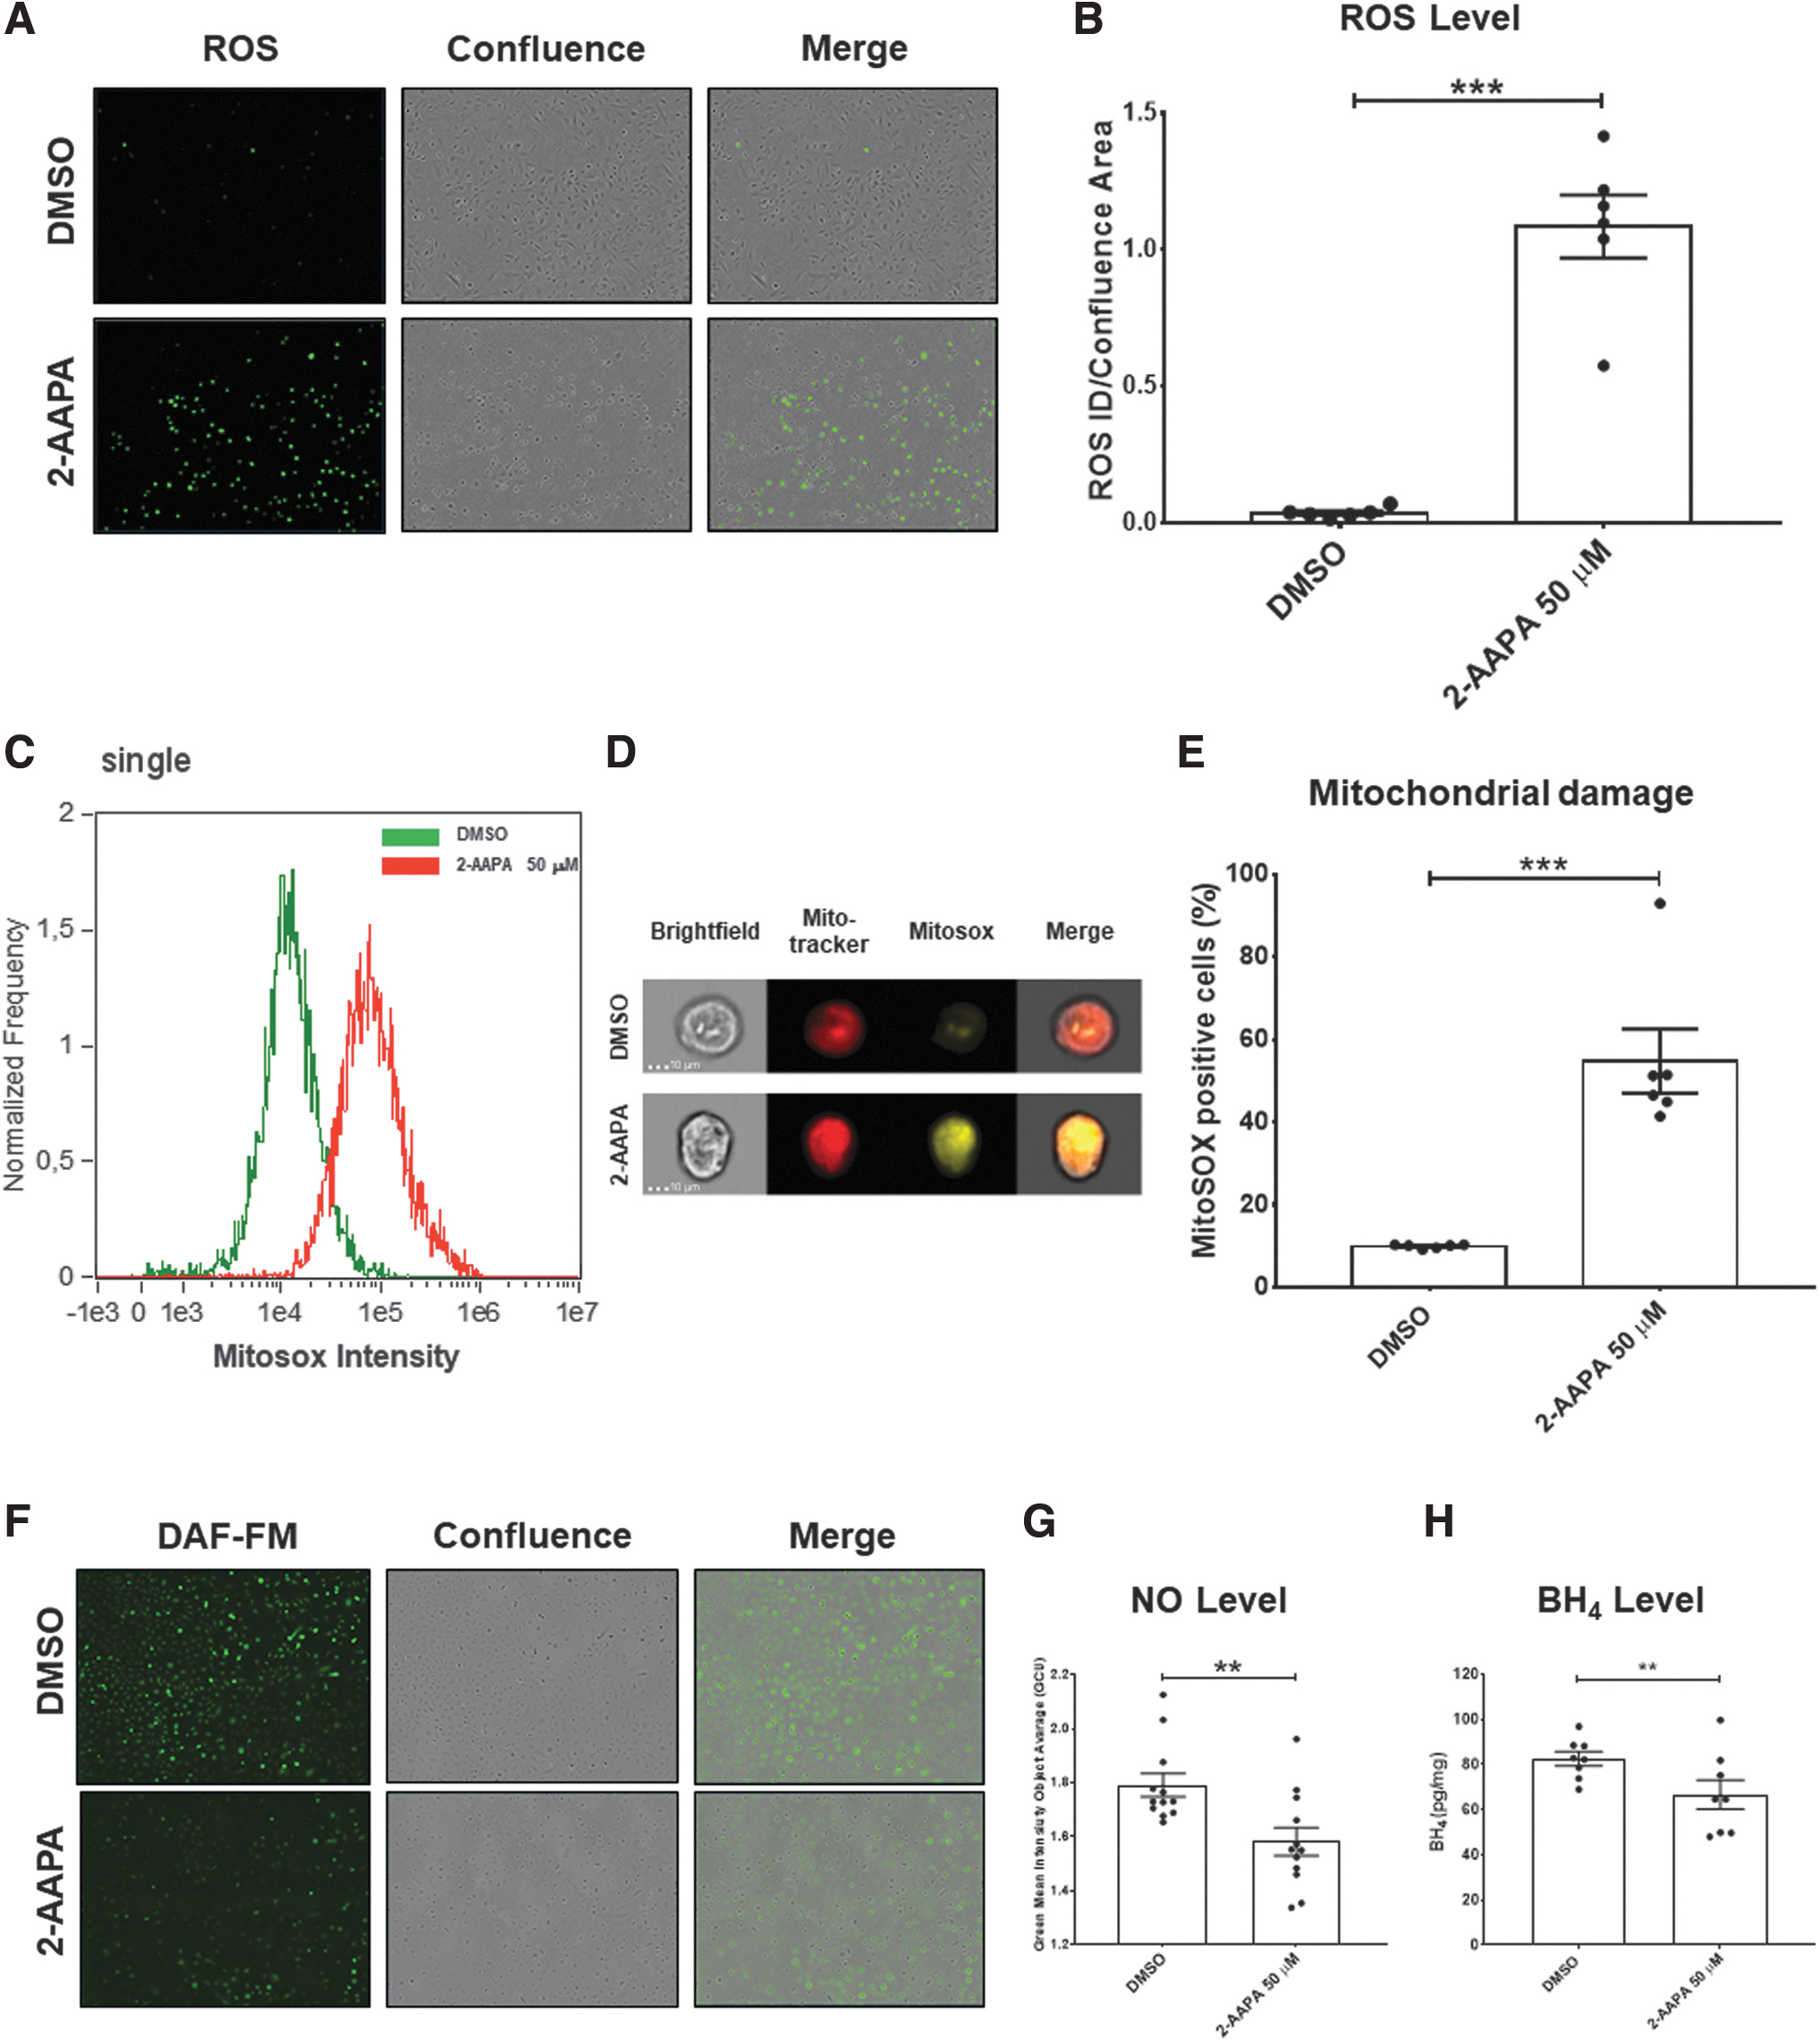
Therefore, via a state-of-the-art imaging flow cytometer evaluation, we observed a significant increase in the presence of mitochondrial damage in stenotic hVECs when treated with 2-AAPA (Mitosox positive cells %: +44.8 ± 7.9; p < 0.0001 vs. DMSO; Fig. 6e).
In addition, since a notable ROS increment is driven by 2-AAPA, we speculated that this ROS surge could also derive from endothelial nitric oxide synthase (eNOS) uncoupling. In this regard, we checked the intracellular nitric oxide (NO,) levels and the concentration of the cofactor tetrahydrobiopterin (BH4), known to be a critical determinant of eNOS activity and eNOS uncoupling (14), after blocking GR with 2-AAPA.
Thanks to live-cell imaging analysis and ELISA assay, we found a significant decrease in NO. levels (2-AAPA = 1.6 ± 0.05 vs. DMSO = 1.8 ± 0.04; p = 0.005; Fig. 6f, g) with a concomitant decrease in BH4 levels in cell lysates obtained from hVEC after 2-AAPA treatment when compared with DMSO (pg/mg: 66.7 ± 6.4 vs. 82.49 ± 3.1, respectively; p = 0.01; Fig. 6h). These findings indicate that mitochondrial damage and eNOS uncoupling concur in ROS rise, directly affecting endothelial, morphological, and functional changes.
NAC fends off P-SSG and consequent calcium deposition in hVECs
Aortic valve calcification is a stenotic CAVS signature, contributing to narrowing the aortic valve (48). Thus, we felt it necessary to determine whether excessive P-SSG deposition predisposes hVECs to calcification. To this purpose, we first evaluated the calcium deposition susceptibility of these cells after a challenge with a well-known calcification inducer (29). As expected, treatment with inorganic phosphate (Pi) caused significant hVECs calcification compared with untreated cells (47.3 ± 8.1 vs. 6.9 ± 1.0 ng of calcium/μg protein, respectively; p = 0.0001; Fig. 7a).
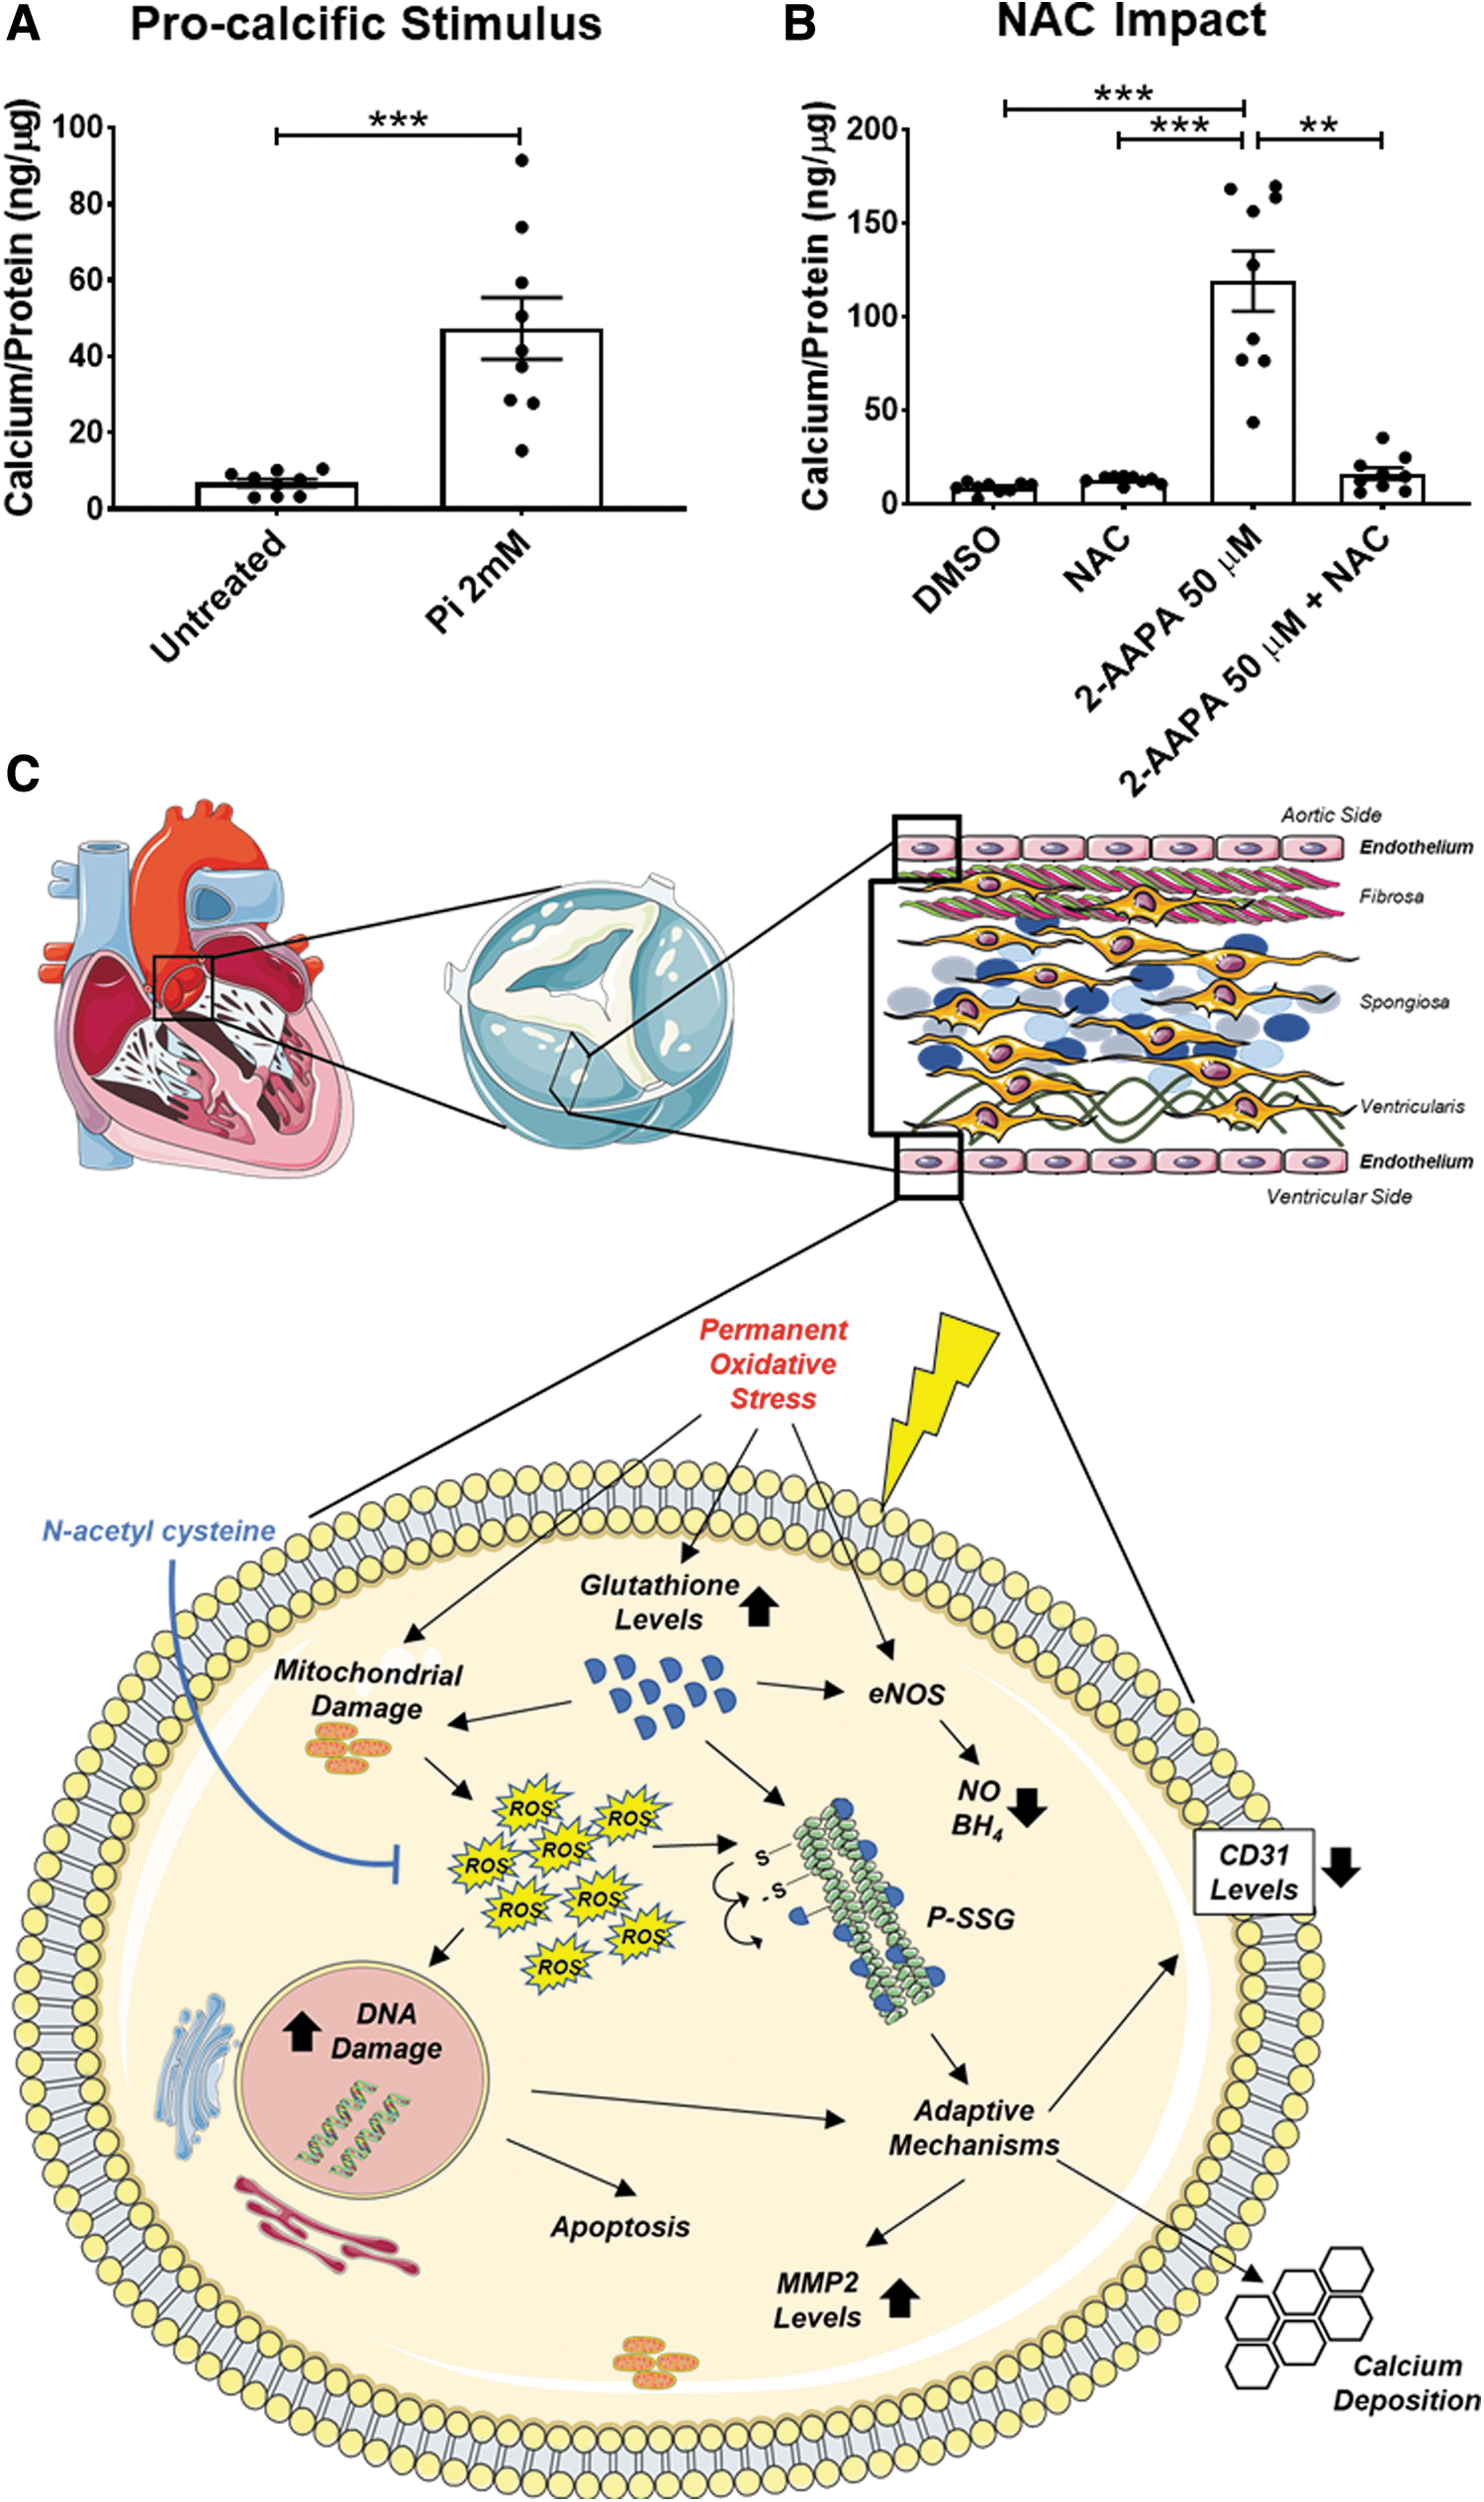
Then, we observed that the oxidative stress generated by 2-AAPA (50 μM) prompted hVECs calcification, differently from what occurred with DMSO alone (119.0 ± 16.1 vs. 8.7 ± 0.9 ng of calcium/μg protein, respectively; p < 0.0001; Fig. 7b). Finally, we proved that the addition of 2 mM NAC, 1 h before and during the 2-AAPA treatment, drastically lowered the calcium deposition (−79.9% ± 8.1%; p < 0.0001) compared with hVECs treated with 2-AAPA alone.
This data set corroborates that oxidative stress via P-SSG plays a pivotal role in CAVS progression, inducing maladaptive mechanisms in hVECs, eventually leading to calcium deposition.
Discussion
Our study cements the view that escalating ROS emission in valve leaflets underscores the human CAVS involution from a sclerotic to a stenotic phenotype, a switch paralleled by a similar progressive increment in P-SSG deposition. Moreover, the present findings suggest that borne as a compensatory system to face an excessive oxidative burden, P-SSG favors the switch of hVECs from an innate endothelial phenotype to a damaged one, paving, in turn, the way to calcium deposition. Relevant from a translational perspective, our study unearths that the antioxidant compound, NAC, effectively prevents P-SSG in VECs and their subsequent calcification (Fig. 7c).
The AS, the end-stage phase of CAVS, is the third most common cardiovascular ailment after hypertension and coronary artery disease, being the most prevalent heart valve disorder in the western world (42, 57). The AS prevalence is about 3% in the 65 year-old population and older, increasing with advancing age (51): from 0.2% in the 50–59-year group to 9.8% in those aged 80–89 years (17). Despite severe AS being estimated to march up by 2.4-fold in the year 2040 and likely to escalate more than triple by 2060 (17), no current effective pharmacological treatment for preventing or arresting CAVS progression is available at the moment, therefore resting on surgical or transcatheter AVR as the sole available options nowadays. The CAVS remains a debilitating disease with a massive socioeconomic burden (7).
The CAVS is a complex, active progressive disease characterized by a cascade of cellular events that initially cause fibrotic thickening (i.e., AVSc), followed by the extensive calcification of the aortic valve leaflets (i.e., AS). This involution entails several tissue/cellular alterations, such as endothelial dysfunction, inflammatory cell recruitment, and VIC phenotypic switching in an osteoblast-like phenotype (40, 53). At least in part, these perturbations directly emanate from specific molecular processes, such as TGF-β signaling, bone morphogenetic protein signaling, wnt/β-catenin signaling, notch signaling, MMPs, and ROS (30, 53).
Our data add to this scenario a significant feature: Despite the upregulation of some non-enzymatic antioxidant systems, such as the glutathione one, ROS emission from human aortic leaflets continues to grow with time, marking the transition from a sclerotic to a stenotic phenotype. Until now, however, very few studies attempted to connect altered valve cell redox conditions to CAVS final stage (i.e., AS) (22, 43). Nevertheless, in some instances, the strategy adopted to index ROS contribution was sub-optimal, as in the case of the use of dihydroethidium fluorescence to detect superoxide that is not so specific (37).
However, in other studies, ROS contribution was inferred by changes in the expression and activity of antioxidant enzymes such as superoxide dismutase and catalase (11, 22, 43). Paradoxically, no studies have delved into the glutathione system yet, that is, the primary non-enzymatic antioxidant system and reducing equivalents' providers in the cell (5, 23, 61). GSH is present in millimolar concentrations in eukaryotic cells' cytosol (64) and, under normal conditions, the GSH/GSSG ratio ranges from 30:1 to 100:1 (35).
During high ROS emission conditions, cells put up reversible S-glutathionylation to guard highly reactive cysteine residues from permanent oxidative modifications (55). Here, for the first time, we performed a direct GSH/GSSG ratio assessment in human endothelial cells isolated from aortic valves at different stages of the disease, employing a state-of-the-art approach, such as LC-MS/MS, previously mentioned to be developed in our lab (68).
Our studies in human valves reveal a progressive GSH/GSSG ratio increment during CAVS disease, suggesting adaptive efforts to face the enduring oxidizing conditions occurring in stenotic valve cells. Further, we proved the centrality of persistently elevated ROS emission in CAVS involution toward a stenotic phenotype by using an in vitro approach. In this model, both induction and scavenging of P-SSG via de-glutathionylation are still at play.
When removed from the in situ highly oxidizing conditions occurring in the diseased human valve tissues and placed in a culture system where de-glutathionylation can intervene, human stenotic VECs showcase P-SSG levels that are superimposable to those found in control valves. These data suggest that in situ persistent P-SSG levels in human stenotic cells act as a “redoxstat”; simultaneously, they testify the persistence of elevated ROS emission experienced by the valve tissue. In the end, P-SSG can ultimately serve to counter some ROS-mediated effects in valve cells.
For instance, in the present case, it may explain why human stenotic cells display increased viability compared with both controls and sclerotic cells. Notwithstanding, persistently elevated ROS and P-SSG levels in stenotic cells—the latter likely due to a reduced de-glutathionylation ability—seemingly factor in the morphological/functional switch of the endothelial phenotype. Ultimately, these alterations predispose human stenotic cells to calcium deposition. In aid of this contention come data evaluating the mitochondrial damage and eNOS dysfunction. Indeed, during persistent oxidizing conditions, many mitochondrial proteins are S-glutathionylated as an attempt to protect, however causing ROS leakage at the end (69).
Further, under oxidative stress conditions, when P-SSG arises, a process known as eNOS uncoupling occurs (18). When eNOS uncouples instead of producing NO,. it makes O2 •− (14), a process that can be monitored by BH4 reduction (25) as observed in our experiments. Finally, the loss on CD31, a classic endothelial marker, and the increment in MMP2 expression could also highlight a possible consequence of an endothelial-to-mesenchymal transition (73). At the same time, here, we report the upregulation of MMP2, a protein involved in matrix remodeling that is overexpressed whenever cells acquire invasive properties, thus the possibility of migrating toward the aortic valve's inner layers (39).
Present studies with NAC further corroborate the concept that unremitted ROS emission from valve cells favors CAVS progression toward stenosis. This exogenous thiol compound is an acetaminophen poisoning antidote (33), ROS scavenger (2), and reduced glutathione precursor (72). However, the passage of NAC through the plasma membrane is problematic in that its carboxyl group loses its proton at physiological pH, making the compound negatively charged (4). In our proof-of-concept experiments, we use a high concentration of NAC (2 mM) to overpass this limitation.
The NAC impact has been tested in a plethora of cardiovascular disease models, highlighting its effectiveness in countering oxidative stress; attenuating fibrosis (58), ischemia-reperfusion injury (6), and apoptosis (12). The NAC reduces systemic and myocardial oxidative stress in CAVS pathophysiology by restoring total myocardial glutathione while attenuating myocardial fibrosis in an AS rat model (58). It can also halt fibrosis and AS progression in mice with the genetic deletion of the low-density lipoprotein receptor (LDLR), by reducing the shear-dependent activation of TGF- β1 potentially via a thiol-disulfide exchange mechanism and not ROS (65).
However, despite these models being flawed by several limitations, including the different anatomical structures of the aortic valve of rodents versus humans and the need to introduce dietary regimens or genetic interventions to induce valve calcification (60), they indicate that NAC could potentially be a treatment for AS. Further, our evidence showing that NAC prevents the modification of cysteines in the VECs, their S-glutathionylation, and calcification attests to the relevance of also countering ROS progressive accumulation.
Several clinical trials tested NAC effectiveness in cardiovascular diseases, as both a short- and long-term treatment (9, 15, 16, 31, 34, 67). Tepel et al., for instance, showed NAC-induced protection toward composite cardiovascular endpoints, under pathological conditions such as fatal and nonfatal myocardial infarction, cardiovascular disease death, need for coronary angioplasty, coronary bypass surgery, coronary bypass surgery, and ischemic stroke, or peripheral vascular disease with amputation (67).
Interestingly, NAC attenuates in vivo oxidation of injected human LDL, eventually reducing atherosclerotic plaque formation (16). Notably, oxidized LDL fuel CAVS progression through an osteogenic program (46). Also worth mentioning is that NAC, at intermediate dosages (1200 mg daily) and given chronically (12–24 months), shows no major side effects (9, 67). Besides its antioxidant properties, NAC can decrease the gelatinolytic activity of MMPs, with effects likely due to NAC's ability to scavenge ROS or direct interaction with gelatinases (8).
Thus, there is ample theoretical room for thinking that NAC, perhaps as an adjuvant, could contribute to preserving the valve endothelium, preventing its progression toward a stenotic phenotype. However, this possibility remains to be tested. Consequently, NAC has been used here just as a proof of principle.
This study has some limitations; thus, aspects warrant future, more in-depth investigation. First, we evaluated P-SSG with a dot blot and Western blot approach, where the latter revealed a single sharp band at the molecular weight of β-actin, as previously described by our group (68). In so doing, we could not detect P-SSG on other proteins, possibly due to the antibody's sensitivity. However, our data align with the literature where P-SSG causes structural and functional proteins' modifications (27, 28).
Besides, we did not delve into the endothelium/interstitium crosstalk. Indeed, we aimed at unveiling endothelial cell contribution (and their transformation) to CAVS progression from a sclerotic to a stenotic phenotype for the present study. In addition, we performed short-term in vitro cell culture experiments, and thus, they might not entirely reflect the chronic pathophysiology of AS, which takes many years to develop. However, it is interesting to note that we used endothelial cells isolated from aortic leaflets at different stages of the pathology.
They seem to retain peculiar characteristics at a certain degree, suggesting adaptive efforts to face the enduring oxidizing conditions. Finally, 2-AAPA treatment has been linked to cellular senescence (41) and, in our in vitro system, we noticed an increment in the phosphorylation of the histone H2AX, the second most common senescence marker. However, we checked the levels of cyclin-dependent kinase inhibitor 1A (p21/Cip1), another well-known marker of senescence, after 2-AAPA treatment. No significant regulation was found. In essence, we are not naively saying that the present findings exhaust all possible mechanistic explanations in this sense.
Conclusion
Our study demonstrates that unremitted ROS emission from endothelial cells, along with a P-SSG build-up, occurs and accounts, at least in part, for the morphological/functional changes occurring in the human aortic valves when they switch from sclerotic to stenotic, increasing the chance of calcification. Our in vitro data suggest that it is possible to de-activate this mechanism, leveraging on endogenous signaling or exogenous compounds that are able to blunt ROS emission and counter MMP expression/activity, as suggested herein by the use of NAC.
In our view, two main complementary avenues should be pursued to arrest aortic valve disease progression. First, blunting ROS emission to reduce the need for P-SSG; then, preserving the endothelium integrity/function. In the end, both measures will conjure up to prevent the onset of maladaptive processes, ultimately paving the way to calcium deposition and thus stenosis.
Materials and Methods
Patient enrollment and the study protocol
We prospectively obtained human aortic valve leaflets from patients undergoing AVR at Centro Cardiologico Monzino IRCCS (CCM). The study was approved by the Institutional Review Board and by the Ethical Committee of CCM according to the principles outlined in the Declaration of Helsinki (1964). We asked each enlisted patient to sign informed consent to use the removed aortic valve leaflets. In particular, we enrolled patients with tricuspid aortic valves intended for AVR surgery without sclerosis (control; n = 18), with sclerosis (AVSc; n = 23), and with severe stenosis (AS; n = 25).
In detail, we obtained aortic valve leaflets from patients requiring AVR and divided into: (i) controls, patients who underwent AVR due to aortic valve insufficiency with normal aortic valve leaflet structure; (ii) sclerosis, patients who underwent AVR due to aortic valve insufficiency with AVSc; and (iii) stenosis, patients who underwent AVR due to severe AS. Aortic valve insufficiency was categorized as: no (0), mild (1), moderate (2), and severe (3) regurgitation during echocardiography procedure (7).
The presence of AVSc was recognized as non-uniform thickening with or without spotty calcified areas of the aortic valve leaflets without a significant transvalvular gradient (maximum aortic velocity <2.5 m/s), as described by Otto et al. (47). The presence of AVSc was ascertained by an expert echocardiographer and an experienced surgeon who shed light on borderline cases. Severe AS patients were defined according to current guidelines (i.e., aortic jet velocity >4.0 m/s, mean gradient ≥40 mmHg, and aortic valve area <1 cm2) (7).
We used the following inclusion criteria: (i) elective and isolated surgical procedure; (ii) older than 18 years of age; (iii) ejection fraction >30%; and (iv) normal sinus rhythm. We adopted the following exclusion criteria: Bicuspid aortic valve morphology, previous cardiac surgery, rheumatic heart disease, endocarditis, active malignancy, chronic liver or kidney diseases, calcium regulation disorders (hyperparathyroidism, hyperthyroidism, and hypothyroidism), and chronic or acute inflammatory states (sepsis, autoimmune disease, and inflammatory bowel disease) were considered exclusion criteria.
The demographic and clinical features of enrolled patients are viewable in Supplementary Table S1. After the surgical procedure, the aortic valve leaflets removed were collected and processed within 30 min. In detail, aortic leaflets were snap-frozen, paraffine-embedded, or used for “cells” isolation.
EPR analysis
As previously described, ROS measurements were conducted by using EPR spectroscopy (13, 38). Flash-frozen human aortic valve tissue (∼20 mg) was homogenized by using a hand-held homogenizer in phosphate-buffered saline (PBS; Lonza Group, Basilea, Swiss, Cod: LOBE17513F, pH 7.4) containing protease inhibitor cocktail (cOmplete™, Mini, EDTA-free Protease Inhibitor Cocktail; MilliporeSigma, Burlington, MA, Cod: # 11836170001, pH 7.0) and 0.1 mM of the metal chelator diethylenetriaminepentaacetic acid (DTPA; Sigma-Aldrich, St. Louis, MO, Cod: # 284025), at pH 7.4. Non-soluble fractions were removed by centrifugation at 15,000 g for 10 min (4°C).
The homogenates were kept on ice and analyzed immediately. Stock solutions of the spin probe 1-hydroxy-3-methoxycarbonyl-2,2,5,5-tetramethyl-pyrrolidine hydrochloride (CMH; Enzo Life Sciences, Farmingdale, NY, Cod: # ALX-430-117-M050) were prepared daily in nitrogen-purged 0.9% (w/v) NaCl (Hospira, Inc., Lake Forest, IL, Cod: #0409196602), 25 g/L Chelex 100 (Bio-Rad, Hercules, CA, Cod: # 1421253), and 0.1 mM DTPA, and they were kept on ice.
The samples were treated with 1 mM CMH at 37°C for 2 min, transferred to 50-μL glass capillary tubes, and analyzed immediately on a Bruker E-Scan (Billerica, MA) EPR spectrometer at room temperature. Spectrometer settings were as follows: sweep width, 100 G; microwave frequency, 9.75 GHz; modulation amplitude, 1 G; conversion time, 5.12 ms; receiver gain, 2 × 10³; and number of scans, 16. In all cases, the samples were in the linear response region. The EPR signal intensities were assessed by measuring the EPR signal peak-to-peak amplitude. The reported ROS levels represent EPR signal intensities normalized to the tissue “homogenates” protein concentrations as the Pierce BCA protein assay kit determined.
Immunohistochemistry
Aortic valve leaflets for histological analysis were washed three times in PBS 1 × (Lonza Group, Cod: LOBE17513F, pH 7.4); they were fixed in 4% formalin (Sigma-Aldrich; Cod: HT501128-4L, pH 6.9–7), dehydrated, included in paraffin (Vwr International Pbi S.R.L., Milan, Italy, Cod: T8234701-5), and cut into 5–7 μm slides. Before staining, slides were rehydrated, incubated in antigen retrieval solution (Target Retrieval Solution Citrate [pH 6], Dako Cytomation, Glostrup, Denmark, Cod: S169984-2) at 98°C for 20 min, and then cooled at room temperature for 20 min.
Slides were treated with 3% H2O2 to block endogenous peroxidase and then washed three times with 1 × PBS with 0.1% TritonX (Merk Life Science S.R.L., Milan, Italy, Cod: X100-100ML) (PBST). Blocking solution [PBST and 5% BSA (Sigma-Aldrich; Cod: 05482-25G)] was added and kept for 45 min at room temperature. Slides were incubated with primary mouse monoclonal anti-GR at 4°C overnight. Slides were washed three times with PBST and incubated with biotinylated anti-mouse secondary antibody for 60 min at room temperature.
Slides were washed three times, and the ABC complex was added and incubated for 30 min at room temperature. Slides were washed three times, and ImmPACT DAB Peroxidase (HRP) Substrate (Vector Laboratories, Burlingame, CA; PK6100) was added and left to react for 25 s. Slides were immediately rinsed in distilled H2O and then incubated for 10 s with hematoxylin (Agilent Technologies Italia Spa, Cernusco sul Naviglio, Italy).
Slides were dehydrated and mounted with EUKITT (Bio Optica, Milano, Italy, Cod: 09-00502), and images were taken with AxioScope (Carl Zeiss). The quantification of GR immunohistochemistry has been performed by implementing the ImageJ v1.50i software (NIH, Bethesda, MD) with the IHC Toolbox plugin. The automated color detection, which allows the generation of deconvoluted images, has been performed with the default model H-DAB for brown color detection. The integrated pixel density has been calculated on binary panoramic images and normalized with the total area of the section (pixel2).
Aortic valve endothelial “cells” isolation
The porcine aortic valves were obtained from healthy pig hearts intended for slaughter for food purposes. Isolation of endothelial valve cells from pigs (pVEC) and human (hVEC) patients enrolled was performed by using an implemented method previously described by our group (54, 62). Concisely, after removal, the aortic valve leaflets were incubated for 20 min at 37°C in a solution composed of 2 mg/mL type II collagenase (Worthington Biochemical Corp., Lakewood, NJ, Cod: CLS-2) and Advanced DMEM (AdDMEM; Thermo Fisher Scientific, Waltham, MA, Cod: 12491015) enriched with 10% FBS (Thermo Fisher Scientific; Cod: 26140079), 1% Penicillin-Streptomicin (Thermo Fisher Scientific; Cod: 15140122) solution.
After incubation, the loose endothelial layer was removed by pipetting the previously described solution onto the valve surface. The resulting cells were washed with PBS 1 × (Lonza Group, Cod: LOBE17513F, pH 7.4) and isolated by using Dynabeads® (CD31; Life Technologies, Carlsbad, CA, Cod: 1155D) conjugated with an endothelial marker, platelet endothelial cell adhesion molecule. Then, VECs were cultured in supplemented Medium 200 (M200; Thermo Fisher Scientific, Cod: M200500) on a 0.1% gelatin-coated (Sigma-Aldrich; Cod:G1890-100G) tissue culture plate (Corning® Costar®; New York, NY, Cod:CLS430167). All experiments were performed on cultured cells between the second and fifth passages.
In vitro model of oxidative stress and P-SSG
In vitro model of S-glutathionylation was prepared by transposing and implementing a method previously described by Valerio et al. (68). The GR and thioredoxin reductase systems were blocked (19), in pVEC, by using a specific compound known as 2-acetylamino-3-[4-(2-acetylamino-2-carboxyethylsulfanylthiocarbonylamino)phenylthiocarbamoylsulfanyl]propionic acid (2-AAPA; Sigma-Aldrich) titrating the dose as follows: 12.5, 25, 50, 75, and 100 μM. This compound was used as an internal control since 2-AAPA was dissolved in dimethyl sulfoxide (DMSO; Sigma-Aldrich, Cod: D8418-100ML).
The pVECs were treated with 2-AAPA in complete M200 medium for 4 h. After 24 h of recovery, protein levels and ROS production were evaluated. We found that the minimum effective dose of 2-AAPA in pVECs was 50 μM; therefore, we treated hVEC with this drug concentration and performed assays such as protein level GSH/GSSG, MTT, and apoptosis assessment by using this 2-AAPA dosage.
During the calcification assays, we challenged hVECs with different stimuli: (i) a pro-calcifying one, consisting of a standard medium supplemented with 2 mM inorganic phosphate (Pi Buffer: Sodium phosphate dibasic, [Sigma-Aldrich; Cod: 106586] titrated with Sodium phosphate monobasic [Sigma-Aldrich; 106586]) administered every 2 days while changing the medium every time; (ii) a pro-oxidative challenge by providing 2-AAPA (50 μM for 4 h) and changing the media every 2 days; and (iii) an antioxidant treatment encompassing 1 h of pretreatment with 2 mM N-acetyl-L-cysteine (NAC; Santa Cruz, CA, Cod: sc-202232A), followed by for 4 h with 2-AAPA (50 μM) + NAC (2 mM) and NAC (2 mM) was administered every 2 days while changing the medium. Each assay lasted 1 week.
Glutathione dosages
The two different forms of glutathione, reduced (GSH) and oxidized (GSSG), were detected in cell extracts obtained after treatment by the LC-MS/MS method, as previously described (63, 68). In detail, standard solutions were prepared daily by diluting the stock solutions of γ-L-glutamyl-L-cysteinyl-glycine (GSH; Sigma-Aldrich, Cod: G4251), and γ-L-glutamyl-L-cysteinyl-glycine disulfide (GSSG, product number: G4376; Sigma-Aldrich) with 0.1% formic acid.
Chromatographic separation was conducted on a Luna PFP analytical column (100 × 2.0 mm, 3 μm; Phenomenex, Torrance, CA, 00D-4447B0) under isocratic conditions with 99% mobile phase A (ammonium formate 0.75 mM adjusted to pH 3.5 with formic acid) and 1% mobile phase B (methanol; Merk Life Science S.R.L., Cod: 322415), at a flow rate of 200 μL/min and a column temperature of 35°C. The total run time per sample was 10 min, and all injection volumes were 10 μL. Mass spectrometric analysis was performed by using a TSQ Quantum Access (Thermo Fisher Scientific) triple quadrupole mass spectrometer coupled with electrospray ionization operated in multiple reaction monitoring (MRM) in positive mode.
The MRM for GSH (m/z 308.1→m/z 76.2 + 84.2 + 161.9) and GSSG (m/z 613.2→m/z 230.5 + 234.6 + 354.8) were performed with collision energy optimized for each compound. The operating conditions for the MS analysis were as follows: spray voltage, 2500 V; capillary temperature and voltage, 280°C and 35 V, respectively; sheat gas and auxiliary gas flow, 30 and 5 AU, respectively; and tube lens offset, 84 V for GSH and 115 V for GSSG. The mass spectrometer was employed in the MS/MS mode by using argon as collision gas.
Data acquisition and analysis were performed with Xcalibur® software, version 2.0 (Thermo Fisher). After comparing calibration curves, data were obtained by using GSH (Sigma-Aldrich; GA251) and GSSG (Sigma-Aldrich; GA376) pure standard solutions. The intra- and inter-CVs (%) obtained with standard samples were <5% for both the analytes. The detection limits were 0.031 μM for GSH and 0.008 μM for GSSG.
Dot blot and Western blot analyses
Human aortic valve tissue and VECs isolated from human and porcine specimens were lysed in RIPA Buffer 1 × (Igepal 1% (Sigma-Aldrich; Cod: I8895-50ML), sodium dodecyl sulfate (SDS; Sigma-Aldrich, Cod: L3771-25G) 0.1%, 50 mM Tris-HCl (Sigma-Aldrich; Cod: T446-100G), 150 mM NaCl, 0.5% sodium deoxycholate (Sigma-Aldrich; Cod: D6750), and 1 mM EDTA (Sigma-Aldrich; Cod: E4884, pH 7.5), with protease and phosphatase inhibitors (Thermo Fisher Scientific; Cod: 88665 and 88667, respectively).
All cell samples were pre-treated with 10 mM N-ethylmaleimide (NEM; Thermo Fisher Scientific, Cod: 23030) for 5 min in a complete medium before lysis to alkylate the free thiols and thus avoid the formation of artifacts during protein glutathionylation detection. After quantification with BCA Protein Assay Kit (Thermo Fisher Scientific; Cod: 23225), total protein extracts from tissues were subjected to dot Blot, whereas total protein extracts from cells were subjected to SDS-page under non-reducing conditions for GSH detection and under reducing conditions for CD31 (Cell Signaling, Danvers, MA; Cod: #3528), MMP2 (Novus Biologicals, Minneapolis, MN; Cod: NB200-193SS), TIMP2 (Cell Signaling; Cod: #5738) detection.
All Western blot experiments were carried out by using gel with the gradient percentage of polyacrylamide, from 4% to 12% (Bolt™ 4 to 12%, Bis-Tris, 1.0 mm, Mini Protein Gel, 10-well; Thermo Fisher Scientific, Cod: NW04120BOX). Runs were performed with the running buffer MOPS SDS 1 × (Thermo Fisher Scientific; Cod: NP0001, pH 7.7) at constant 200V. Then, the proteins were transferred onto a nitrocellulose membrane, using the iBlot Transfer Stacks (Thermo Fisher Scientific; Cod: IB301002) with iBlot1 Gel Transfer Device (Thermo Fisher Scientific).
For blocking non-specific sites, the membranes were treated for 30 min at room temperature in 5% skim milk (Sigma-Aldrich; Cod: 70166-500G), dissolved in Wash Buffer (Tris Buffer Sulfate 1 × , 0.1% Tween 20; Sigma-Aldrich, Cod: T4661-100G and Pi379 respectively, pH 7.6), and finally incubated O/N at 4°C, slowly stirring, with the appropriate primary antibody.
We used Ponceau (Sigma-Aldrich; Cod: P3504-10G) and β-Actin (Cell Signaling; Cod: #4970) as loading controls, respectively, for Dot blot and Western blot; GSH (Santa Cruz, CA, Cod: sc-52399), yH2AX (Cell Signaling; Cod: #9718S), CD31 (Cell Signaling; Cod: #3528), MMP2 (Novus Biologicals; Cod: NB200-193SS), and TIMP2 (Cell Signaling; Cod: #5738) to detect target protein. Then, Dot blot and Western blot membranes were washed to remove any excess of primary antibody and incubated, respectively, with peroxidase-conjugated secondary antibody (Peroxidase-AffiniPure Sheep Anti-Mouse IgG, F(ab’)2Fragmnwnt Specific; Jackson ImmunoReserch Laboratories, Inc., Baltimore Pike, PA, Cod: 515-035-072) and IRDye conjugated secondary antibody (LI-COR Biosciences, Lincoln, NE, IRDye 800CW Donkey anti-Mouse Cod: 925-32212 and IRDye 680RD Donkey anti-Rabbit Cod: 925-68073) for 1h in the first case and 20 min in the second case at room temperature.
Finally, the membranes were washed to remove any excess secondary antibody, and images were acquired by using the Alliance Mini 2M (UVITec, Cambridge, United Kingdom) and the Odyssey Infrared Imaging System (LI-COR Biosciences). Densitometry analysis was performed by using the software ImageJ (Version 1.48v – National Institute of Health).
Tetrahydrobiopterin ELISA kit
Protein cell lysates, previously prepared after 4 h of 2-AAPA (Sigma-Aldrich; Cod: A4111) 50 μM treatment and 24 h of recovery, were loaded into the microplate provided in the kit pre-coated with BH4 (Tetrahydrobiopterin ELISA Kit [Colorimetric] [Novus Biological, a Biotecne Brand, MN, Cod: NBP2-74983]). The ELISA assay was carried out in accordance with manufacturing instructions. Finally, the enzyme-substrate reaction was measured spectrophotometrically at a wavelength of 450 nm by using the microplate reader (TECAN pro infinite M200). The concentration of BH4 in the sample was then determined by comparing the OD of the samples with the standard curve. The pg/mL of BH4 found were normalized to the mg/mL of protein measured with BCA Kit.
Intracellular ROS and NO detection
The pVECs were grown to sub-confluency in 60 mm plates (Corning® Costar®; 430166) coated with 0.1% of gelatin (Sigma-Aldrich; Cod: G1890-100G) in a complete M200 medium (M200; Thermo Fisher Scientific, Cod: M200500). Similarly, hVECs were seeded in 96-well plates coated with 0.1% gelatin. After 4 h of 2-AAPA (Sigma-Aldrich; Cod: A4111) 50 μM treatment and 24 h of recovery, ROS detection was performed by CellROX® green Assay Kit (Thermo Fisher Scientific; Cod: C10492), executed following the manufacturer's instruction. The staining for pVECs was analyzed by ImageStream X imaging flow cytometer (ImageStream X Mark II, Amnis).
The analysis was performed by using the IDEAS 6.2 software. In parallel, in hVECs, using a system of automated live-cell imaging (IncuCyte S3, Sartorius, Gottingen, Germany), we assessed ROS, by CellROX green Assay Kit, and nitric oxide (NO) levels, by 4-Amino-5-Methylamino-2',7'-Difluorofluorescein Diacetate (DAF-FM; Thermo Fisher Scientific, Cod: D23841).
MTT assay
hVECs and pVECs were seeded in 96-well plates coated with 0.1% gelatin (Sigma-Aldrich; Cod: G1890-100G) in a complete M200 (Thermo Fisher Scientific; Cod: M200500) growing medium. After cell adhesion, a starvation protocol was carried out overnight in M200 without FBS. After 1 day, starvation was terminated, and the cells were treated with 2-AAPA (Sigma-Aldrich; Cod: A4111) in M200 with 0.5% FBS. After the 4 h of treatment and 24 h of recovery, the medium was removed, and the 3-(4, 5-dimethyl thiazolyl-2)-2,5-diphenyltetrazolium bromide (MTT; Sigma-Aldrich, Cod: M2128) solution (0.5 mg/mL) was added into each well and incubated at 37°C, 5% CO2 for 4 h.
After incubation, the MTT solution was discarded, and DMSO (Sigma-Aldrich; Cod: D8418-100ML) was added to each well and incubated for 10 min. Finally, the corresponding absorbance was measured by using the microplate reader (TECAN pro infinite M200) at a dual wavelength of 590 and 620 nm (reference).
Flow cytometry, apoptosis protein profiling, and mitochondrial damage
Annexin V (Thermo Fisher Scientific; Cod: V13241), a standard marker of apoptotic cells, was used to measure apoptosis levels after 2-AAPA treatments. Annexin V assay was performed on hVECs by using ImageStream X imaging flow cytometer (ImageStream X Mark II, Amnis). The hVECs were treated for 4 h with 2-AAPA 50 μM (Sigma-Aldrich; Cod: A4111), and afterward, they were subjected to 24 h of recovery in M200 (Thermo Fisher Scientific, Cod: M200500). Subsequently, cells were detached by an enzymatic method that was able to prevent damage to cell plasma membranes (TripLE™ Select Enzyme (1 × ) no phenol red (Thermo Fisher Scientific; Cod: 12563029), re-suspended in 100 μL of FACS buffer (PBS 1 × ; Lonza Group, Cod: LOBE17513F pH 7.4) supplemented with 0.1% BSA (Sigma-Aldrich, Cod: 05482-25G) and 5 mM Ethylenediaminetetraacetic acid disodium salt dihydrate (EDTA; Sigma-Aldrich, Cod: E4884)), and they were incubated in the dark for 15 min with the antibody Annexin V conjugated with Alexa Fluor488.
After incubation and washing with the FACS buffer, the cells were centrifuged for 10 min at 400 g to remove the unbound antibody eventually. Finally, cells were re-suspended in 100 μL of FACS buffer and after adding Propidium Iodide (Thermo Fisher Scientific; Cod: BMS500PI) analyzed at cytofluorimeter. The same procedure was performed for detecting mitochondrial localization and their superoxide production.
Particularly, after detachment, when re-suspended in 100 μL of FACS buffer, cells were incubated with MitoTraker (a fluorescent dye that stains mitochondria in live cells and it is used for mitochondrial localization [Thermo Fisher Scientific; Cod: M22426]) and MitoSox (a reagent that permeates live cells and is rapidly oxidized by superoxide but not by other ROS or reactive nitrogen species [Thermo Fisher Scientific; Cod: M36008]) for 30 min at 37°C. The hVECs were gated on a side scatter-forward scatter dot plot to eliminate cell debris, and a total of 20,000 events in the hVECs gated area were acquired. Acquisition analysis was performed, thanks to the Kaluza software (Beckman Coulter, Brea, CA) and IDEAS 6.2 software (Luminex, Austin, TX).
For protein profiling, we used arrays provided by Human Apoptosis Array Kit (R&D systems, Minneapolis, MN; Cod: ARY009). We spotted total protein extract from stenotic cells treated with DMSO (Sigma-Aldrich; Cod: D8418-100ML) and 2-AAPA 50 μM and performed the procedure according to the manufacturer's instructions. The images were acquired by using the Alliance Mini 2M (UVITec), and densitometry analysis was performed by using the software ImageJ (Version 1.48v – National Institute of Health).
Immunofluorescence
The hVECs were seeded in 15 μM-Slide eight-well (Ibidi, Gräfelfing, Germany, Cod:80826) plates coated with 0.1% gelatin (Sigma-Aldrich; Cod: G1890-100G) in a complete M200 (Thermo Fisher Scientific, Cod: M200500) growing medium. After the 4 h of treatment with 2-AAPA 50 μM (Sigma-Aldrich; Cod: A4111) and 24 h of recovery, the medium was removed, and the cells were fixed in 4% formalin (Sigma-Aldrich; Cod: HT501128-4L, pH 6.9–7) for 15 min.
After two washes with PBS 1 × (Lonza Group, Cod: LOBE17513F, pH 7.4), cells were incubated for 10 min with methanol (kept at −20°C) to ensure permeabilization. Two washes with PBS 1 × were carried out to remove excess methanol (Merk Life Science S.R.L.; Cod: 322415), and immediately afterward, the solution to block non-specific sites comprising 5% BSA (Sigma-Aldrich; Cod: 05482-25G), 0.5% donkey serum (Sigma-Aldrich; Cod: D9663), and 0.2% tritonX100 (Merk Life Science S.R.L.; Cod: X100-100ML) was added to the wells and incubated for 30 min at room temperature.
After two washes in PBS 1 × , cells were incubated O/N in blocking solution with primary antibody against GSH (Santa Cruz, CA, Cod: sc-52399) and β-Actin (Cell Signaling; Cod: #4970). After two washes with PBS 1 × , the cells were incubated with anti-mouse Alexa Fluor 488 secondary antibody (Abcam, Cambridge, United Kingdom, Cod: ab150113) for detection of GSH and anti-Rabbit Alexa Fluor 647 (Abcam; Cod: ab150075) for β-Actin detection. A drop of Vectashield Mounting Medium with Dapi (D.b.a Italia S.r.l., Milan, Italy, Cod: H-1200-10) was used to color the nuclei blue. The images were taken with a confocal microscope (Carl Zeiss).
Calcium deposition quantification
After removing the culture media, extracellular calcium crystals were dissolved under gentle agitation with 0.6 M hydrochloric acid (HCl; Sigma-Aldrich, Cod: 320331) for 5 h. Subsequently, HCl samples were recovered and stored at +4°C; meanwhile, the layer of cells present in each well was treated with 0.1 M sodium hydroxide (NaOH; Sigma-Aldrich, Cod: 30620) and 0.1% SDS (Sigma-Aldrich, Cod: L3771-25G) to ensure cellular lysis necessary for total protein quantification. Extracellular calcium quantification was performed by using a calcium colorimetric assay kit (BioVision, Milpitas, CA, Cod: K380) following the manufacturing company's protocol. The absorbance was read off at the Infinite® 200pro (TECAN) spectrophotometer.
Statistical analysis
Data analysis was performed by using Graph Pad Prism Software 7 and IBM SPSS Statistic 26. All continuous variables were represented as mean ± standard error of the mean (SEM), whereas categorical ones were represented in percentage (%). The comparison of data was carried out through non-parametric tests for comparisons between only two groups and analysis of variance (one-way ANOVA) with Tuckey correction for comparison between more than two groups. Further, a test for trends was performed to evaluate dose-response effects in the different groups regarding the stages of pathologies. The values of p ≤ 0.05 were treated as statistically significant.
Footnotes
Acknowledgment
The authors thank the Cardiovascular Imaging Area and the Cardiovascular Surgery Area of the Centro Cardiologico Monzino IRCCS for echocardiographic data and specimen collection.
Authors' Contribution
P.P. and V.V. conceived and designed the study. G.K. and N.P. substantially contributed to the design of the work. V.V., G.K., D.M., and B.P. acquired the data. V.V. and I.M. analyzed the data. V.V., M.C., P.S., A.S.M., V.A., D.M., V.A.M., M.Z., N.P., and P.P. interpreted the data. V.V. drafted the work. G.K., B.P., M.C., I.M., P.S., A.S.M., V.A., D.M., V.A.M., M.Z., N.P., and P.P critically revised the work for important intellectual content. All the authors gave their final approval to the present version of the work, and all the authors agreed to be accountable for all aspects of the work.
Author Disclosure Statement
No competing financial interests exist.
Funding Information
This work was supported by the Italian Ministry of Health funds (Ricerca Finalizzata: GR-2018-12366423) and by Fondazione Gigi e Pupa Ferrari ONLUS (FPF-14). G.K. is supported by the T32 NIH training grant (T32AG058527) and funds from the Johns Hopkins University Older American Independence Center of the National Institute on Aging (NIA) under award number P30AG021334. NP is supported by NIH (R01 HL136918).
Supplementary Material
Supplementary Table S1
Supplementary Figure S1
Supplementary Figure S2
Supplementary Figure S3
Supplementary Figure S4
Supplementary Figure S5
Supplementary Figure S6
Supplementary Figure S7
Abbreviations Used
References
Supplementary Material
Please find the following supplemental material available below.
For Open Access articles published under a Creative Commons License, all supplemental material carries the same license as the article it is associated with.
For non-Open Access articles published, all supplemental material carries a non-exclusive license, and permission requests for re-use of supplemental material or any part of supplemental material shall be sent directly to the copyright owner as specified in the copyright notice associated with the article.
