




Abstract
Aims:
Huntington's disease (HD) is an autosomal-dominant neurodegenerative disorder with no effective therapies. Mutant huntingtin protein (mHTT), the main HD proteinaceous hallmark, has been linked to reactive oxygen species (ROS) formation and mitochondrial dysfunction, among other pathological mechanisms. Importantly, Src-related kinases, c-Src and Fyn, are activated by ROS and regulate mitochondrial activity. However, c-Src/Fyn involvement in HD is largely unexplored. Thus, in this study, we aimed at exploring changes in Src/Fyn proteins in HD models and their role in defining altered mitochondrial function and dynamics and redox regulation.
Results:
We show, for the first time, that c-Src/Fyn phosphorylation/activation and proteins levels are decreased in several human and mouse HD models mainly due to autophagy degradation, concomitantly with mHtt-expressing cells showing enhanced TFEB-mediated autophagy induction and autophagy flux. c-Src/Fyn co-localization with mitochondria is also reduced. Importantly, the expression of constitutive active c-Src/Fyn to restore active Src kinase family (SKF) levels improves mitochondrial morphology and function, namely through improved mitochondrial transmembrane potential, mitochondrial basal respiration, and ATP production, but it did not affect mitophagy. In addition, constitutive active c-Src/Fyn expression diminishes the levels of reactive species in cells expressing mHTT.
Innovation:
This work supports a relevant role for c-Src/Fyn proteins in controlling mitochondrial function and redox regulation in HD, revealing a potential HD therapeutic target.
Conclusion:
c-Src/Fyn restoration in HD improves mitochondrial morphology and function, precluding the rise in oxidant species and cell death. Antioxid. Redox Signal. 38, 95–114.
Innovation
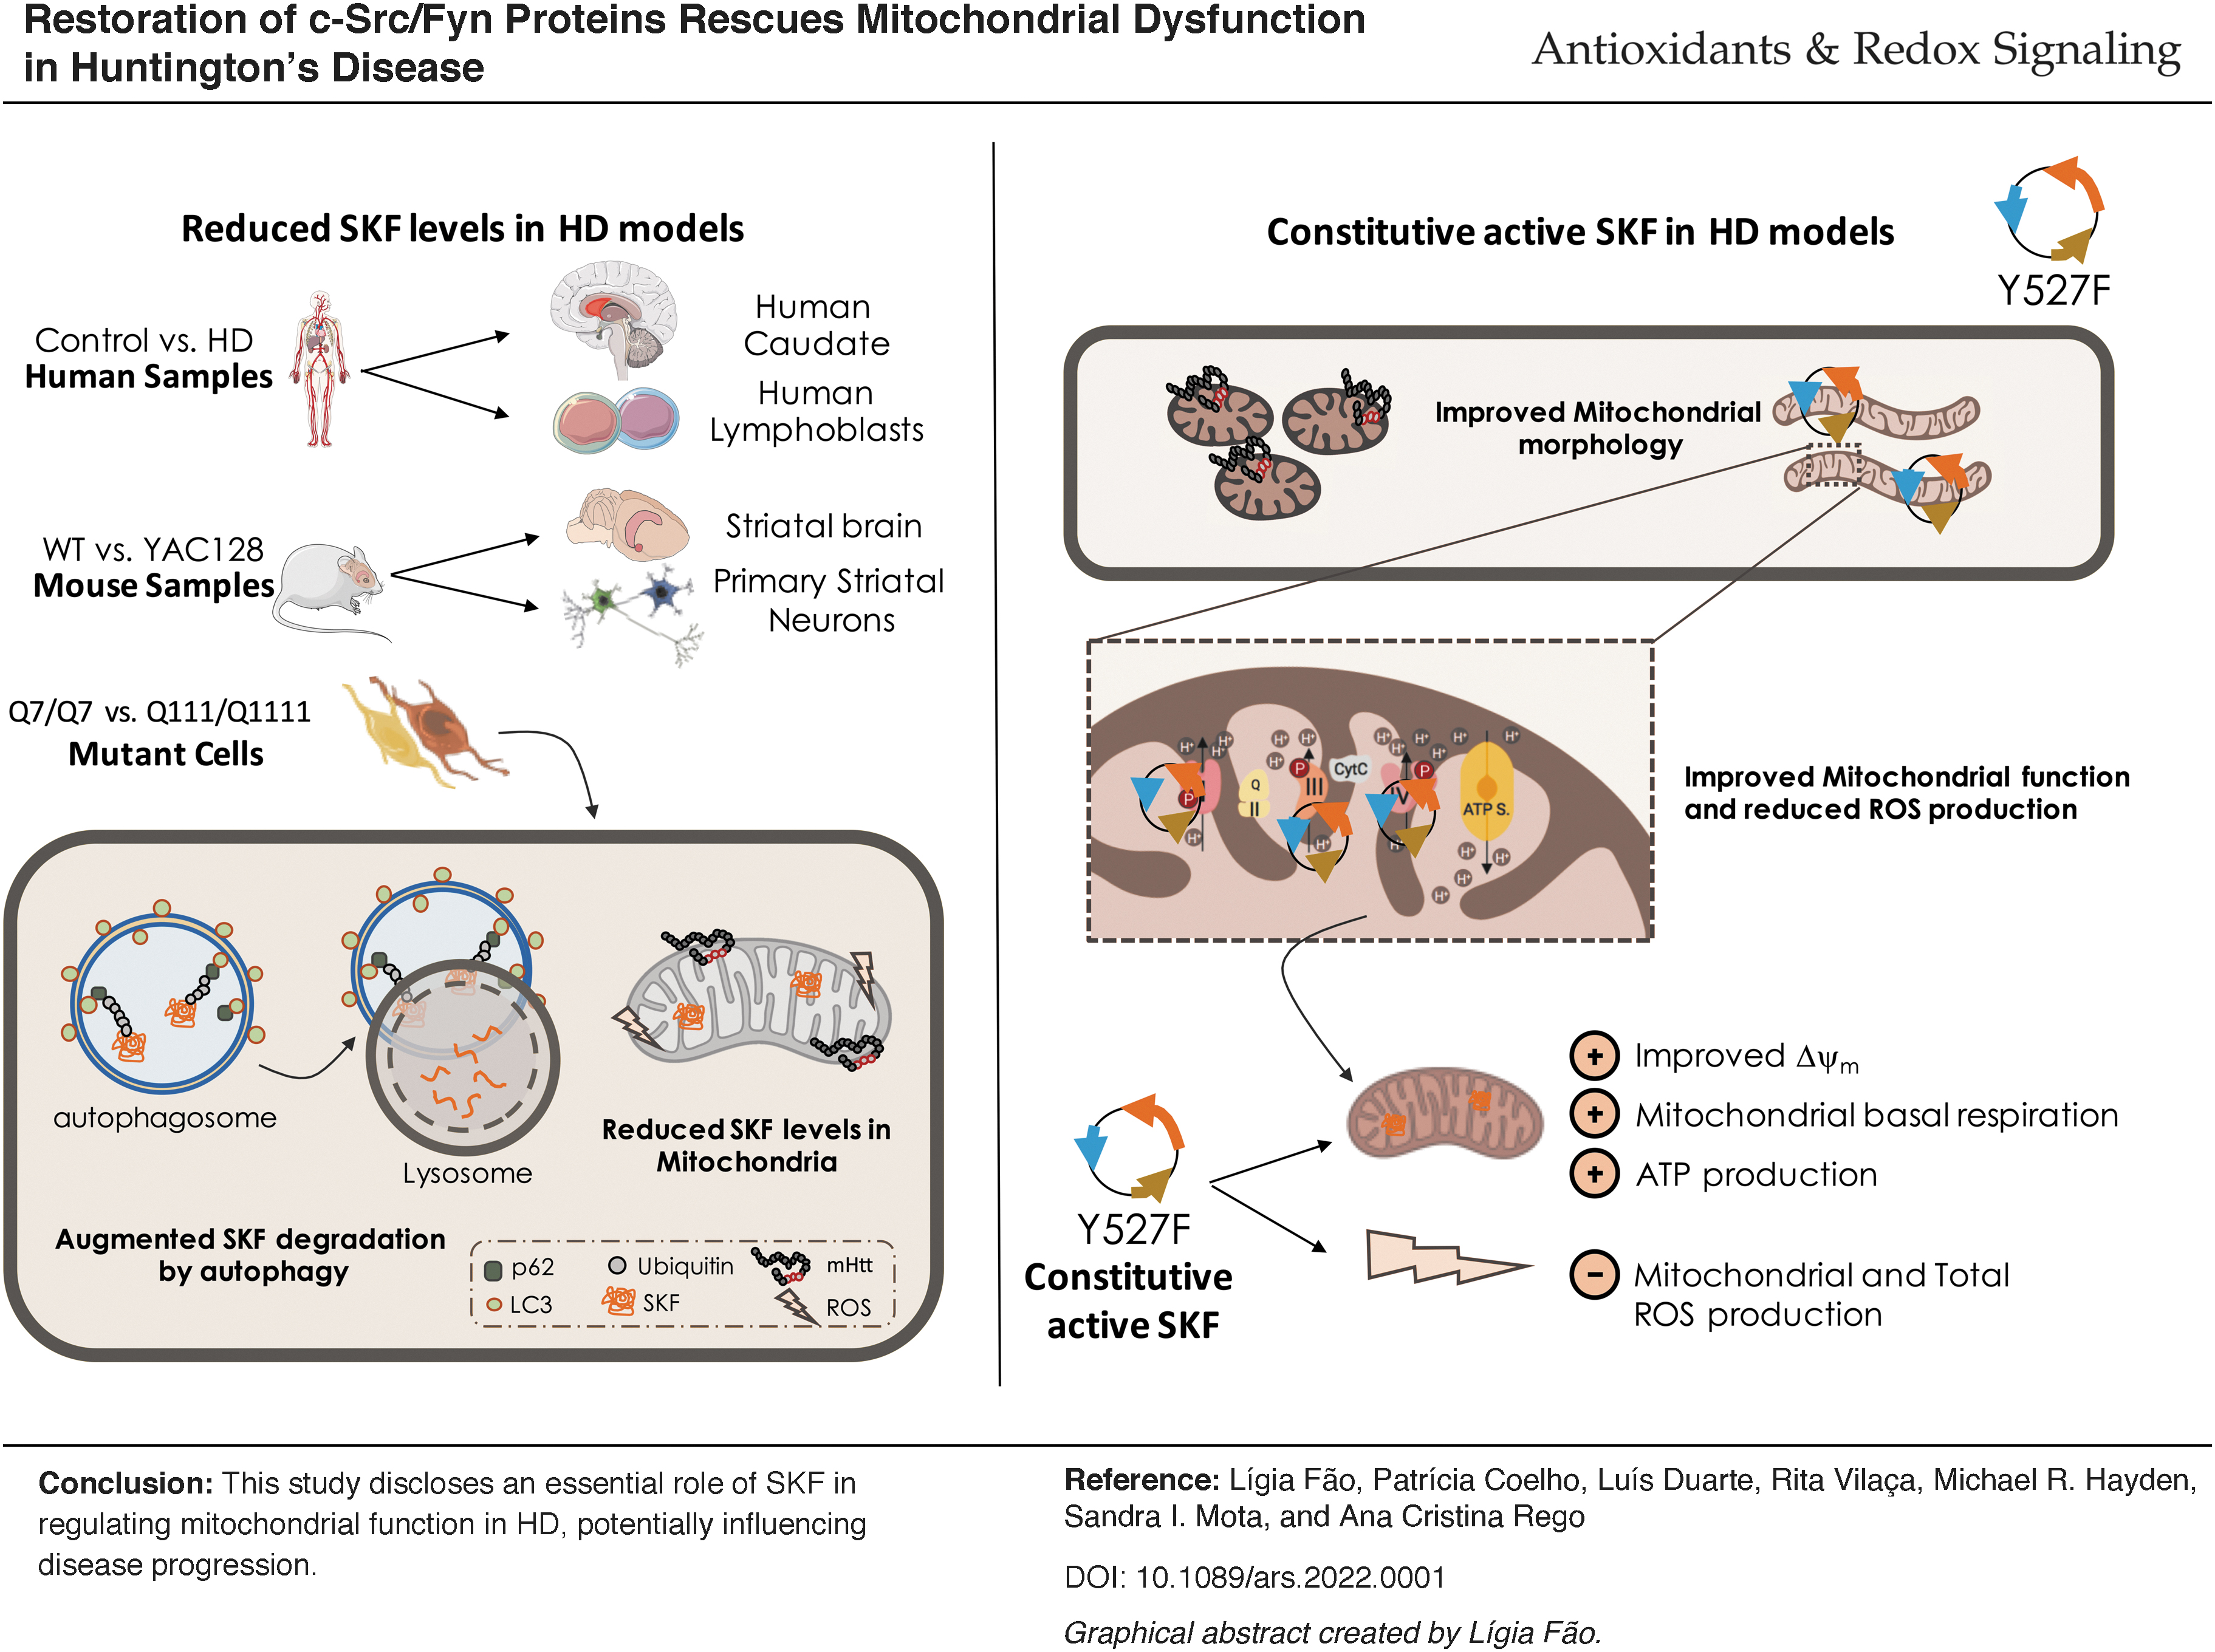
Our study provides the first evidence that c-Src and Fyn proteins are reduced in Huntington's disease (HD) models, including in HD mitochondria. c-Src and Fyn proteins are decreased in HD due to degradation through autophagy. Moreover, reduced c-Src and Fyn protein levels are accompanied by a decrease in c-Src/Fyn active form(s). Decreased Fyn mitochondrial co-localization correlates with HD-related mitochondrial dysfunction and altered morphology, and it increases reactive/oxidant species levels. Importantly, the restoration of active Src kinase family (SKF) levels significantly alleviates mutant huntingtin protein (mHTT)-induced mitochondrial deregulation. Therefore, c-Src and Fyn may constitute essential proteins whose deficits contribute to HD etiopathogenesis and thus should be considered as potential HD therapeutic target(s) (as shown in the Graphical Abstract).
Introduction
Huntington's Disease (HD) is an autosomal-dominantly inherited neurodegenerative disorder for which there is no cure. HD is caused by an abnormal expansion of cytosine, adenine, and guanine (CAG) triplets encoding for an abnormally long polyglutamine (polyQ) tract (6) in the coding region of the ubiquitously expressed HTT gene, encoding for mutant huntingtin protein (mHTT) (17). Clinically, HD symptoms include psychiatric and behavioral disturbances, cognitive dysfunction, involuntary motor movement, and progressive dementia (17, 30).
Neuropathologically, HD is characterized by selective neurodegeneration of medium spiny neurons in striatum (caudate and putamen), with a dorsomedial to ventrolateral direction (37). Huntingtin protein (HTT) aggregates intracellularly and causes cytotoxicity, associated to protein clearance pathways inhibition, mitochondrial and synaptic dysfunction, altered Ca2+ handling, endoplasmic reticulum stress, impaired gene transcription, and translation, among other defective pathways (6).
Mitochondrial dysfunction is one of the major early relevant pathogenic mechanisms in HD. Several studies reported ultrastructural defects in mitochondria isolated from postmortem HD cortical tissue and compromised oxidative function and ATP synthesis in pre-symptomatic HD carriers [e.g., Saft et al. (31)]. Moreover, decreased activity of mitochondrial complexes II–IV was observed in an HD patient's postmortem striata, human peripheral cells, and animal brains (24).
In accordance, isolated brain mitochondria from the caudate nucleus of HD patients (45) and different HD cellular (e.g., human neuroblastoma cells and platelets, mouse striatal STHdh Q111/Q111 cells) and animal models [Hdh(CAG)150 knock-in mouse] showed HTT fragments in close contact with mitochondria (3, 23, 38), supporting a direct effect of mHTT on mitochondrial function.
Autophagy is an essential catabolic mechanism in neuronal homeostasis and survival [e.g., Komatsu et al. (13)]. Several HD models showed dysfunctional autophagy, suggesting that macroautophagy dysregulation contributes to neurotoxicity. Martinez-Vicente et al. evidenced an increase in the number of autophagic vacuoles in several HD models (e.g., primary neurons, striatal cell lines, and fibroblasts) that did not undergo autophagy-mediated degradation mainly due to deficient cargo recognition (16).
Fyn and c-Src, two members of the Src kinase family (SKF), are involved in several cellular processes, specifically regulation of neuronal ion channels activity, cell differentiation, signal transduction, and general metabolism (29, 44). SKF proteins can be directly and indirectly activated by hydrogen peroxide (H2O2), since they are redox-sensitive (2). Interestingly, c-Src/Fyn kinases were identified in the intermembrane space of highly purified rat brain mitochondria (32). Moreover, c-Src/Fyn modulated brain mitochondrial respiration through the phosphorylation of complexes I, III, and IV (22).
Indeed, increased reactive oxygen species (ROS) production and mitochondrial dysfunction are important features of HD ethiopathogenesis, whereas c-Src and Fyn proteins have several important roles in mitochondrial normal function and can be activated by ROS. However, the involvement of Src/Fyn in HD pathogenesis is still largely unexplored. In the context of mHTT expression, a previous study described the role of Src in Tyr phosphorylation of GluN2B subunits only (40). Herein, we determined the changes in c-Src/Fyn total and activated/phosphorylated protein levels in several HD models, analyzed their degradation process, and determined the role of Src/Fyn kinases in HD-associated mitochondrial impairment.
Our results evidence a decrease in Src and Fyn levels in HD due to autophagy degradation; this coincides with altered mitochondrial morphology and impaired function, and enhanced ROS levels. Importantly, data point out the therapeutic potential of modulating Src/Fyn activation/levels to alleviate HD cytopathological features.
Results
Enhanced Src and Fyn protein degradation in different HD models
The SKF members have not been thoroughly explored earlier in the context of HD. Therefore, we first analyzed c-Src and Fyn total and activated levels, with the later using an anti-P-Tyr416-SKF antibody, in several models of HD by Western blotting and immunocytochemistry. Postmortem human caudate from HD patients presented reduced c-Src and Fyn total levels, when compared with control individuals (Fig. 1A, B and Supplementary Fig. S7). No significant changes were observed in the postmortem human parietal cortex from HD patients (Supplementary Figs. S1A, B and S7).
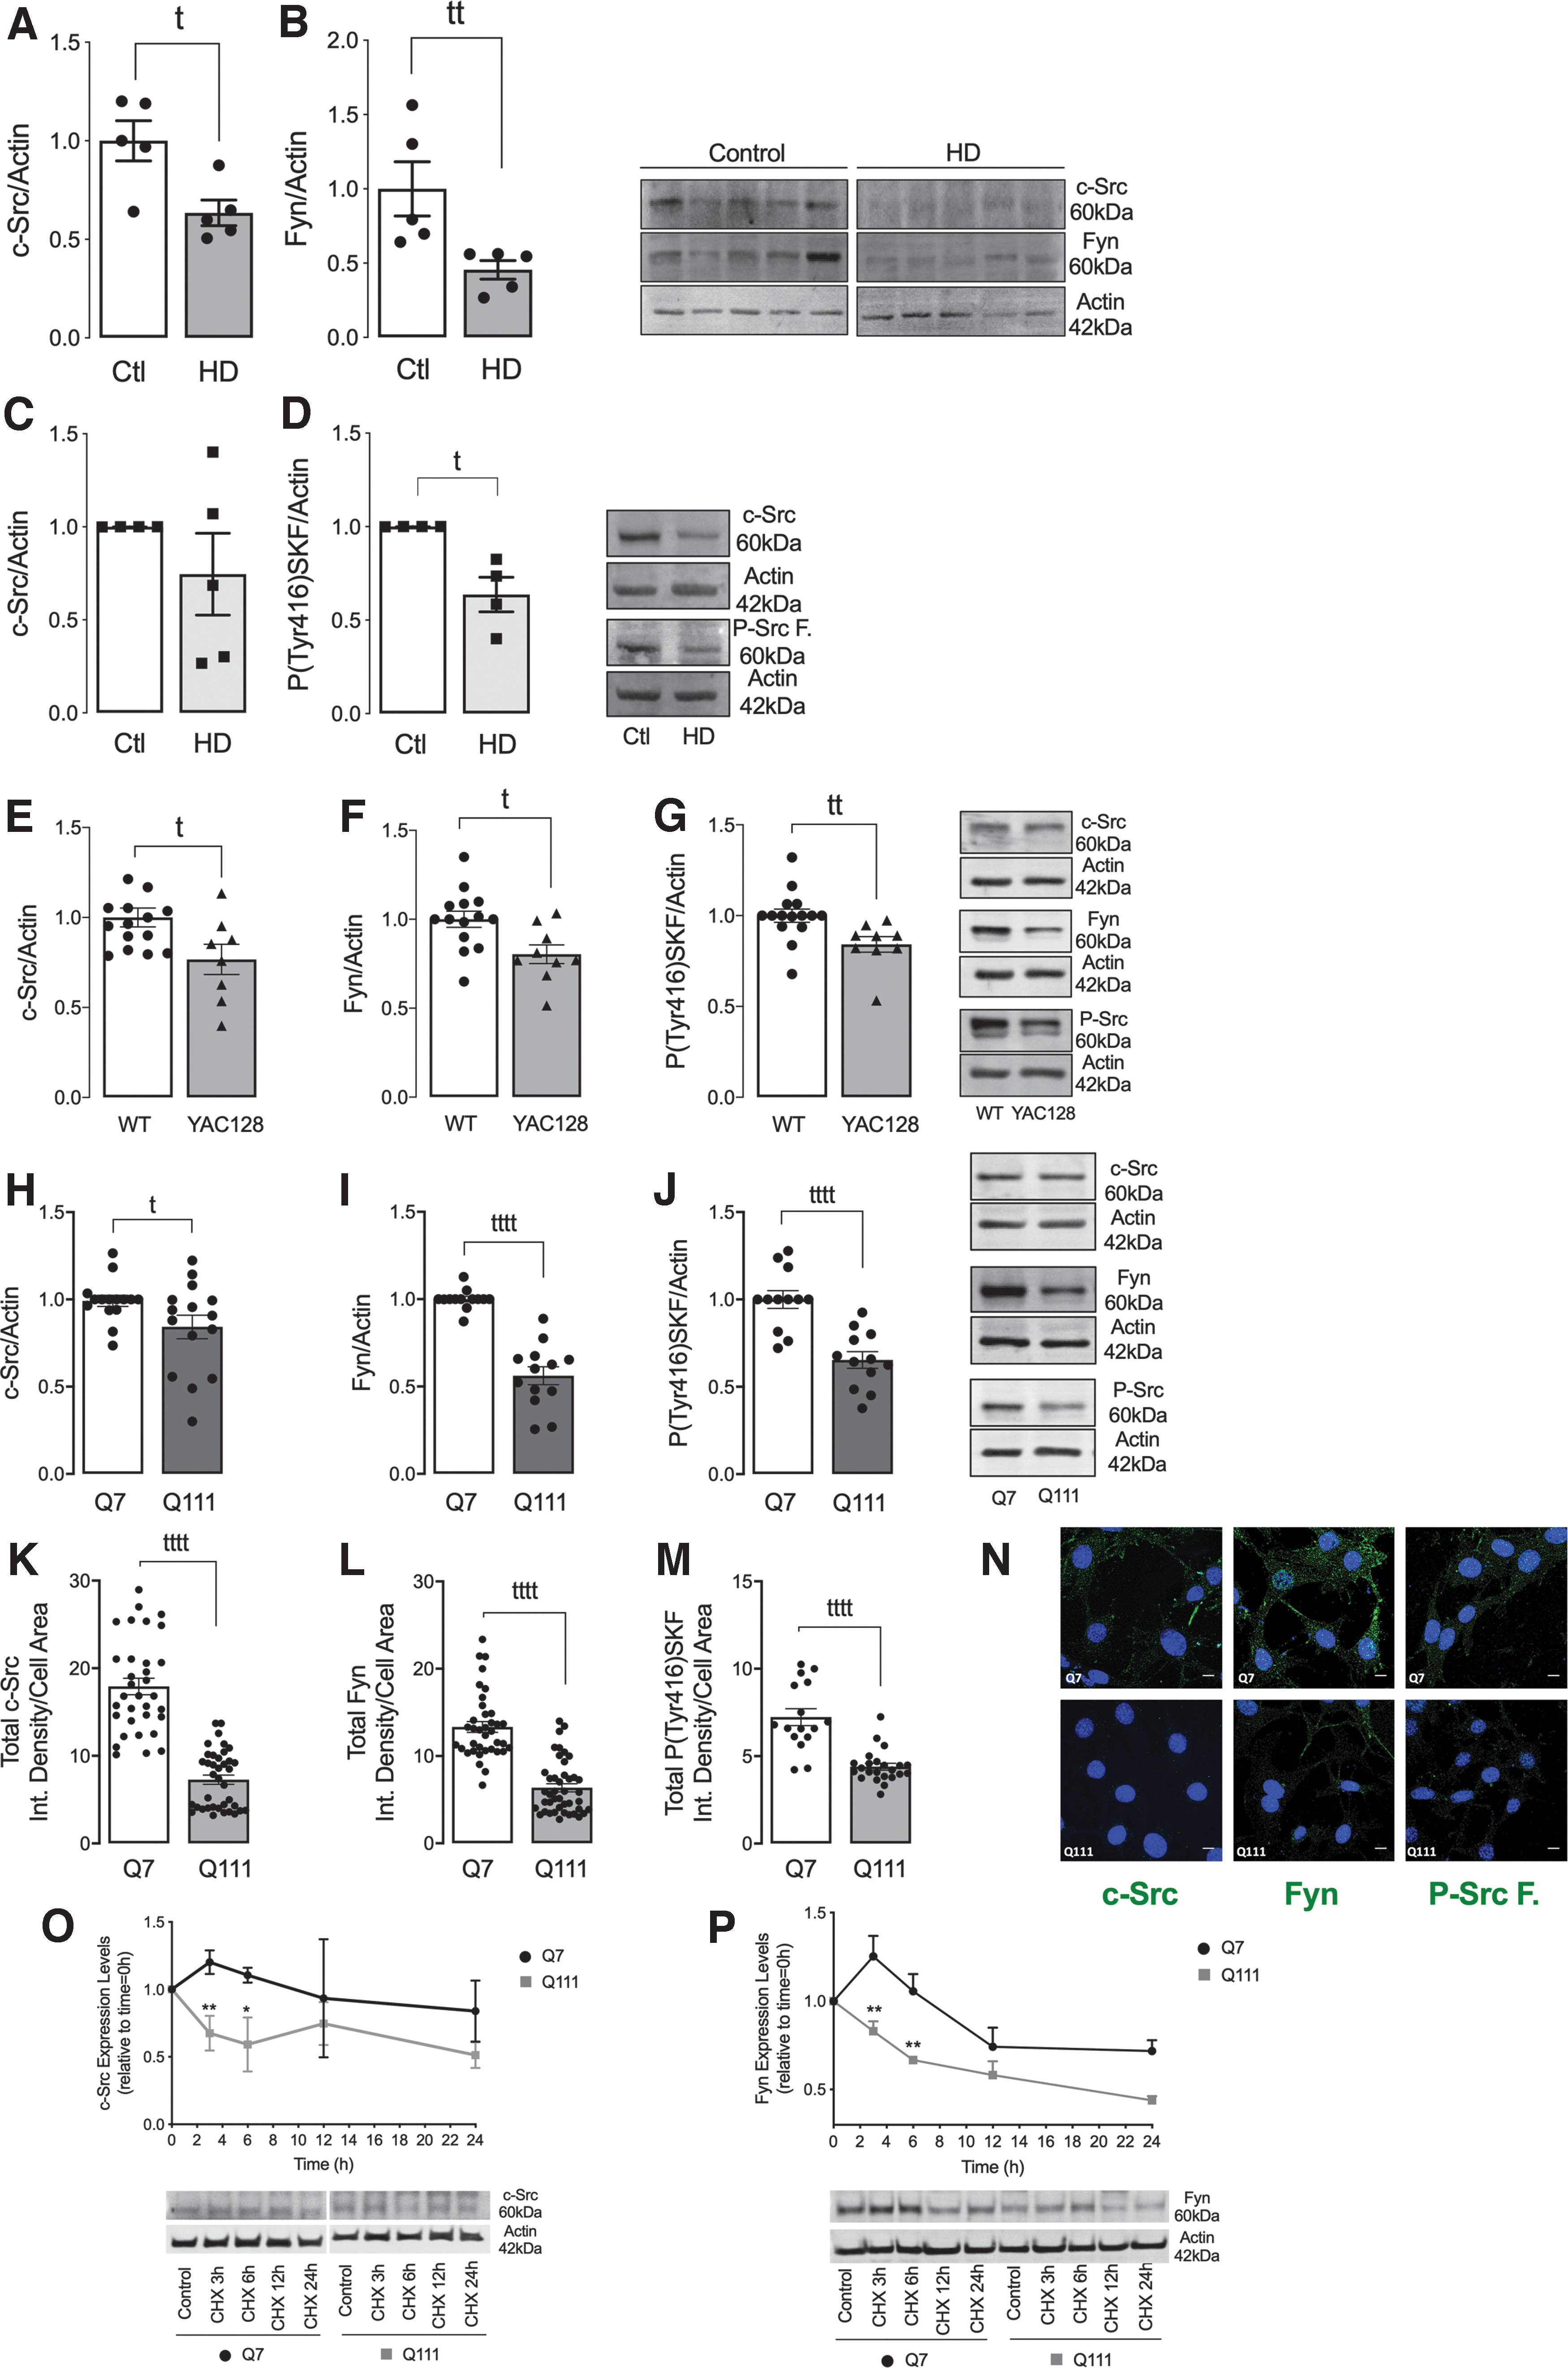
Moreover, in peripheral cells, namely lymphoblasts derived from HD affected patients containing heterozygous expansion mutation, we observed a significant decrease in the levels of P-Tyr416-SKF when compared with unaffected voluntary control siblings, suggesting reduced activated Src and Fyn, and a trend for decreased total c-Src protein levels (Fig. 1C, D and Supplementary Fig. S7). Primary striatal neurons from YAC128 transgenic mice (Fig. 1E, G and Supplementary Fig. S8) also evidenced a decreased in both c-Src and Fyn total and phosphorylated/active protein levels.
Similar results were observed in knock-in striatal STHdh Q111/Q111 cells (hereafter Q111 cells) by Western blotting (Fig. 1H, J and Supplementary Fig. S8), and immunocytochemistry (Fig. 1K–N), when compared with Q7/control cells. Moreover, striatal and cortical tissue isolated from 3-month-old YAC128 transgenic mice, at early symptomatic stage, presented reduced total and phosphorylated Fyn levels (Supplementary Fig. S2A–F and Supplementary Figs. S15–S18). Altogether, data indicate diminished c-Src/Fyn total levels and activation consistently across different human and mouse HD models.
The SKF members have been reported to act as redox-sensitive Tyr kinase, regulated by H2O2. Considering that our results evidence an impairment in c-Src/Fyn activation in HD models, we evaluated c-Src/Fyn response to oxidative stress in Q7/Q111 cells (Supplementary Fig. S3 and Supplementary Fig. S19). Cells were exposed to 100 μM H2O2 for 30 min and 1 h, and levels of total and Tyr416 phosphorylated c-Src/Fyn were measured in total extracts. Our results evidence significant increased total Fyn and phosphorylated SKF levels after H2O2 exposure (1 h) in Q7 cells, whereas no differences were disclosed in Q111 cells, reinforcing the idea of an impairment in the activation pathway of SKF in this model.
To assess whether reduced c-Src/Fyn protein levels in HD models are related to decreased gene expression, we evaluated c-Src and Fyn messenger RNA (mRNA) levels. No differences between Q7 and Q111 cells or between YAC128 and wild-type (WT) primary striatal neurons were observed regarding c-Src and Fyn mRNA levels (Supplementary Fig. S4), indicating that decreased SKF levels is unrelated with altered gene transcription. Therefore, we then assessed c-Src/Fyn protein degradation kinetics using the cycloheximide (CHX, a protein synthesis inhibitor) chase assay (Fig. 1O, P and Supplementary Fig. S9). Our results show a significant decrease in c-Src and Fyn total levels in Q111, when compared with Q7 cells, after 3 and 6 h CHX treatment, which is maintained thereafter, indicating increased c-Src/Fyn protein degradation in mutant/Q111 cells.
Fyn and c-Src proteins are degraded due to enhanced autophagy in cells expressing mHTT
Since our data evidenced higher c-Src/Fyn protein degradation in Q111 cells, we further analyzed the involvement of protein degradation systems, namely the endo-lysosomal, autophagy pathway and ubiquitin-proteasome system (UPS).
In Figure 2A and B, epoxomicin (selective UPS inhibitor) was used to assess the role of UPS in c-Src/Fyn degradation. Our results show that UPS seems to be involved in kinases degradation in Q7 cells only. In Q111 cells, UPS does not seem to be involved in kinases degradation, since no significant increase in protein accumulation was observed in the presence of epoxomicin (Fig. 2A, B and Supplementary Fig. S10).
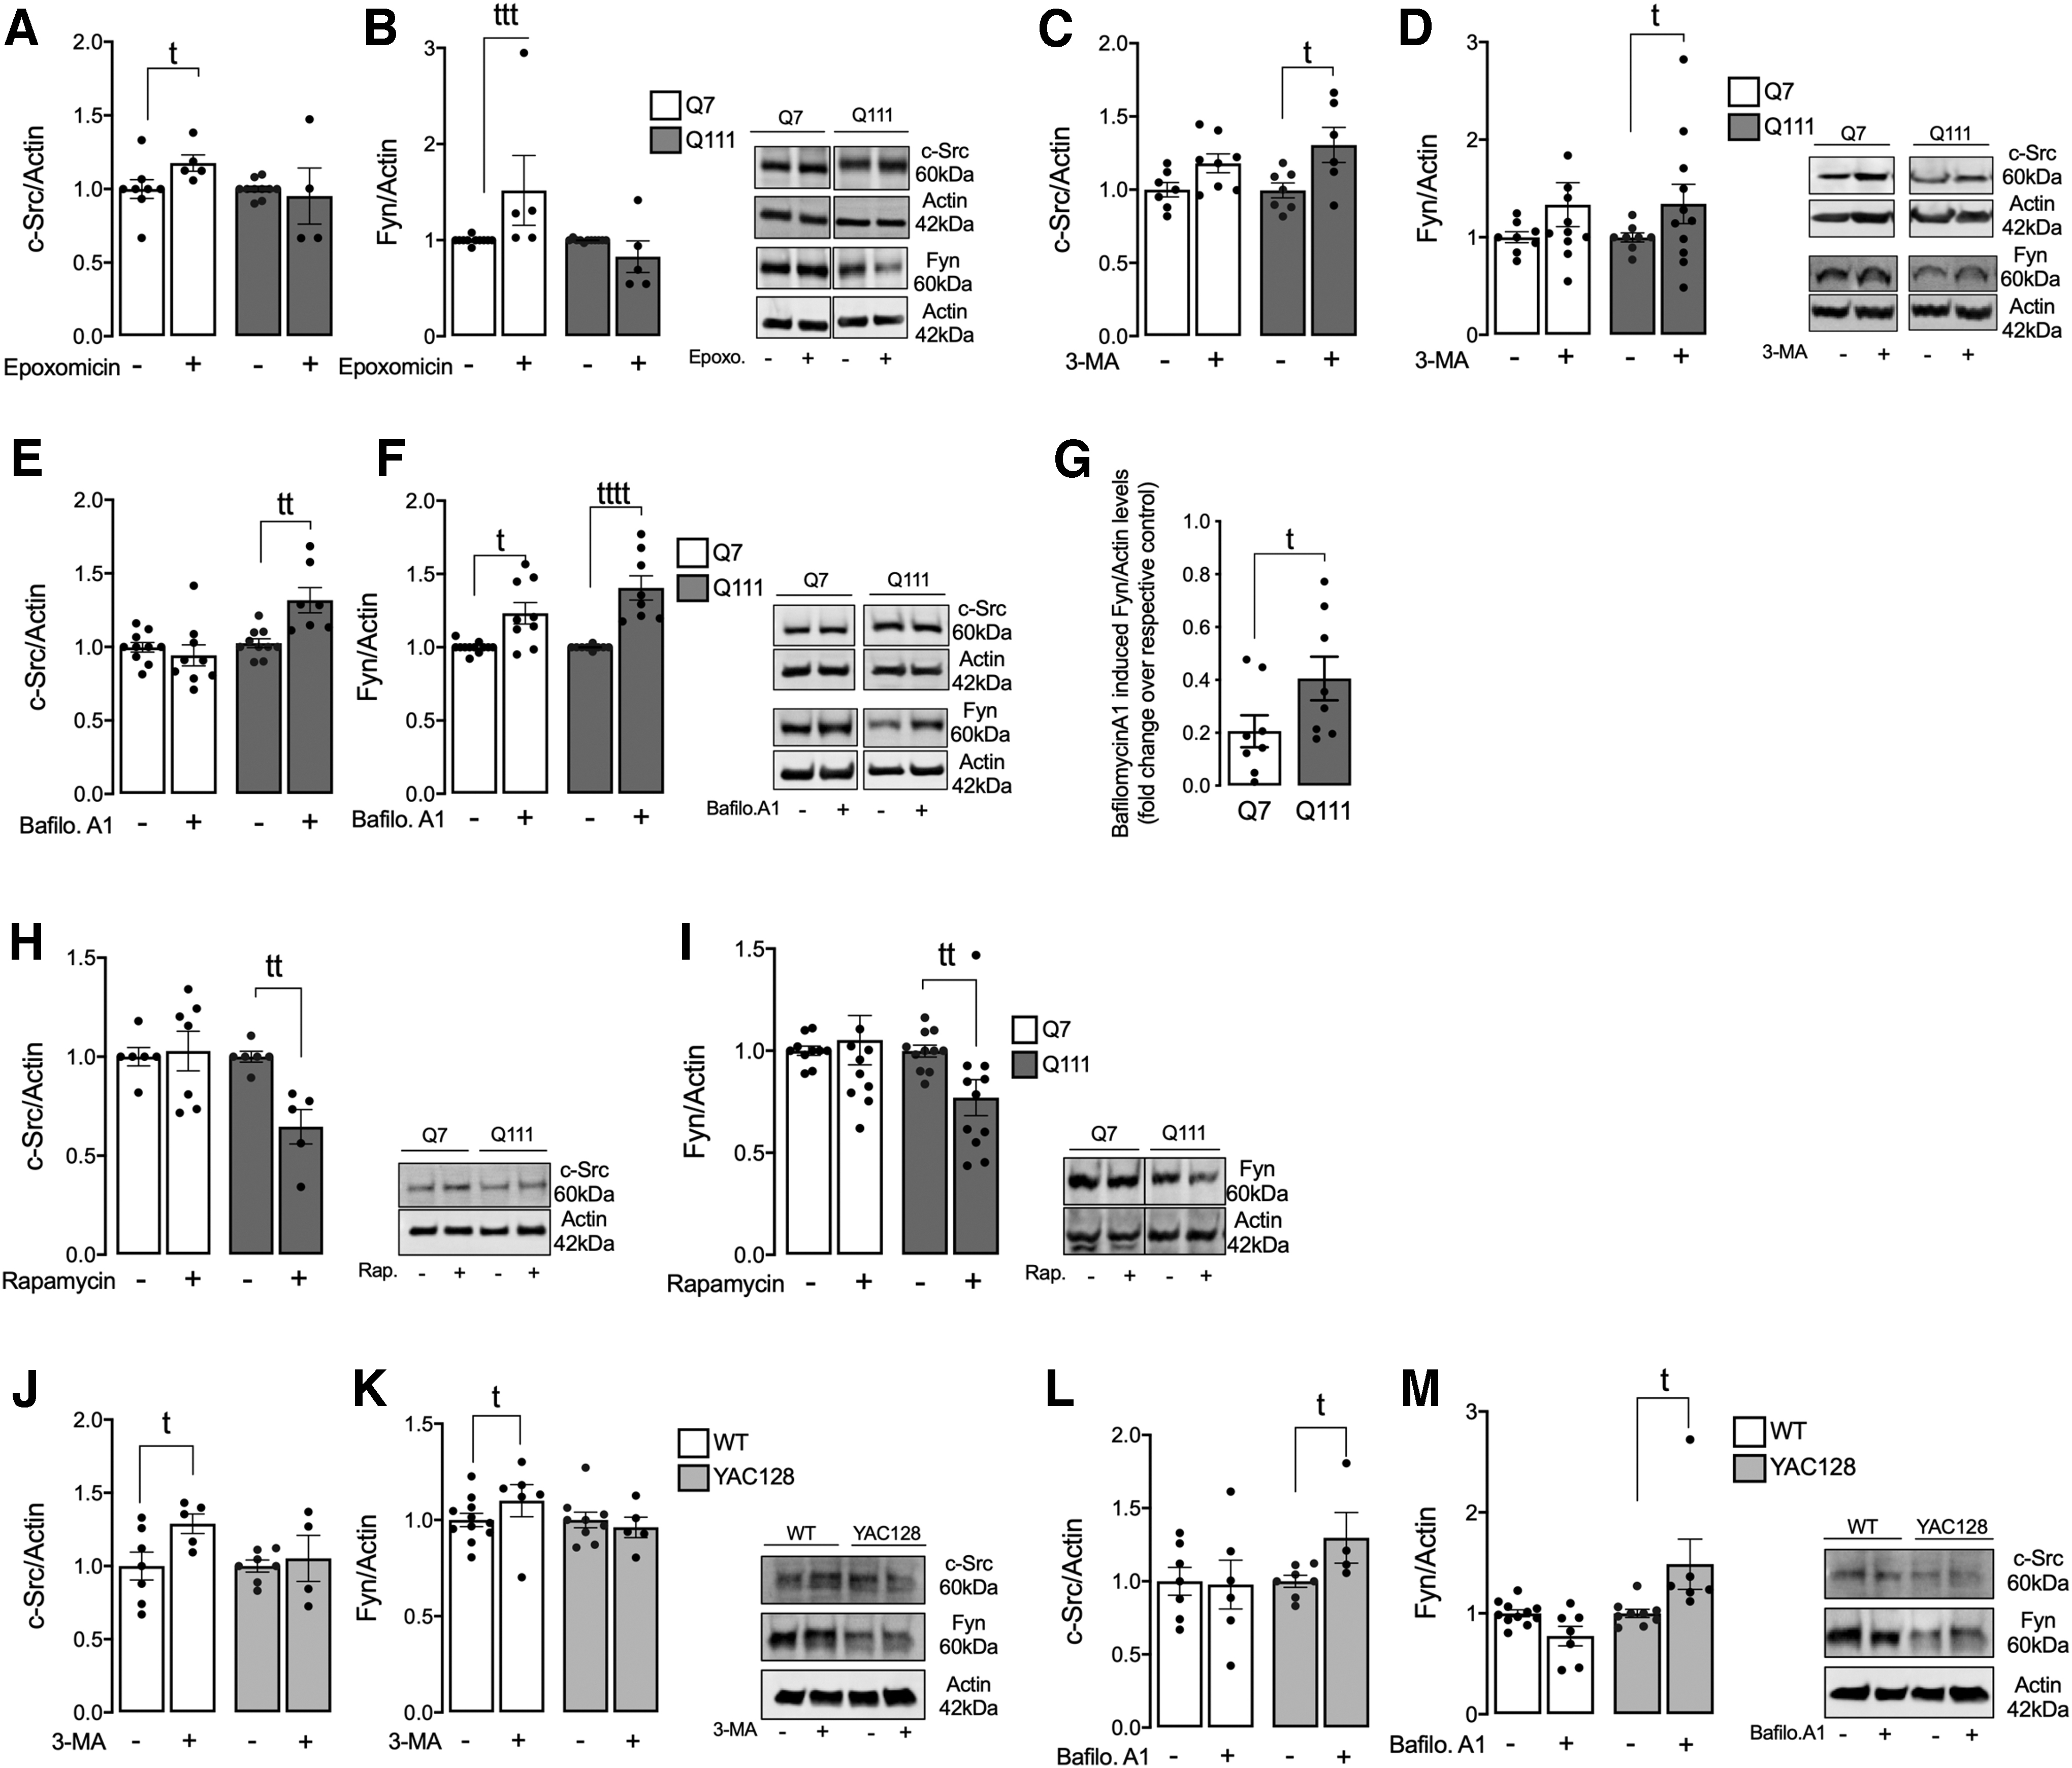
Autophagy pathway activation was evaluated at early and late phases. The early phase was assessed using 3-methyladenine (3-MA), which inhibits autophagy by blocking autophagosome formation via the inhibition of class III PI3K (Fig. 2C, D and Supplementary Fig. S10), whereas the late phase was analyzed using bafilomycin A1, a lysosome proton pump inhibitor that prevents maturation of autophagic vacuoles by inhibiting fusion between autophagosomes and lysosomes (Fig. 2E, F and Supplementary Fig. S11).
c-Src protein levels were significantly increased in Q111 cells after incubation with 3-MA or bafilomycin A1, whereas no changes were observed in Q7 cells, suggesting autophagy-related degradation of Src in the HD model (Fig. 2C, E and Supplementary Figs. S10 and S11). Our results also evidence increased degradation of Fyn by the autophagy pathway in Q111 cells (Fig. 2D, F and Supplementary Figs. S10 and S11). Because Fyn levels are also increased after bafilomycin A1 exposure in Q7 cells, we calculated the fold change over the respective control (Fig. 2G), confirming that Fyn protein is more degraded in Q111 cells by autophagy.
Concordantly, treatment with rapamycin, which increases cellular autophagy through the inhibition of mTOR, reduced the protein levels of c-Src (Fig. 2H) and Fyn (Fig. 2I) in Q111 cells only, confirming the role of autophagy in the degradation of these two protein kinases in the HD striatal cell model. Interestingly, in striatal primary neurons from WT and YAC128 mice treated with bafilomycin A1, the increase in c-Src and Fyn levels was only significant in YAC128 striatal neurons (Fig. 2L, M and Supplementary Fig. S12); however, this was not observed after 3-MA treatment (Fig. 2J, K and Supplementary Fig. S12), suggesting that the degradation of these kinases in HD cells is favored at the late phase of autophagy, by lysosomes. These results may explain the decrease in c-Src and Fyn total and phosphorylated levels in HD cell models, namely in striatal Q111 cells and YAC128 mouse primary neurons.
To confirm our hypothesis of enhanced degradation of c-Src/Fyn through autophagy, we further analyzed some key proteins in the autophagy process. Cytosolic LC3-I is recruited to autophagosomal membranes, where it is conjugated to phosphatidylethanolamine forming LC3-II. p62 is a selective autophagy receptor with a ubiquitin-binding domain, which is able to recognize ubiquitinated cargo designated for degradation. Q111 cells showed augmented levels of LC3-II/LC3-I and significantly reduced levels of p62 protein, which accumulated in the presence of bafilomycin A1 (Fig. 3A–D and Supplementary Fig. S13), suggesting increased induction of autophagy in mutant striatal cells.
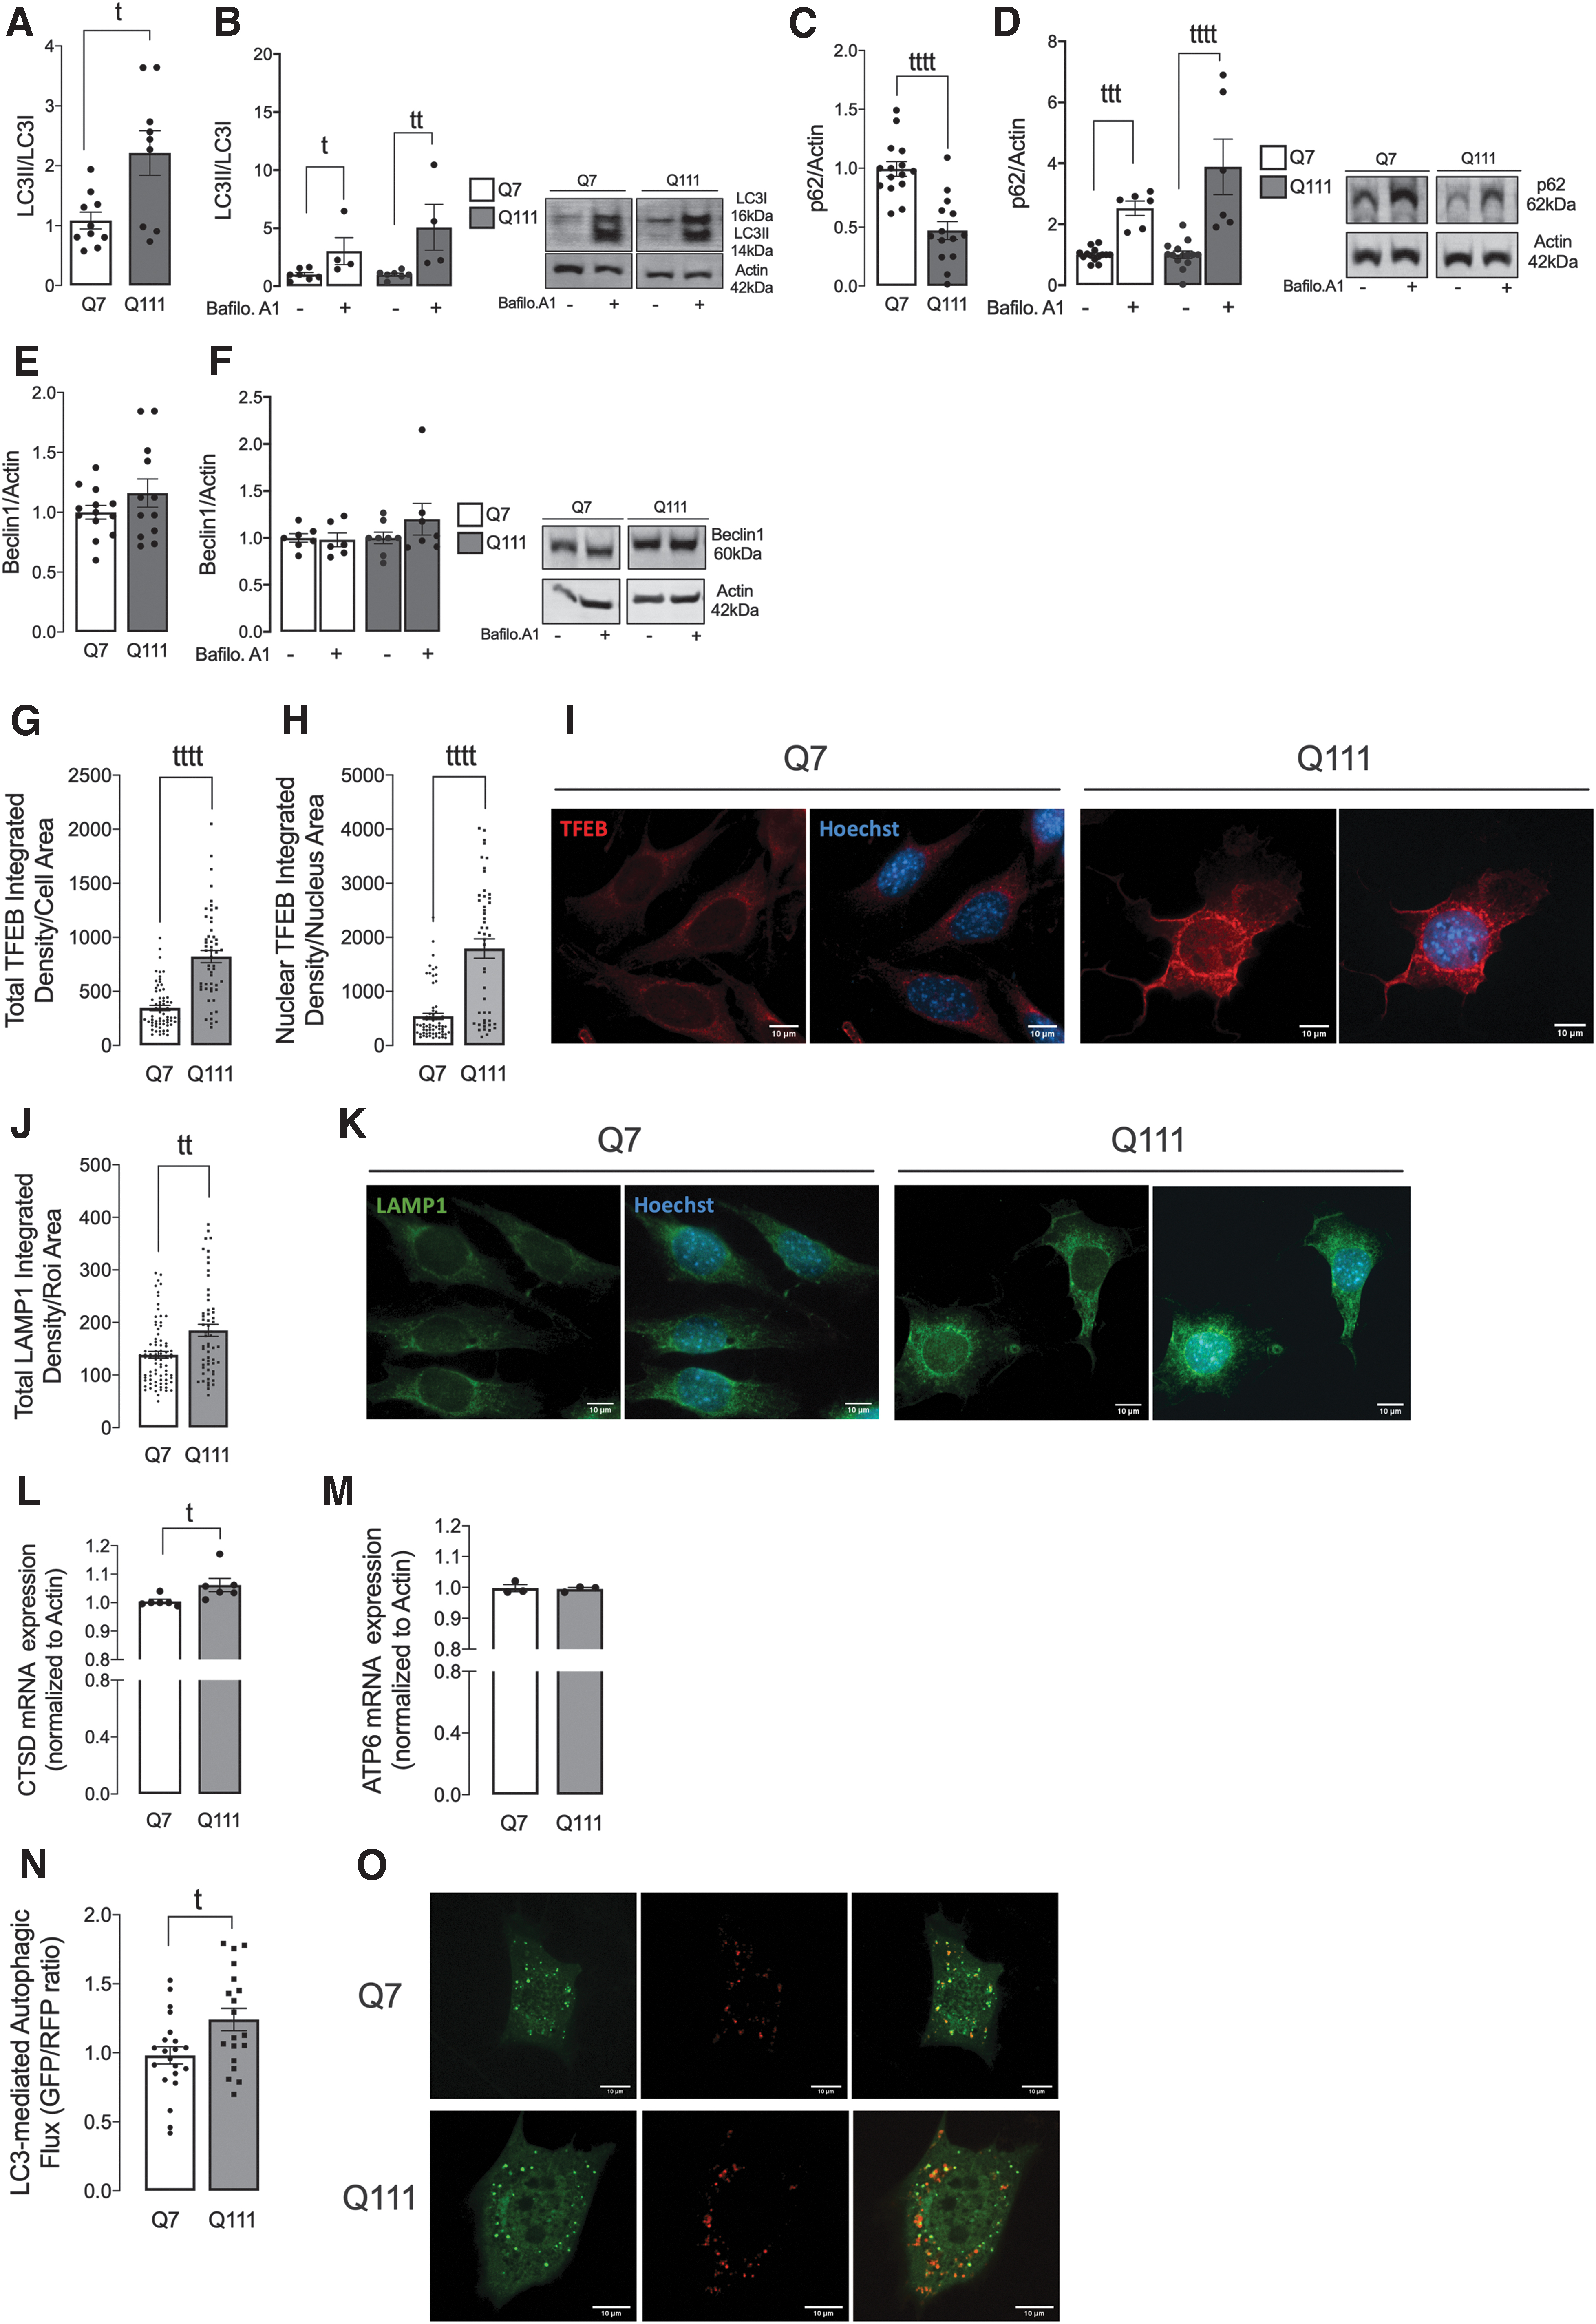
Regarding Beclin-1, which acts during the initiation phase of autophagy by forming the isolation membrane, no significant differences were found between Q7 and Q111 cells (Fig. 3E, F and Supplementary Fig. S13), suggesting that the expression of mHtt does not impose changes in the initial steps of autophagosome formation. Further, we analyzed lysosomal biogenesis in HD cells. TFEB is an important mediator of autophagy regulation (34). Translocation of TFEB into the nucleus occurs in situations of stress to induce the expression of genes that are needed to activate and/or restore the autophagy-lysosomal pathway (36).
Our data show an increase in total and nuclear TFEB levels in Q111 cells (Fig. 3G–I), which suggests augmented TFEB activation in cells expressing mHtt. In addition, we measured LAMP1 levels, a lysosome-associated membrane protein, which correlates with the number of lysosomes and can be used as a marker of lysosomal biogenesis, a process regulated by TFEB. Consistent with TFEB data, LAMP1 levels were also found to be augmented in Q111 cells (Fig. 3J, K).
TFEB is activated by dephosphorylation and translocates to the nucleus, where it promotes the transcription of several genes involved in the autophagy-lysosomal pathway (35), namely lysosomal cathepsin D (CTSD) and ATP6v0A1. Q111 cells show increased CTSD mRNA levels (Fig. 3L), consistent with our data, showing augmented autophagy induction and increased c-Src/Fyn autophagy-dependent degradation. Concordant with these data, we further show that autophagic flux is increased in Q111 cells (Fig. 3N, O).
Total and phosphorylated Fyn levels are decreased in HD mitochondria
c-Src/Fyn were previously shown to be located in mitochondria and their activity at complex I, III, and IV is crucial to maintain normal mitochondrial respiration and cell survival (1, 22).
Because our results evidence a consistent decrease of Fyn protein levels in several HD models, we analyzed Fyn protein and phosphorylated SKF levels co-localization with mitochondria in Q7/Q111 cells and primary striatal neurons from WT and YAC128 mice, as well as in isolated mitochondria from WT and YAC128 mouse brain striata (Fig. 4). Results show a significant decrease in Fyn and phosphorylated co-localization with mitochondria in Q111 cells (Fig. 4A–C), YAC128 striatal primary neurons (Fig. 4D–F) and in mitochondria isolated from 3-month-old YAC128 mouse striatum (Fig. 4G, H and Supplementary Fig. S14), when compared with the respective controls.

Constitutive active SKF ameliorates mitochondrial morphology independently of mitophagy in HD cells
Considering our data showing reduced levels of Fyn associated with mitochondria, the fact that mHTT affects mitochondrial morphology and trafficking in different HD models (18, 20), as well as the involvement of SKF in regulating mitochondrial function (1, 22), we next evaluated the involvement of SKF proteins in mitochondrial morphology in HD cells (Fig. 5).
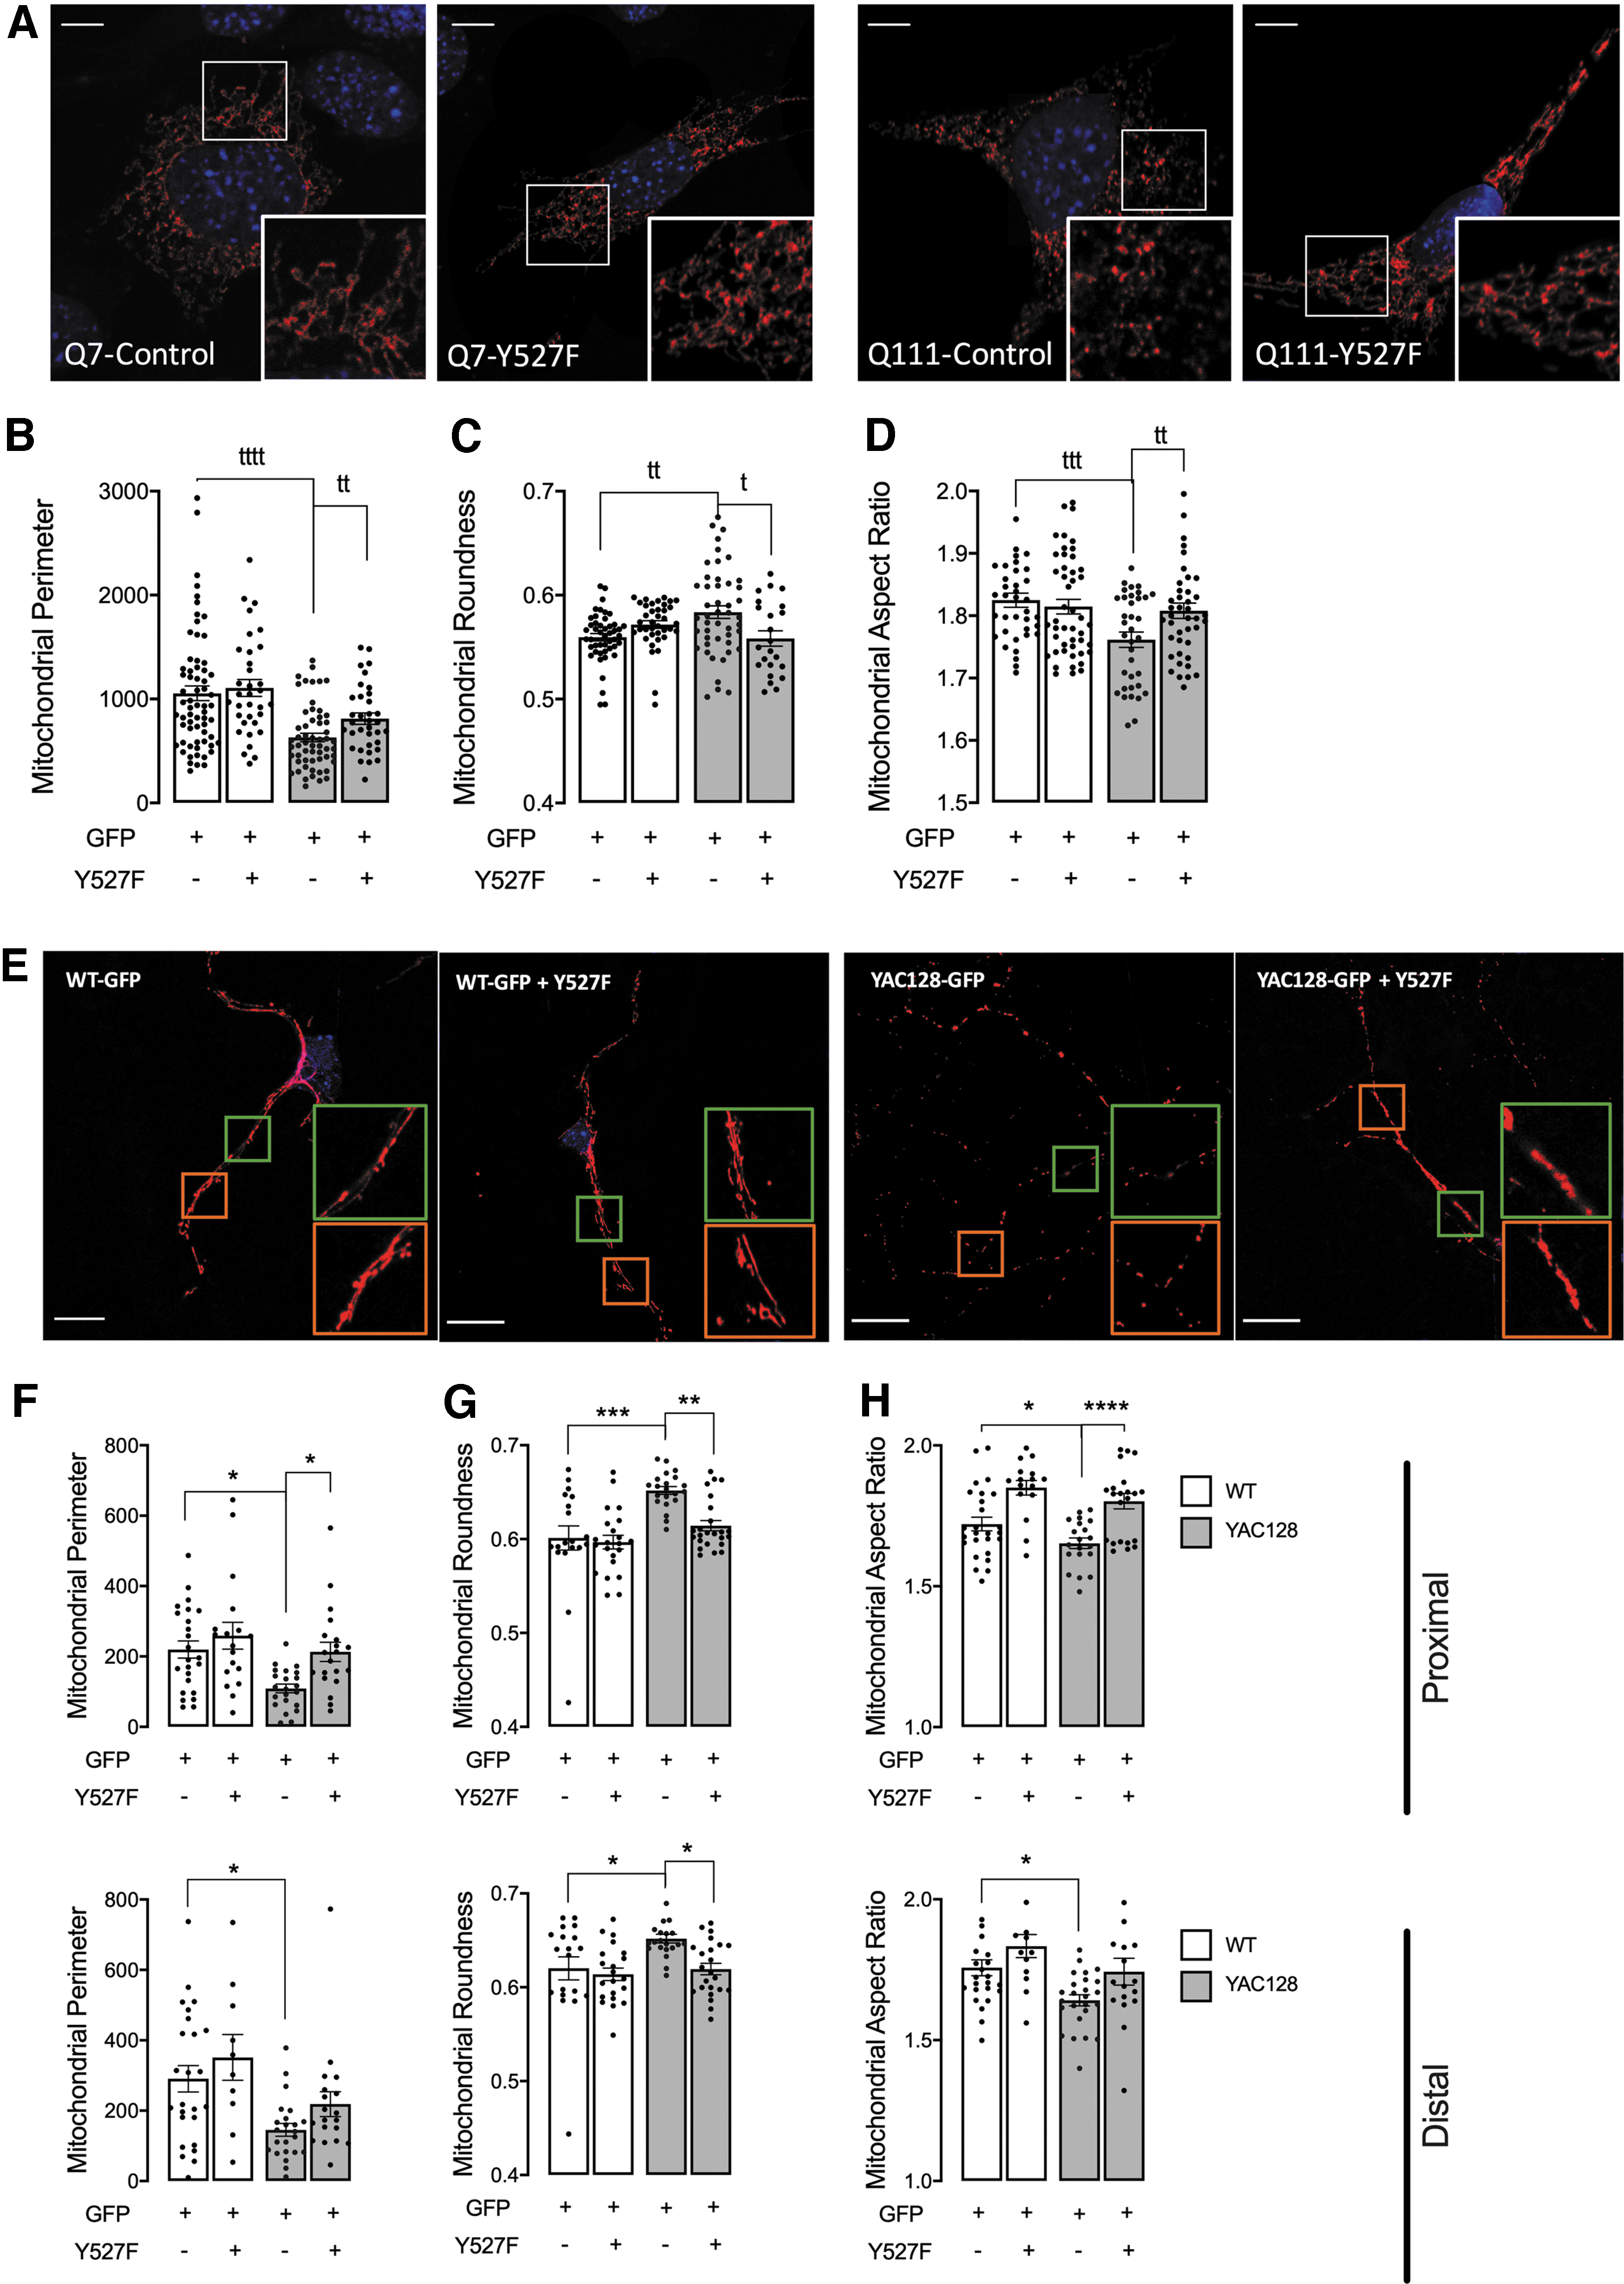
The HD mitochondrial morphology was assessed in Q7/Q111 cells (Fig. 5A–D) and striatal primary neurons from WT and YAC128 mice (Fig. 5E–H) after transfection with a constitutively active form of the SKF, Y527F. The Y527F mutation blocks the formation of the closed state of SKF proteins, which is repressive, leading to a constitutive active form of these proteins (9). In accordance with previously published data, we observed a decrease in mitochondrial perimeter and in mitochondrial aspect ratio, accompanied by an increase in mitochondrial roundness in both Q111 cells and YAC128 striatal neurons, when compared with WT cells (Fig. 5).
Importantly, the expression of Y527F SKF in Q111 cells restored mitochondrial perimeter (Fig. 5B), roundness (Fig. 5C), and aspect ratio (Fig. 5D). Similar results were observed in mitochondria located at proximal neurites in YAC128 striatal neurons after the expression of Y527F SKF, reestablishing mitochondrial perimeter (Fig. 5F, upper), roundness (Fig. 5G, upper), and aspect ratio (Fig. 5H, upper). In distal neurites, the ameliorated effect of Y527F SKF in YAC128 neurons was only significant when assessing mitochondrial roundness (Fig. 5G, lower). In this way, enhanced levels of the SKF active form positively influence mitochondrial morphology in striatal cells expressing mHTT.
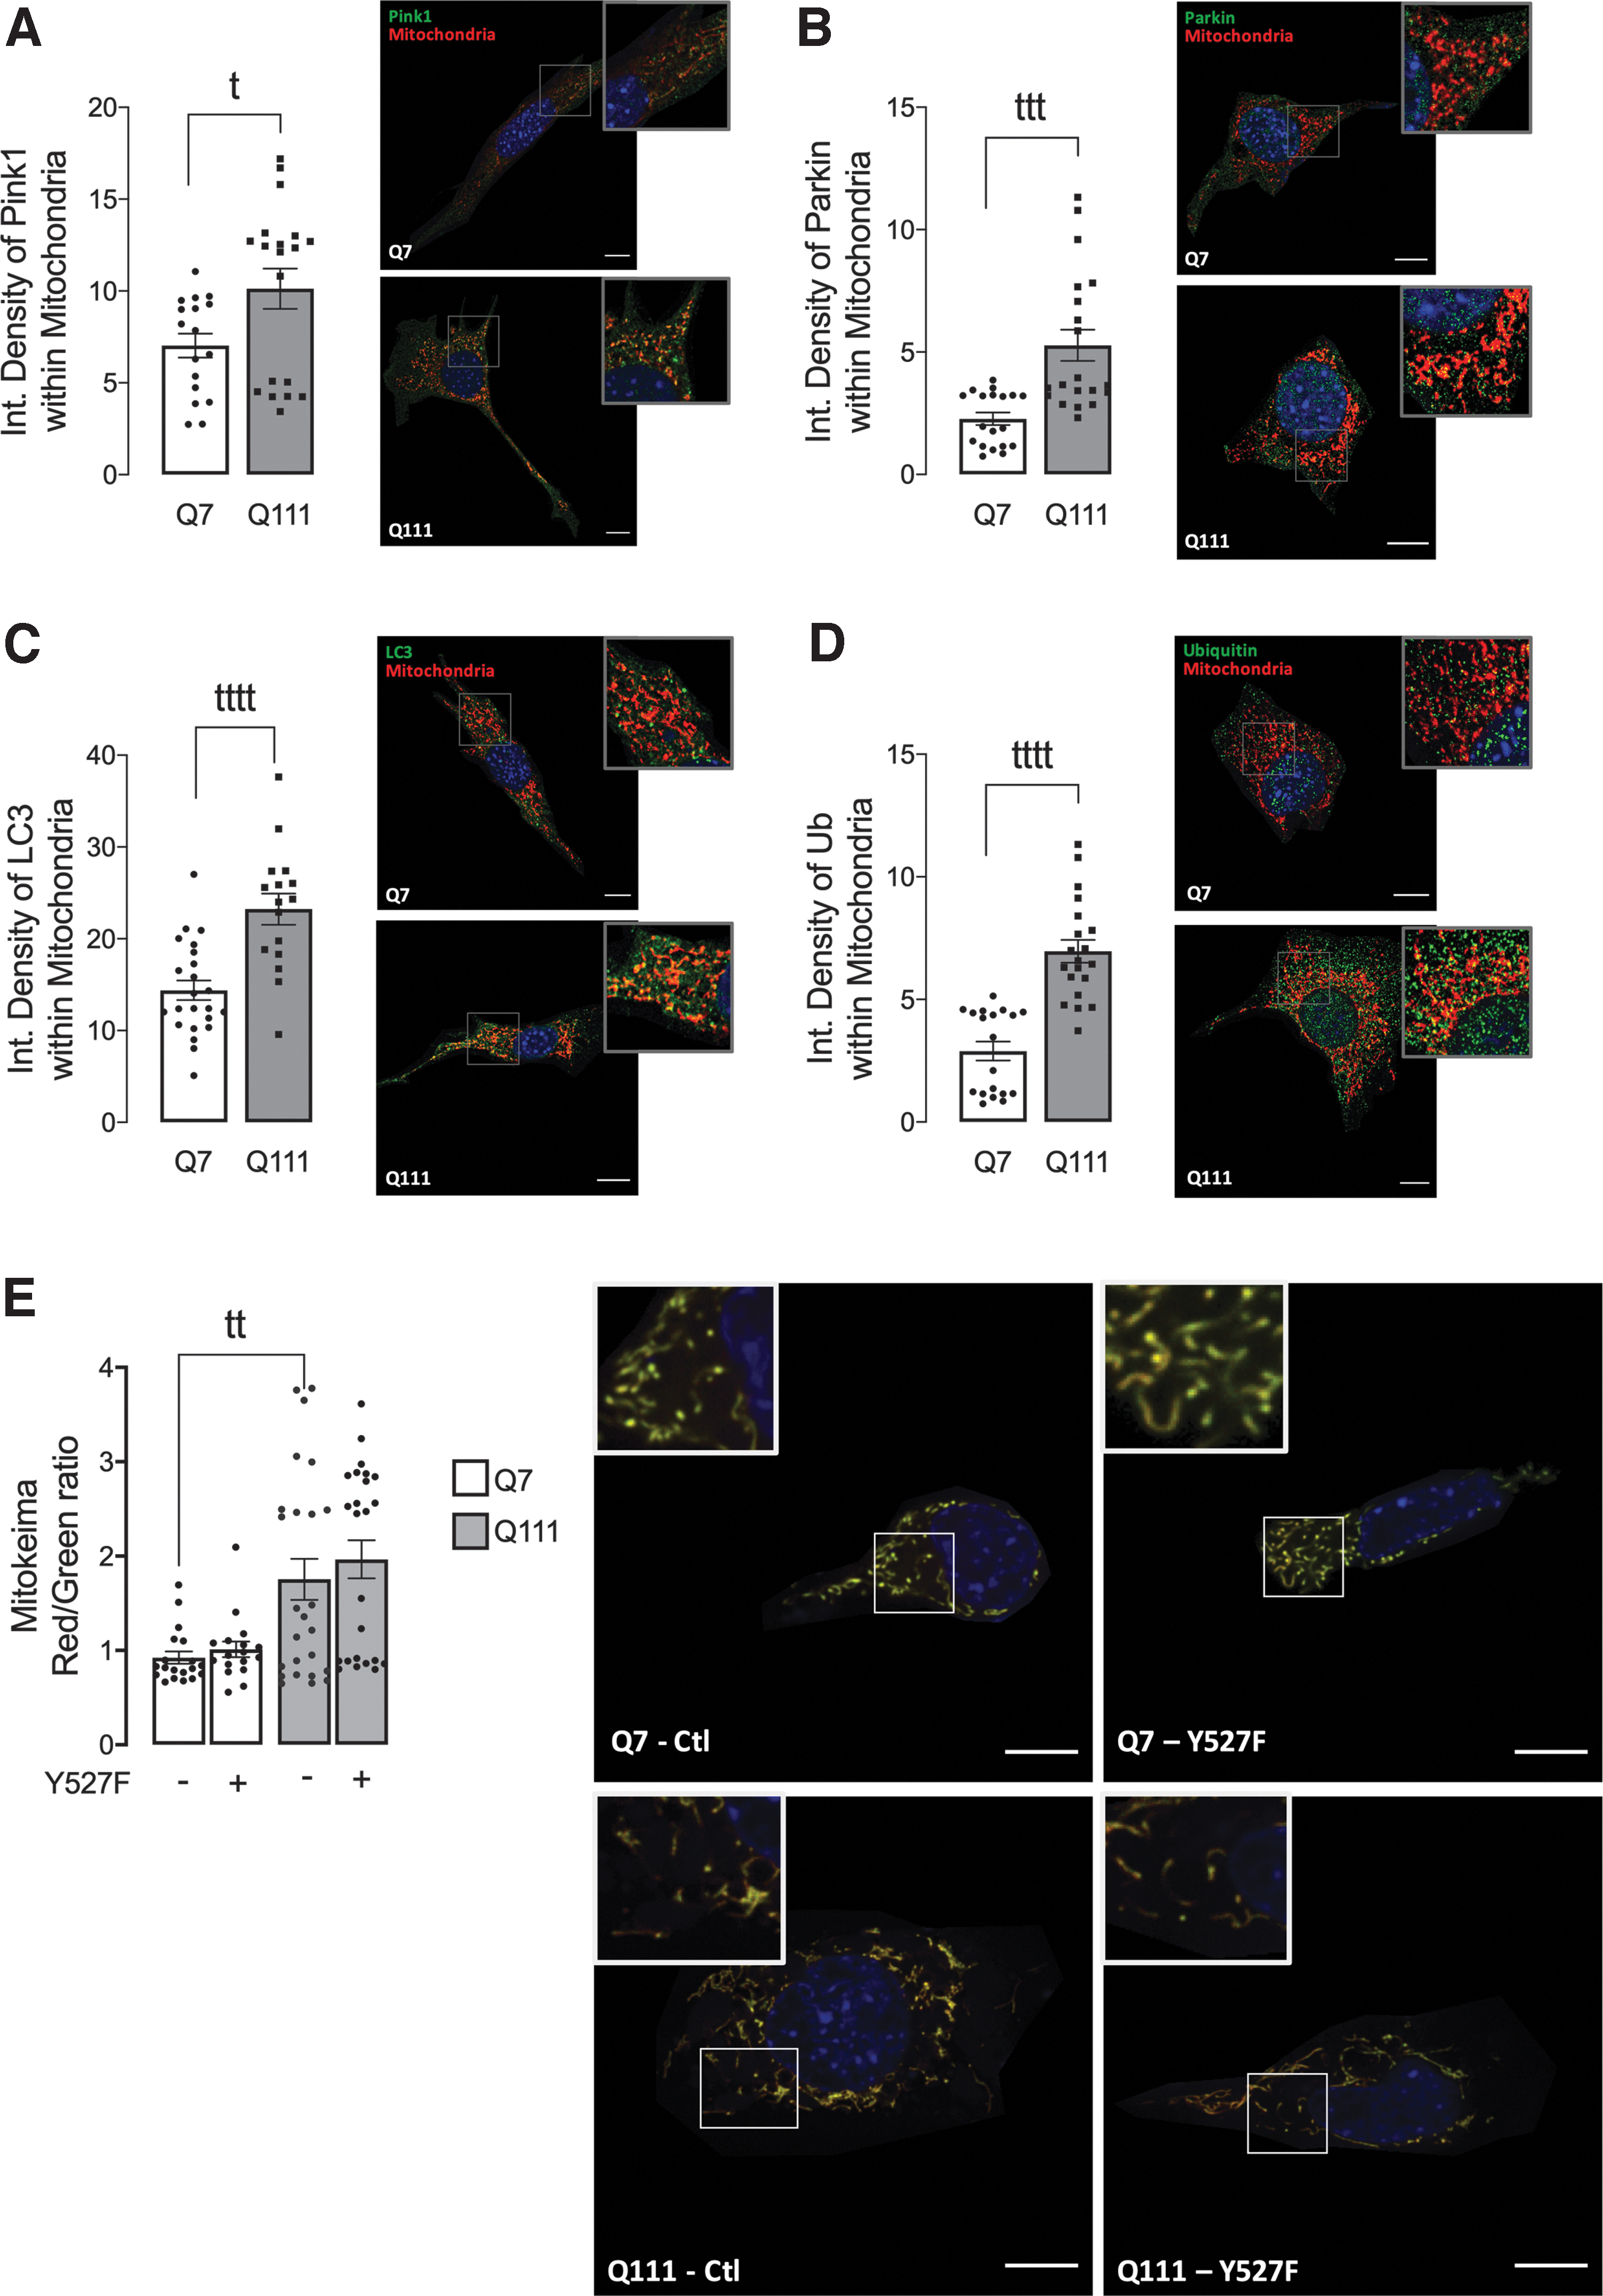
Since mitophagy is the primordial process for mitochondrial quality control and recycling, and it can be related to altered mitochondrial morphology (43), we analyzed mitophagy in HD cells. The PTEN-induced putative kinase 1 (PINK1)/Parkin (an E3 ligase)-dependent pathway is the most well-characterized signaling cascade. PINK1 is stabilized in the mitochondria outer membrane (MOM), and its auto-phosphorylation induces the recruitment of Parkin to the mitochondrial surface (11).
Once stabilized in the mitochondrial surface, Parkin ubiquitinates MOM proteins, promoting their degradation as well as their association with downstream autophagy adaptors, such as p62 and LC3-II (21). Q111 cells showed increased levels of PINK1 (Fig. 6A), Parkin (Fig. 6B), LC3 (Fig. 6C), and Ubiquitin (Fig. 6D) in mitochondria, suggesting augmented mitophagy initiation in mHtt-expressing cells. To confirm this observation, we analyzed MitoKeima red/green fluorescence, an index of mitophagy flux, as mitochondria that undergo degradation by the lysosome are red (41). Data show augmented mitophagy in Q111 cells; however, the restoration of SKF levels did not affect mitophagy flux in both cells (Fig. 6E), Q7 and Q111, which suggests that c-Src/Fyn-mediated mitochondrial changes are not regulated by mitophagy.
Restoration of active SKF alleviates HD mitochondrial dysfunction
Our group has previously shown that Q111 cells exhibit mitochondrial depolarization and excessive levels of ROS [e.g., Ribeiro et al. (27)]. Thus, we next studied the influence of expression of constitutive active SKF on mitochondrial function in HD cell models.
The expression of Y527F SKF enhanced tetramethylrhodamine, methyl ester (TMRM+) mitochondrial accumulation, as evaluated after mitochondrial depolarization with carbonyl cyanide-p-trifluoromethoxyphenylhydrazone (FCCP), in both Q111 striatal cells (Fig. 7A) and YAC128 striatal proximal neurites (Fig. 7B, C), indicating a recovery in Δψm in mutant cells. As anticipated, decreased Δψm was accounted for by impaired mitochondrial basal and maximal respiration and ATP production, as observed in Q111 cells (Fig. 7E, F). Y527F SKF expression slightly but significantly improved mitochondrial basal respiration and ATP production in Q111 striatal cells (Fig. 7E).

Interestingly, the SKF inhibitor SU6656 decreased mitochondrial basal and maximal respiration, as well as ATP production in Q7 cells, but not in Q111 cells (Fig. 7F), indicating that SKF inactivation impairs mitochondrial function in control cells. These data reinforce the important role of SKF activation for normal mitochondrial function and the link between impaired mitochondrial function and reduced SKF levels associated with the organelle.
Expression of active SKF decreases mitochondrial and total reactive species levels and apoptosis in HD striatal cells
Since oxidative stress and mitochondrial dysfunction are closely related in HD, we measured the specific mitochondrial superoxide anion (O2 •−) in single cells using the fluorescent probe MitoSOX. Q111 cells (GFP transfected) exhibited increased O2 •− levels when compared with Q7 cells (Fig. 8A, B), as previously described by our group (28). Importantly, expression of the constitutive active form of SKF (GFP plus Y527F SKF transfected cells) significantly reduced mitochondrial O2 •− levels in Q111 cells. Similar results were observed in both proximal and distal neurites of YAC128 mouse striatal neurons subjected to Y527F SKF expression (Fig. 8C–E).
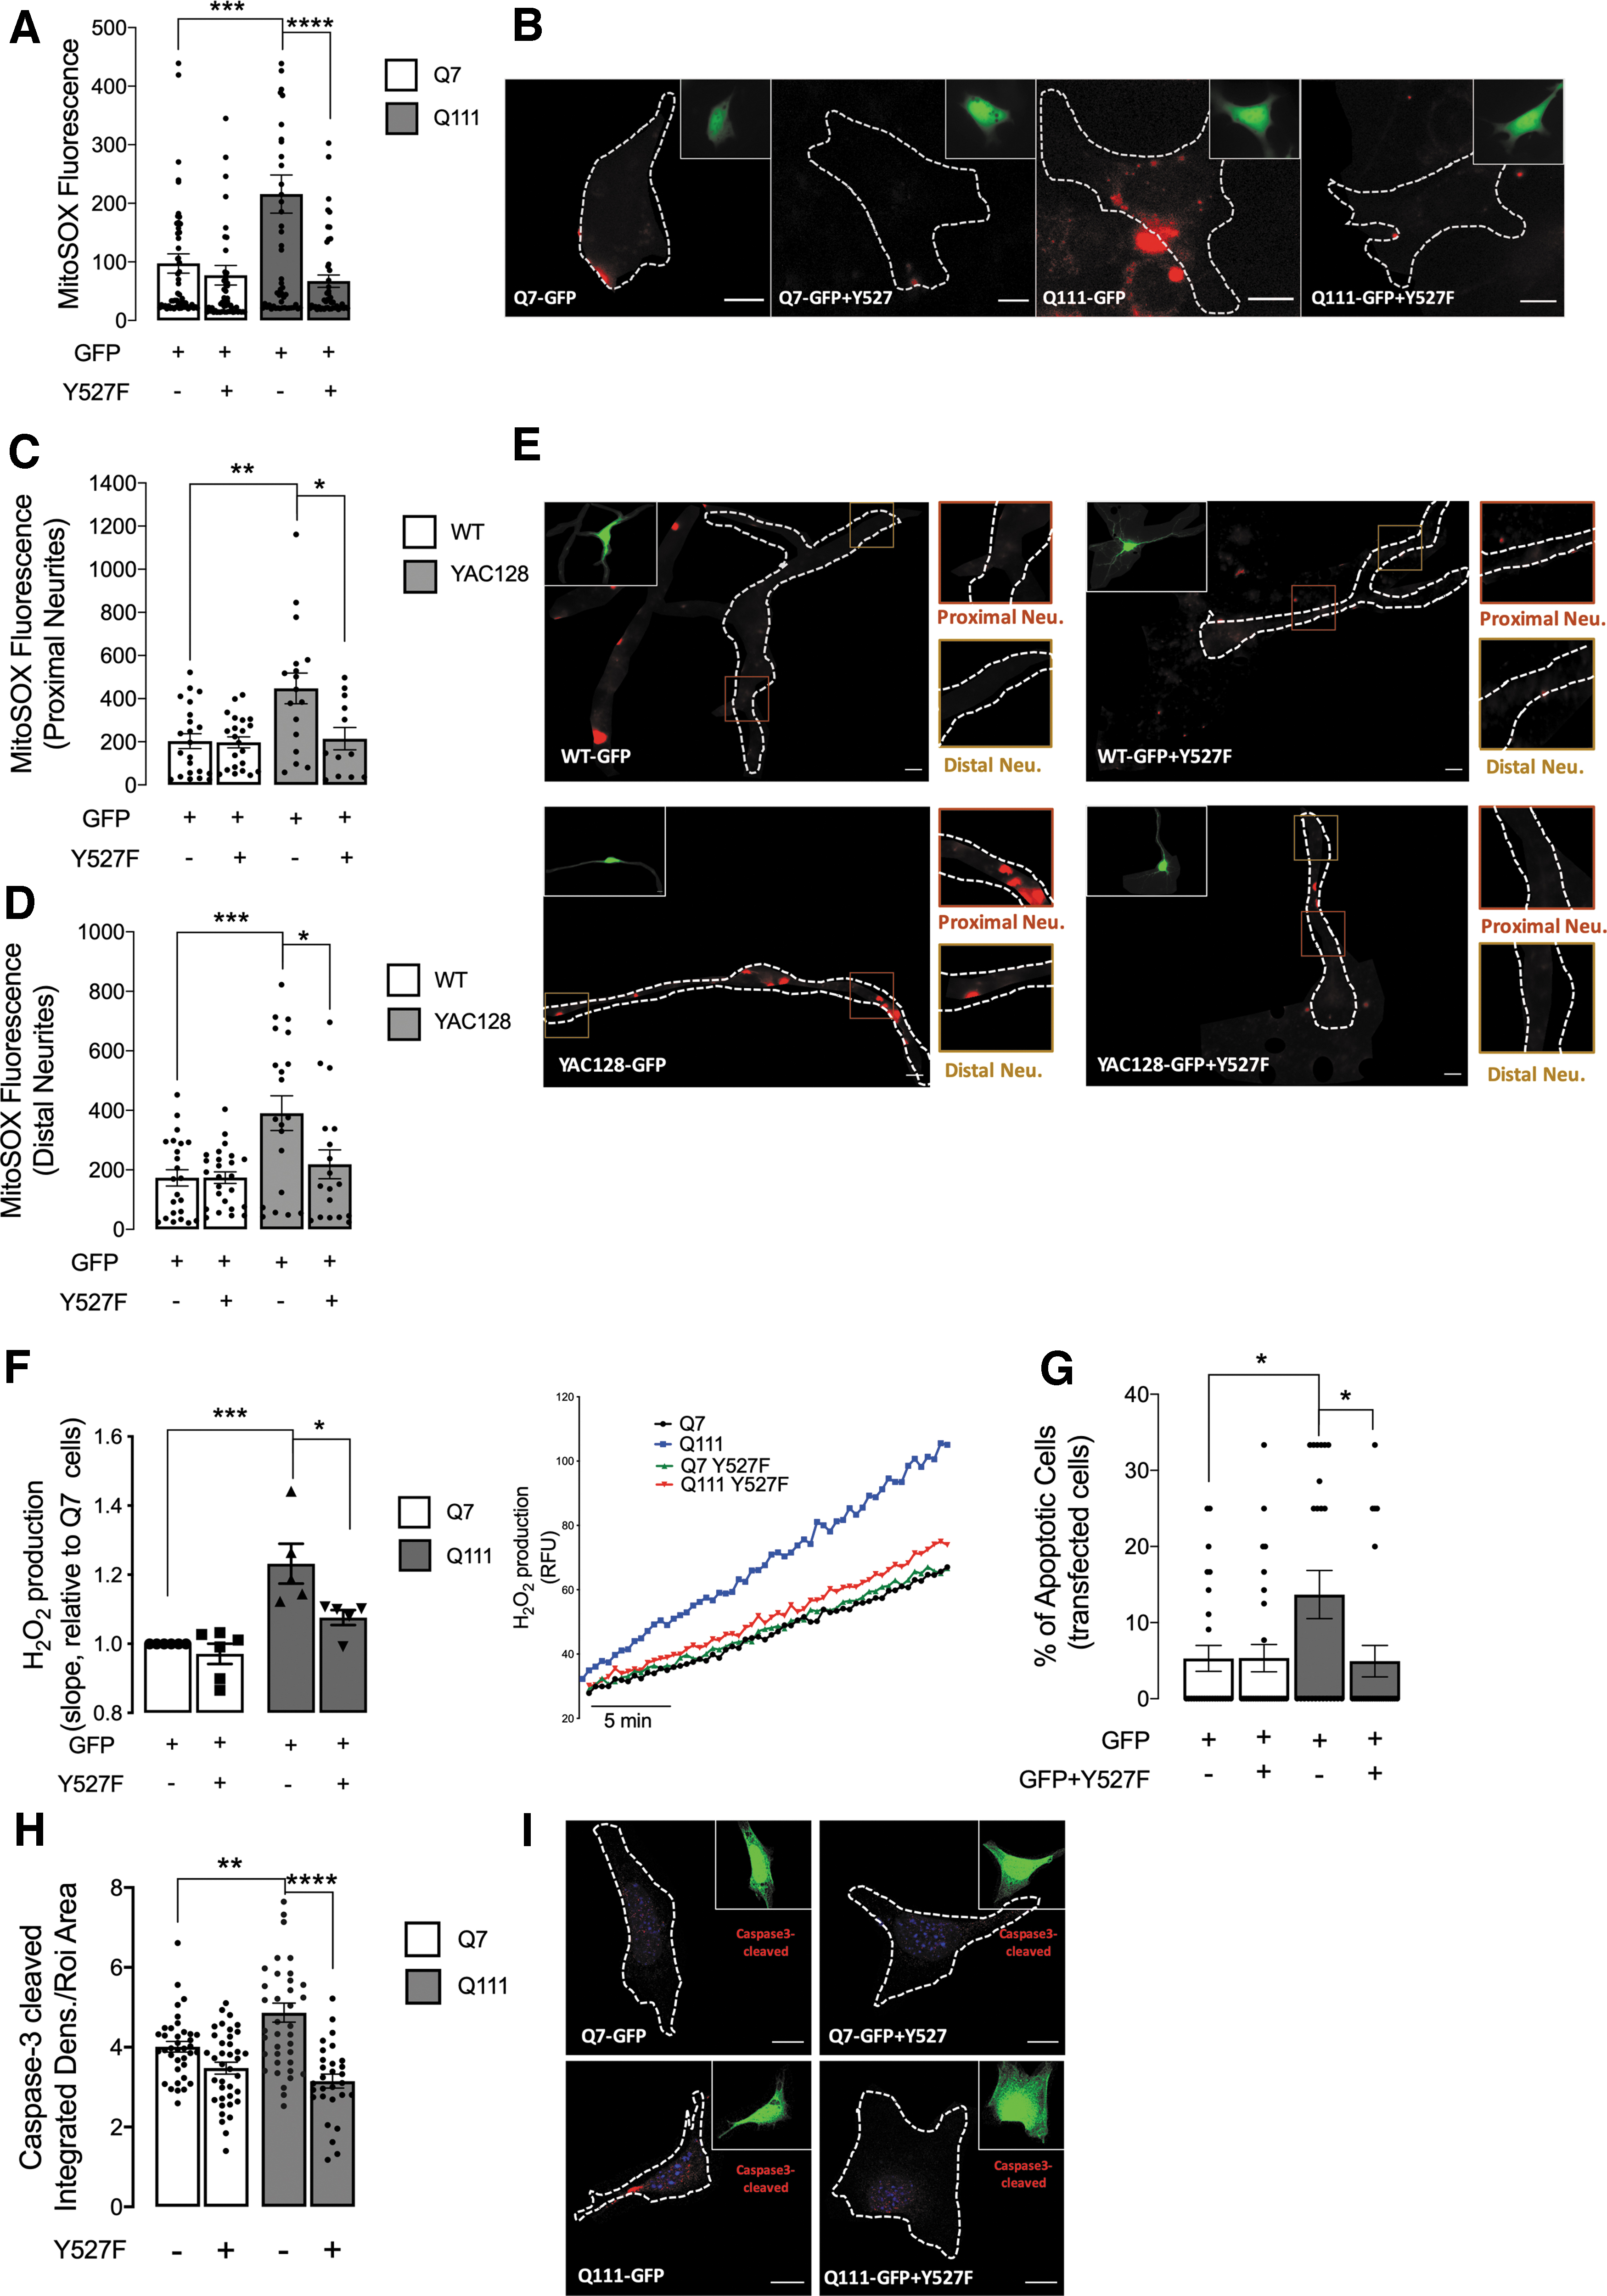
Concordantly, the restoration of active/Y527F SKF levels decreased cellular generation of H2O2 in Q111 cells (Fig. 8F). Further, nitric oxide (NO) levels and overall redox changes were ameliorated after the expression of constitutive active (Y527F) SKF (Supplementary Fig. S5). These data confirm augmented levels of reactive species in Q111/HD cells. After SFK overexpression, we observed a tendency for a decrease in NO levels and a significant decrease in redox mechanisms, confirming the involvement of reduced c-Src/Fyn levels on redox signaling in HD.
Significantly, Q111 cells expressing a constitutively active form of the SKF displayed a significant reduction in the number of apoptotic cells, as determined by nuclear condensation using Hoechst staining (Fig. 8G), but there was no evidence of necrosis (Supplementary Fig. S6). In addition, we validated apoptosis modulation after c-Src/Fyn restored levels in HD cells through decreased caspase3-cleaved/active levels (Fig. 8H, I).
Altogether, these data evidence that SKF activation is essential for mitochondrial activity and cell survival in cells expressing mHTT/mHtt by ameliorating mitochondrial function and morphology, and by limiting the levels of oxidant species.
Discussion
In the present study, we provide evidence that two SKF members, c-Src and Fyn kinases, are reduced in several HD models, and that the expression of constitutive active form of SKF is neuroprotective against mHTT-induced mitochondrial dysfunction and enhanced ROS levels. Indeed, we show a decrease in c-Src and Fyn protein levels, and in their activation in human brain caudate, YAC128 mouse brain striatum and cortex at early stages, YAC128 striatal neurons and Q111 striatal cell lines (as shown in the Graphical Abstract).
The mHTT aggregates are ubiquitinated (4), reflecting a generalized deficiency in UPS and decreased degradation of mHTT through this pathway. Indeed, different HD models show decreased UPS function, suggesting that proteasome sequestration by mHTT aggregates is responsible for altered UPS activity [e.g., Li and Li (14)]. To maintain normal proteostasis under conditions of UPS failure, autophagy can be upregulated (25). Under normal conditions regulation of SKF protein levels occurs mainly through the proteasome (7), and we were able to confirm it in control/wild-type cells.
Conversely, our results evidence a higher degradation of c-Src and Fyn proteins through the (macro)autophagy pathway, as confirmed by using selective autophagy inhibitors, in cells expressing full-length mHTT, namely Q111 cells and YAC128 striatal neurons. In accordance, our data also show augmented TFEB-mediated autophagy induction, and autophagy flux linked to increased c-Src/Fyn autophagy-dependent degradation.
Fyn kinase was previously identified at the intermembrane space of highly purified rat brain mitochondria (32), playing a key role in normal mitochondrial function (22). In this study, we show, for the first time, that Fyn total and phosphorylated levels are reduced in YAC128 mouse striatal isolated mitochondria. We also show decreased co-localization of Fyn with mitochondria in striatal neurons or Q111 striatal cells. Since SKF do not contain a typical mitochondrial localization signal, adaptor proteins appear to be required for interaction with the organelle.
Several studies revealed that two anchoring proteins of protein kinase A (PKA), A Kinase Anchor Protein 121 (AKAP121) and Dok-4, can associate with Src in both the cytosol and the mitochondria (10, 15). Moreover, AKAP121 was observed in the mitochondrial inner membrane bound to SKF proteins (33). However, AKAP121 or Dok-4 proteins have not been studied in the context of HD. Decreased co-localization of c-Src and Fyn protein with mitochondria might be related not only with increased autophagic degradation, but also with reduced interaction with mitochondrial proteins and/or mitochondrial translocation.
This might occur similarly as described for the HD transgenic R6/2 mouse model showing defective protein import to mitochondria, as an early defect found in the forebrain, since mHTT interacts with the TIM23 mitochondrial protein import complex (45). In addition, although mitophagy is an important regulator of mitochondrial morphology (43) and our data suggest that mitophagy initiation is augmented in Q111 cells, c-Src/Fyn-mediated mitochondrial changes are not regulated by mitophagy.
Mitochondrial dysfunction and related oxidative stress is a well-characterized early relevant HD pathogenic mechanism. Indeed, impaired mitochondrial oxidative phosphorylation, abnormal mitochondrial transmembrane potential (Δѱm), oxidative stress, accompanied by modifications in mitochondrial morphology, favors the accumulation of damaged mitochondria in HD models [e.g., Reddy and Shirendeb (26)], and it ultimately extends to cell death. In this work, we confirm mitochondrial morphology and function impairments as well as increased apoptosis in HD in in vitro models.
Importantly, our findings evidence a restoration of mitochondrial morphology and function after the re-establishment of active SKF levels in both Q111 cells and YAC128 mouse striatal neurons. Of relevance, mitochondrial complexes are c-Src/Fyn substrates, and mitochondrial respiration is dependent on c-Src/Fyn-mediated phosphorylation of respiratory chain components, namely complex I, III, and IV (1, 22). Moreover, mitochondrial SKF activation is essential for cell survival (1, 22). In addition, Fyn was associated with large complexes in mammalian mitochondria, including ribosomes and other translation components (12).
The same authors showed that Fyn regulates mitochondrial translation by phosphorylation of its multiple components, and thus, it stimulates energy generation in mammalian mitochondria (12). Our results are in accordance with these findings. Indeed, we show that active SKF expression restores mitochondrial morphology (mitochondrial perimeter, roundness, and aspect ratio) and improves Δѱm as well as mitochondrial respiratory through augmented basal respiration and ATP production.
Conversely, SKF inhibition is enough to induce the HD-like mitochondrial phenotype, which evidences the mitochondrial-related SKF role under normal conditions. Moreover, the expression of active SKF reduced mitochondrial ROS levels and augmented cell viability in cells expressing mHTT. The positive impact of SKF expression on mitochondrial reactive species and on decreased number of apoptotic cells and reduced caspase3-cleaved/active levels are probably due to its effect on mitochondrial function. Thus, this study discloses an essential role of SKF in regulating mitochondrial function in HD, potentially influencing disease progression (as shown in the Graphical Abstract).
Materials and Methods
Human samples and ethical permits
Caudate and parietal cortex samples from five unaffected controls and five HD patients (Vonsattel grade II–III) (Table 1) were obtained from German Brain Bank “Neurobiobank München” (
Human Sample Identification, Age (in Years), and Postmortem Time (in Hours)
CO, control individual; HD, Huntington's disease.
YAC128 mice
YAC128 mice, described by Slow (39), express full-length mutant HTT with 128 CAG repeats from a yeast artificial chromosome (YAC) transgene (RRID: MGI_MGI:3613515). YAC128 hemizygous (line HD53) and wild-type mice were housed in the animal facility of the Center for Neuroscience and Cell Biology and the Faculty of Medicine at the University of Coimbra under controlled temperature (22°C–23°C) and a 12 h light/12 h dark cycle with lights on at 07:00 h. Food and water were available ad libitum throughout the experiment.
Animal experiments in this study were performed in accordance with the European Community directive (2010/63/EU) and protocols approved by the Faculty of Medicine, University of Coimbra (ORBEA_189_2018/11042018). All efforts were made to minimize animal suffering and to reduce the number of animals used. Animals were used at 3, 6, and 12 months of age.
Human lymphoblastoid cell culture conditions
Human lymphoblastoid cell lines were obtained from Coriell Institute for Medical Research after NIGMS MTA agreement, and they were derived from HD-affected patients containing heterozygous expansion mutation, four males (43/15, 45/15, 42/18, 49/17) and one female (47/18), or from unaffected voluntary control siblings, three males and one female, defined in this work as control (Ctl) lymphoblasts.
Cell culture and treatments
Q7 and Q111 cell lines
Immortalized striatal neurons derived from knock-in mice expressing full-length normal (referred as Q7 or wild-type cells) or full-length mutant Htt (mHtt) with 111 glutamines (referred as Q111 or mutant cells) were obtained from Coriell Institute for Medical Research and maintained as previously described (42). Cells were used until passage 16 by recommendation of cell line producer Dr. M. MacDonald (Department of Neurology, Massachusetts General Hospital, Boston, MA). When indicated, cells were pretreated with H2O2 (100 μM; Sigma Chemical, St. Louis, MO) for 30 min or 1 h, SU6656 (5 μM; Sigma Chemical) for 1 h, CHX (350 μM, J66901; Alfa Aesar), for 3, 6, 12, 24 h, epoxomicin (200 nM, No. E3652-50UG; Sigma, St. Louis, MO), for 24 h, 3-MA (5 mM, No. tlrl-3ma; InvivoGen, Toulouse, France), for 4 h, and bafilomycin A1 (Bafilo. A1, 50 nM, No. B1793; Sigma), for 24 h.
Primary striatal neurons
Primary striatal neurons were prepared as previously described (19), with some minor modifications. At 16 days of gestation, pregnant female mice were sacrificed by cervical dislocation after anesthesia using (RS)-2-chloro-2-difluoromethoxy)-1,1,1-trifluoro-ethane. The striatum was dissected out from fetal mice, and cells were separated by mechanical digestion using a pipette in Ca2+- and Mg2+-free Hank's balanced salt solution containing 137 mM NaCl, 5.36 mM KCl, 0.44 mM KH2PO4, 0.34 mM Na2HPO4.2H2O, 5 mM glucose, 1 mM sodium pyruvate, and 10 mM HEPES, at pH 7.2. Cells were plated at a density of 8.4 × 10⁴ cells/cm2 in poly-
Cells were cultured for 12 days in Neurobasal medium supplemented with 2% B27, 0.5 mM glutamine, and 0.12 mg/mL gentamicin, at 95% air and 5% CO2. To reduce glia growth, 10 μM of the mitotic inhibitor 5-fluorodeoxyuridine (5-FDU, No. F0503; Sigma) was added to the culture after 72 h in culture. One half of the medium was replaced with fresh medium without 5-FDU at day 7.
Constructs and transfection
Cells were transfected with pLNCX chick Y527F Src (plasmid No. 13660; Addgene), empty pLNCX vector, and GFP (GFP; No. PS100010; Origene). Empty vector pLNCX was obtained from the Y527F Src plasmid using the restriction enzyme digestion ClaI (No. Ro197L; BioLabs) according to the manufacturer's protocol. The result of digestion was visualized in 1% agarose gel; the band corresponding to the empty vector was cropped; and DNA was extracted using the NucleoSpin® Gel and polymerase chain reaction (PCR) Clean-up (No. 740609; Macherey-Nagel) according to the manufacturer's protocol.
Then, the blunt end and cohesive end termini of the resulting empty vector were joined using T4 DNA Ligase enzyme (No. M0202S; BioLabs). Q7 and Q111 cells were transfected 24 h after plating with 0.75 μg DNA/cm2 of growth area in opti-MEM without fetal bovine serum or antibiotics, following the Lipofectamine 3000 (Thermo Fisher Scientific) manufacturer instructions. The medium was changed 4 h after transfection, and cells were cultured for 48 h. In primary neurons, transfection was performed at 8 days in vitro using the calcium phosphate precipitation method. Briefly, plasmid was diluted in TE (1 mM Tris-HCl pH 7.3, 1 mM EDTA), followed by the addition of CaCl2 (2.5 M CaCl2 in 10 mM HEPES, pH 7.2).
The DNA solution was carefully added to 2 × HEBS (12 mM dextrose, 50 mM HEPES, 10 mM KCl, 280 mM NaCl, and 1.5 mM Na2HPO4.2H2O, pH 7.2) while bubbling air through the solution with a micropipette. The mixture was then incubated for 25 min at room temperature. The precipitates were added dropwise to the coverslips in Neurobasal medium and incubated for 80 min at 37°C. The DNA–Ca2+-phosphate precipitates were dissolved in freshly made dissolution medium (Neurobasal medium with 20 mM HEPES, pH 6.8) and incubated for 7 min at room temperature. The transfected neurons were then washed with Neurobasal medium and transferred back to their original dishes containing conditioned culture medium.
Sample preparation and Western blotting
Total extracts were obtained from Q7 and Q111 cells, as well as primary striatal neurons. The cells were scraped in Ripa buffer (containing 150 mM NaCl, 50 mM Tris HCl, 5 mM EGTA, 1% Triton X-100, 0.1% SDS, 0.5% deoxycholate, pH 7.5) supplemented with 100 nM okadaic acid, 1 mM PMSF, 25 mM NaF, 1 mM Na3VO4, 1 mM DTT, and 1 μg/mL protease inhibitor cocktail (chymostatin, pepstatin A, leupeptin, and antipain). Total homogenates were lysed in an ultrasonic bath (UCS 300–THD; at heater power 200 W and frequency 45 kHz) during 10 s and centrifuged at 4°C for 10 min at 20,800 g to remove cell debris.
The supernatant was collected, and protein content was determined using the Bio-Rad protein assay reagent based on the Bradford dye-binding procedure (Bio-Rad, Hercules, CA). Then, protein extracts were denaturated with 6 × concentrated loading buffer (containing 300 mM Tris-HCl pH 6.8, 12% SDS, 30% glycerol, 600 mM DTT, 0.06% bromophenol blue) at 95°C, for 5 min. Equivalent amounts of protein samples (15–30 μg) were separated by 8%–12% SDS-PAGE and electroblotted onto polyvinylidene difluoride (PVDF) membrane (Millipore).
The membrane was further blocked with 5% (w/v) bovine serum albumin (BSA; Santa Cruz Biotechnology) in Tris buffered saline (TBS, containing 250 mM, 150 mM NaCl, pH7.6) plus tween 0.1% before incubation with the specific antibody against: c-Src (1:1000; 2110; Cell Signaling), p(Tyr416)Src family (1:1000, 6943; Cell Signaling), Fyn (1:1000, 4023; Cell Signaling), LC3 (1:1000, 12741; Cell Signaling), p62 (1:2000, P0067; Sigma), Beclin1 (1:1000, 3738; Cell Signaling), βActin (1:5000, A5316; Sigma), and VDAC1 (1:1000, 14734; Abcam) overnight, at 4°C. βActin was used as a control of loading proteins of total extracts.
Anti-rabbit (1:20,000; 31340; Thermo Fisher Scientific) or anti-mouse (1:20,000; 31340 and 31320, respectively; Thermo Fisher Scientific) IgG secondary antibodies conjugated to the alkaline phosphatase, prepared in 1% (w/v) BSA in TBS-T, were used for 1 h, at room temperature. Immunoreactive bands were visualized by alkaline phosphatase activity after incubation for 5 min with ECF reagent (GE Healthcare Bio-Sciences) on Bio-Rad ChemiDoc Touch Imaging System (Bio-Rad) and quantified using Image Lab analysis software (Bio-Rad).
Immunocytochemistry
To assess total and mitochondrial c-Src, Fyn and P(Tyr416) levels, Q7 and Q111 cells or primary neurons from WT and YAC128 mice were cultured on glass coverslips. Twenty-four h after transfection with mitoDsRed (transfection method in Restoration of Active SKF Alleviates HD Mitochondrial Dysfunction section), cells were fixed with 4% paraformaldehyde (pre-warmed at 37°C) for 20 min and permeabilized in 0.1% Triton X-100 in phosphate buffered saline (PBS), for 2 min.
Then, the cells were blocked for 1 h at room temperature with 3% (w/v) BSA in PBS and further incubated with the primary antibody prepared in blocking solution, overnight, at 4°C (antibodies referred above, and TFEB [13372-1-AP; Proteintech], LAMP1 [CD107a; Thermo Fisher Scientific], PINK1 [ab23707; Abcam], Parkin [ab15954; Abcam], Ubiquitin [Z0458; Dako], caspase3-cleaved [9664; Cell Signaling], at 1:200). Cells were then washed with PBS and incubated with the adequate secondary antibody (Alexa Fluor-594 goat anti-rabbit [R37117; Invitrogen], Alexa Fluor-488 donkey anti-rabbit [R37118; Invitrogen], and Alexa Fluor-488 donkey anti-mouse [R37114; Invitrogen]) at 1:300 in blocking solution for 1 h at room temperature.
Nuclei were stained with 1 μg/mL Hoechst 33342 in PBS (Invitrogen) for 10 min, and coverslips were mounted using Mowiol 40-88 (Sigma Chemical). Confocal images were obtained using a Plan-Apochromat/1.4NA 63 × lens on an Axio Observer.Z1 confocal microscope (Zeiss Microscopy, Jena, Germany) with Zeiss LSM 710 software.
Cells were also transfected with Mito-Keima (to assess mitophagic flux, plasmid No. 131626; Addgene) and mRFP-EGFP-LC3 plasmids (to assess autophagic flux, plasmid No. 21074; Addgene) when reaching ∼50% confluence. Mito-Keima is a pH sensitive marker of mitophagy due to its properties as a dual-excitation ratiometric fluorescent protein and resistance to lysosomal proteases. mRFP-EGFP-LC3 monitors autophagic flux based on different pH stability of EGFP and mRFP fluorescent proteins, with EGFP fluorescence being largely decreased in acidic lysosomes.
Cells were observed using live fluorescence microscopy after 48 h after transfection. Coverslips were gently washed twice with PBS warmed and kept in NaCl experimental media (132 mM NaCl, 4 mM KCl, 1 mM CaCl2, 1.2 mM NaH2PO4.H2O, 1.4 mM MgCl2, 6 mM glucose, 10 mM HEPES, pH 7.4) during live acquisition at room temperature. Images were acquired using the Alpha Plan-Apochromat/1.46 NA 100 × lens on a Spinning Disk Cell Observer confocal microscope (Zeiss Microscopy) with Zen Blue software 2012.
Quantitative reverse-transcription PCR
The RNA was extracted using Purezol™ (Bio-Rad) reagent as described by the manufacturer. RNA quantification was achieved using a Nanodrop apparatus. Five hundred nanograms of RNA was reverse transcribed using the iScript complementary DNA (cDNA) synthesis kit (Nzytech, Lisbon, Portugal), following the manufacturer's instructions. All specific oligonucleotides were designed using the primer design tool software from NIH (
Gene-specific primers used for real-time PCR reactions were: Src: forward 5′-GCCTCACTACCGTATGTCC-3′, reverse 5′-TTTTGATGGCAACCCTCGTG-3′; Fyn: forward 5′-AAGCACGGACGGAAGATGAC-3′, reverse 5′-ATGGAGTCAACTGGAGCCAC-3′; Actin: forward 5′-GGAGACGGGGTCACCCACAC-3′, reverse 5′-AGCCTCAGGGCATCGGAACC-3′; CTSD: forward 5′-CCTGGGCGATGTCTTTATTG-3′, reverse 5′-CCTGGGCGATGTCTTTATTG-3′; ATP6v0A1: forward 5′-CTGTTATCCTCGGCATCATCCAC-3′, reverse 5′-CAGGTAGCCAAACAACGAGGAC-3′.
PCR was performed with 50 ng of the cDNA and 400 nM of each primer using the iQ SYBR Green Supermix (Bio-Rad). PCR cycles proceeded as follows: Taq activation (95°C, 3 min), denaturation (95°C, 15 s), and annealing/extension (57°C, 45 s) using the Bio-Rad CFX 96 Real-time system, C1000 Thermal cycler (Bio-Rad). A melting curve was obtained under 0.5°C increments every 5 s, from 65°C to 95°C, with fluorescence recording after each temperature increment to verify the specificity of the amplification. The relative mRNA levels were estimated using Actin as a reference gene.
Oxygen consumption rate
Oxygen consumption rate (OCR) in striatal cells was measured using a Seahorse XFe-24 flux analyzer (Seahorse Bioscience, Billerica, MA), following the manufacturer's instructions. Striatal cells were seeded in XF24 cell culture microplates at a density of 25,000 (Q7)/35,000 (Q111) cells per well. Before the experiments, cells were washed and culture medium was replaced by assay medium DMEM-5030, supplemented with 25 mM glucose and 2 mM glutamine, pH 7.4. Experiments were performed at 37°C, and four baseline measurements of OCR were sampled before a sequential injection of mitochondrial complex V inhibitor oligomycin (1 μM), protonophore FCCP (1 μM) and antimycin A plus rotenone (1 μM each) to completely inhibit mitochondrial respiration. Mitochondrial basal respiration, maximal respiration, and ATP production were calculated and recorded by the Seahorse software. Data were normalized for protein levels.
MitoSOX fluorescence
Twenty-four h after transfection with GFP or GFP+Y527F (see the Restoration of Active SKF Alleviates HD Mitochondrial Dysfunction section), striatal cell lines or primary striatal neurons were incubated in experimental media (in mM: 132 NaCl, 4 KCl, 1 CaCl2, 1.2 NaH2PO4.H2O, 1.4 MgCl2, 6 Glucose, 10 HEPES, pH 7.4) plus 1 μM MitoSOX red (No. M36008; Thermo Fisher Scientific) for 25 min at 33°C or 37°C, respectively. Cells were then washed with experimental medium, and the experiment was recorded in experimental media using an Axio Observer Z1 system, a fully motorized inverted widefield microscope (Zeiss Microscopy) equipped with a large stage incubator for temperature and humidity control and EC plan-neofluar/1.3NA 40 × lens. MitoSOX fluorescence along time was imaged at 510 nm excitation and 580 nm emission. Fluorescence intensities were calculated using Fiji software.
TMRM fluorescence
Striatal cells and primary striatal neurons were transfected with GFP or GFP+Y527F for 24 h (see the Restoration of Active SKF Alleviates HD Mitochondrial Dysfunction section). Then, cells were incubated in experimental media with 10 nM TMRM+ (No. T668; Thermo Fisher Scientific), a concentration sufficient low to avoid quenching of the fluorescent signal in the mitochondrial matrix, for 30 min at 33°C or 37°C in the cells line or in neurons, respectively. Coverslips were washed twice with PBS and mounted in a pre-warmed insert in experimental media plus 10 nM TMRM+. TMRM+ fluorescence was monitored in a controlled temperature by excitation at 543 nm and emission at 458 nm using an LCI PlanNeofluar/1.3NA 63 × lens on a Carl Zeiss Axio Observed Z1 inverted confocal microscope with the CSU-X1M spinning disc technology.
Three images were collected every 10 s in the basal condition using Zen Black 2012 software (Zeiss). Cells were exposed to 2 μM FCCP to induce TMRM+ release from mitochondria, and 3 more images were collected every 1 min after FCCP exposure. Fluorescence intensity at each time point was analyzed in Fiji software using the time series analyzer plugin (v 3.0) developed by Balaji J (2007) at the Department of Neurobiology, UCLA.
Mitochondrial network and co-localization studies
MitoDsRed- and GFP/Y527F-transfected striatal cells were fixed with 4% paraformaldehyde (pre-warmed at 37°C) for 20 min, permeabilized in 0.1% Triton X-100 in PBS for 2 min, and blocked for 1 h, at room temperature in 3% (w/v) BSA in PBS. Nuclei were labeled with 4 μg/mL Hoechst 33342 for 15 min, and coverslips were mounted using Mowiol 40-88. Confocal images were obtained using a Plan-Apochromat/1.4NA 63 × lens on an Axio Observer.Z1 confocal microscope (Zeiss Microscopy) with Zeiss LSM 710 software.
Mitochondrial morphology and protein co-localization analysis were achieved using Macros in Fiji designed in our Lab by Dr. Jorge Valero (currently at Institute for Neuroscience of Castilla y León, University of Salamanca, Spain). Briefly, the image background was normalized using the function Subtract Background, included in Fiji. Mitochondria-targeting MitoDsRed images were extracted to grayscale. FindFoci function was then used to allow the identification of peak intensity regions (8) to show mitochondria-specific fluorescence. A threshold was applied to optimally resolve individual mitochondria.
Mitochondrial outlines were traced through the Analyze Particles function. Aspect ratio (the ratio between the major and minor axis of mitochondria) was used as an index of mitochondrial length alongside, or Roundness (a relationship between the area of mitochondria and its major axis). To obtain information about protein co-localization with mitochondria, a selection of mitochondrial regions of interest (ROIs) was done, and the respective protein Integrated Density inside the ROIs was considered. Y527F+GFP and GFP were analyzed in the same way, considering also the value of Integrated Density. Each value derived represents a single cell.
Fresh mitochondria isolation from mouse striatal tissue
Striatal tissue from WT and YAC128 mice (with 3, 6, or 12 months) was washed in ice-cold isolation buffer containing 225 mM mannitol, 75 mM sucrose, 1 mM EGTA, 5 mM HEPES, and pH 7.2/KOH. Striatal mitochondria were then isolated using discontinuous Percoll density gradient centrifugation, according to our previous work with some minor modifications (5). For this purpose, striatal tissues were homogenized with 20 up and down strokes in Dounce All-Glass Tissue Grinder (Kontes Glass Co., Vineland, NJ) using pestle A (clearance, 0.07–0.12 mm) followed by 20 up and down strokes with pestle B (clearance, 0.02–0.056 mm).
After a brief centrifugation at 1100 g for 2 min at 4°C, the supernatant was mixed with freshly made 80% Percoll prepared in 1 M sucrose, 50 mM HEPES, 10 mM EGTA, and pH 7.0 in a ratio 10:1. The Mix (previous supernatant with 80% Percoll) was then carefully layered on the top of freshly made 10% Percoll (prepared from 80% Percoll) and further centrifuged at 18,500 g for 10 min at 4°C. Supernatant was discarded, including the cloudy myelin containing fraction, leaving the mitochondria-enriched pellet in the bottom of the tube and the pellet resuspended in 1 mL of washing buffer containing 250 mM sucrose, 5 mM HEPES-KOH, 0.1 mM EGTA, and pH 7.2 and centrifuged again at 10,000 g for 5 min at 4°C. Finally, the mitochondrial pellet was resuspended in ice-cold washing buffer; the amount of protein was quantified by the Bio-Rad protein assay (Cat. No. 500-0006; Bio-Rad); and a Western blotting was performed.
Total H2O2 and reactive species levels determination
H2O2 levels were determined using Amplex® Red assay. Amplex Red reagent (10-acetyl-3,7-dihydroxyphenoxazine) is a substrate that reacts with H2O2 in a 1:1 stoichiometry to produce the red-fluorescent oxidation product, resorufin, which was monitored at 37°C (excitation 550 nm; emission 580 nm), allowing the monitoring of H2O2 production/release. After a washing step with Na+ medium (containing 140 mM NaCl, 5 mM KCl, 1 mM CaCl2, 1 mM MgCl2, 10 mM Glucose, 10 mM Hepes, pH 7.4/NaOH), H2O2 was measured in 10 μM Amplex Red plus 0.5 units/mL of horseradish peroxidase during 20 min using a microplate reader Spectrofluorometer Gemini EM (Molecular Devices).
NO and general redox changes were measured using DAF2-DA (10 μM) and H2DCFDA (20 μM), respectively. Briefly, cells were incubated for 30 min, at 33°C, in Na+ medium (described above). NO and redox modifications were measured by following DAF2 (491 nm excitation, 513 nm emission) and DCF (488 nm excitation, 530 nm emission) fluorescence, respectively at 33°C, continuously, for 20 min, using a Microplate Spectrofluorometer Gemini EM (Molecular Devices).
Apoptotic cell death
The nuclear morphology of the transfected striatal wild-type and mutant cells was analyzed by live fluorescence microscopy using Hoechst 33342 nucleic acid stain, a cell-permeant nuclear counterstain that emits blue fluorescence when bound to DNA. Cells mounted on 18-mm coverslips were washed with PBS and then incubated with 2 μg/mL Hoechst 33342 (No. 14533; Sigma) for 10 min, at 33°C. Cells were then washed five times in saline medium to remove extracellular dye, and they were further examined in an Axioskop 2 plus upright epi-fluorescence microscope (Zeiss) with PlanNeofluar/0.75NA 40 × lens.
Statistical analyses
Data were analyzed by using Excel (Microsoft, Seattle, WA) and GraphPad Prism 8 (GraphPad Software, San Diego, CA) software, and they are expressed as the mean ± standard error of the mean of the number of independent experiments indicated in figure legends. Comparisons among multiple groups were performed by one-way analysis of variance (ANOVA) followed by the Bonferroni or Dunnett's nonparametric Multiple-Comparison post hoc tests or by two-way ANOVA, followed by Sidak's Multiple-Comparison post hoc test.
Unpaired Mann–Whitney non-parametric test was also performed for comparison between two Gaussian populations, when applicable, as described in figure legends. Significance was defined as p < 0.05. “Electronic laboratory notebook was not used.”
Footnotes
Authors' Contributions
A.C.R., L.F., S.I.M., and R.V. designed the research. L.F., P.C., and L.D. performed most of the experiments and analyses. L.F. and S.I.M. wrote the article, with A.C.R. supervision and support from R.V. and M.R.H. A.C.R. supervised the research project. All authors approved the final article.
Author Disclosure Statement
The authors declare that they have no competing interests.
Funding Information
This work was financed by the European Huntington's Disease Network (EHDN) project, reference 1159, the European Regional Development Fund (ERDF), through Centro 2020 Regional Operational Programme under project CENTRO-01-0145-FEDER-000012-HealthyAging2020, and through the COMPETE 2020—Operational Programme for Competitiveness and Internationalisation and Portuguese national funds via “Fundação para a Ciência e a Tecnologia” (FCT), under projects UIDB/04539/2020 and UIDP/04539/2020, and FCT PhD fellowship SFRH/BD/148263/2019.
Supplementary Material
Supplementary Figure S1
Supplementary Figure S2
Supplementary Figure S3
Supplementary Figure S4
Supplementary Figure S5
Supplementary Figure S6
Supplementary Figure S7
Supplementary Figure S8
Supplementary Figure S9
Supplementary Figure S10
Supplementary Figure S11
Supplementary Figure S12
Supplementary Figure S13
Supplementary Figure S14
Supplementary Figure S15
Supplementary Figure S16
Supplementary Figure S17
Supplementary Figure S18
Supplementary Figure S19
Abbreviations Used
References
Supplementary Material
Please find the following supplemental material available below.
For Open Access articles published under a Creative Commons License, all supplemental material carries the same license as the article it is associated with.
For non-Open Access articles published, all supplemental material carries a non-exclusive license, and permission requests for re-use of supplemental material or any part of supplemental material shall be sent directly to the copyright owner as specified in the copyright notice associated with the article.
