




Abstract
Aims:
Oxidative modifications of cysteine (Cys) thiols regulate various physiological processes, including inflammatory responses. The thioredoxin (Trx) system plays a key role in thiol redox control. The aim of this study was to characterize the dynamic cysteine proteome of human macrophages upon activation by the prototypical proinflammatory agent, bacterial lipopolysaccharide (LPS), and/or perturbation of the Trx system.
Results:
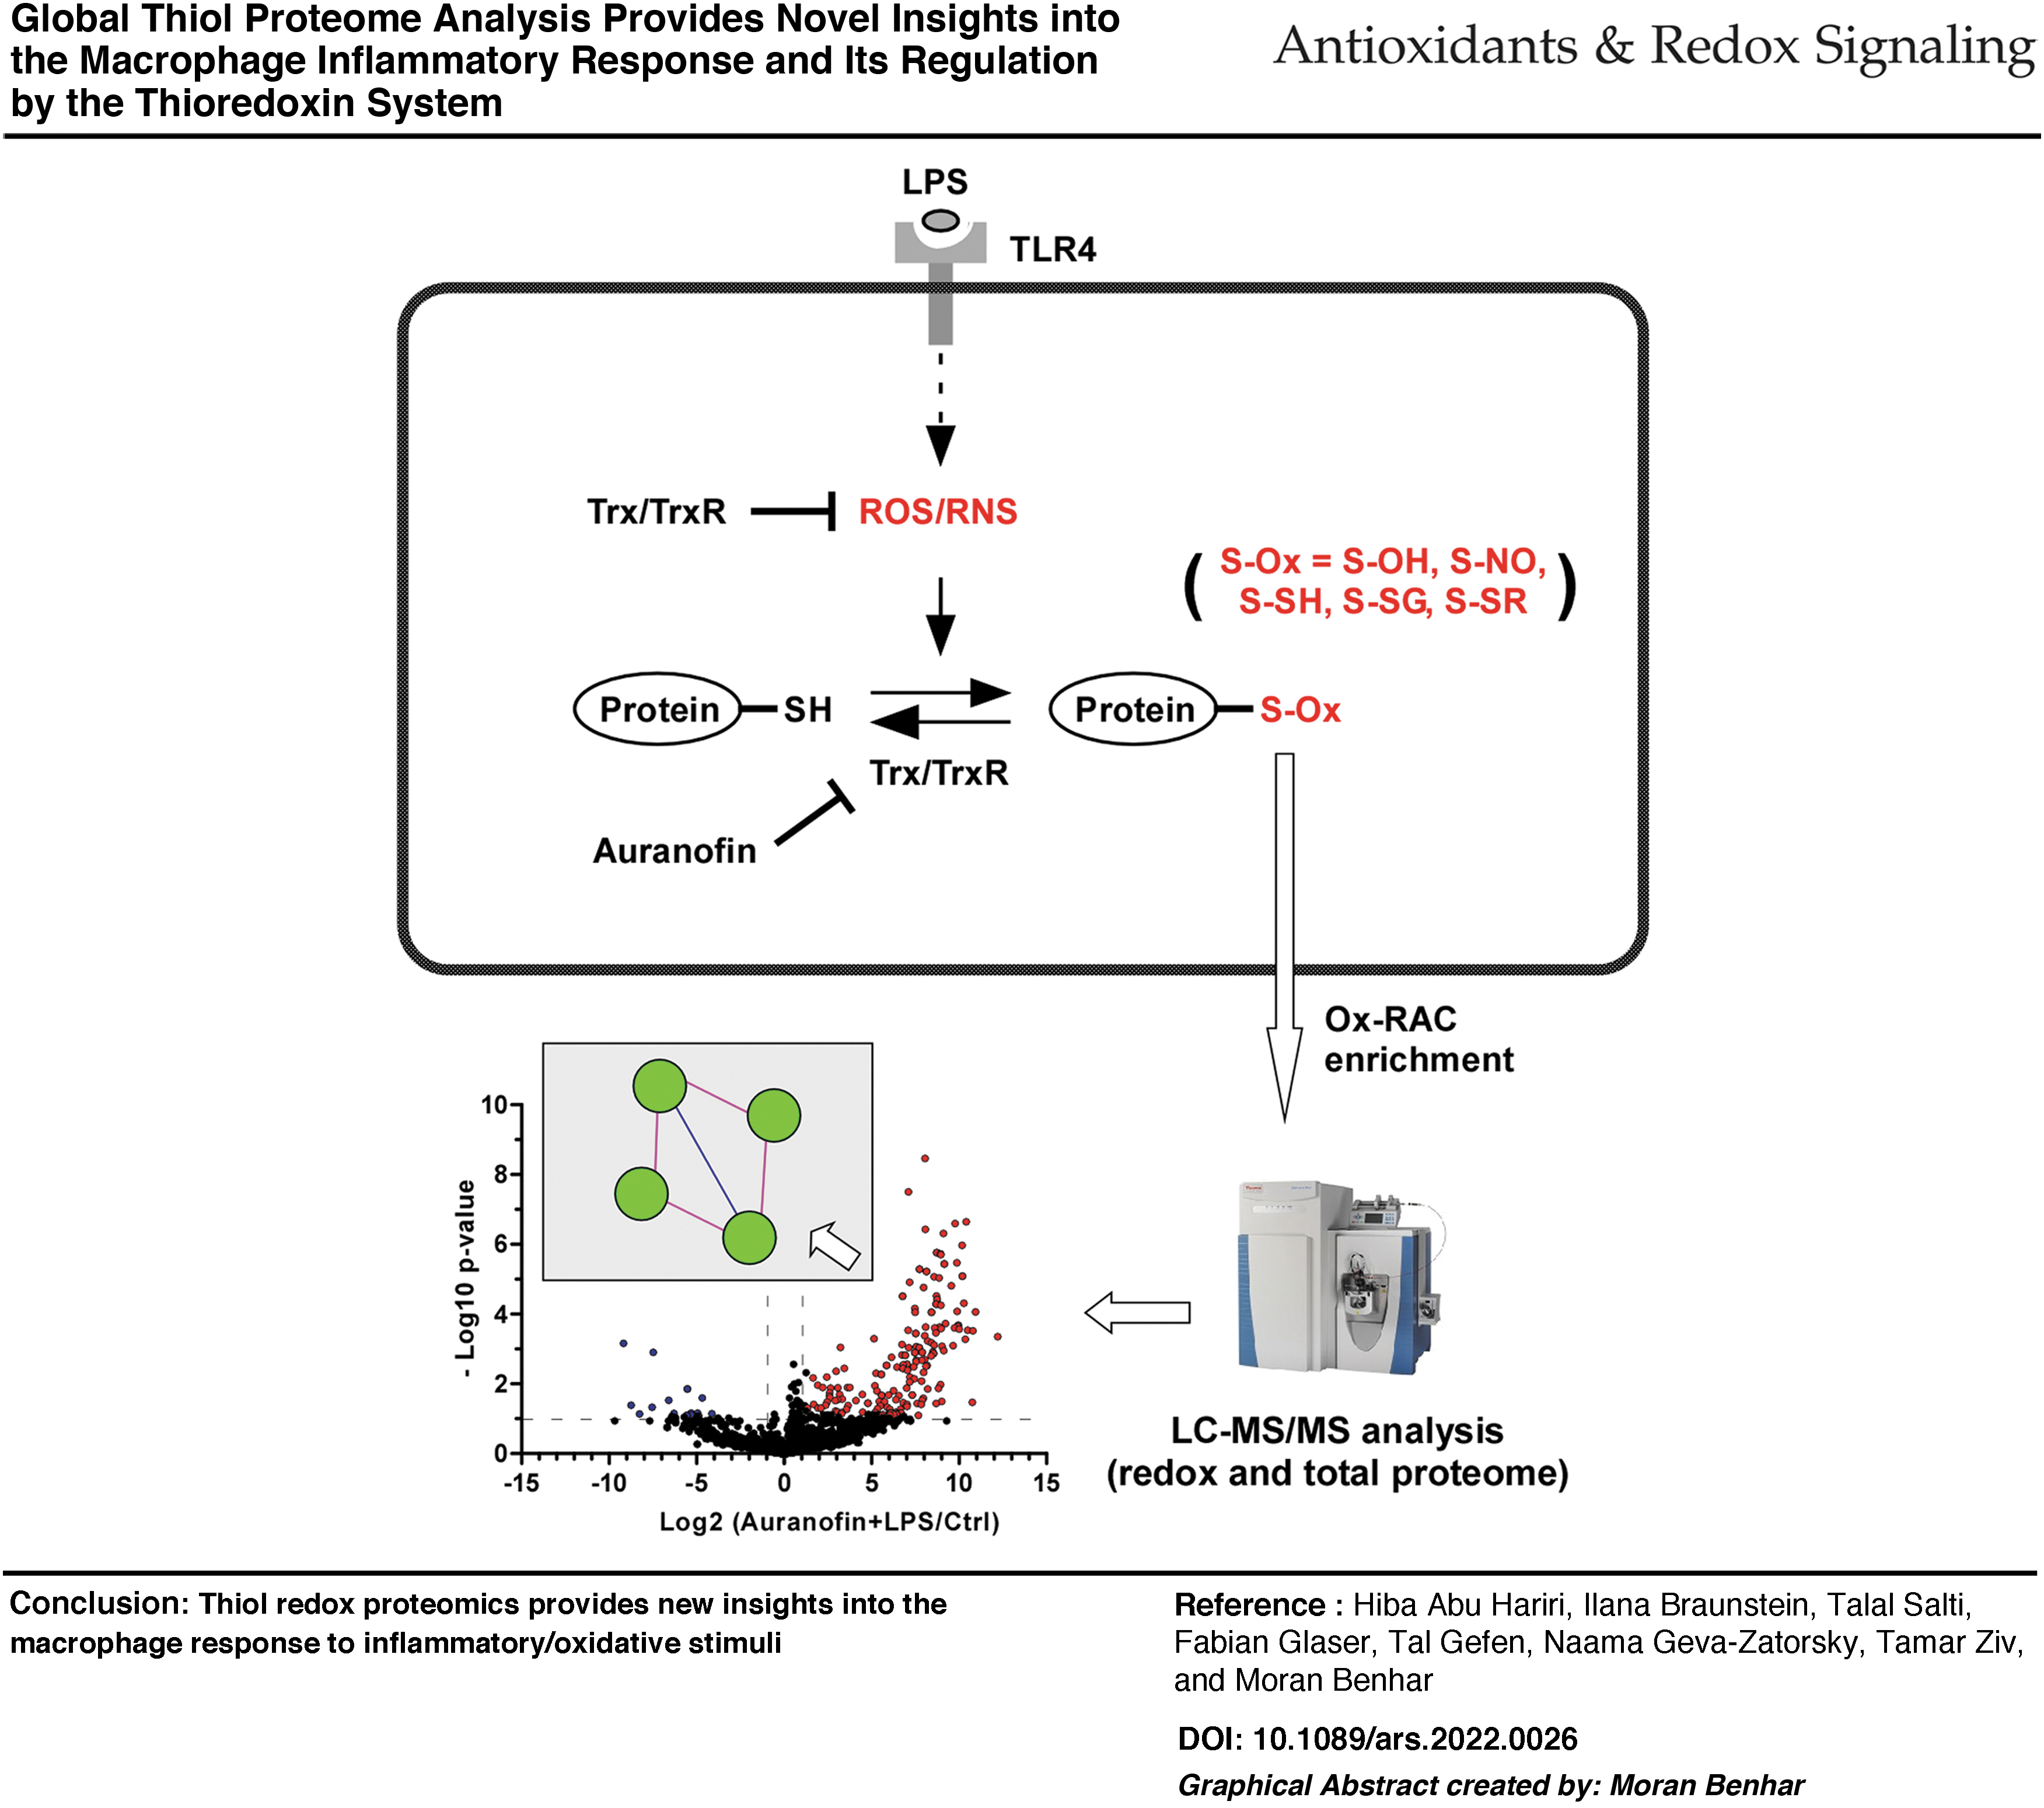
In this study, we profiled the cellular and redox proteome of human THP-1-derived macrophages during the early phase of LPS activation and/or inhibition of Trx system activity by auranofin (AF) by employing a peptide-centric, resin-assisted capture, redox proteomic workflow. Among 4200 identified cysteines, oxidation of nearly 10% was selectively affected by LPS or AF treatments. Notably, the proteomic analysis uncovered a subset of ∼100 thiols, mapped to proteins involved in diverse processes, whose oxidation is antagonistically regulated by LPS and Trx. Compared with the redox proteome, the cellular proteome was largely unchanged, highlighting the importance of redox modification as a mechanism that allows for rapid modulation of macrophage activities in response to a proinflammatory or pro-oxidant insult. Structural–functional analyses provided mechanistic insights into redox regulation of selected proteins, including the glutathione-synthesizing enzyme, glutamate–cysteine ligase, and the autophagy adaptor, SQSTM1/p62, suggesting mechanisms by which macrophages adapt and fine-tune their responses according to a changing inflammatory and redox environment.
Innovation:
This study provides a rich resource for further characterization of redox mechanisms that regulate macrophage inflammatory activities.
Conclusion:
The dynamic thiol redox proteome allows macrophages to efficiently respond and adapt to redox and inflammatory challenges. Antioxid. Redox Signal. 38, 388–402.
Introduction
Inflammation is an essential immune response that promotes survival during infection or injury and maintains tissue homeostasis under a variety of stressful conditions (Medzhitov, 2010). Macrophages play a pivotal role in activating and directing the inflammatory response. A hallmark of inflammatory macrophage activation is generation of reactive oxygen and nitrogen species (ROS and RNS), which play an important role in the host response to infection and other immune challenges (Bogdan et al, 2000; Nathan and Cunningham-Bussel, 2013).
Innovation
This study provides a broad overview of the redox proteome of classically activated macrophages and the effects of perturbing the macrophage thioredoxin system. The study contributes to a better understanding of redox regulation of the cellular inflammatory response.
For a long time, macrophage-derived ROS/RNS were considered to act mainly as cytotoxic and antimicrobial agents. However, in recent years, accumulating evidence shows that ROS/RNS also act as signaling mediators that regulate multiple cellular pathways and thus influence macrophage activation and function (Brüne et al, 2013; Lei et al, 2015). While the importance of such regulatory effects of reactive species is increasingly recognized, the underlying molecular mechanisms remain incompletely understood.
ROS/RNS regulate cellular processes, in large part, through oxidative modifications of cysteine (Cys) thiols in proteins. Reversible thiol redox modifications, including sulfenylation, nitrosylation, and glutathionylation, have been implicated in myriad cellular processes, including metabolism, gene transcription and translation, cell movement, and survival (Finkel, 2012; Go and Jones, 2013).
Reversal of oxidative thiol modifications is largely mediated by thioredoxin (Trx), reduced glutathione (GSH), and their associated redox systems (Benhar, 2018; Go and Jones, 2013). In addition, Trx and GSH are integral components of ROS/RNS-detoxifying systems and thereby govern thiol redox homeostasis and signaling (Benhar, 2018; Go and Jones, 2013; Herrmann and Dick, 2012; Moldogazieva et al, 2018).
In recent years, there has been considerable interest and progress in understanding the interplay between thiol redox systems and inflammatory pathways in macrophages (Short et al, 2016; Weigert et al, 2018). In this context, studies have uncovered multiple roles for the GSH system in these cells. Among other things, it was shown that (1) GSH protects monocytes/macrophages from oxidized low-density lipoprotein-induced injury (Wang et al, 2006); (2) GSH oxidation, triggered by metabolic stress, increases macrophage chemotactic activity (Qiao et al, 2009); (3) GSH availability regulates macrophage-dependent activation of CD8+ T cells (Sha et al, 2015); and (4) glutaredoxin 1 plays an important role in immunometabolic regulation during nutrient stress (Ahn et al, 2022).
Regarding the Trx system, reports have shown that the macrophage Trx system regulates inflammatory pathways by modulating the activation of the transcription factor, NF-κB, and the NLRP3 inflammasome (Heilman et al, 2011; Isakov et al, 2014; Muri et al, 2020). Of further relevance, a number of studies have characterized changes in the macrophage redox proteome in response to specific stimuli (Ben-Lulu et al, 2014; Fuhrmann et al, 2019; Ibáñez-Vea et al, 2018; Su et al, 2014; Ullevig et al, 2016) or identified specific thiol switches (Kim et al, 2012; Trümper et al, 2020).
Nonetheless, there is still limited knowledge regarding thiol-based signaling in activated macrophages and its regulation by Trx. In particular, site-specific information on oxidation events is rudimentary and many structural–functional aspects remain undetermined. Hence, there is a need to better characterize the thiol proteome of macrophages under various physiological/pathological conditions and understand how Trx and thiol redox switches specifically modulate inflammatory processes.
In this study, we aimed to analyze changes in the macrophage thiol proteome and total proteome in response to activation of the pattern recognition receptor, Toll-like receptor 4 (TLR4), and/or perturbation of the Trx system. In this context, we hypothesized that inhibition of the Trx system will allow us to uncover dynamic thiol oxidation events that might otherwise be undetected.
Our redox proteomic investigation resulted in identification of hundreds of redox-sensitive Trx-regulated Cys thiols across a diverse set of proteins involved in multiple pathways and signaling networks. The presented proteomic, bioinformatic, and functional analyses provide both a valuable resource and new insights into thiol redox regulation of the macrophage inflammatory response.
Results and Discussion
Study overview and assessment of the effects of lipopolysaccharide and Trx system inhibition on cellular redox state
The primary goal of this study was to characterize changes in the redox proteome of the human macrophage upon induction of an inflammatory response and/or inhibition of Trx system activity. We focused on the well-established lipopolysaccharide (LPS)-TLR4 pathway, in particular on redox alterations that occur in the early phase of the TLR4-dependent response.
Because of the need to obtain a large number of cells in the proteomic experiments, we chose to use phorbol 12-myristate 13-acetate (PMA)-differentiated THP-1 cells. These cells are commonly employed as a human macrophage model and have been extensively used to study monocyte/macrophage function and biology (Chanput et al, 2014; Qin, 2012).
With these aims and considerations in mind, the experimental design consisted of exposing THP-1-derived macrophages to LPS in the absence or presence of auranofin (AF), a highly specific and potent inhibitor of Trx reductase (TrxR) (Zhang et al, 2019). We rationalized that the combination of AF with LPS will allow us to detect substrates of Trx whose oxidation is triggered by TLR4 activation. Moreover, we reasoned that inhibition of the Trx/TrxR system should facilitate detection of transient and dynamic thiol oxidation events.
Before initiating the proteomic studies, we examined the effects of LPS and AF on the cellular redox state by monitoring several redox parameters, including GSH status and TrxR activity. As shown in Figure 1A, AF potently inhibited total TrxR activity (∼95% inhibition relative to vehicle), both in resting and LPS-activated macrophages, while LPS itself had no effect. Next, we observed that GSH levels were hardly affected by LPS, but were increased upon AF or AF+LPS treatments (Fig. 1B). We found that treatment with AF either alone or in combination with LPS resulted in ∼30% increase in GSH content compared with untreated control (n = 5, p < 0.05), while oxidized glutathione (GSSG)/GSH ratios did not change significantly in response to any of the treatments (Fig. 1B and Supplementary Fig. S1A).

We then examined changes in ROS levels using several probes. Assays using the ROS-sensitive probe, 2′,7′-dichlorofluorescin diacetate (H2DCFDA), showed that LPS stimulation led to a significant increase in ROS formation at 4 h (38% increase, n = 4, p < 0.05), with a smaller increase detected at 2 h (Fig. 1C and Supplementary Fig. S1B). AF+LPS treatment had an effect similar to that of LPS-only treatment, while exposure to AF alone induced a modest, but not statistically significant, increase in ROS levels (Fig. 1C). Assays using the probes, dihydroethidium (DHE) and Amplex Red, indicated that both superoxide and H2O2 were involved in these responses (Fig. 1D and Supplementary Fig. S1C). The involvement of H2O2 is further supported by changes in the redox state of several peroxiredoxins (Prdxs; described below). We also observed that the treatments did not increase cell death above basal levels (not shown).
Altogether, these measurements provide a general view of cell redox changes upon TLR4 activation and inhibition of the Trx system. The results indicate that TLR4 activation triggers the formation of ROS (peroxide and superoxide) without altering TrxR activity or GSH levels, whereas AF treatment leads to an increase in GSH content, possibly reflecting cellular adaptation to TrxR inhibition.
Of note, our results regarding the redox effects of LPS are in agreement with previous studies about ROS production and dynamics in LPS-stimulated macrophages (Fuhrmann et al, 2019; Jabaut et al, 2013; Platnich et al, 2018). Based on these results and prior research, we chose a 4-h stimulation duration for the subsequent investigation of the thiol redox proteome.
Thiol redox proteomics reveals changes in cysteine oxidation induced by LPS and AF
We proceeded to perform large-scale analysis of LPS and AF effects on the thiol redox proteome using the oxidized Cys resin-assisted capture (Ox-RAC) proteomic workflow (Fig. 2A, B), a powerful approach that enables the identification of redox-sensitive Cys residues in complex samples (Behring et al, 2020; Kohr et al, 2011). Accordingly, whole-cell lysates were prepared and enrichment of oxidized proteins was accomplished using the Ox-RAC method, performed in a peptide-centric manner. The enriched Cys peptides were identified by mass spectrometry (MS)-based proteomic analysis. The starting lysate material was also subjected to liquid chromatography–tandem mass spectrometry (LC-MS/MS) analysis to profile the general proteome. In both proteomic screens, three biological replicates were performed for each condition. In the Ox-RAC studies, a total of 4194 unique Cys-containing sites in 1322 proteins were identified across all samples (Supplementary Table S1). In the whole-cell proteome analyses, a total of 4977 proteins were identified across the samples (Supplementary Table S2).

Hierarchical cluster analysis was applied to visualize the experimental specificity and reproducibility. Reassuringly, the triplicate Ox-RAC enriched fractions clustered together (Fig. 2C). This analysis also uncovered patterns of thiol oxidation/reduction, highlighting classes of Cys thiols that are oxidized/reduced following LPS and/or AF treatments (Fig. 2C); in particular, it highlighted the significant impact of AF on the redox proteome. A principal component analysis (PCA) also indicated the clustering of biological replicates and the marked effect of AF. Indeed, the PCA plot clearly shows that the treatment groups separate according to AF supplementation (Supplementary Fig. S2).
Next, a more detailed analysis of the redox and global proteome was undertaken to identify differentially oxidized or expressed proteins (see the Materials and Methods section), the results of which are depicted in the volcano plots shown in Figure 3A. From this analysis, it was evident that in the context of both LPS and AF exposures, the redox proteome is much more dynamic compared with the global proteome, as clearly seen from the overall shape of the volcano plots. In terms of triggering thiol oxidation, LPS exerted a modest effect, considerably smaller than that of AF. Notably, AF+LPS cotreatment had the largest effect on thiol oxidation, which is consistent with the premise that Trx system activity governs many of the LPS-induced oxidative events.

We therefore compiled a list of proteins differentially oxidized as a function of cell exposure to LPS, AF, or both, which served as a basis for bioinformatic and functional analyses (see the Materials and Methods section). In this approach, sites that showed higher oxidation in response to AF+LPS compared with AF alone were considered as LPS-dependent oxidation events. In addition, proteins that displayed expression changes that paralleled the redox effects were removed from the list. This analysis revealed that LPS-dependent oxidation occurred in 161 Cys thiols in 119 proteins, while LPS-dependent reduction occurred in 136 thiols in 95 proteins. In addition, AF-only treatment induced the oxidation of 328 thiols in 166 proteins and reduction of 132 thiols in 89 proteins.
Among many protein/thiols identified as sensitive to Trx inhibition, two illustrative examples are GAPDH (Cys247) and CAMK1 (Cys179), previously shown to be redox sensitive and involved in macrophage activities (Jia et al, 2014; Kambe et al, 2010; Mustafa Rizvi et al, 2021; Takata et al, 2020), but for which the precise mechanism of reduction remains to be established.
To further interrogate the redox effects elicited by LPS and AF, we performed gene ontology (GO)-based enrichment analysis. GO biological process (BP) and cellular component (CC) enrichment analyses revealed that AF- and LPS-induced changes in thiol oxidation were associated with both overlapping and distinct cellular processes and compartments (Fig. 3B, C, and Supplementary Table S3). A STRING network analysis of the proteins possessing either significantly oxidized or reduced Cys thiols further highlighted the association of thiol oxidation/reduction with specific cellular processes and compartments (Supplementary Fig. S3).
Considered together, the GO enrichment and STING interaction analyses provided several insights, as follows. First, many proteins involved in integrin signaling and cell adhesion are preferentially oxidized in response to both LPS and AF treatments. Second, a subset of proteins involved in the translation machinery is oxidized by LPS, as are proteins related to receptor signaling and inflammatory responses. Third, proteins involved in cell growth and redox homeostasis or localized to stress fibers are among the most susceptible to AF-induced thiol oxidation, whereas Golgi-associated proteins are preferentially reduced.
It was somewhat unexpected that a group of Cys thiols became less oxidized upon AF treatment (Figs. 2 and 3 and Supplementary Table S1). The mechanistic basis for this effect is uncertain, but may be linked in part to elevation of GSH levels (Fig. 1), a possibility that warrants further investigation. Of further note, decreased oxidation following AF treatment was detected in a number of structural thiols in proteins that transit through or reside in the secretory pathway, for example, Cys362 and Cys364 in the protein, Notch2.
These findings may reflect some inhibitory effect of AF on oxidative protein folding (a process in which Trx may play some role) (Lu and Holmgren, 2014). Altogether, the bioinformatic analyses indicate that thiol redox changes are stimulus dependent and exhibit a distinct functional and spatial landscape.
Effects of LPS and AF on the Trx network
Consistent with AF inhibition of TrxR, the MS data showed that the catalytic Cys residue in Trx1 (Cys32) was oxidized in AF-treated cells (Supplementary Table S1). A similar effect was seen for another substrate of TrxR1, Trx-related protein of 14 kDa (TRP14, TXNDC17) (Jeong et al, 2004), where Cys43 and Cys46 in its active site became oxidized upon AF treatment (Supplementary Table S1). In addition, the MS data indicated increased oxidation of Cys172 in Prdx2 in the AF treatment group. This Cys residue participates in the catalytic cycle of Prdx2 by forming a disulfide bond with peroxidatic Cys52, which is then reduced by Trx (Poynton and Hampton, 2014).
To further validate and extend these findings, we biochemically analyzed the redox state of Trx1 and Prdxs 1, 2, and 3. The redox state of Trx1 was assessed by employing a thiol-specific labeling strategy using a 5 kDa polyethylene glycol-conjugated maleimide (PEG-Mal), referred to as the PEG-switch assay (Fig. 4A and Burgoyne et al, 2013). In this method, reversibly oxidized thiols are labeled with a ‘heavy’ PEG tag, leading to a mobility shift on SDS-PAGE. Using this assay, we confirmed the increased oxidation of Trx1 in cells exposed to AF (Fig. 4B). The redox states of Prdxs 1, 2, and 3 were next assessed using nonreducing Western blot analysis. AF treatment caused a clear shift of these Prdxs to a more oxidized state (Fig. 4C). In the case of Prdxs 1 and 3, their oxidation was also increased by LPS stimulation, while maximal oxidation was triggered by AF+LPS cotreatment (Fig. 4C). Note that unlike cytosolic Prdxs 1 and 2, Prdx3 is localized to the mitochondrion, thus these data indicate that perturbation of the mitochondrial Trx2/TrxR2 system contributes to the above effects.

Redox-dependent regulation of glutamate–cysteine ligase
In subsequent analyses, we focused on selected proteins of interest. Our attention was first drawn to GCLC and GCLM, the catalytic and regulatory subunits of the glutamate–cysteine ligase (GCL), the enzyme that catalyzes the rate-limiting step in GSH biosynthesis (Franklin et al, 2009). GCL activity is regulated at several levels, including transcriptional and post-translational controls. Induction of GCL activity in response to proinflammatory or pro-oxidant stimuli is often due to transcriptional activation mediated by Nrf2, but in addition, post-translational modifications enable rapid modulation of GCL activity (Franklin et al, 2009). Specifically, Kavanagh and colleagues reported that oxidizing agents (such as H2O2) stimulate GCL activity mainly by stabilizing the GCLC/GCLM holoenzyme complex (Krejsa et al, 2010); however, the role of specific Cys residues was not determined. In another study (Backos et al, 2011), Franklin and coworkers showed that the lipid peroxidation product, 4-hydroxy-2-nonenal, directly modified Cys553 of GCLC and Cys35 of GCLM in vitro, which significantly increased monomeric GCLC enzymatic activity, but reduced GCL holoenzyme activity and complex formation. Thus, the mechanisms of GCL redox regulation are not fully elucidated and seem to differ according to the oxidizing agent.
Our proteomic data revealed that AF+LPS treatment led to significantly increased oxidation of GCLC on Cys152 and Cys553, and GCLM on Cys35 [all showing an approximately fourfold increase in (log2) intensity] (Supplementary Table S1). Using the PEG-switch assay, we observed that AF treatment promoted the oxidation of GCLC, which was enhanced by cotreatment with LPS (Fig. 5A). In addition, a nonreducing Western blot analysis revealed increased formation of the GCL heterodimer by AF and more so by AF+LPS (Fig. 5B). Importantly, in correlation with thiol oxidation, the enzymatic activity of GCL was modestly increased by AF treatment and markedly increased by AF+LPS cotreatment (Fig. 5C).
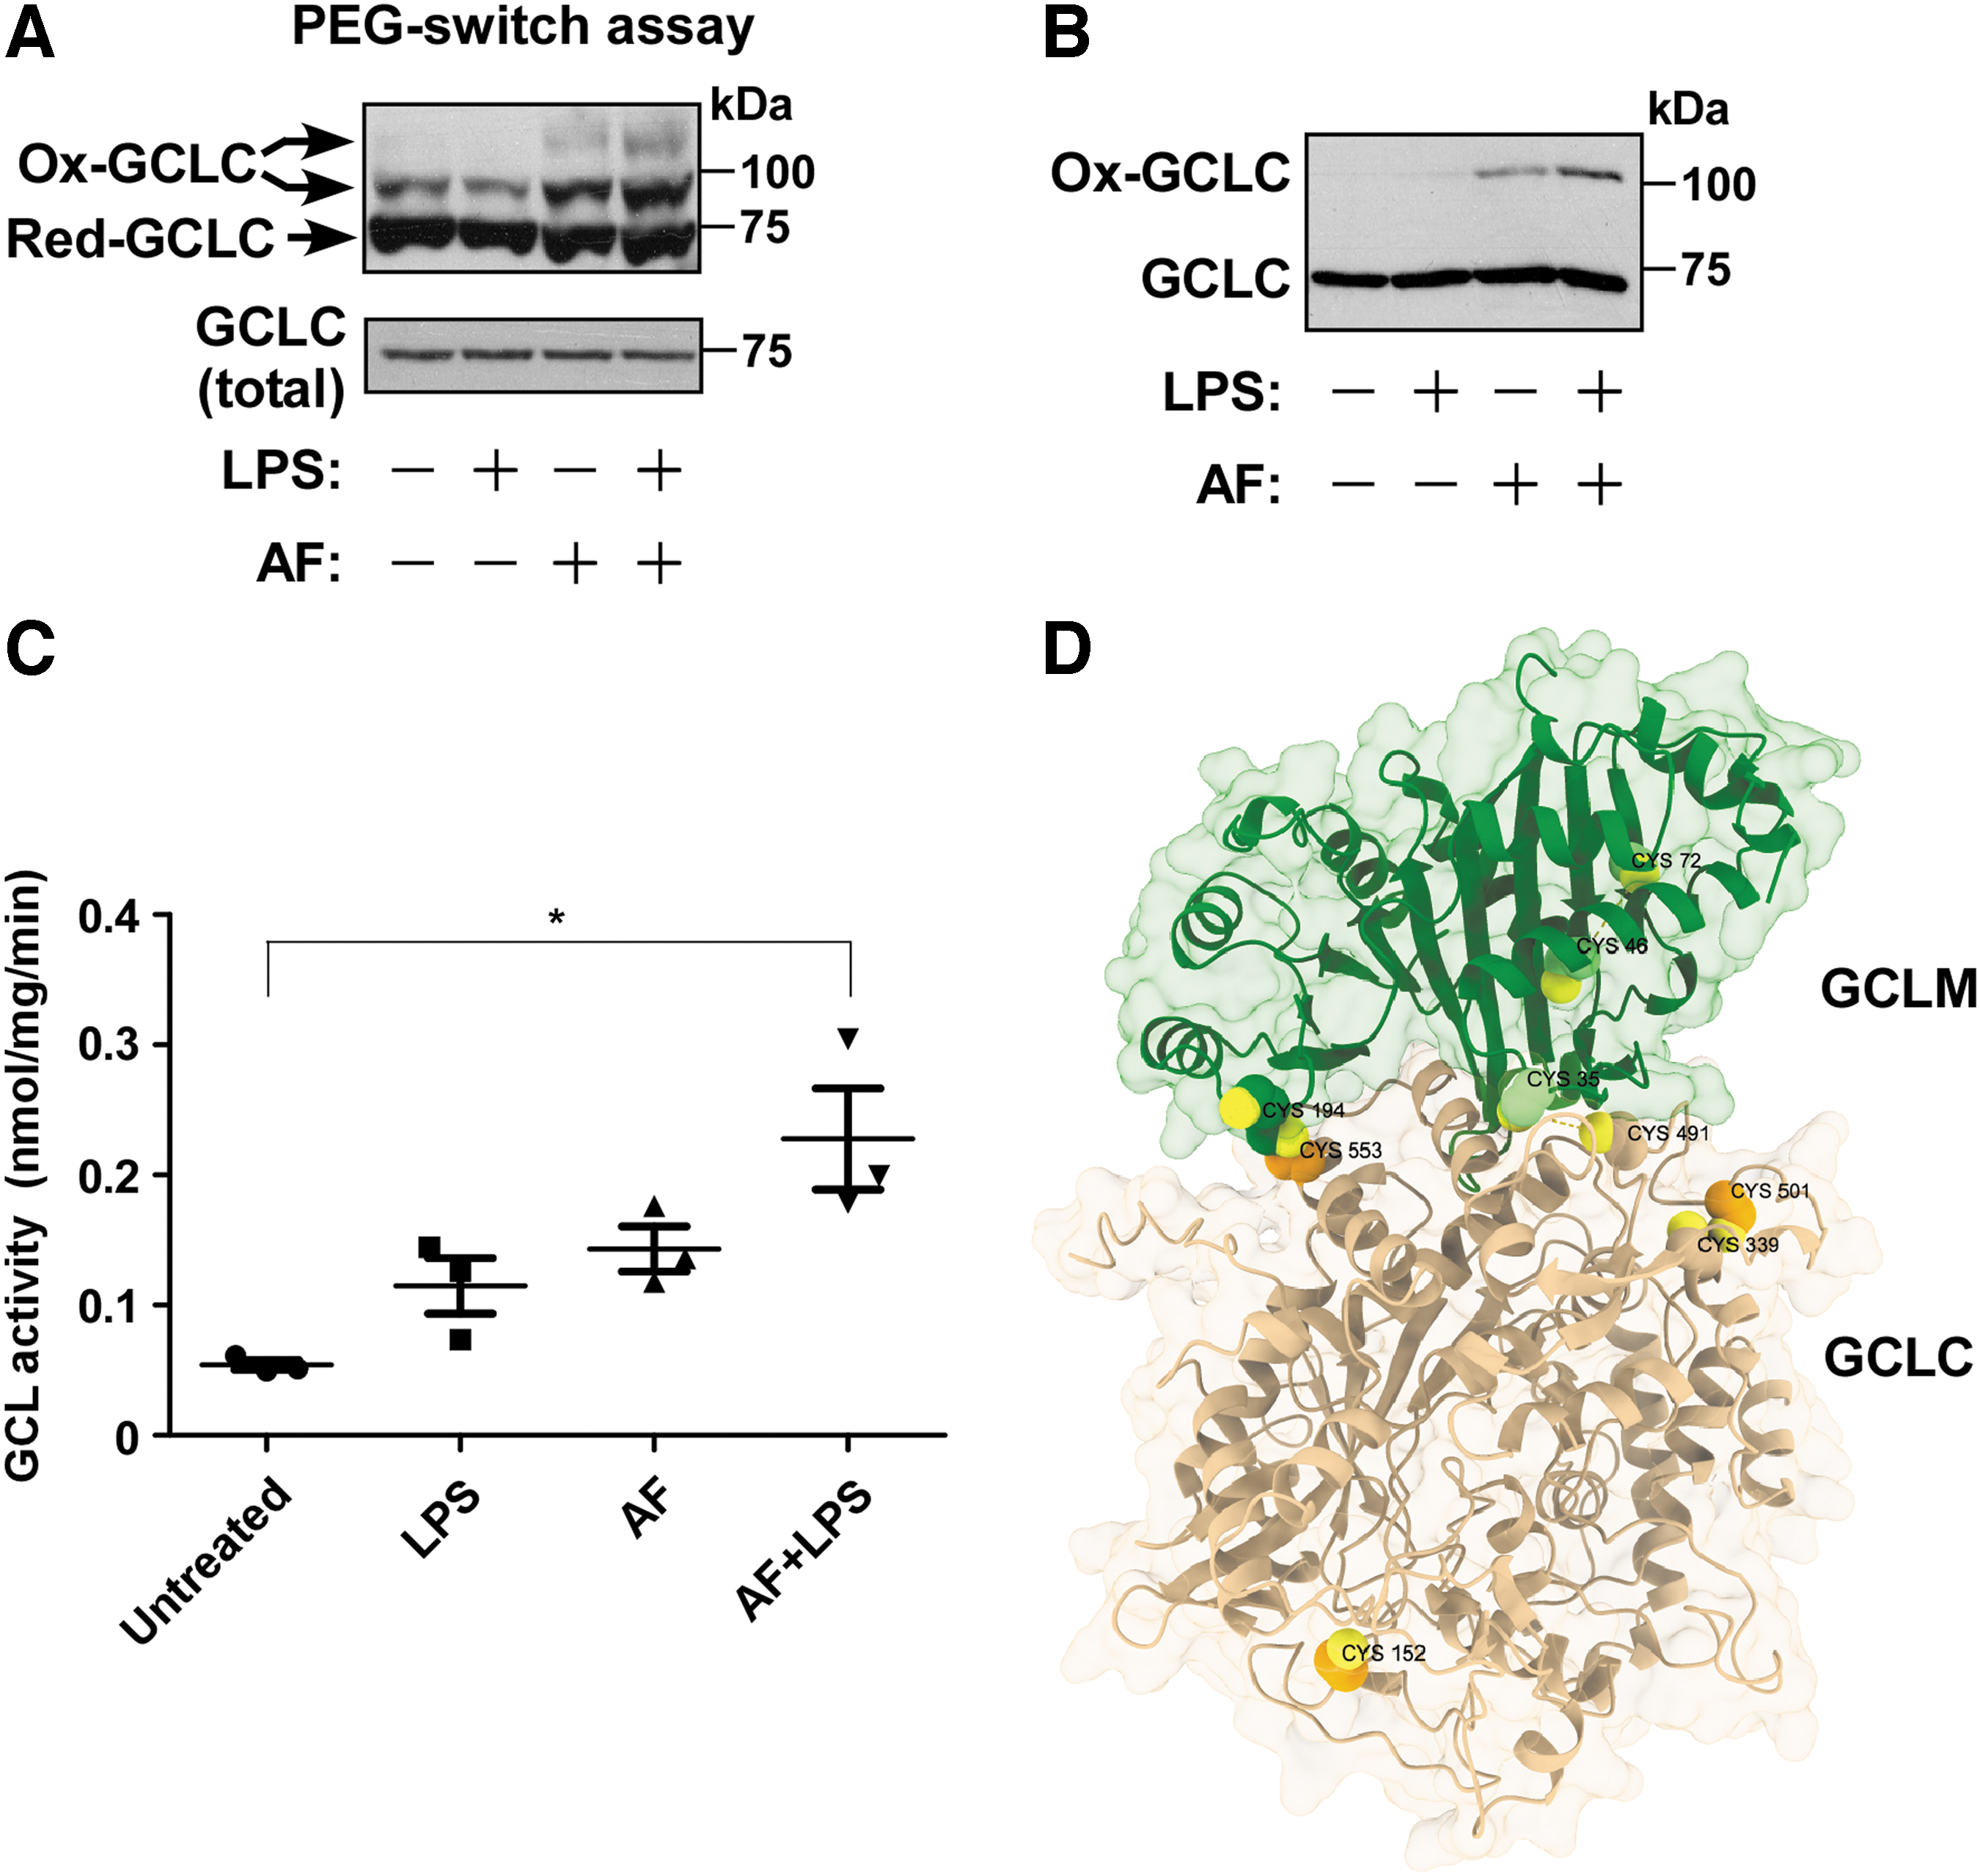
We generated a three-dimensional model of the GCLC-GCLM complex using the AlphaFold2-multimer method (Fig. 5D). This model suggests that several of the redox-sensitive thiols, including GCLC Cys553 and GCLM Cys35, are located at, or very close to, the dimer interface, but far from the active site (Fig. 5D). According to the model, GCLC Cys553 lies in close proximity to GCLM Cys194, which may allow the formation of an intermolecular disulfide bridge.
Altogether, our results suggest that thiol oxidation stimulates GCL activity by stabilizing the GCLC-GCLM heterodimer, which may explain the increase in GSH levels observed in response to AF or AF+LPS treatments noted above. These findings thus provide mechanistic insight into the regulation of GCL activity in response to proinflammatory and pro-oxidative stress.
Redox-dependent regulation of SQSTM1/p62
SQSTM1/p62 (hereafter p62) is a multidomain, multifunctional adaptor protein involved in several important cellular pathways, including selective autophagy, and is implicated in inflammatory responses (Sánchez-Martın and Komatsu, 2018). P62 harbors 14 Cys residues located in different domains of the protein. A previous study showed that oxidation of p62 is required for prosurvival autophagy in response to certain stresses, such as oxidative stress triggered by H2O2 (Carroll et al, 2018). It was found that oxidation of p62 promotes its oligomerization due to formation of intermolecular disulfide bridges, a process that requires Cys105 and Cys113 (Carroll et al, 2018).
Our redox proteomic analysis revealed increased oxidation (greater than fourfold change, log2) of Cys113 upon AF or AF+LPS treatment, yet it identified additional redox-sensitive thiols, namely Cys128, Cys131, Cys289, and Cys290 (Supplementary Table S1). Of note, Cys128 and Cys131 are located in the ZZ-type zinc finger (ZZ) domain, a protein–protein interaction domain involved in some of the functions of p62 (Sánchez-Martın and Komatsu, 2018). These redox-sensitive Cys residues of p62 are highly conserved across vertebrates (Fig. 6A). Structural studies demonstrated that Cys128 and Cys131 coordinate one of two zinc atoms within this domain (Kwon et al, 2018). Our proteomic data show that these thiols are oxidized upon cell treatment with AF, an effect enhanced by cotreatment with LPS (Supplementary Table S1). These results hint at a possible zinc-redox switch (Pace and Weerapana, 2014). In line with these data, using the PEG-switch assay, we observed an increase in p62 oxidation in AF-treated cells, an effect augmented by LPS cotreatment (Fig. 6B). In addition, we could detect a disulfide-linked conjugate of p62 in AF or AF+LPS-treated cells (Fig. 6C).

TLR4 activation is known to induce autophagy in macrophages, a process regulated by p62 (Fujita and Srinivasula, 2011). The protein, LC3, is well known as an autophagosomal marker, where accumulation of its lipidated form, termed LC3-II, is commonly used to monitor the induction of autophagy (Kimura et al, 2009). As shown in Figure 6D, accumulation of LC3-II was evident in AF+LPS-treated cells, which was higher compared with cells treated with LPS alone.
Last, we found that incubating cell lysates (from AF-treated cells) with a complete Trx/TrxR system reversed the oxidation of p62 (Fig. 6E). Collectively, these results suggest that p62 is dynamically oxidized upon TLR4 signaling and that Trx limits p62 oxidation to attenuate autophagy.
Oxidation of GCLC and p62 following macrophage infection with bacteria
To further explore the possible physiological relevance of the above observations, we analyzed the redox state of GCLC and p62 in bacteria-stimulated macrophages, using three strains of Gram-negative bacteria, Klebsiella pneumoniae, Bacteroides fragilis, and Campylobacter jejuni. Klebsiella species have become important pathogens in nosocomial infections, while B. fragilis and C. jejuni can cause gastrointestinal infections (Li et al, 2014; O'Brien, 2017; Yekani et al, 2020).
Accordingly, THP-1-derived macrophages were infected with each bacterial strain, either alone or in combination with AF. Redox analysis revealed that macrophage exposure to these three bacteria induced GCLC oxidation, an effect potentiated by AF (Fig. 7). In addition, levels of oxidized p62 were increased in bacterially infected cells that were cotreated with AF, compared with noninfected cells or cells treated with AF alone (Fig. 7).

These data thus suggest that oxidation of GCLC and p62 occurs upon macrophage exposure to live bacteria in a process regulated by the Trx system.
Conclusions
Detailed characterization of the dynamic thiol proteome of inflammatory cells is key to elucidating redox mechanisms that regulate the inflammatory response. This study represents a large-scale analysis of the Cys proteome of TLR4-activated human macrophages and provides a detailed view of the effects of perturbing the macrophage Trx system. An important question to consider in this context is whether thiol oxidation events correspond to redox signaling or rather reflect an oxidative stress response.
The present redox, bioinformatic, and functional analyses suggest that TLR4-mediated thiol oxidation largely corresponds to redox signaling, while the oxidative processes seen upon inhibition of the Trx system mainly reflect an adaptation toward oxidative stress. Thus, our proteomic and functional studies provide a molecular basis to elucidate the roles of redox pathways in inflammation regulation and cellular adaptation to the proinflammatory and pro-oxidative environment.
Further studies are warranted to characterize specific thiol switches, link them to specific oxidants and subcellular locations, and establish their importance in vivo.
Finally, an added value of this work lies in its analysis of the effects of the drug, AF, on the thiol redox proteome. AF is an approved drug for treatment of rheumatoid arthritis and is currently in clinical trials for several cancer types and immune-mediated disorders. Recent evidence suggests its potential role in the treatment of COVID-19 (Sonzogni-Desautels and Ndao, 2021). Our study promotes a deeper understanding of the redox effects of this old drug that is considered for repurposing in the treatment of cancer and immune disorders (Roder and Thomson, 2015).
Altogether, our data provide a useful resource for future studies about the redox control of inflammation and the potential for targeting the Trx system therapeutically in inflammatory diseases.
Materials and Methods
Antibodies and reagents
The following primary antibodies were used in this study: anti-Trx1 (11538; Cayman Chemical), anti-Prdx1 (ab41906; Abcam), anti-Prdx2 (ab109367; Abcam), anti-Prdx3 (ab16751; Abcam), anti-GCLC (sc-390811; Santa Cruz Biotechnology), anti-LC3B (2775; Cell Signaling Technology), and anti-SQSTM1/p62 (5114; Cell Signaling Technology). The antibodies were used at a dilution of 1:1000, except for anti-Trx1 (1:500) and anti-Prdx1 (1:2000).
LPS from Escherichia coli 055:B5 (No. L4005) and PMA (No. P8139) were purchased from Sigma. AF (No. BML-EI206-0100) was purchased from Enzo Life Sciences. N-ethyl maleimide (NEM; No. 23030) was purchased from Thermo Fisher Scientific. Thiopropyl Sepharose resin was obtained from GE Healthcare. Recombinant rat TrxR1 was kindly provided by Elias Arnér (Karolinska Institute, Stockholm, Sweden). Tissue culture media and reagents were from Biological Industries (Beit HaEmek, Israel).
Other materials were obtained from Sigma unless otherwise indicated.
Cell culture and treatment
THP-1 cells (human monocyte cell line) were obtained from American Type Culture Collection and maintained in Roswell Park Memorial Institute (RPMI) 1640 medium, supplemented with 10% (v/v) fetal bovine serum (FBS), 1% penicillin/streptomycin, and 1% sodium pyruvate. Cells were subcultured using fresh media every 2–4 days and maintained in an incubator (37°C, 5% CO2).
THP-1 monocytes were differentiated to adherent macrophages by incubation with PMA (100 ng/mL) for 48 h, followed by 24 h of incubation in PMA-free culture medium. In all experiments, LPS was applied at a concentration of 0.5 μg/mL and AF at 2 μM.
Measurement of cellular GSH levels
After treatments, cells were harvested with buffer A (20 mM Hepes, pH 7.5, 1 mM EDTA, 1 mM EGTA, 150 mM NaCl, 1% Triton-X 100, and 20 mM β-glycerol phosphate) and the samples were analyzed for total GSSG and GSH content with a colorimetric assay kit (703002; Cayman Chemical) according to the manufacturer's instructions.
Measurement of intracellular TrxR activity
TrxR activity in cell lysates was measured in 96-well microtiter plates using an endpoint insulin assay. Cells were lysed with buffer A, and protein samples (40 μg in 50 μL) were incubated with 0.3 mM insulin, 660 μM NADPH, 2.5 mM EDTA, and 5 μM human Trx1 in 85 mM Hepes (pH 7.5) for 20 min at room temperature. Control reactions excluding Trx1 were used for background subtraction. Then, 250 μL of 1 mM 5, 5′-dithiobis (2-nitrobenzoic acid) (Ellman's reagent DTNB), 240 μM NADPH, and 200 mM Tris-HCl, pH 8, in 6 M guanidine hydrochloride were added and absorbance was determined at 412 nm.
Measurement of ROS production
To provide a general assessment of ROS, the cell-permeable fluorescent dye, H2DCFDA, was employed. THP-1 cells (40,000 cells per well) were seeded in black 96-well microplates and differentiated into macrophages as described above. The cells were then loaded with 10 μM H2DCFDA and incubated for 60 min at 37°C. After a wash step, the cells were exposed to treatments in serum-free and phenol red-free medium and fluorescence was detected using a microplate reader at 493 nm excitation and 523 nm emission.
Extracellular H2O2 levels were analyzed using the Amplex Red assay. At the end of the treatments, 50 μL from each well was transferred to a 96-well black plate and incubated with 50 μL of Amplex Red containing the following mix: 10 μM Amplex Red (Invitrogen) and 0.1 U/mL horseradish peroxidase (Sigma) in 50 mM phosphate buffer, pH 7.4, at 37°C for 10 min. Oxidation of Amplex Red by H2O2 into red fluorescent resorufin was measured using a fluorescent plate reader at 530 nm excitation and 590 nm emission.
Intracellular superoxide production was evaluated by the fluorescent dye, DHE (Cayman Chemical). After treatments, the cells were loaded with 5 μM DHE at 37°C for 15 min in the dark. Cells were then washed with prewarmed buffer (HBSS with Ca2+ and Mg2+) and resuspended in the same buffer, prechilled to 4°C, in the dark; and fluorescence emission from the oxidized dye was detected at 605 nm using the LSR Fortessa flow cytometer.
Flow cytometry data were analyzed using FCS Express software, and 10,000 events were acquired per sample. Data are expressed as median fluorescence intensity.
Sample preparation for proteome and redox proteome analysis
For detection of oxidized proteins, we employed the Ox-RAC method adapted from previous studies (Knany et al, 2020; Kohr et al, 2011). In brief, after treatments, cells were washed twice with phosphate-buffered saline (PBS), with 100 mM NEM added to the second wash, and then lysed in buffer 1 (50 mM Hepes, 1% NP-40, 150 mM NaCl, 1 mM EDTA, and 0.1 mM DTPA, pH 7.5, with protease inhibitors) supplemented with 20 mM NEM. A total of 4 mg of protein was used for each experimental condition.
The blocking step was performed at 50°C in the presence of 50 mM NEM and 2.5% SDS, with frequent vortexing. To remove excess NEM, proteins were precipitated with 3 volumes of acetone at −20°C for 30 min. The proteins were recovered by centrifugation at 2000 g for 5 min and washed with 70% acetone. The pellets were resuspended in HENS buffer (250 mM HEPES, 1 mM EDTA, 0.1 mM neocuproine, and 1% SDS, pH 7.5). Samples were then incubated with 20 mM dithiothreitol (DTT) for 30 min, with rotation in the dark.
Next, to remove excess DTT, the proteins were precipitated with 3 volumes of acetone at −20°C for 30 min. The proteins were recovered by centrifugation at 2,000 g for 5 min, washed with 70% acetone, and resuspended in HENS buffer. This material was added to 80 μL of thiopropyl Sepharose resin, followed by rotation in the dark for 4 h at room temperature. The resin was washed 4 times with 1 mL of HENS buffer and twice with 1 mL of HENS/10 buffer (HENS diluted 1:10).
On-bead trypsin digestion was carried out overnight at 37°C with modified trypsin (Promega) in 50 mM ammonium bicarbonate and 1 mM EDTA. The resin was washed five times with 1 mL of HENS/10 buffer (HENS diluted 1:10) and five times with 1 mL of 10 mM ammonium bicarbonate.
Finally, the peptides were eluted by incubating the resin with 200 μL of 10 mM DTT (in 10 mM ammonium bicarbonate/50% methanol) for 30 min at room temperature and concentrated into 50 μL by a SpeedVac. The resulting peptides were modified with 10 mM iodoacetamide (IAM), desalted using C18 tips (TopTip; Glygen), dried, resuspended in 0.1% formic acid, and subjected to LC-MS/MS.
For analysis of the lysate proteome, the protein pellets were dissolved in 9 M urea and 400 mM ammonium bicarbonate, sonicated, then reduced with 3 mM DTT (60°C for 30 min), modified with 10 mM IAM in 100 mM ammonium bicarbonate (room temperature, 30 min, in the dark), and digested in 2 M urea and 25 mM ammonium bicarbonate with modified trypsin overnight at 37°C in a 1:50 (M/M) enzyme-to-substrate ratio. A second trypsin digestion was performed for 4 h. The resulting tryptic peptides were desalted using C18 tips, dried, resuspended in 0.1% formic acid, and subjected to LC-MS/MS.
Liquid chromatography-MS/MS
The peptides enriched in the Ox-RAC assay were resolved by reverse-phase chromatography on 0.075 × 180-mm fused silica capillaries (J&W) packed with ReproSil reversed-phase material (Dr Maisch GmbH). The peptides were eluted with a linear 60 min gradient of 5%–28%, 15 min gradient of 28%–95%, and 15 min at 95% acetonitrile with 0.1% formic acid in water at flow rates of 0.15 μL/min.
MS/MS was performed using the Q Exactive Plus mass spectrometer (Thermo) in a positive mode using repetitively full MS scan followed by high energy collision-induced dissociation (HCD) at 25% normalized collision energy of the 10 most dominant ions (>1 charges) selected from the first MS scan.
The peptides from the total lysate were eluted with a linear 180 min gradient of 5%–28%, 15 min gradient of 28%–95%, and 25 min at 95% acetonitrile with 0.1% formic acid in water at flow rates of 0.15 μL/min. MS/MS analysis was performed using the Q Exactive HFX mass spectrometer (Thermo) in a positive mode (m/z 300–1800, resolution 120,000 for MS1 and 15,000 for MS2) using repetitively full MS scan followed by HCD at 27% normalized collision energy of the 30 most dominant ions (>1 charges) selected from the first MS scan.
During all of the analyses, automatic gain control settings were 3 × 10⁶ for the full MS and 1 × 10⁵ for all the MS/MS scans. The intensity threshold for triggering MS/MS analysis was 1 × 10⁴. A dynamic exclusion list was enabled with exclusion duration of 20 s.
Proteomic data analysis
Raw mass spectra were processed for peptide peak identification and quantitation using the MaxQuant software (version 1.5.2.8) supported by the Andromeda search engine (Cox et al, 2014), searching against the human proteome from the UniProt database with mass tolerance of 6 ppm for the precursor masses and 20 ppm for the fragment ions. Oxidation of methionine and protein N-terminus acetylation were accepted as variable modifications and carbamidomethyl on Cys was accepted as static modification.
The minimal peptide length was set to six amino acids and a maximum of two miscleavages was allowed. Data were quantified by label-free analysis using the same software. Peptide- and protein-level false discovery rates were filtered to 1% using the target–decoy strategy. The protein table was filtered to eliminate the identifications from the reverse database, and common contaminants, and to remove single peptide identifications.
Additional processing and statistical analysis were done using the Perseus software. Protein label-free quantification (LFQ)-normalized intensities were base 2 logarithmized to obtain a normal distribution. Missing values were imputated at the lower end of the distribution for all measured and quantified proteins. A paired t-test was carried out to determine statistical significance and altered peptides/proteins. Peptide/proteins showing at least twofold difference of intensities (≥1 after log2 transformation) between conditions with p value below 0.1 were considered as differentially oxidized/expressed.
Proteins that displayed similar changes in the redox proteome and total proteome were filtered out from the list of redox-regulated proteins. In addition, cytokines, chemokines, and other proteins whose expression is significantly upregulated by LPS were filtered out (Iglesias et al, 2012). Bioinformatic analyses were performed with a larger list of proteins identified using a less stringent p value cutoff of 0.15.
Proteins passing these filters were subjected to gene enrichment analyses using the GeneCodis web-based tool (Nogales-Cadenas et al, 2009) to identify overrepresented GO BPs and CCs. Protein interaction networks were generated using STRING, v11.5, with a minimum required interaction score of high confidence (0.700).
PEG-switch assay
The PEG-switch assay, a semiquantitative method that detects changes in protein oxidation in complex protein mixtures, was performed according to the study by Burgoyne et al (2013). After treatments, cells were washed once with PBS and once with PBS containing 100 mM NEM and then lysed into 1 mL of degassed blocking buffer (100 mM Tris, pH 7.4, 1% SDS, and 100 mM NEM, with protease inhibitors) for each 10-cm plate. Cell lysates were heated at 50°C for 25 min with frequent vortexing to block Cys thiols. Excess NEM was removed by gel filtration using Sephadex G-25 columns (GE Healthcare) equilibrated in assay buffer (25 mM HEPES, 0.1 mM EDTA, 0.2 mM diethylenetriaminepentaacetate, 10 μM neocuproine, 0.1% CHAPS, and 100 mM NaCl, pH 7.5). Immediately after desalting, 50 mM DTT was added to each sample for 20 min at room temperature. Excess reducing agent was removed using Sephadex G-25 columns equilibrated in the same buffer and thereafter the samples were labeled with 2 mM PEG-Mal in the presence of 0.5% SDS for 2 h at room temperature. Equivalent amounts of samples were analyzed by nonreducing Western blot.
Analysis of the redox state of Prdxs, GCLC, and p62
Cell lysates prepared in buffer 1 were used to analyze the redox state of Prdxs. For GCLC and p62 redox analysis, lysates were prepared in buffer 2 (1% NP-40, 150 mM NaCl, and 50 mM Tris-HCl, pH 8.0, with protease inhibitors). In the case of GCLC, 20 mM NEM was added to the lysis buffer. In each case, a nonreducing sample buffer was added to 70 μg of protein. The samples were separated by standard SDS-PAGE, followed by Western blot analysis. Oxidation of p62 was also analyzed using the Ox-RAC assay, as described above and elsewhere (Knany et al, 2020).
GCL activity assay
GCL activity was determined by a fluorescent microplate assay, as previously described (White et al, 2003). In brief, clarified supernatants of cell lysates (50 μL) were diluted 1:1 and preincubated for 5 min at 37°C in 50 μL of GCL reaction cocktail (40 mM ATP, 20 mM
Reactions were initiated by addition of 50 μL of 2 mM Cys and terminated at 60 min by addition of 50 μL of 200 mM 5-sulfosalicylic acid. Clarified supernatants of the reaction mixture were derivatized with 10 mM 2,3-naphthalenedicarboxaldehyde, and the fluorescence intensity of the derivatized products was measured at 472/528 nm (ex/em). Baseline GSH was subtracted from newly synthesized γ-GC and GSH to determine net γ-GC production and therefore GCL activity.
In vitro reduction of p62 by the Trx system
Cell lysates were prepared as described above for the initial steps of the Ox-RAC assay followed by removal of excess NEM by ultrafiltration using a 10 kDa cutoff filter, as previously detailed (Benhar et al, 2010; Kronenfeld et al, 2015). Then, protein samples (1 mg at 2 mg/mL) were incubated with a Trx system (250 μM NADPH, 5 μM Trx, and 10 nM TrxR) at 37°C for 30 min. Thereafter, the samples were subjected to the Ox-RAC assay, followed by Western blot analysis for p62.
Structural modeling of the GCLC-GCLM complex
The GCLC-GCLM dimer complex was produced by the AlphaFold2-multimer version (Evans et al, 2021; Mirdita et al, 2022). The AlphaFold2-multimer model is trained specifically for multimeric inputs of known stoichiometry and has been recently shown to accurately predict multimeric structures while maintaining high intrachain accuracy. The models show a very high per-residue accuracy of the structure, with a pLDDT average of 91.4, reliably predicting the Cα local distance difference.
Visualization and molecular graphics and analyses were performed with UCSF ChimeraX, developed by the Resource for Biocomputing, Visualization, and Informatics at the University of California, San Francisco, with support from the National Institutes of Health, R01-GM129325, and the Office of Cyber Infrastructure and Computational Biology, National Institute of Allergy and Infectious Diseases.
Bacterial activation of THP-1-derived macrophages
THP-1 cells were seeded in a six-well plate at a density of 4 × 10⁶ cells/well and then differentiated into macrophages, as described above. Then, cells were incubated in the presence of K. pneumoniae, B. fragilis NCTC9343, or C. jejuni AS-84-79 at multiplicities of infection of 1:500 cells to bacteria, in a final volume of 1 mL of antibiotic-free medium supplemented with 10% heat-inactivated FBS. To accurately determine the number of each bacterial species, the bacteria were counted directly using a designated hemocytometer.
After 2 h of incubation at 37°C, the cells were rinsed twice with buffer (HBSS with Ca2+ and Mg2+) and incubated for an additional 2 h at 37°C without bacteria. Finally, the cells were rinsed three times with PBS and lysed with 0.5 mL of degassed 100 mM Tris, pH 7.4, 1% SDS, and 100 mM NEM. Equivalent amounts of protein samples were analyzed by nonreducing Western blot.
Statistical analysis
All data are presented as mean ± standard deviation. Statistical differences were analyzed by one-way analysis of variance using Prism software (GraphPad). A p value <0.05 was considered statistically significant. An electronic laboratory notebook was not used.
Data Availability
The MS proteomic data have been deposited to the PRIDE Archive (
Footnotes
Acknowledgments
The authors thank all members of the Smoler Proteomics Center at Technion for sample handling and members of the Benhar Lab for critical comments.
Authors' Contributions
M.B. acquired funding, conceived, and supervised the research; H.A.H., I.B., N.G.-Z., and M.B. designed the experiments; H.A.H., I.B., and T.S. conducted the experiments; M.B., H.A.H., I.B., T.S., F.G., and T.Z. performed data curation and analysis; M.B. wrote the article; and M.B., H.A.H., I.B., F.G., T.G., N.G.-Z., and M.B. reviewed and edited the article. All authors read and approved the article.
Author Disclosure Statement
All authors have no potential conflicts of interest to disclose.
Funding Information
This work was supported by grants from the Israel Science Foundation (1574/14 and 939/19 to M.B.).
Supplementary Material
Supplementary Figure S1
Supplementary Figure S2
Supplementary Figure S3
Supplementary Table S1
Supplementary Table S2
Supplementary Table S3
Abbreviations Used
References
Supplementary Material
Please find the following supplemental material available below.
For Open Access articles published under a Creative Commons License, all supplemental material carries the same license as the article it is associated with.
For non-Open Access articles published, all supplemental material carries a non-exclusive license, and permission requests for re-use of supplemental material or any part of supplemental material shall be sent directly to the copyright owner as specified in the copyright notice associated with the article.
