




Abstract
Increasing evidence suggests that high selenium (Se) exposure is associated with adverse health effects. However, limited evidence exists on the association of Se exposure with cardiovascular disease (CVD), especially in communities affected by high naturally occurring Se in environmental media. We evaluated the prospective association between urinary Se levels and CVD incidence and mortality for 2727 American Indian adults who participated in the Strong Heart Study, with urinary Se levels measured at baseline (1989–1991) and CVD outcomes ascertained through 2017. The median (interquartile range) of urinary Se was 49.0 (36.7–67.4) μg/g creatinine. The multivariable adjusted hazard ratios (95% confidence interval) of incident CVD, coronary heart disease, and stroke comparing the 75th versus 25th percentile of urinary Se distributions were 1.11 (1.01–1.22), 1.05 (0.94–1.17), and 1.08 (0.88–1.33), respectively. In flexible dose–response models, increased risk for CVD incidence was only observed when the urinary Se level exceeded 60 μg/g creatinine. For CVD mortality, a nonstatistically significant U-shaped relationship was found across urinary Se levels. There was no evidence of effect modification by other urinary metal/metalloid levels. Our observation leads to the hypothesis that elevated Se exposure is a risk factor for CVD, especially in Se-replete populations. Antioxid. Redox Signal. 37, 990–997.
Innovation
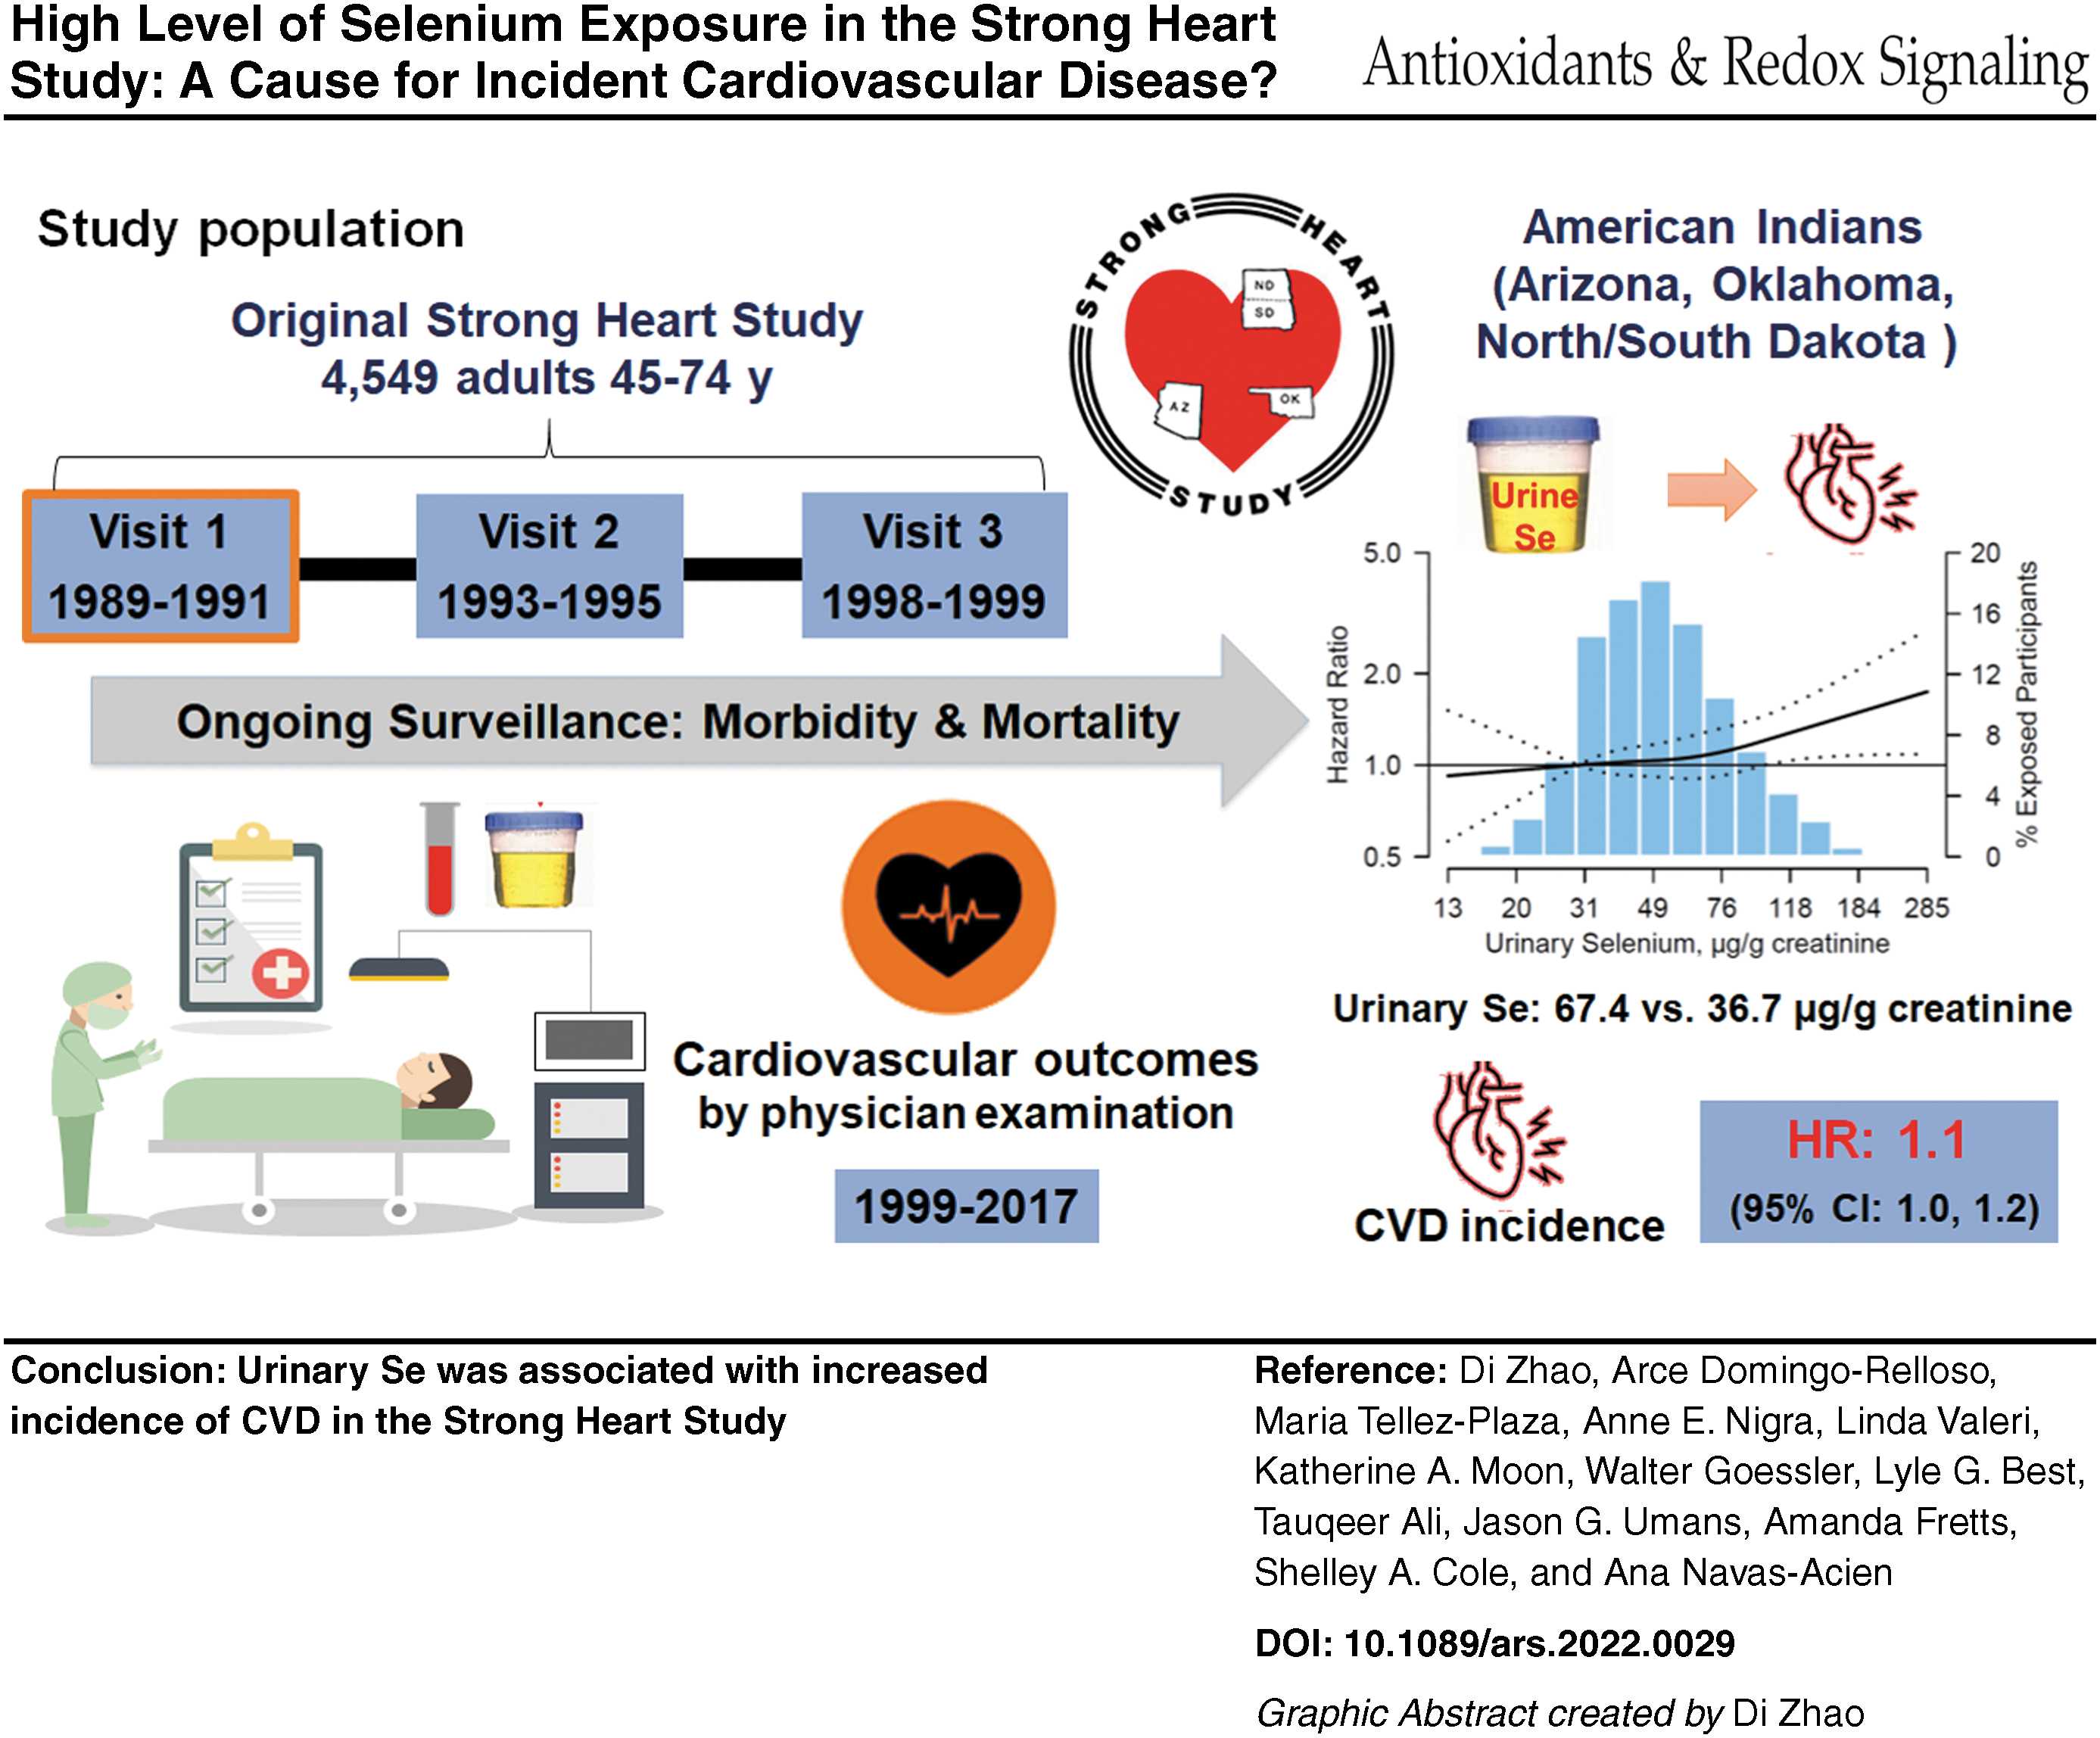
Increasing evidence suggests that high selenium (Se) exposure is associated with adverse health effects. We found that urinary Se levels in American Indian adults who participated in the Strong Heart Study were associated with an increased incidence of cardiovascular disease (CVD), particularly at higher Se levels. For mortality of CVD, a nonstatistically significant U-shaped relationship was found across urinary Se levels. Our findings support that elevated Se exposure is a risk factor for CVD, especially in Se-replete populations.
Introduction
Selenium (Se) is an essential element and plays an important role in protecting against oxidative stress through Se-dependent glutathione peroxidase and other selenoproteins (8). Because of its antioxidant properties, Se has been hypothesized to prevent chronic diseases associated with oxidative stress, including cardiovascular disease (CVD), type 2 diabetes, and even some cancers (2, 8). However, the safety margin of Se is narrow, and high Se exposure may lead to adverse health effects, especially in Se-replete populations (1).
Most Americans have higher Se intakes (60–220 μg/day) than other countries (2, 8), well above the recommended dietary Se intake allowance of 55 μg/day. Previous studies have evaluated the adverse cardiometabolic effects of a higher Se exposure in the United States, and found that the mortality of CVD and coronary heart disease (CHD) decreased with increasing serum Se levels up to 120 μg/L, and increased at higher Se levels, although the U-shaped relationship was not statistically significant (1). The result raises the concern that high Se exposure may be associated with increased risk of CVD.
The Strong Heart Study (SHS) is an ongoing epidemiologic cohort study of CVD and its risk factors in American Indians living in Arizona, Oklahoma, and North and South Dakota (6). Some SHS communities are located in areas with high levels of soil Se, resulting in higher Se intakes in the SHS participants (68–724 μg/day) compared with most Americans (60–220 μg/day) (2). However, the relationship between Se and CVD in the SHS participants is unknown. In this study, we evaluated both linear and nonlinear dose responses between urinary Se and incident CVD events in the SHS.
Results
The overall median (IQR) of baseline urinary Se level was 49.0 (36.7–67.4) μg/g creatinine. Urinary Se levels varied by study region. Participants with a higher urinary Se level were older, more likely to be female, less likely to have completed high school, and had a higher body mass index (BMI), lower systolic blood pressure (SBP), higher estimated glomerular filtration rate (eGFR) levels, and a higher prevalence of diabetes (Table 1).
Baseline Characteristics of Study Participants, Overall and by Urine Selenium Concentration (μg/g Creatinine)
Obtained from linear or logistic models with selenium quartile entered as a continuous variable.
BMI, body mass index; eGFR, estimated glomerular filtration rate; LDL, low-density lipoprotein; SBP, systolic blood pressure; SE, standard error.
Over 43,473 person-years of follow-up, 1189 participants developed incident CVD; 524 participants experienced CVD mortality (Tables 2 and 3). Fully adjusted hazard ratios (HRs) (95% confidence interval [CI]) for incident CVD, CHD, and stroke comparing the 75th versus 25th percentile of urinary Se were 1.11 (1.01–1.22), 1.05 (0.94–1.17), and 1.08 (0.88–1.33), respectively (Table 2). For CVD, CHD, and stroke mortality, the corresponding HRs were 1.04 (0.90–1.19), 0.96 (0.81–1.13), and 1.14 (0.76–1.72), respectively (Table 3).
Hazard Ratios for Cardiovascular Disease, Coronary Heart Disease, and Stroke Incidence by Urinary Selenium (μg/g Creatinine)
Model 1: Stratified by study center and adjusted for age (as timescale), sex, and eGFR (mL/min/1.73 m2).
Model 2: Further adjusted for education (less than high school, some high school, high school or more), smoking status (never, former, or current), BMI (kg/m2), LDL cholesterol level (mg/dL), hypertension (yes or no), and diabetes (yes or no).
Model 3: Further adjusted for urinary iAs, Cd, Mo, and W levels (μg/g creatinine).
Comparison of the 75th and 25th percentiles of urinary selenium levels (67.4 μg/g vs. 36.7 μg/g creatinine).
Obtained from Cox proportional hazards models with log-transformed selenium as a continuous variable.
Cd, cadmium; CI, confidence interval; iAs, inorganic arsenic; Mo, molybdenum; W, tungsten.
Hazard Ratios for Cardiovascular Disease, Coronary Heart Disease, and Stroke Mortality by Urinary Selenium (μg/g Creatinine)
Model 1: Stratified by study center and adjusted for age (as timescale), sex, and eGFR (mL/min/1.73 m2).
Model 2: Further adjusted for education (less than high school, some high school, high school or more), smoking status (never, former, or current), BMI (kg/m2), LDL cholesterol level (mg/dL), hypertension (yes or no), and diabetes (yes or no).
Model 3: Further adjusted for urinary iAs, Cd, Mo, and W levels (μg/g creatinine).
Comparison of the 75th and 25th percentiles of urinary selenium levels (67.4 μg/g vs. 36.7 μg/g creatinine).
Obtained from Cox proportional hazards models with log-transformed selenium as a continuous variable.
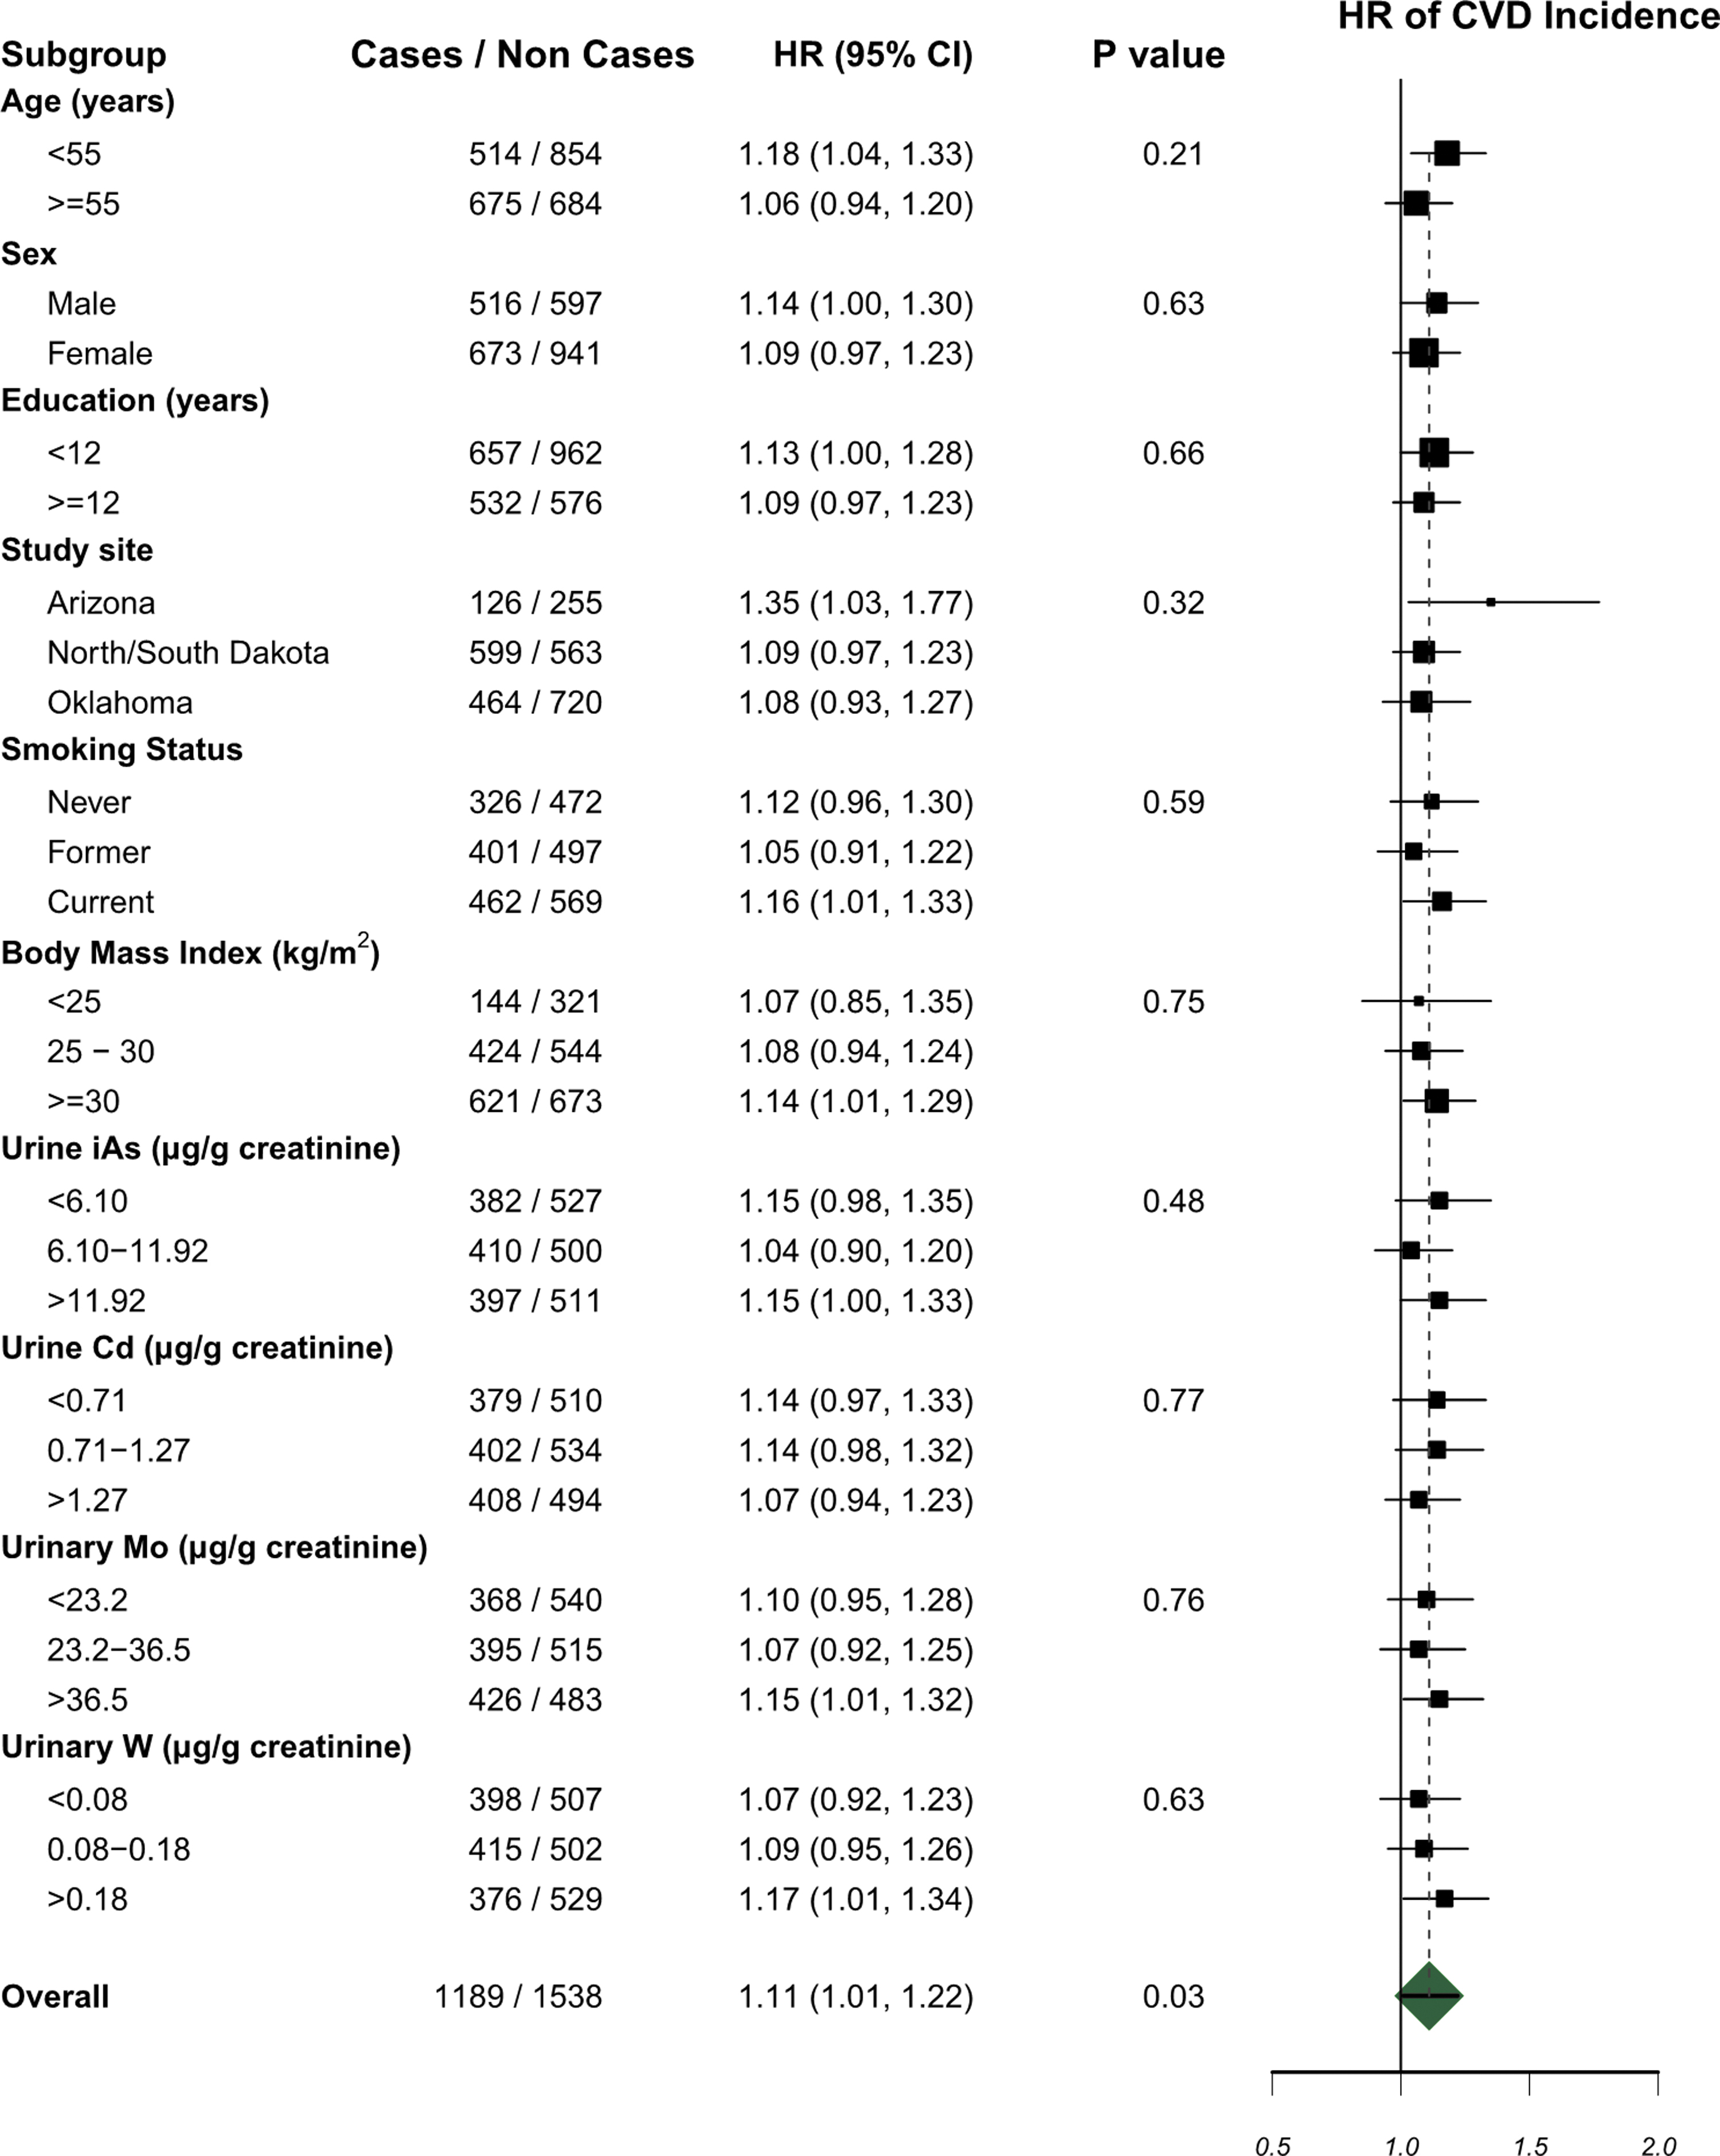
In flexible dose–response models, the risk of CVD incidence increased with increasing urinary Se, particularly above 60 μg/g creatinine (Fig. 1). For CVD mortality, there is a nonsignificant U-shaped relationship across urinary Se levels. In subgroup analyses, associations with an interquartile range increase in Se were positive in all subgroups (Fig. 2), with no significant interactions.

Discussion
Elevated urinary Se was prospectively associated with incident CVD in the SHS, even after adjustment for cardiovascular risk factors and other metals/metalloids. Urinary Se was also associated with CVD mortality, but the association became nonsignificant after adjustment for cardiovascular risk factors. In flexible quadratic spline models, the risk of CVD incidence increased with increasing urinary Se levels, particularly above 60 μg/g creatinine. For CVD mortality, a U-shaped relationship was found across urinary Se. The shape of dose–response patterns differs between incidence and mortality, as analyses for mortality may be limited by the smaller number of events.
Urine is the main route of Se excretion and several studies have shown that urinary Se is a good biomarker of exposure. Among 77 adults from South Dakota and Wyoming, the association of daily Se intake was stronger with urinary Se (r = 0.86), compared with whole blood, serum, and toenails (0.78, 0.74, and 0.67, respectively) (7).
Previous studies found no significant association of increased Se exposure (plasma, serum, or toenail Se) with CVD/CHD incidence in U.S. populations. A meta-analysis of 14 prospective cohort studies found a modest but significant inverse association between Se levels and CHD, and the pooled relative risk of CHD when comparing the highest with the lowest Se levels was 0.85 (95% CI 0.74–0.99) (3). However, most included studies were conducted in European countries with a markedly lower Se intake compared with the United States.
It is possible that CVD decreases with increasing Se exposure up to a certain value, and then, the disease risk increases. Furthermore, different biomarkers used for measuring Se exposure, including serum, plasma, toenail, or urinary Se, may reflect a different time frame of Se exposure, resulting in different associations between Se exposure and cardiovascular outcomes.
In the National Health and Nutrition Examination Survey (NHANES) III (1988–1994), a nonsignficant U-shaped dose response was found for CVD and CHD mortality among 13,887 adult participants (1). The result is consistent with the U-shape dose response in our study, supporting that Se can be a risk factor for CVD mortality at both low and high doses. In a general population from Spain, plasma Se above 110 μg/L was associated with increased levels of 8-oxo-7,8-dihydroguanine (the product of DNA excision repair), which may partly mediate the associations of high Se levels with adverse health outcomes (4).
Randomized-controlled trials evaluating the effect of Se supplementation on cardiovascular outcomes found null results (5), which could be related to the short follow-up time and short period of exposure, compared with the lifelong exposures in the SHS populations. Se supplements are commonly marketed in the United States, and thus, the health effects deserve more attention.
This population-based study examining the association of Se exposure, as measured in urine, with CVD outcomes in a U.S. population with high Se intake found a significant positive association between urinary Se levels and CVD incidence at higher urinary Se levels (approximately above 60 μg/g creatinine). For urinary Se and CVD mortality, the association was not significant, but consistent with a U-shaped relationship.
Strengths include the long follow-up of CVD outcomes with high-quality outcome ascertainment, high quality of Se measurement in urine, and a wide range of Se levels. However, we relied on a single measurement of urinary Se levels as a biomarker of exposure. Furthermore, the species of Se in urine samples were not studied. More data on Se speciation are needed to understand the variability in Se exposure and the association of Se species with cardiovascular outcomes.
Notes
Study population and data collection
The SHS recruited 4549 American Indian men and women aged 45–74 years from communities in Arizona, Oklahoma, and North Dakota and South Dakota at the baseline visit in 1989–1991 (6). Participants were followed-up at clinical visits in 1993–1995 and 1997–1999, and subsequently followed until death or through 2017. In 2016, one community withdrew its consent to participate in further research, reducing the cohort to 3516 participants. Inverse probability weighting is used to reduce bias introduced by dropout.
For this study, we excluded 213 participants with CVD at baseline, 467 participants missing urinary Se measurements, and 109 who were missing other variables of interest, leaving an analytical sample of 2727 participants. The study protocol was approved by the Institutional Review Boards of the Indian Health Service, the participating institutions, and the participating tribes. Each participant provided individual written informed consent. The participanting tribes also approved the submission of this article for peer review.
Each SHS visit was performed by trained and certified staff following a standard protocol, including a questionnaire, physical examination, and fasting blood and spot urine sample collection (6). Sociodemographic information, including age, sex, education (less than high school, some high school, high school or more), and smoking status (never, former, or current), was collected (6). Physical examination, including height, weight, waist and hip circumferences, and systolic and diastolic blood pressure, was conducted by trained nurses and medical assistants (6). Urine samples were collected in the morning after a minimal 12-h overnight fast.
Low-density lipoprotein (LDL) cholesterol was calculated based on the Friedewald equation. Hypertension was defined as SBP ≥140 mm Hg, diastolic blood pressure ≥90 mm Hg, or antihypertensive medication use. Diabetes was defined as a fasting glucose level ≥7.0 mM, a 2-h plasma glucose level ≥11.1 mM, a hemoglobin A1C level ≥6.5%, or self-reported use of insulin or diabetic medication. eGFR was calculated from creatinine, age, and sex using the Chronic Kidney Disease Epidemiology Collaboration formula.
Measurement of urinary metal/metalloid concentrations
Baseline spot urine samples (1988–1991) were collected in polypropylene tubes, frozen within 1–2 h of collection, transported on dry ice, and then stored at < −70°C at the MedStar Research Institute (Washington DC). Detailed analytical methods have been described by Scheer et al. (9). For arsenic (As), species were first separated using high-performance liquid chromatography coupled with inductively coupled plasma-mass spectrometry (Agilent 7700x ICP-MS; Agilent Technologies, Waldbronn Germany). We used the sum of inorganic and methylated As species as the biomarker of inorganic As exposure (referred to as iAs hereafter).
The limit of detection (LOD) for Se was 2.0 μg/L. For iAs, cadmium (Cd), molybdenum (Mo), and tungsten (W), the LODs were 0.1, 0.015, 0.1, and 0.005 μg/L, respectively. Urinary metal/metalloid concentrations below the LOD were replaced with the LOD divided by
CVD incidence and mortality follow-up
Death and incident cardiovascular events were identified by annual contact with the coordinating center, review of hospitalization record, death certificates, and during both clinical follow-up visits (6). Follow-up through 2017 was 99.8% complete for mortality and 99.2% complete for nonfatal events.
Incident CHD was defined as the first occurrence of definite fatal or nonfatal myocardial infarction, definite sudden death due to CHD, and definite and possible nonfatal CHD. Incident stroke was defined as the first occurrence of definite or possible fatal or nonfatal stroke. Incident CVD was defined as definite or possible fatal or nonfatal CHD, stroke, or heart failure (6).
Statistical analysis
All analyses were conducted using R version 3.2.4. To account for urine dilution, urinary metal/metalloid concentrations were divided by creatinine levels and expressed as μg/g creatinine. Distributions of urinary levels were skewed for most metals/metalloids and were log-transformed for statistical analysis. We calculated HRs and the corresponding 95% CIs of mortality and incidence for CVD, CHD, and stroke comparing the 75th versus 25th percentile of urinary Se through the Cox proportional hazard models. We modeled age as the timescale, with staggered participant entry corresponding to age at baseline. Because urinary Se levels and cardiovascular risk factors differed across the three study centers (Arizona/Oklahoma/North and South Dakota), we stratified all the Cox models by study center.
We assessed the following three progressively adjusted models, with all covariates measured at baseline and treated as time-fixed. Model 1 was stratified by study center (Arizona, Oklahoma, and North Dakota and South Dakota) and adjusted for age (used as timescale), sex (male or female), and eGFR (mL/min/1.73 m2). Model 2 was further adjusted for education (less than high school, some high school, high school or more), smoking status (never, former, or current), BMI (kg/m2), LDL (mg/dL), hypertension (yes or no), and diabetes (yes or no). Model 3 was further adjusted for urinary iAs, Cd, Mo, and W levels (μg/g creatinine). p Values for trend were obtained from Wald tests for log-transformed Se (continuous).
In sensitivity analysis, we used urinary Se levels in μg/L, without adjusting for urinary creatinine in all models. Sensitive analysis by including alcohol consumption as a covariate in the adjusting model was conducted.
To flexibly assess the shape of the dose–response relationship between urinary Se levels and CVD mortality and incidence, we evalauted restricted quadratic spline models with knots at the 10th, 50th, and 90th percentiles of the urinary Se distribution.
We also evaluated the potential effect measure modification for several subgroups of interest using interaction terms and stratification. We evaluated interaction terms between log-transformed urinary Se and an indicator variable for each categorical participant characteristic, and evaluated whether the HRs differed across the following subgroups: age (<55/≥55 years), sex (male/female), education (<12/≥12 years), smoking status (never/former/current), BMI (<25/25–29/≥30 kg/m2), urinary iAs tertiles (<6.10/6.10–11.92/>11.92 μg/g creatinine), and urinary tertiles of Cd (<0.71/0.71–1.27/>1.27 μg/g creatinine), Mo (<23.2/23.2–36.5/>36.5 μg/g creatinine), and W (<0.08/0.08–0.18/>0.18 μg/g creatinine).
Footnotes
Authors’ Contributions
D.Z. and A.N.A. contributed to the preparation of research data and writing of the article. D.Z., A.D.R., M.T.P., A.E.N., and L.V. contributed to the statistical analysis. K.N., L.G.B., T.A., J.G.U., A.F., and S.A.C. contributed as the primary investigators of the SHS, and to the preparation of the research data. W.G. contributed to metal measurements in the SHS participants. All authors read, edited, and approved the final article.
Funding Information
This study was supported by P42ES010349, P30ES009089, R01ES028758, and 1R01ES025216.