




Abstract
Significance:
Imaging free radicals, including reactive oxygen species and reactive nitrogen species, can be useful for understanding the pathology of diseases in animal disease models, as they are related to various physiological functions or diseases. Among the methods used for imaging free radicals, Overhauser-enhanced magnetic resonance imaging (OMRI) has a short image acquisition time and high spatial resolution. Therefore, OMRI is used to obtain various biological parameters. In this study, we review the methodology for improving the biological OMRI system and its applications.
Recent Advances:
The sensitivity of OMRI systems has been enhanced significantly to allow the visualization of various biological parameters, such as redox state, partial oxygen pressure, and pH, in different body parts of small animals, using spin probes. Furthermore, both endogenous free radicals and exogenous free radicals present in drugs can be visualized using OMRI.
Critical Issues:
To acquire accurate biological parameters at a high resolution, it is essential to increase the electron paramagnetic resonance (EPR) excitation efficiency and achieve a high enhancement factor. In addition, the size and magnetic field strength also need to be optimized for the measurement target.
Future Directions:
The advancement of in vivo OMRI techniques will be useful for understanding the pathology, diagnosis, and evaluation of therapeutic effects of drugs in various disease models. Antioxid. Redox Signal. 37, 1094–1110.
Introduction
Free radicals, including reactive oxygen species (ROS) and reactive nitrogen species (RNS), are related to various physiological functions, such as immune function and cellular signaling (74, 88). An imbalance of free radicals and antioxidants results in oxidative damage to cells and tissues (77), causing various diseases, such as ischemia reperfusion (46, 96), inflammation (89), diabetes (35, 73), and cancer (13). Therefore, the visualization of free radicals is useful for evaluating or diagnosing such diseases.
There are two main techniques for measuring free radicals in vivo: electron paramagnetic resonance imaging (EPRI) (4, 22, 23, 87) and Overhauser-enhanced magnetic resonance imaging (OMRI) (34, 41, 57). EPRI can directly detect free radicals quantitatively and visualize their distribution. Both continuous wave (CW)-EPRI and pulsed EPRI are available for in vivo free radical imaging. Although CW-EPRI has a relatively longer measurement time than pulsed EPRI, it is not limited by the line width of radicals. However, radical species with a very narrow line width are required for pulsed electron paramagnetic resonance (EPR) measurement because the relaxation time of radicals needs to be markedly longer than the dead time caused by “ringing” of the resonator (4, 80).
OMRI, also known as proton–electron double-resonance imaging (PEDRI) or dynamic nuclear polarization (DNP)-magnetic resonance imaging (MRI), is based on the Overhauser effect (63). In OMRI, the proton nuclear magnetic resonance (NMR) signal is enhanced by EPR irradiation in a region containing free radicals. Under ideal conditions, when free radicals present in the samples are sufficiently saturated, the proton signal would be enhanced 660-fold more than the original proton signal without EPR saturation (48). The enhancement factor depends on the line width of free radicals, and the enhancement rate of proton signals is proportional to the amount of free radicals.
Therefore, it is possible to quantitatively determine the number of free radicals in the sample. Thus, by determining the enhancement factor, OMRI allows the quantification of free radicals and visualization of their distribution. When EPR irradiation is off, anatomical information can also be acquired using OMRI. OMRI has the advantages of shorter image acquisition time than EPRI and high spatial resolution comparable to MRI under the same magnetic field, regardless of the line width of free radicals (80).
Although both EPRI and OMRI can detect free radicals, detection of endogenous free radicals, including most metal ions, nitric oxide, and ROS, such as hydroxyl radicals, in the living body directly is challenging because the concentration of most endogenous radicals in the living body is low and these radicals have a short half-life (5, 54). Therefore, for performing in vivo measurements with EPRI and OMRI, stable free radicals, such as nitroxyl radicals, with an environment-sensitive EPR spectrum are used as spin probes.
The use of an appropriate spin probe aids in obtaining important biological information, such as redox state, partial oxygen pressure (pO2), and pH. Although OMRI systems usually require spin probe agents to obtain biological information in vivo, recent advancements in OMRI have facilitated the detection of endogenous radicals, such as melanin radicals (33). Because melanin radicals are stable, they can be detected by conventional free radical detection systems and have been reported in both EPR and OMRI. However, to detect other endogenous radicals, a more sensitive detection method is required.
In this review, we provide an overview of the methodologies used to improve the biological OMRI systems and enumerate their applications.
Sensitivity and Penetration Depth of Electromagnetic Waves
The sensitivity of EPRI or OMRI signals depends on the potential of the electromagnetic wave frequency to excite electron spin (5, 17). The sensitivity increases in proportion to (frequency)5/2; higher the frequency, the better the sensitivity (81). Additionally, the choice of electromagnetic wave frequency for measurements in vivo depends on the penetration depth and the size of the animal. The penetration depth of the electromagnetic wave within the animal body decreases as the frequency of the electromagnetic radiation increases. The penetration depth (δ) of the electromagnetic waves is depicted in Equation [1]:
where ω is the angular frequency of the electromagnetic wave, μ is the magnetic permeability, and σ is the electrical conductivity. In addition, the dielectric loss is generally increased in animal tissues, which have a high dielectric constant. For in vivo OMRI measurements, the optimum EPR excitation frequency is determined by the trade-off between sensitivity and penetration depth. Typically, operating frequencies range from 250 MHz to 1.2 GHz (87). Figure 1 shows the relationship between skin depth and electromagnetic wave frequency in human tissues (70).
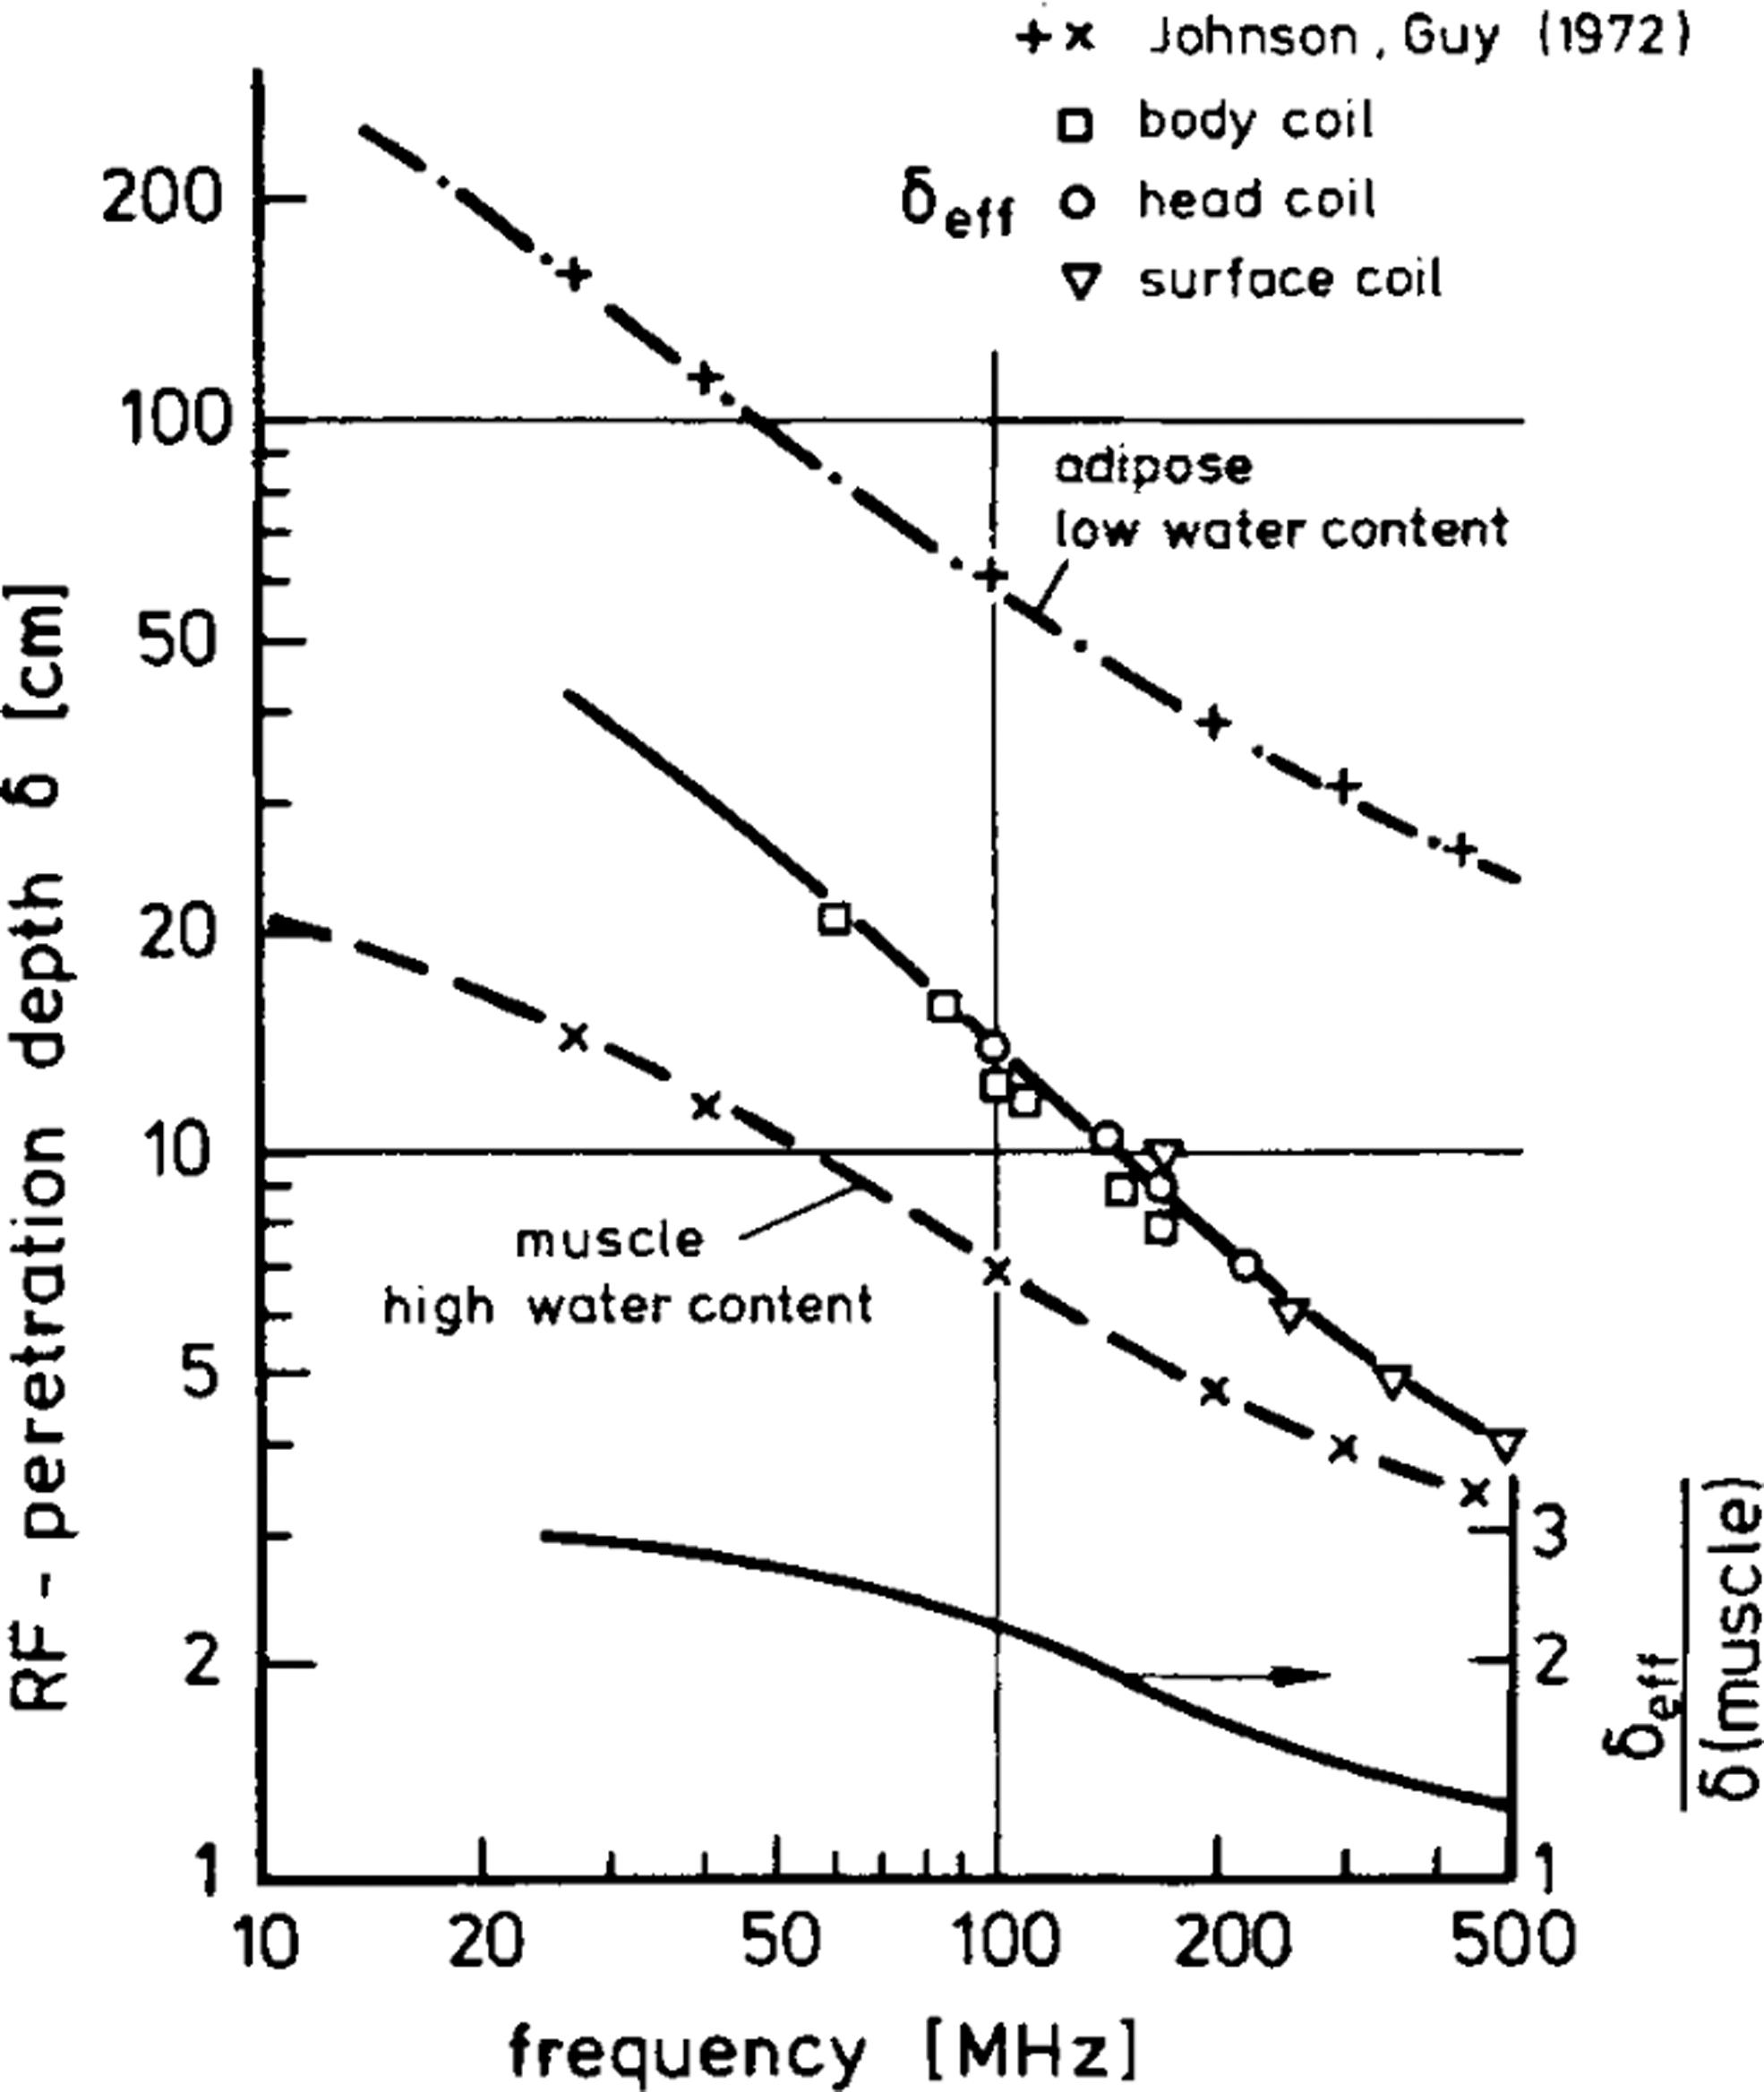
According to Figure 1, the penetration depth was ∼4 cm in the muscle at 500 MHz. It is important to use an appropriate frequency according to the target organ. Electromagnetic wave frequencies of ∼500 MHz or lower have been primarily used in OMRI measurements for living animals. As mentioned above, the sensitivity of detection of magnetic resonance signals depends on the frequency of electromagnetic wave. However, electromagnetic wave is strongly attenuated in in vivo OMRI measurement because of dielectric losses caused by biological samples. Therefore, it is challenging to improve the sensitivity of OMRI for measurements.
Principle of OMRI
OMRI is based on the Overhauser effect, which was theoretically predicted by Overhauser in 1953 (63) and experimentally demonstrated by Carver and Slichter in 1956 (11). According to the Overhauser effect, the saturation of the EPR transition in a paramagnetic compound polarizes the nuclear spins and enhances the amplitude of the NMR signal (48, 63). The enhancement (E) of the NMR signal (I = 1/2 for proton spins) coupled with unpaired electron spins (S = 1/2) is depicted in Equation [2]:
where I z is the polarized proton intensity, I 0 is the proton intensity at thermal equilibrium, ρ is the coupling factor, f is the leakage factor, s is the saturation parameter, γe is the electron gyromagnetic ratio, and γN is the nuclear gyromagnetic ratio (48, 63). Here, when the interaction between the electron and proton spins is dominated by the dipole–dipole interaction, the coupling factor ρ is close to 0.5. The polarization is diminished when spin-lattice relaxation of nuclei in the molecules due to proton–proton dipole coupling occurs.
The leakage factor f, which represents the loss of polarization, is sensitive to motion and depends on the concentration of electron spins. As concentration of the free radical agent increases, the leakage factor f approaches 1. The degree of saturation of the electron spin (s) represents the energy absorption of the spin system, and this parameter has a large effect on the polarization. The saturation factor (s) depends on the electron spin relaxation rates of free radical compounds at a given EPR irradiation power. The enhancement factor E is the equilibrium value of the NMR signal enhancement after an infinite EPR excitation. In the actual experiment, the degree of E is determined by the T
where Einf is the equilibrium value of the NMR signal enhancement after an infinite time of EPR excitation, and TESR is the duration of EPR excitation. Equation [3] is called the quality-transfer factor. The polarized spin state returns its thermal equilibrium value at the rate of 1/T 1 after EPR excitation is performed.
However, in actual measurements, various factors, including not only the T 1 but also the hyperfine interactions between the hydrogen nucleus and the unpaired electrons of the free radical compound, which affect the enhancement factor, affect the polarization. For example, in case of nitroxyl radicals, the EPR line is broadened nonhomogeneously because of the presence of unsplit hydrogen hyperfine lines, and the excitation of one of the nitrogen hyperfine lines only partially saturates it. However, when only a single EPR line of the nitrogen hyperfine line is irradiated, the enhancement factor can be approximated using the above-mentioned equations.
Although the enhancement factor can be estimated from the above equation for aqueous solution, for biological samples, the enhancement factor decreases significantly. This is because of the leakage factor (f), which is very low in biological samples. In addition, as it is difficult to achieve complete EPR resonance saturation in biological samples, a high electromagnetic wave power is required to achieve a high enhancement factor.
Research and Development History of the OMRI Apparatus
After the Overhauser effect was demonstrated by Carver and Slichter (11), Lurie et al. first visualized the distribution of free radicals in a homogeneous sample of 2.5 mM 1-Oxyl-2,2,6,6-tetramethyl-4-hydroxypiperidine (TEMPOL) solution with a field-fixed (FF)-OMRI system (Fig. 2) (48). They used 40 mT of whole-body resistive magnet system. The NMR frequency and the EPR excitation frequency used were 1.7 MHz and 1.123 GHz, respectively. Although an enhancement factor E of −7 was achieved with <1 W of EPR irradiation power, the specific absorption rate (SAR) was 400 W/kg, which was not applicable for in vivo measurements because of heating in biological samples. Thus, they used two approaches to reduce the SAR to a level that can be used for animal measurements.
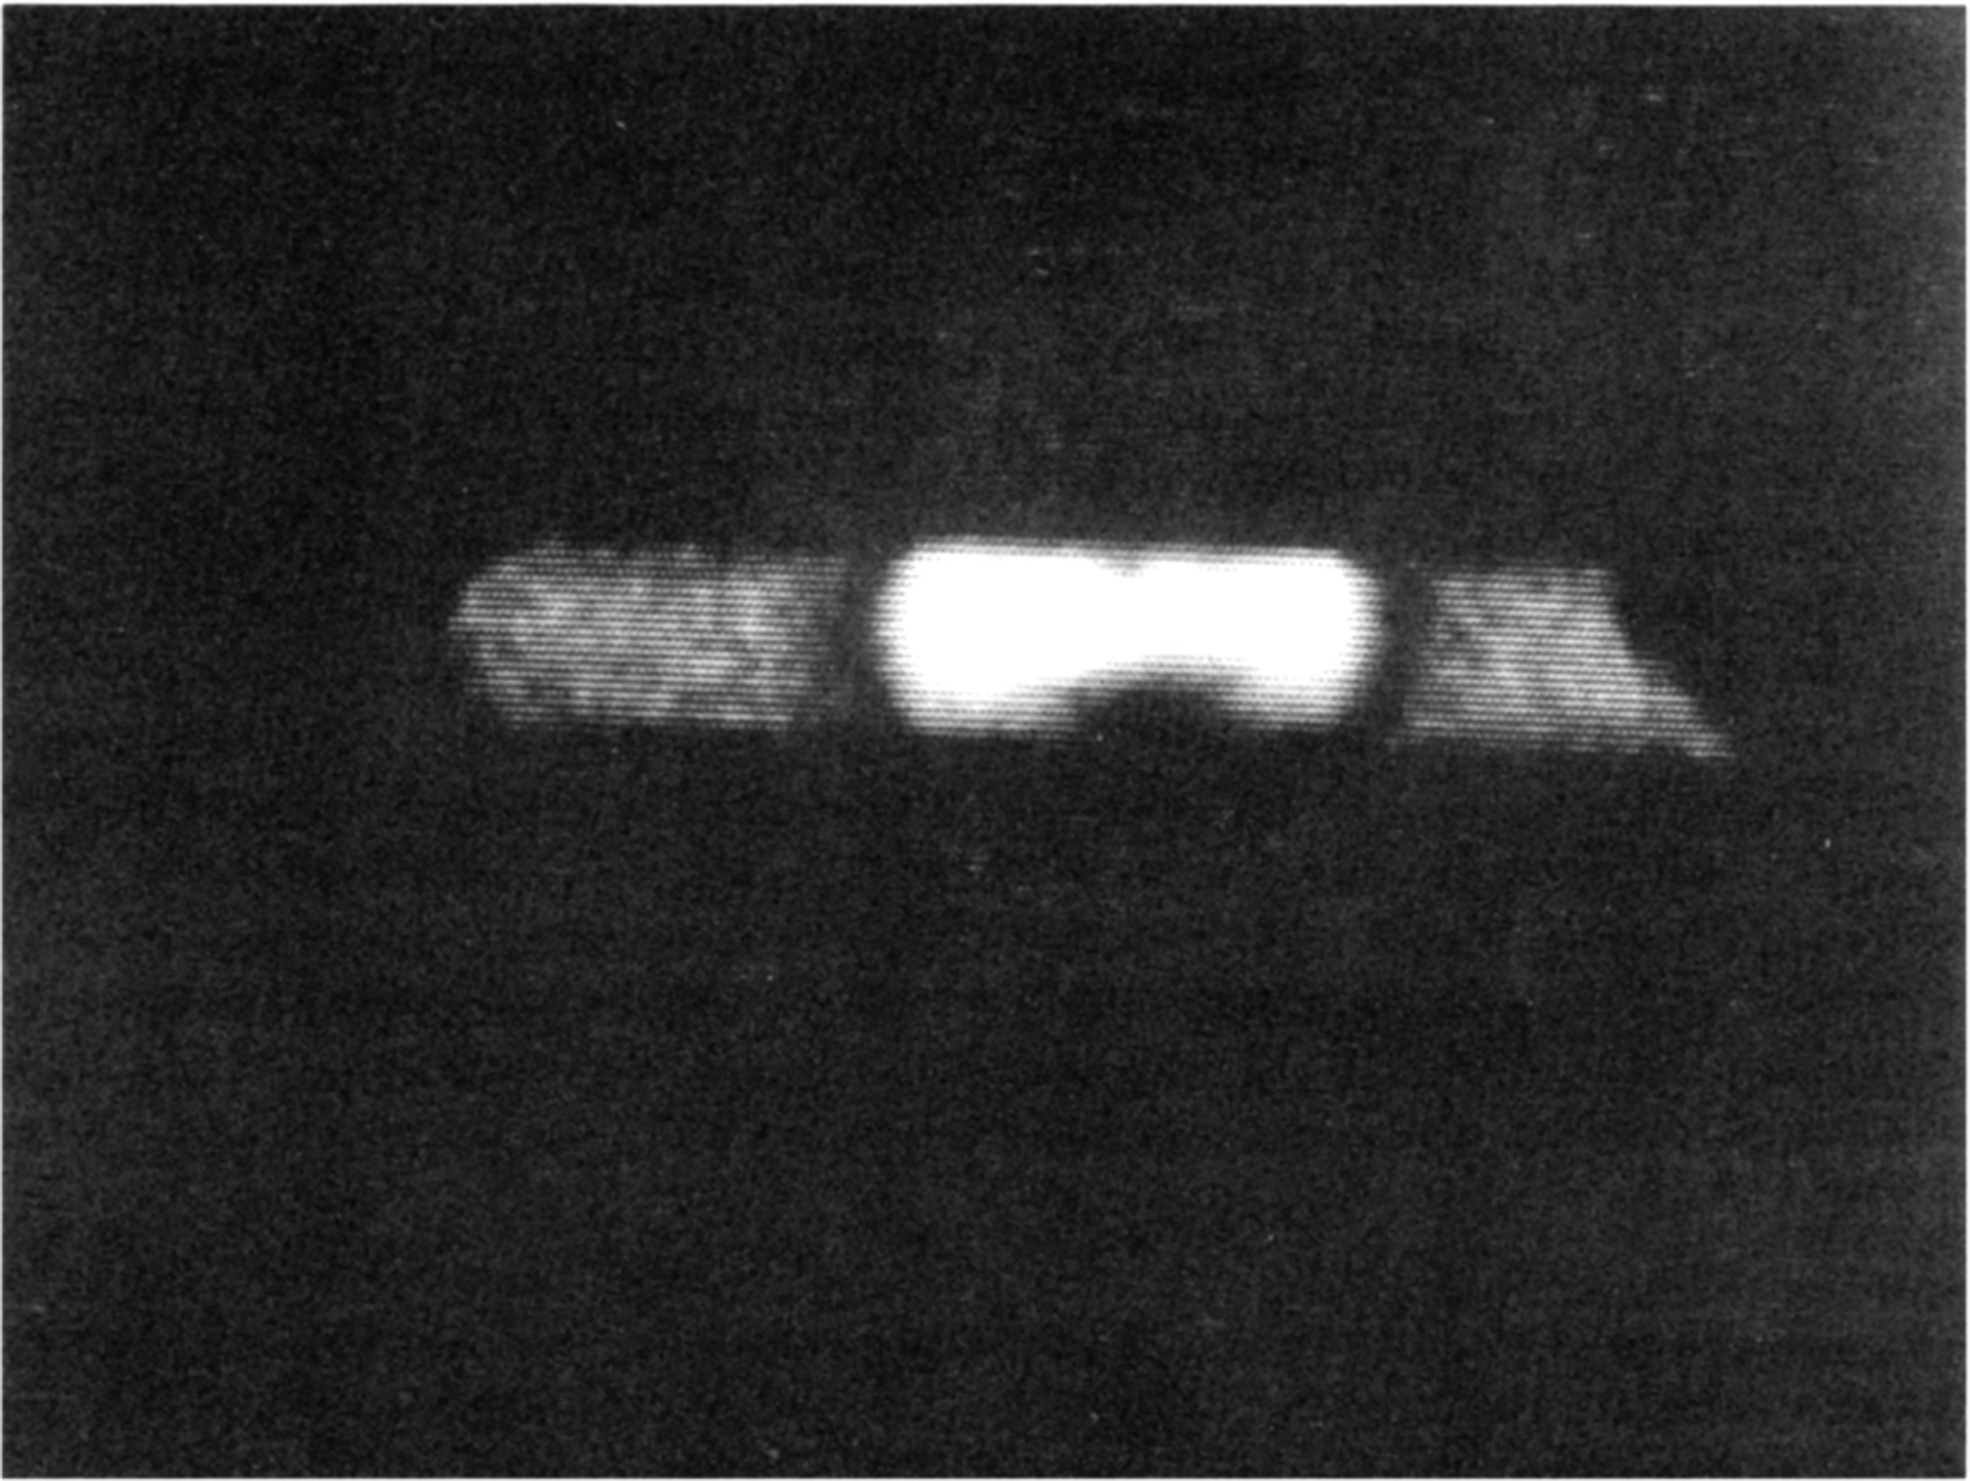
First, they reduced the field strength of the magnetic field from 40 to 10 mT to use a lower EPR irradiation frequency. This is because the electromagnetic wave power deposition in the animal body is proportional to the square of the irradiation frequency. Then, they reduced the duty cycle of EPR irradiation to reduce the mean power absorbed by the animal body. Using these approaches to reduce SAR, they first reported on in vivo experiments in 1990 using a 10 mT OMRI system (Fig. 3) (53). Following this, their group used a 10 mT OMRI system to acquire the distribution (53), metabolism (2, 21), and the excretion mechanism of exogenous nitroxide in rats (76). They achieved an enhancement factor of −1.9 with <2 W/kg of SAR, which is an acceptable level for application in in vivo measurements. With a weak static magnetic field (6.8 mT), Grucker was the first to demonstrate the feasibility of pO2 measurement with OMRI using rats (28).
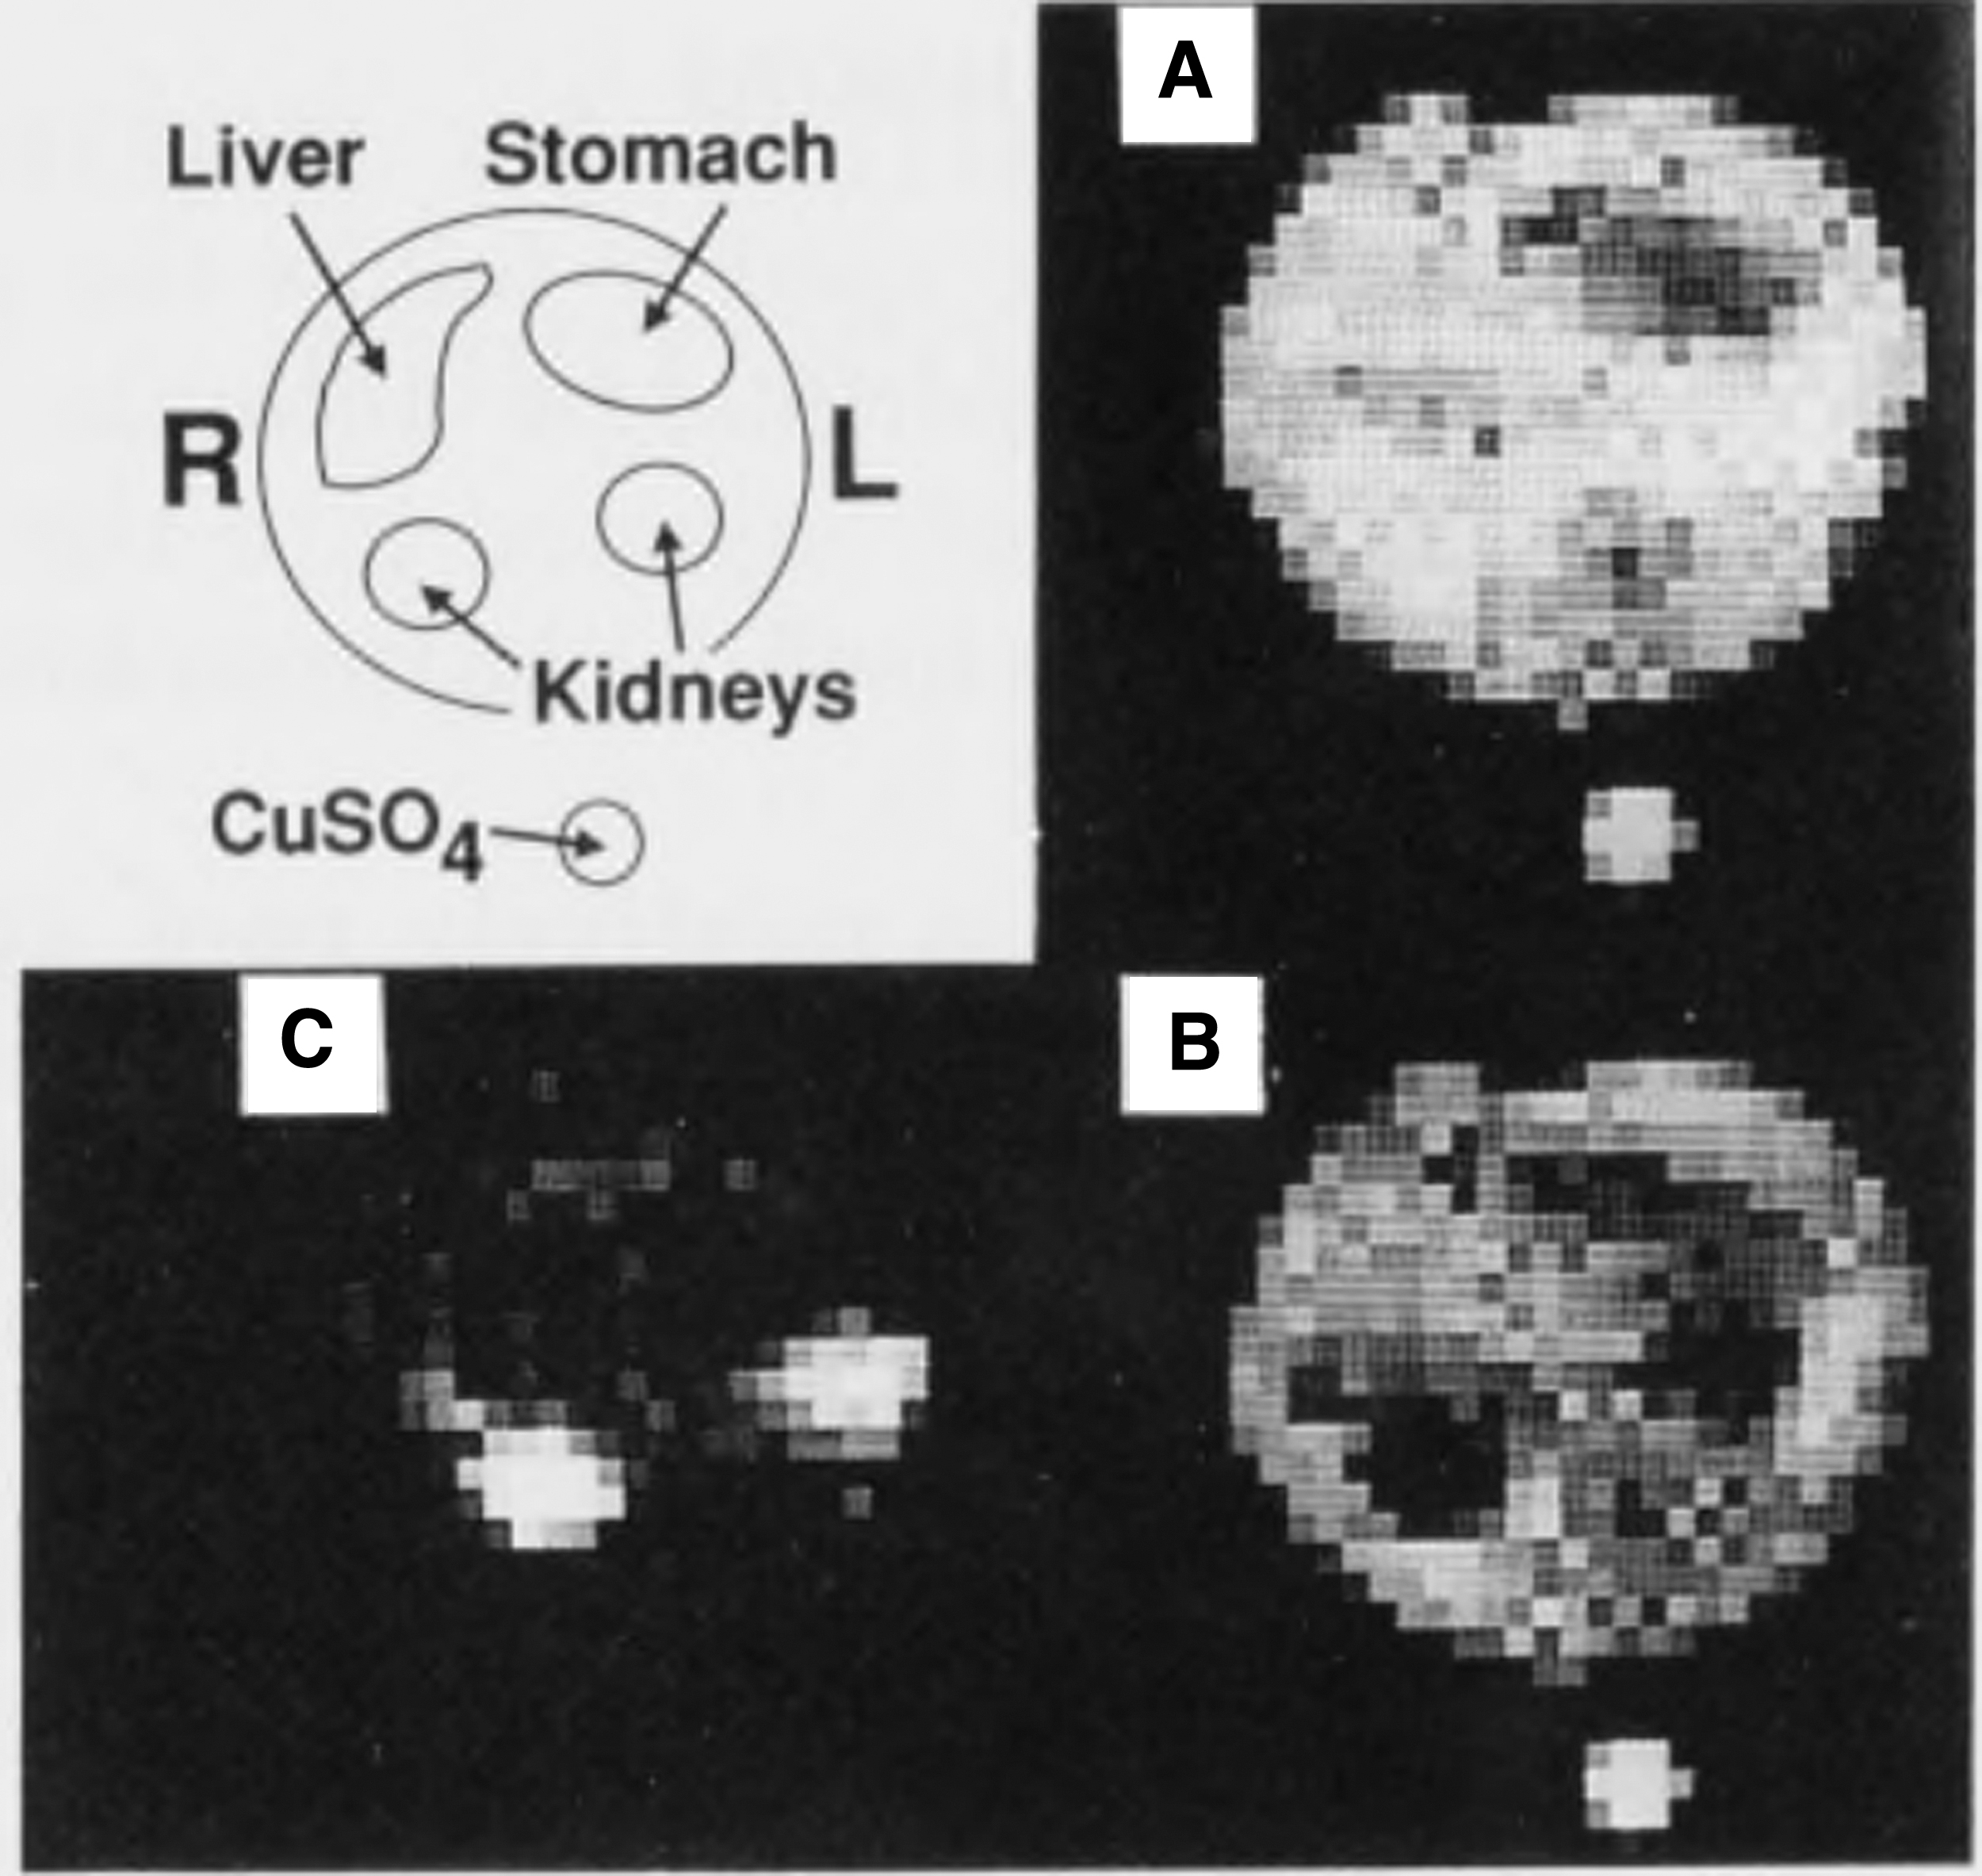
In vivo OMRI was successfully performed with a safe level of SAR; however, the size of the animal is another limiting factor. As electromagnetic wave power absorption increases with the sample volume, sufficiently high levels of enhancement factor can be achieved only for small animals, such as rats. Therefore, Lurie et al. suggested reducing the static magnetic field (B 0) of EPR excitation to approximately a few mT to keep the SAR at a safe level, even for the measurement of larger samples (51). However, the use of such a low magnetic field reduces the sensitivity of NMR, which reduces image quality. Thus, Lurie et al. reported field-cycled (FC)-OMRI in 1989 to solve the problems of both SAR and sensitivity (51).
In this method, the B 0 with different strengths was applied at each stage of the pulse sequence, high field was used for the nuclear polarization period, low field was used for the EPR irradiation period, and high or intermediate fields were used for the NMR signal detection period. Field cycling was realized with two magnets: an FF magnet (primary magnet) and a resistive magnet (secondary magnet). A lower field was generated by canceling the field of the primary magnet using a resistive magnet. As a lower B 0 was only applied during EPR irradiation and a higher B 0 was applied during polarization and detection of the NMR signal, it was possible to reduce the SAR while maintaining the sensitivity of NMR detection. Using FC-OMRI, they visualized tubes filled with free radical solution placed at the center of aqueous samples, which were 4 cm in diameter (51).
In their experiments, the value of B 0 for nuclear spin polarization and detection of NMR signal was 10 mT, and the value of magnetic field during EPR irradiation was 5 mT. Although the EPR irradiation frequency was reduced ∼10-fold and the sample volume was increased by 100 times, an enhancement factor of −7 was obtained, which was the same level achieved when a 40 mT fixed magnetic field was used, and the SAR was reduced to 1/8 of the SAR on a 40 mT FF-OMRI. Two types of magnets were used to switch the magnetic field: a permanent magnet for a high field and a resistive magnet for the canceling field. This resistive magnet was used to generate a low field. The switching time of the low field for EPR irradiation to a high field for NMR detection should be short to avoid the significant decay of the enhanced proton magnetization before detection. In their measurements, the switching time was 10 ms.
Considering the T 1 of the proton in the animal body, which is 150–250 ms, the field switching time the authors achieved was acceptable. In 1998, Lurie et al. designed and constructed a large-scale FC-OMRI imager capable of imaging free radicals in large animals, such as rabbits (50). According to the report, the OMRI imager was configured with a 58.7 mT permanent magnet for the whole body as a primary magnet (50). The primary magnet was constructed from magnetized ferrite, which had a mass of ∼2600 kg and a clear bore of 0.65 m. To prevent the loss of field homogeneity by alterations in ambient temperature, a fan was operated that blew room air inside the thermal cover of the magnet where it circulated around the ferrite structure. A resistive coil was used as the secondary magnet. The magnetic field during EPR irradiation was switched to 3.05 mT generated by canceling the field of the primary magnet with a secondary magnet coil.
The coil used in the secondary magnet was made from sheets of copper conductor in a saddle configuration, which was wound from copper sheets in a cylindrical manner and embedded in epoxy resin (50). The coil was 1.5 m in length, and the bore, which was freely placed, was 52 cm wide. The second coil was water-cooled on the outer surface of the cylinder. The magnetic field can be switched from 0 to 59 mT or vice versa in 40 ms. There have been attempts to increase the applicability of OMRI systems by using higher static magnetic fields to improve the detection sensitivity by modifying conventional MRI systems.
Lurie et al. also performed in vivo OMRI using the FC method by converting a 0.38 T whole-body MRI system for operation as a 20.1 mT small animal OMRI imager with slight modification of the magnet power supply controller (52). In 2005, a 450 mT superconducting magnet, which is highly stable and homogeneous, was used for MRI detection instead of a permanent magnet to achieve high sensitivity, whereas a low field of 5 mT was maintained for EPR excitation by an electromagnet to prevent the effect of heating on the animal body (49).
Configuration of the OMRI System
The OMRI system has the same configuration as the MRI system, except that the former requires EPR irradiation. Conventional MRI is configured with a B 0 magnet, gradient coil for gradient field, power amplifier for gradient coil, electromagnetic wave generator, amplifiers for transmission wave and receiver wave, electromagnetic wave bridge, and computer to control the entire system. In addition to the conventional MRI configuration, OMRI requires the construction of an EPR excitation system, including an electromagnetic wave generator and an electromagnetic wave amplifier corresponding to the EPR excitation frequency. However, it is difficult to configure an in vivo OMRI system simply by adding an electromagnetic irradiation device for EPR excitation module to MRI with typical field strengths.
This is because the OMRI system requires a low B 0 compared with the magnetic field used in conventional MRI due to the high gyromagnetic ratio of electron spin. Moreover, for EPR excitation, effect of the electromagnetic wave penetration depth needs to be considered. Thus, the OMRI system can be regarded as the same as conventional MRI during NMR signal reception since the electron spin excitation is completed before the NMR signal is received. Therefore, the FC-OMRI, which uses a low magnetic field only during EPR excitation, allows the clinical MRI to be used for NMR reception in the OMRI system. The typical pulse sequence for FF-OMRI is shown in Figure 4A. For the FC-OMRI, a sequence for controlling the magnetic field of the magnet was added, as shown in Figure 4B.
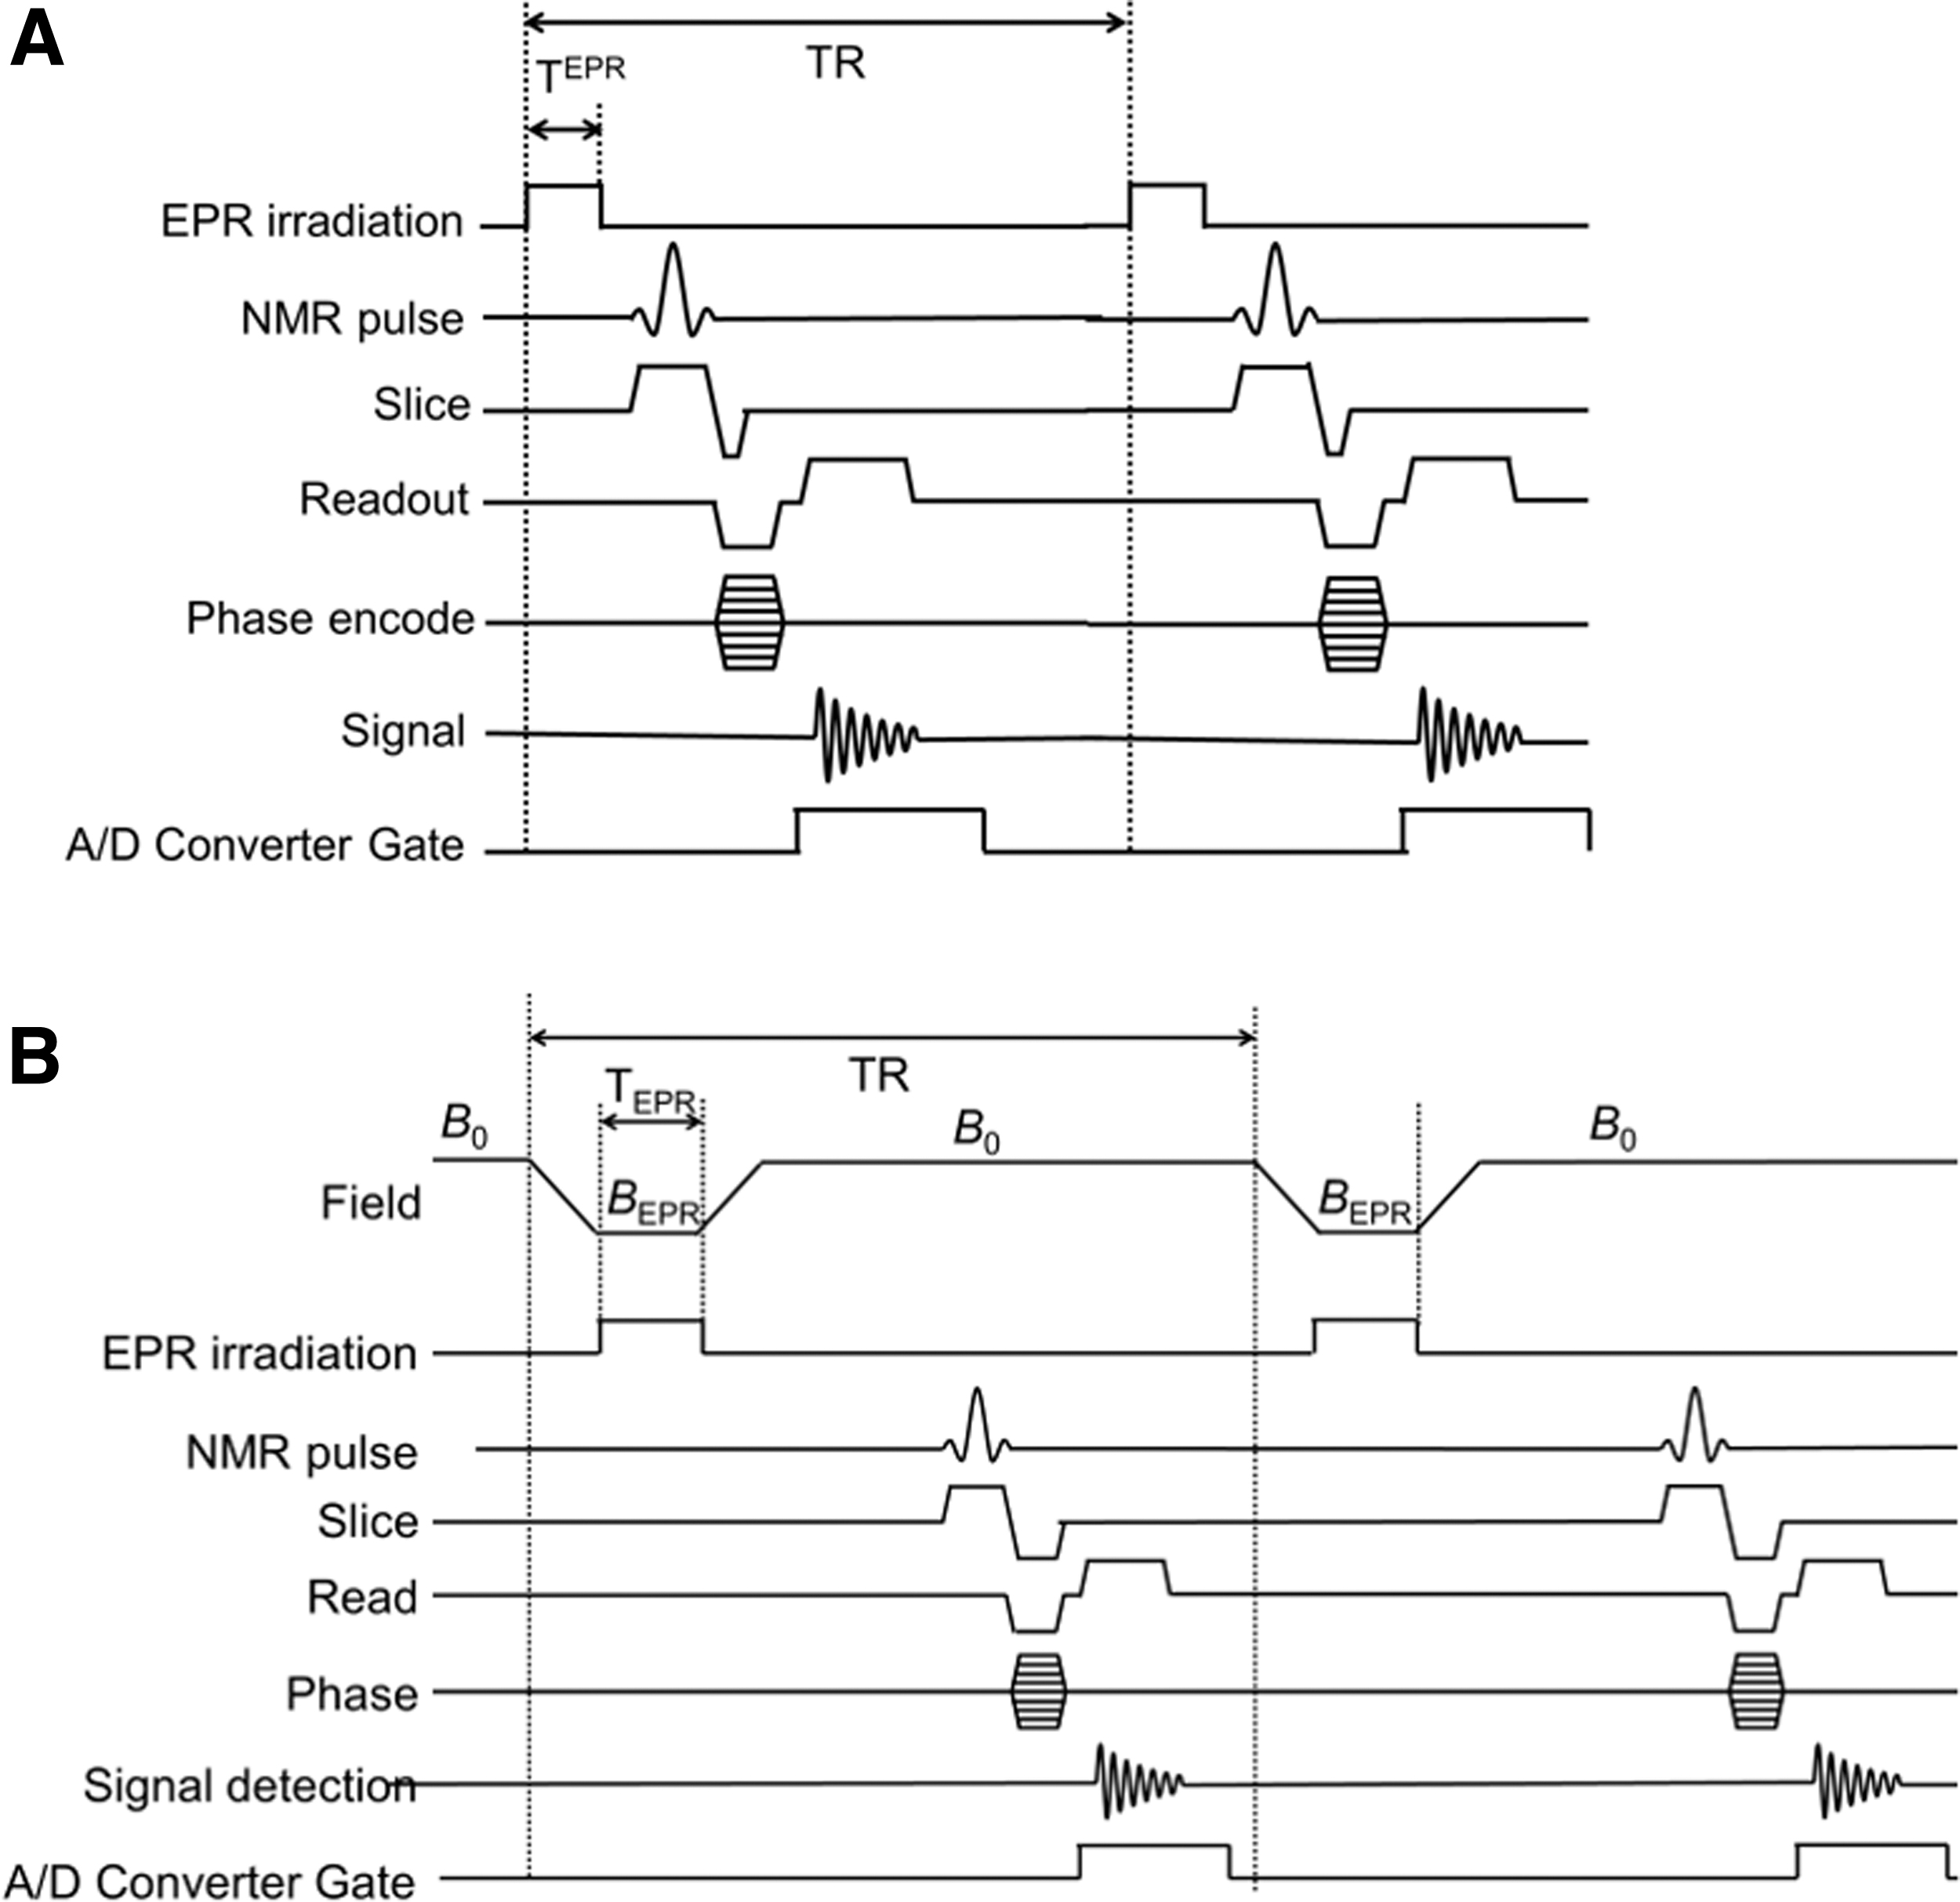
The electromagnetic wave coils used in OMRI systems differ from those used in MRI. As an OMRI resonator, the EPR excitation resonator for EPR irradiation is necessary, in addition to the NMR excitation and signal reception coils. An ideal OMRI resonator maximizes the NMR signal-to-noise ratio and spatial homogeneity of the response and provides homogeneous EPR irradiation to the target area with minimal applied and absorbed electromagnetic wave power. While there are some requirements, such as high Q and high B 1 efficiency and homogeneity, for NMR reception coils and EPR excitation coils because they strongly affect the sensitivity of the measurement, NMR transmitter coils are required only for optimal electromagnetic wave field homogeneity.
Although the basic configuration of the OMRI system is independent of the sample, for in vivo measurements, it is necessary to optimize the OMRI system according to the target organ to obtain sufficient measurement sensitivity. Particularly with an OMRI resonator with three coils, the interaction between NMR transmission and reception modes, as well as interactions between the EPR and NMR modes, should be minimal. As it is difficult to satisfy the requirements of each coil at the same time, the design of the electromagnetic wave coil for OMRI should be optimized according to the measurement target. Here, the sensitivity of magnetic resonance (Ψ
rms) can be expressed as Equation [4] (32):
where k is a numerical factor depending on the receiving coil geometry, η is the filling factor, M 0 is the nuclear magnetization, μ 0 is the magnetic permeability in free space, Q is the quality factor of the resonator, ω 0 is the Larmor frequency in an external static magnetic field, V c is the resonator coil volume, F is the noise figure of the preamplifier, k is the Boltzmann constant, T c is the temperature of the resonator coil, and Δf is the bandwidth of the receiver (32). According to this equation, the larger the filling ratio of the NMR receiver resonator coil, the higher is the receiver sensitivity. Similarly, the filling factor affects the EPR excitation efficiency of the EPR excitation resonator coil. The following sections describe each element of the OMRI system, depending on the target organ in in vivo OMRI.
Whole-Body OMRI for Small Animal Imaging
In OMRI for visualizing the organs in living bodies, such as the kidneys and stomach, 10–20 mT static magnetic fields have been frequently used in FF-OMRI methods. This is ∼280–560 MHz in terms of EPR excitation frequency; these electromagnetic waves can penetrate the body of small animals, such as mice and rats. In FC-OMRI, permanent and resistive magnets, such as solenoid-type coils and Helmholtz-type coils, are used as B 0 magnets. When OMRI is performed, the homogeneity of B 0 is important to prevent image distortion. However, with the OMRI system, owing to its low magnetic field, the requirement for external static field homogeneity is relaxed compared with that in conventional MRI systems with high magnetic fields (47). For example, even if there is a 200 ppm inhomogeneity in the sample area at 10 mT, the image distortion is <1% (47).
As NMR transmitter and receiver modes must be placed orthogonal to each other to prevent coupling between NMR coils, a saddle coil for the transmitter NMR coil and a solenoid coil for the receiver NMR coil are used. However, in EPR resonators, the resonant frequency to which they respond differs significantly from that of the NMR resonators. Therefore, there is less coupling between the NMR coil and EPR coil, even if the magnetic field direction is the same as that of the NMR transmitter or receiver coils. As EPR excitation coils, whole-body coils, such as Alderman–Grant coil (Fig. 5A), birdcage-type coil, and loop gap coil, have been frequently used. In particular, the Alderman–Grant coil is advantageous for in vivo measurements because its sample loss is lower than solenoid coils and other coils (64).
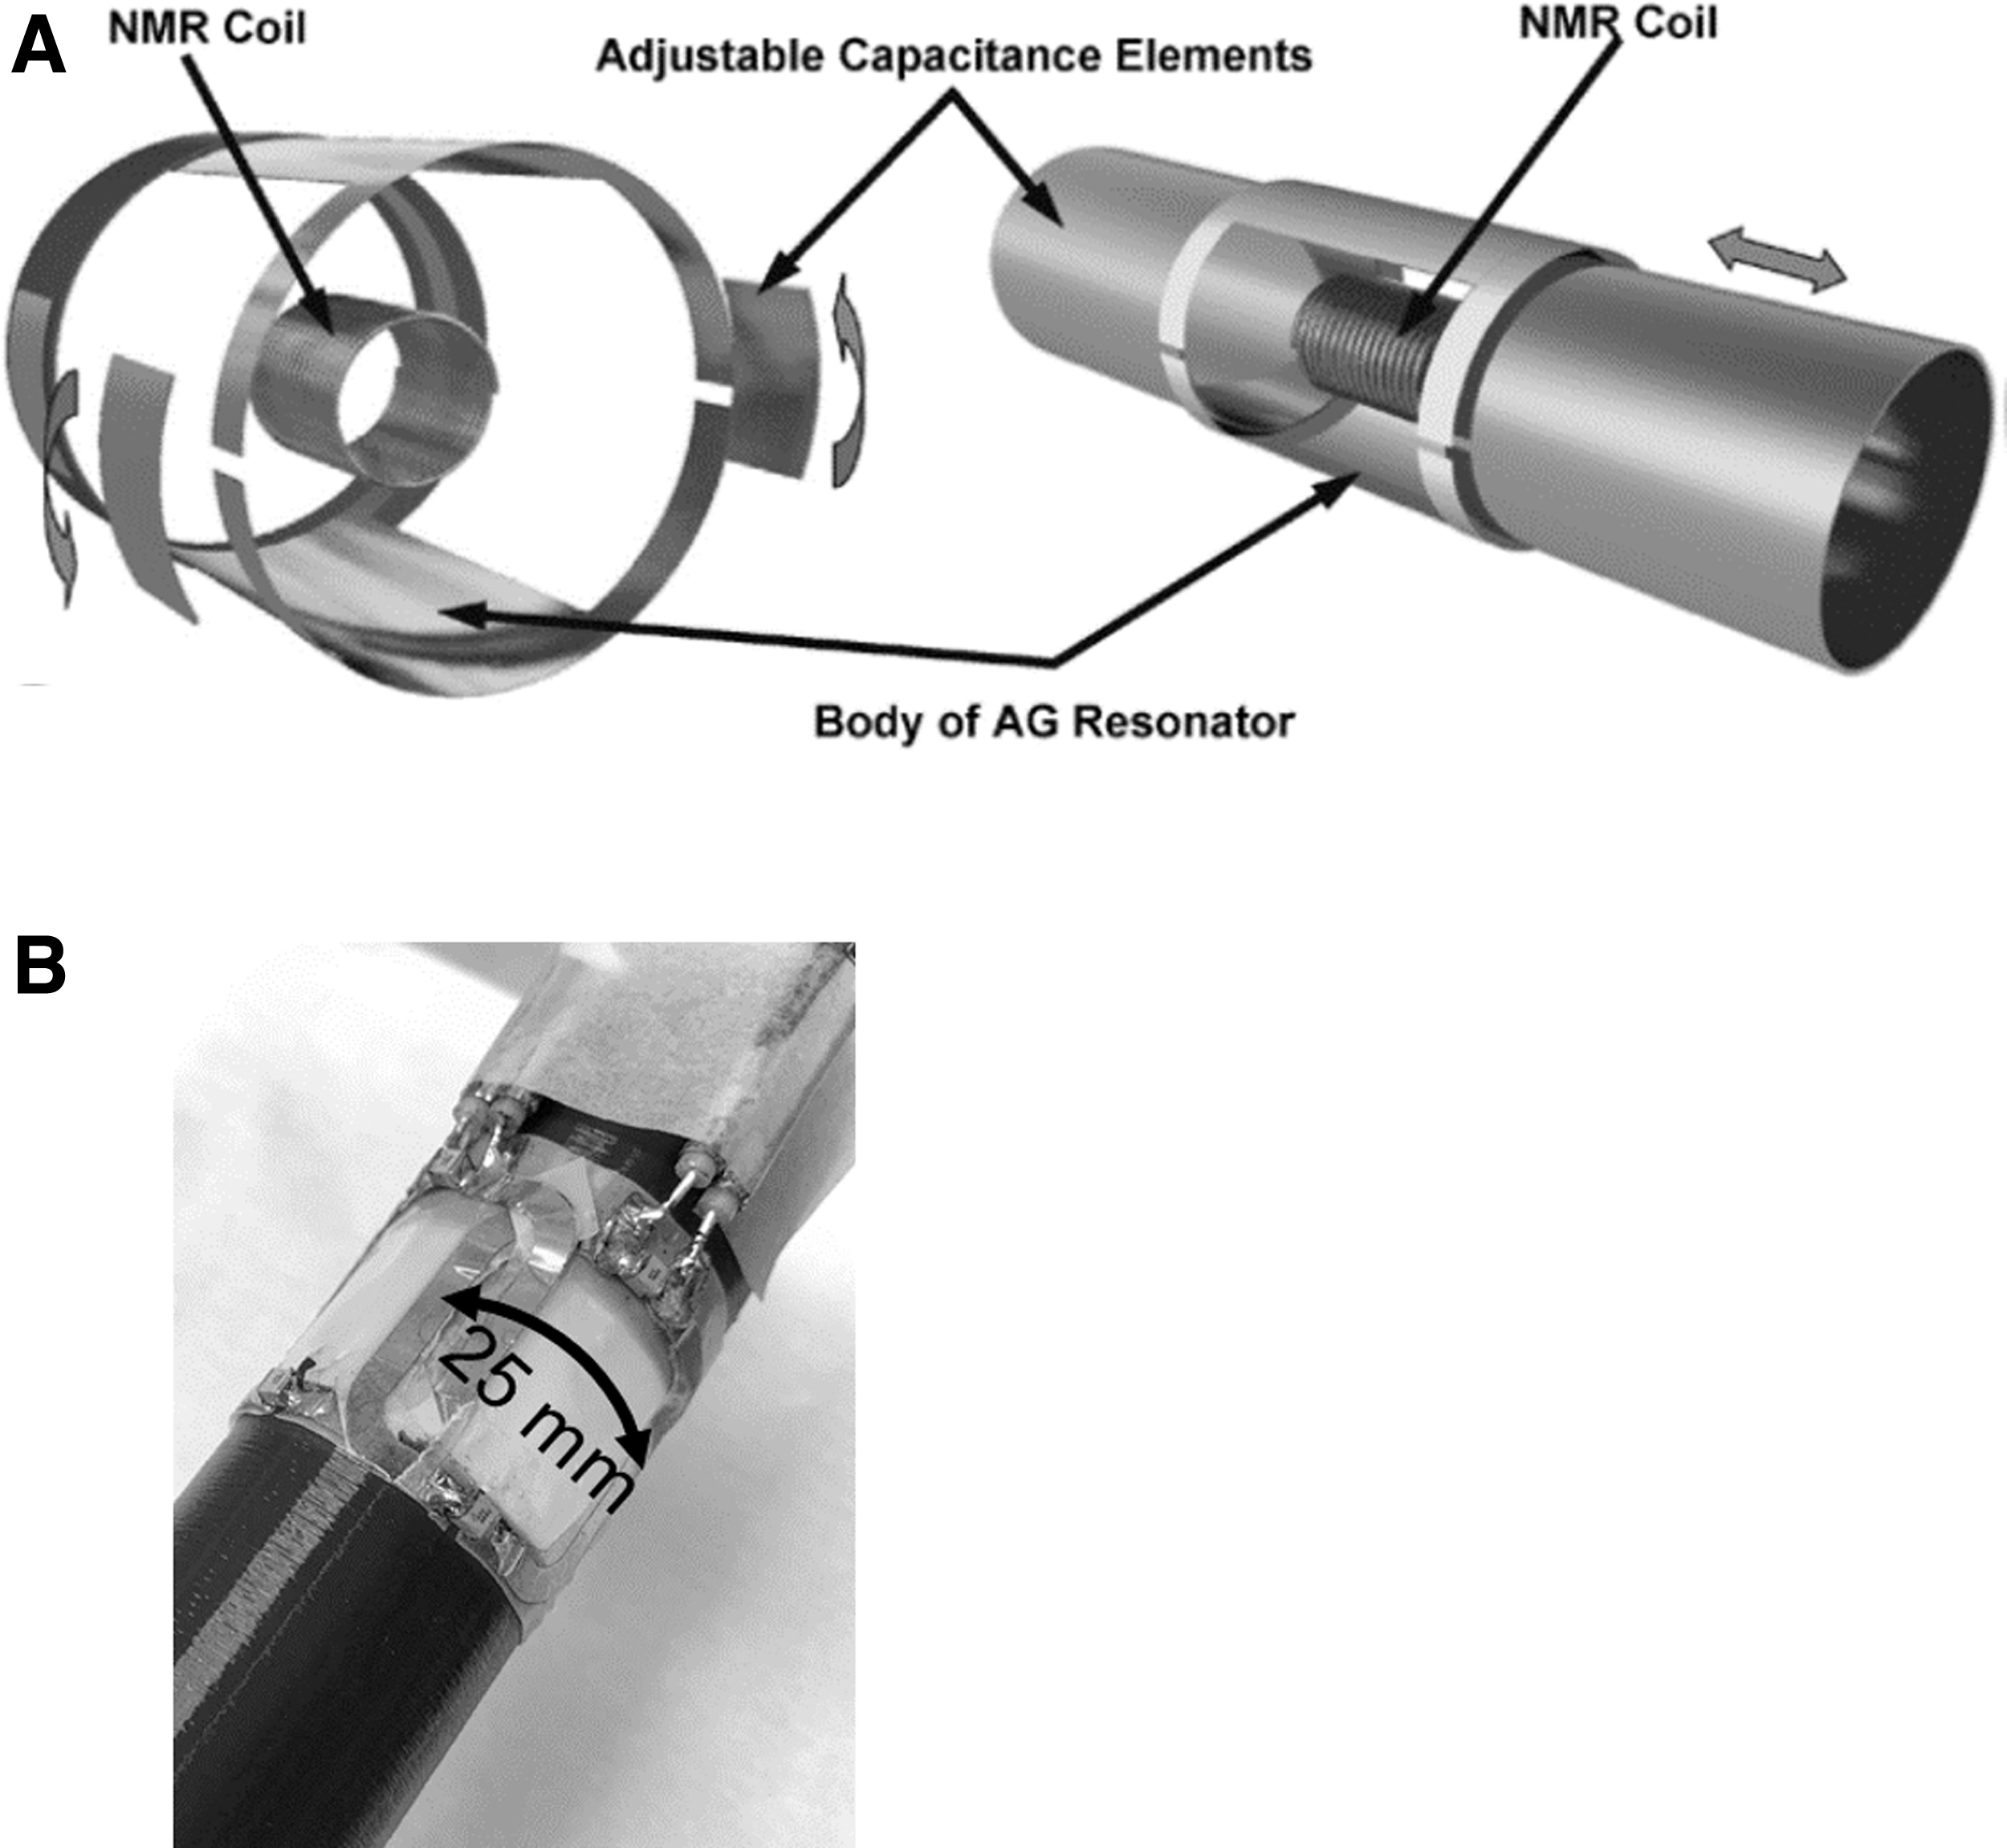
Surface coil resonators are also used as EPR resonators in some cases (57). While a surface coil of an appropriate size has high sensitivity and is effective for SAR reduction, increasing the diameter results in a decrease in magnetic field uniformity and sensitivity. Recently, the array coil resonator has been developed for EPR excitation of OMRI systems (Fig. 5B), as they have also been used in MRI (19). As the array coil resonator expands the area of measurement while maintaining sensitivity, it can be applied to the measurement of organs in relatively shallow locations, such as the spinal cord and kidneys (19).
With the FF-OMRI method, the EPR excitation frequency is fixed to the frequency corresponding to the external magnetic field; hence, only small animals can be studied. However, in the FC-OMRI method, the EPR excitation frequency is set to lower than that in the FF method, which enables in vivo measurements of large animals. The FC-OMRI method is also advantageous because a large magnet can be used and high sensitivity and field uniformity can be obtained (49, 52). However, a large amount of power is required to alter the magnetic field strength using a resistive coil in a limited time. Furthermore, there is a limitation on the switching speed (dB/dt) of the magnetic field strength applicable to living animals (83). Therefore, at present, there is a technical limitation on using high magnetic fields during NMR detection (61).
To resolve the problem of field strength switching by electromagnets, Naganuma et al. constructed an OMRI system, called the circular sample transport system, in which the sample moves between two static magnetic fields using a low-field electromagnet and a high-field clinical MRI (61). This system eliminates the need for a canceling field using electromagnets and reduces the load on the body by magnetic field switching.
The same resonators as in the OMRI system of the low-field FF method can be used. In the FC method, because the transmit/receive (Tx/Rx) switch can be used, it is possible to share the same NMR resonators for both transmission and reception (47, 49, 52).
OMRI for Dermatology
For OMRI measurements on the skin, a surface coil resonator is advantageous because of its high sensitivity to the sample surface as an EPR excitation resonator. Because even a few millimeters of penetration depth of electromagnetic waves is sufficient for skin measurement, the EPR excitation efficiency can be improved by reducing the coil diameter, and highly sensitive measurements can be obtained. In addition, considering the penetration depth of the electromagnetic wave, a high frequency of several gigahertz can be used. For instance, Tokunaga et al. developed a 0.15 T OMRI system corresponding to an EPR excitation frequency of 4 GHz (82). In such a GHz band, in addition to the surface coil resonator, a cavity resonator, which has a particularly high sensitivity among resonators, can be used as an EPR resonator.
Spin Probes for In Vivo Measurement
Spin probe agents, such as nitroxides, are commonly used in in vivo OMRI. To obtain biological information, various modifications have been made to spin probes depending on the application (6, 7, 9, 14, 72). The tissue permeability of spin probe agents varies depending on the octanol/water partition coefficients (14, 59). For example, 3-methoxycarbonyl-2,2,5,5-tetramethyl-pyrroli-dine-1-yloxy (MC-PROXYL), which has a high octanol/water partition coefficient, can penetrate the blood–brain barrier and is frequently used in OMRI measurements, especially for brain diseases (90, 91).
It is important to select an appropriate probe depending on the target organ. In addition, by designing a probe to specifically respond to the in vivo environment, it is possible to obtain information on typical in vivo parameters, such as redox state, temperature, pO2 (6, 10, 27), and pH (7 –9, 78). Therefore, selecting an appropriate spin probe aids in obtaining various physiological parameters. Several studies have described changes in the redox status of spin probes in various diseases for in vivo OMRI measurements (14, 42, 44, 91, 94). The next section describes examples of actual in vivo parameter acquisition using spin probe agents with different properties.
Application of In Vivo OMRI for Diseases
Redox imaging of the brain
Several studies have investigated OMRI based on changes in the redox status of spin probes in brain diseases (90, 91). All these studies used MC-PROXYL, which can penetrate the blood–brain barrier. Yamato et al. used OMRI to noninvasively visualize the redox state of the brain of 6-hydroxydopamine (6-OHDA) rats as a model for Parkinson's disease, using MC-PROXYL as a redox-sensitive probe agent (90). They compared the reduction rate of MC-PROXYL using OMRI images and found that the reduction rate was significantly slower in the lesioned hemisphere than in the contralateral hemisphere of 6-OHDA rats (Fig. 6). This result was consistent with that of EPR signal reduction in the lesioned mitochondrial fraction observed using X-band EPR and reduction in the level of mitochondrial complex I in the lesioned hemisphere identified using biochemical tests.
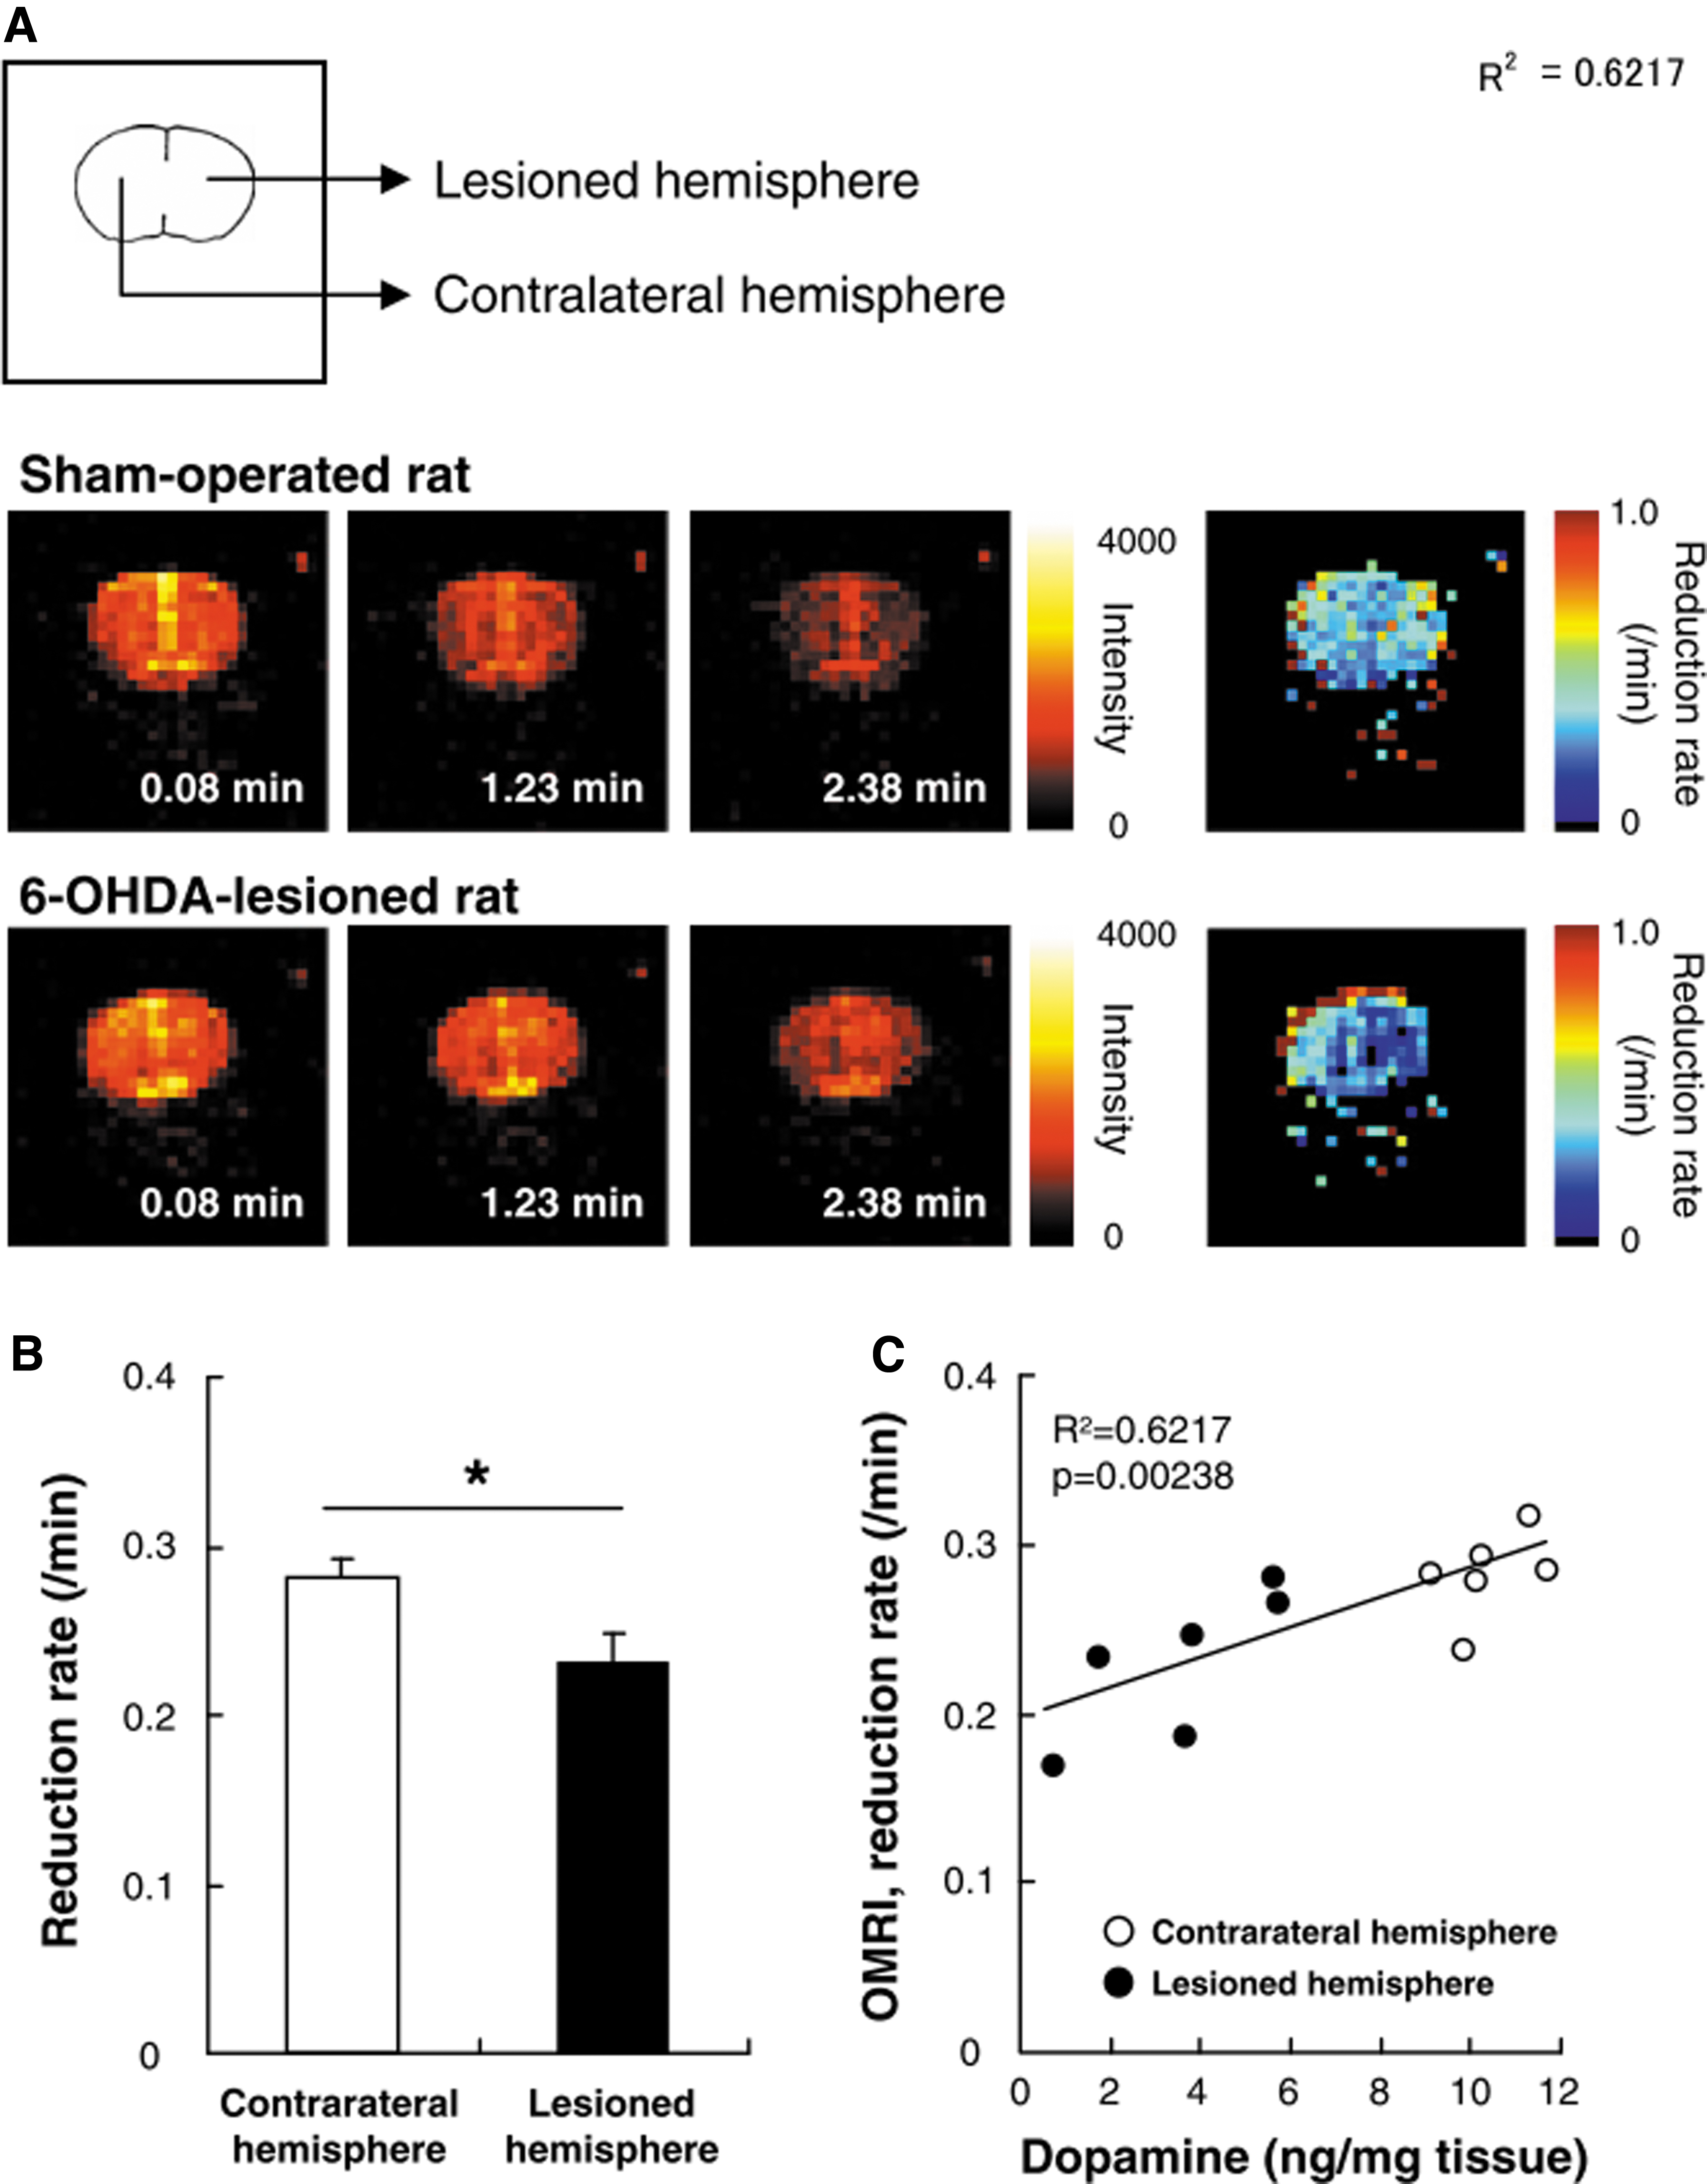
Thus, the images of redox changes acquired using OMRI are satisfactory reflections of the changes in the mitochondrial activity in a rat brain. In another report, redox changes in the brain after ischemia–reperfusion were investigated using MC-PROXYL as a spin probe (91). They induced cerebral ischemia in rats by occlusion of the middle cerebral artery and imaged the temporal changes in redox status after reperfusion, using OMRI (91). The results showed that although the MC-PROXYL signal reduction rate which calculated from OMRI images did not change 3 h after reperfusion, the signal reduction rate significantly decreased 24 h after reperfusion in the ischemic rat brain.
In addition, using biochemical methods, the authors found that the concentration of ascorbic acid in the ischemic hemisphere and the activity of mitochondrial complex II decreased in the ischemic lesion. Changes in antioxidant levels and mitochondrial activity are responsible for changes in the redox status in the ischemic hemisphere, which is consistent with the results of OMRI. Thus, OMRI images allow the successful visualization of changes in the redox state of the lesion in ischemia–reperfusion injury.
Redox imaging of gastric organs
Some studies have reported the visualization and analysis of the distribution of free radical species in gastrointestinal inflammation, such as gastric ulcer (14, 94) and ulcerative colitis (92), using the OMRI method.
Yasukawa et al. reported the use of indomethacin-induced gastric ulcer rats to analyze the redox state from OMRI images to investigate the mechanism underlying ROS production in gastric ulcers induced by nonsteroidal anti-inflammatory drugs (94). Previously, they analyzed the redox status of indomethacin-induced gastric ulcer rats by using the in vivo EPR/nitroxyl probe method with membrane-permeable and membrane-impermeable probes (14) and found that the location of ROS generation varied significantly in the intracellular compartment of gastric tissue (84). However, since in vivo EPR does not have sufficient temporal resolution, it is difficult to identify the ROS-generating regions.
The authors used multiple spin probes with different membrane permeabilities, such as TEMPOL, 1-oxy-4-trimethylamine-2,2,6,6,tetramethyl-piperidine (CAT-1), and MC-PROXYL, to identify the ROS-generating regions. In addition, two spin probes with different tissue permeabilities were labeled with stable isotopes, 14N and 15N, and simultaneously administered to rats with gastric ulcer models, resulting in successful identification of the ROS-generating region of the gastric ulcer (Fig. 7) (94). They performed OMRI imaging using dimethylthiourea (DMTU), an ROS scavenger, and found that in indomethacin-treated rats, DMTU suppressed the redox balance, leading to oxidation in the gastric mucosal layer, gastric mucosal layer surface, and the intracellular compartment of gastric epithelial cells, but not in the extracellular region around epithelial cells.
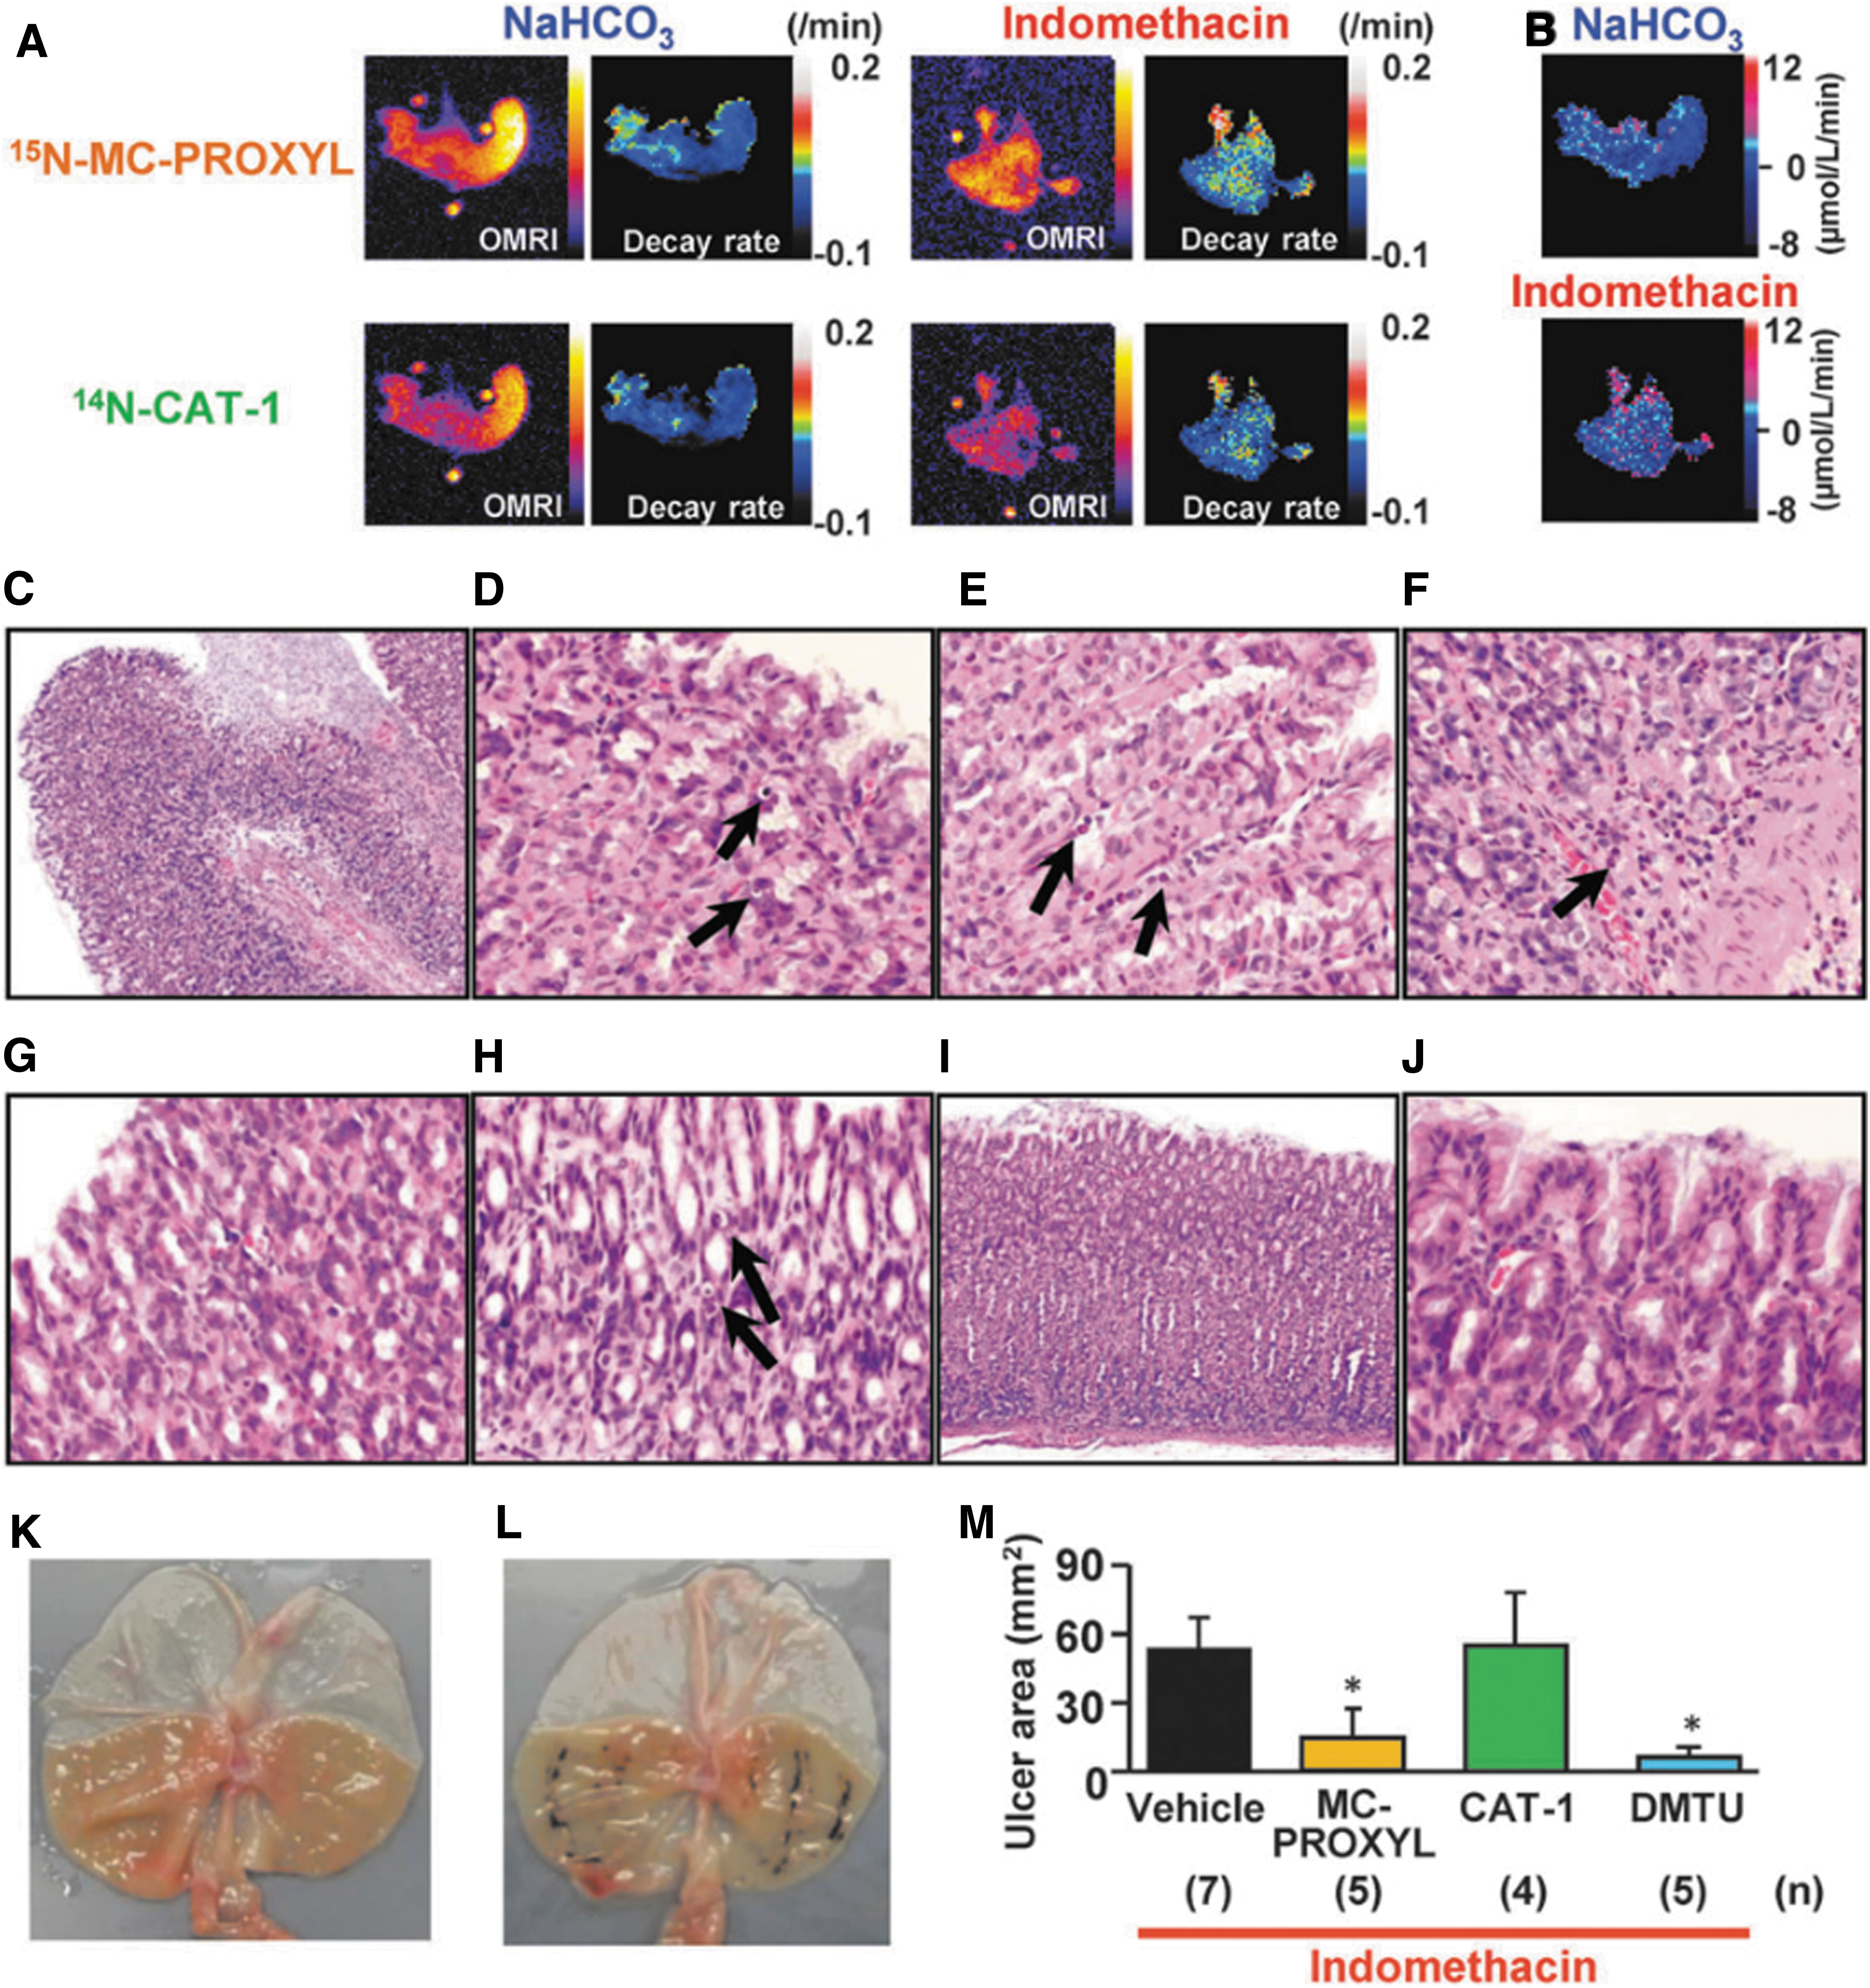
In addition, Deguchi et al. reported that the decay rate of OMRI signal intensity was decreased in indomethacin-induced gastric ulcer model mice when they were pretreated with nitroxide (14). Using OMRI and microscopy, they showed that pretreatment with membrane-permeable nitroxide and ROS scavengers reduced the area of gastric ulcer formation (94). These results from the OMRI images were consistent with the anatomical results. Thus, multiple spin probes with different characteristics can be used to investigate the detailed redox state in a multilayered tissue, such as the stomach, by using OMRI.
The OMRI and analysis method based on the dual probe method using multiple spin probe agents labeled with stable isotopes, which was used in the imaging of gastritis, can also be applied to probe ulcerative colitis, an inflammatory bowel disease. It has been reported that the changes in redox state observed during the development and progression of ulcerative colitis in humans and animal models involve ROS and RNS. Therefore, they monitored the in vivo redox state of the colon of mice with dextran sodium sulfate (DSS)-induced colitis using OMRI and investigated the relationship between the redox state and development and progression of colitis (92).
Before their report, the authors also demonstrated by in vivo EPR experiments that ROS generation occurs not only in the intracellular locations but also in the extracellular regions with the progression of ulcerative colitis (93). However, it has not been clarified where the redox reaction occurs; therefore, they investigated the changes in redox state during the initiation and progression of colitis, using OMRI and the dual probe technique using different tissue-permeable probes. 15N-labeled 3-carbamoyl-2,2,5,5-tetramethylpyrrolidin-1-oxyl (15N-CmP), which is tissue-permeable, and 14N-labeled 3-carboxyl-2,2,5,5-tetramethylpyrrolidin-1-oxyl (14N-CxP), which is not tissue- permeable, were used as spin probes.
The OMRI images showed that in the early stages of the disease, changes in the signal reduction rate were observed only for the tissue-permeable 15N-CmP; however, as the disease progressed, there were changes in the signal decay rate not only in the tissue-permeable 15N-CmP but also in the tissue-impermeable 14N-CxP. To reduce the symptoms of ulcerative colitis, it is necessary to diagnose the extent and location of colitis at an early stage. Therefore, the OMRI method, which can visualize changes in the redox state and determine the site of disease and its progression, may be used not only to monitor the progression of the disease but also for disease diagnosis.
pH measurement using OMRI
The pH homeostasis in living animals is altered by local acidosis caused by different conditions, such as ischemic diseases (12, 69) and inflammation (67, 68). Alteration of homeostasis is also caused by extracellular acidosis resulting from tumor (43, 95) and wound healing (37, 75). Therefore, noninvasive in vivo assessment of pH is very useful for understanding the pathogenesis and evaluating the severity of such diseases. There are several methods, such as fluorescence imaging, to evaluate pH in cells; however, for animals, MRI, EPRI, and OMRI are more effective. Here, we review the use of OMRI for pH measurements.
Khramtsov et al. succeeded in new functional imaging of living organisms with improved functional and temporal resolution by using the field-switching OMRI method (40). For pH imaging, they used pH-sensitive nitroxyl radical, 4-amino-2,2,5,5-tetramethyl-3-imidazoline-1-yloxy (R1) (40). They used the hyperfine splitting (HFS) of R1 for pH imaging (40). hfs is measured as the distance between the center position of the DNP spectral line of a triplet and the high-field position; it has been used as a pH-sensitive parameter in various studies. In addition, the authors found the pH value of each pixel could be extracted using only two OMRI images irradiated in the pre-selected EPR excitation field. Therefore, considering that the concentration ratio of protonated to non-protonated probes is directly related to pH ([RH+]/[R] = [H+]/Ka), the EPR excitation field was selected to correspond to the high-field peak position of the DNP spectrum of the RH+ and R-forms of the probe.
Thus, they determined two selected magnetic fields,
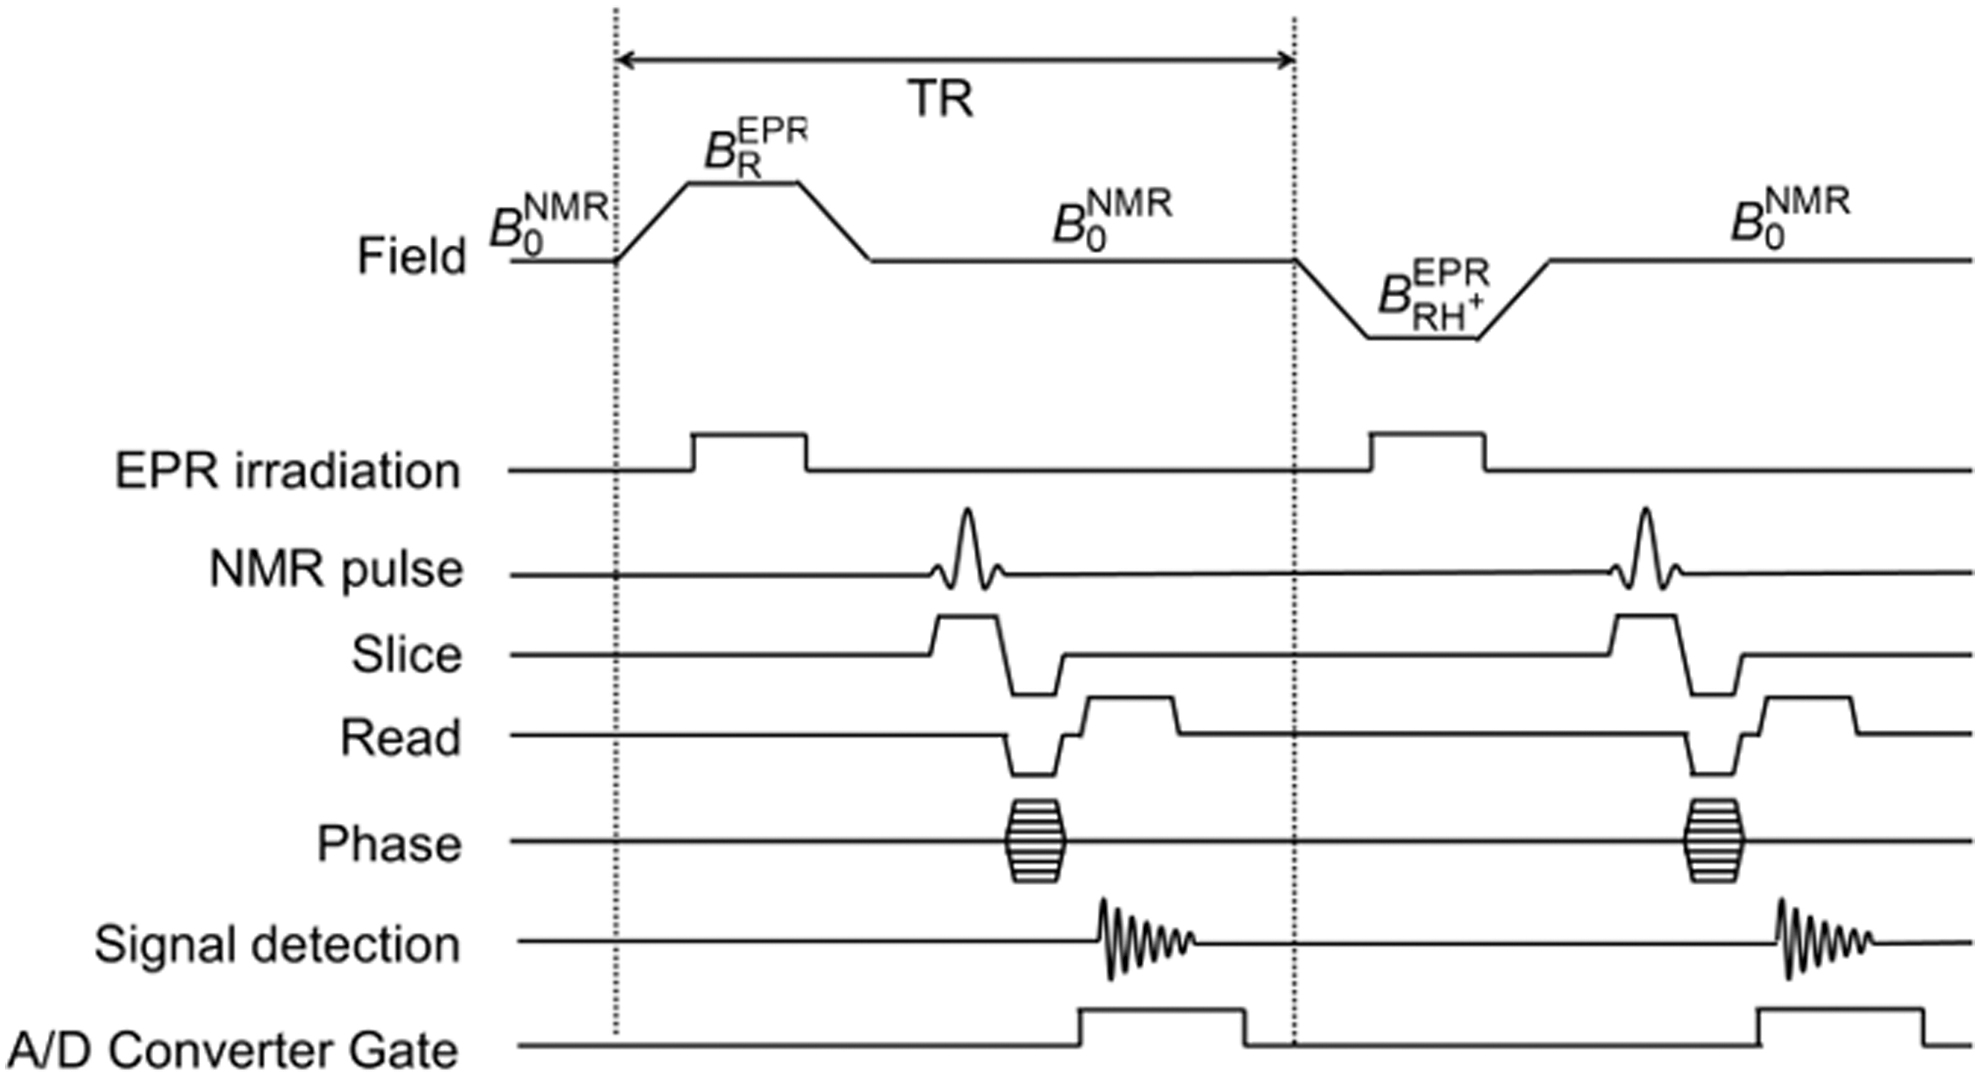
The authors acquired two OMRI images of the phantom acquired at an EPR frequency of 562 MHz (EPR central field of 20 mT) and EPR excitation fields of
Following the success of pH imaging using field-switching OMRI, another functional imaging method based on OMRI using an FF magnet has been developed (18, 71), unlike field-switching OMRI, which requires a variable magnetic field (60). The ramp time and stabilization time can be eliminated using a fixed magnetic field. In this OMRI method, OMRI data acquisition was performed by switching the microwave frequency used for the EPR irradiation. The microwave switching OMRI method enables the application of a fast spin echo sequence owing to the improved magnetic field homogeneity and stability, which reduces the acquisition time by more than an order of magnitude.
The microwave switching OMRI method was intended to obtain both spatial and specific spectral information with a minimal number of OMRI images acquired at a pre-selected EPR frequency. In the microwave switching method, OMRI is performed by varying the EPR excitation frequency instead of the EPR excitation field. The two EPR excitation frequencies selected in the microwave switching method are calculated from the experimental results of the DNP spectra of fully protonated and deprotonated samples, as in the field-switching method. These frequencies are optimized to maximize the DNP enhancement of the fully protonated and deprotonated pH-sensitive probes. The resonance frequency of the EPR excitation resonator is set to a frequency equidistant from the pre-selected EPR irradiation frequency.
After the sample is irradiated at the two EPR excitation frequencies, RF1 and RF2, and two MRI images are acquired, the signal intensity enhancement factors are calculated for each pixel of an individual MRI image. The map of ratio I(RF1)/I(RF2) is converted to a pH map. In addition to the theory of pH mapping using the field-switching OMRI, the ratio of OMRI signal intensity at each EPR irradiation frequency, I(RF1)/I(RF2), is determined by the contribution of RH+− and R-forms and is directly related to the local acidity; thus, the pH can be calculated. With microwave switching OMRI, three OMRI scans, one EPR off, and two EPR on are required to obtain the pH map. Therefore, a spatial resolution of 1.56 mm and a pH resolution of ∼0.1 pH units can be achieved with a total acquisition time of 6.8 s and an EPR irradiation time of 4.8 s (18).
When the Q-factor of the EPR resonator used in the microwave switching method is high, if the difference between the two EPR irradiation frequencies is large, the irradiation frequencies move away from the resonant frequency of the EPR excitation resonator and the EPR excitation efficiency decreases, resulting in unreliable images. Therefore, if the difference between the EPR irradiation frequencies is large, the use of a low-Q resonator is required. However, when the Q-factor is too low, the EPR excitation efficiency is also decreased, and the obtained image is not reliable for measuring functional parameters; thus, it is necessary to optimize the EPR resonator depending on the properties of the pH-sensitive probe.
Samouilov et al. performed pH imaging in the mammary gland of mice bearing Met-1 tumors using the microwave switching OMRI method with a pH-sensitive probe, (2-(4-((2-(4-Amino-4-carboxybutanamido)-3-(carboxymethylamino)-3-oxoproylthio)-methyl)phenyl)-4-pyrrolidino-2,5,5-triethyl-2,5-dihydro-1Himidazol-1-oxyl-D11 (Im6), which exhibits pH sensitivity between 5.8 and 7.8, which is optimal for measuring acidic extracellular tumor pH (pHe) (71). As shown in Figure 9, the OMRI image showed that the mean pH of normal mammary gland was 7.1 ± 0.1, whereas the mean pH of tumor tissue was slightly acidic at 6.8 ± 0.1, with a broad pH distribution (71). From these results, it was inferred that noninvasive monitoring of in vivo pH is possible by combining microwave switching OMRI with a pH probe that matches the range of changes in the extracellular tumor pH. Furthermore, the average pH values measured with OMRI and pH microelectrode differed only in the order of 0.1 unit, which further confirmed the effectiveness of OMRI.
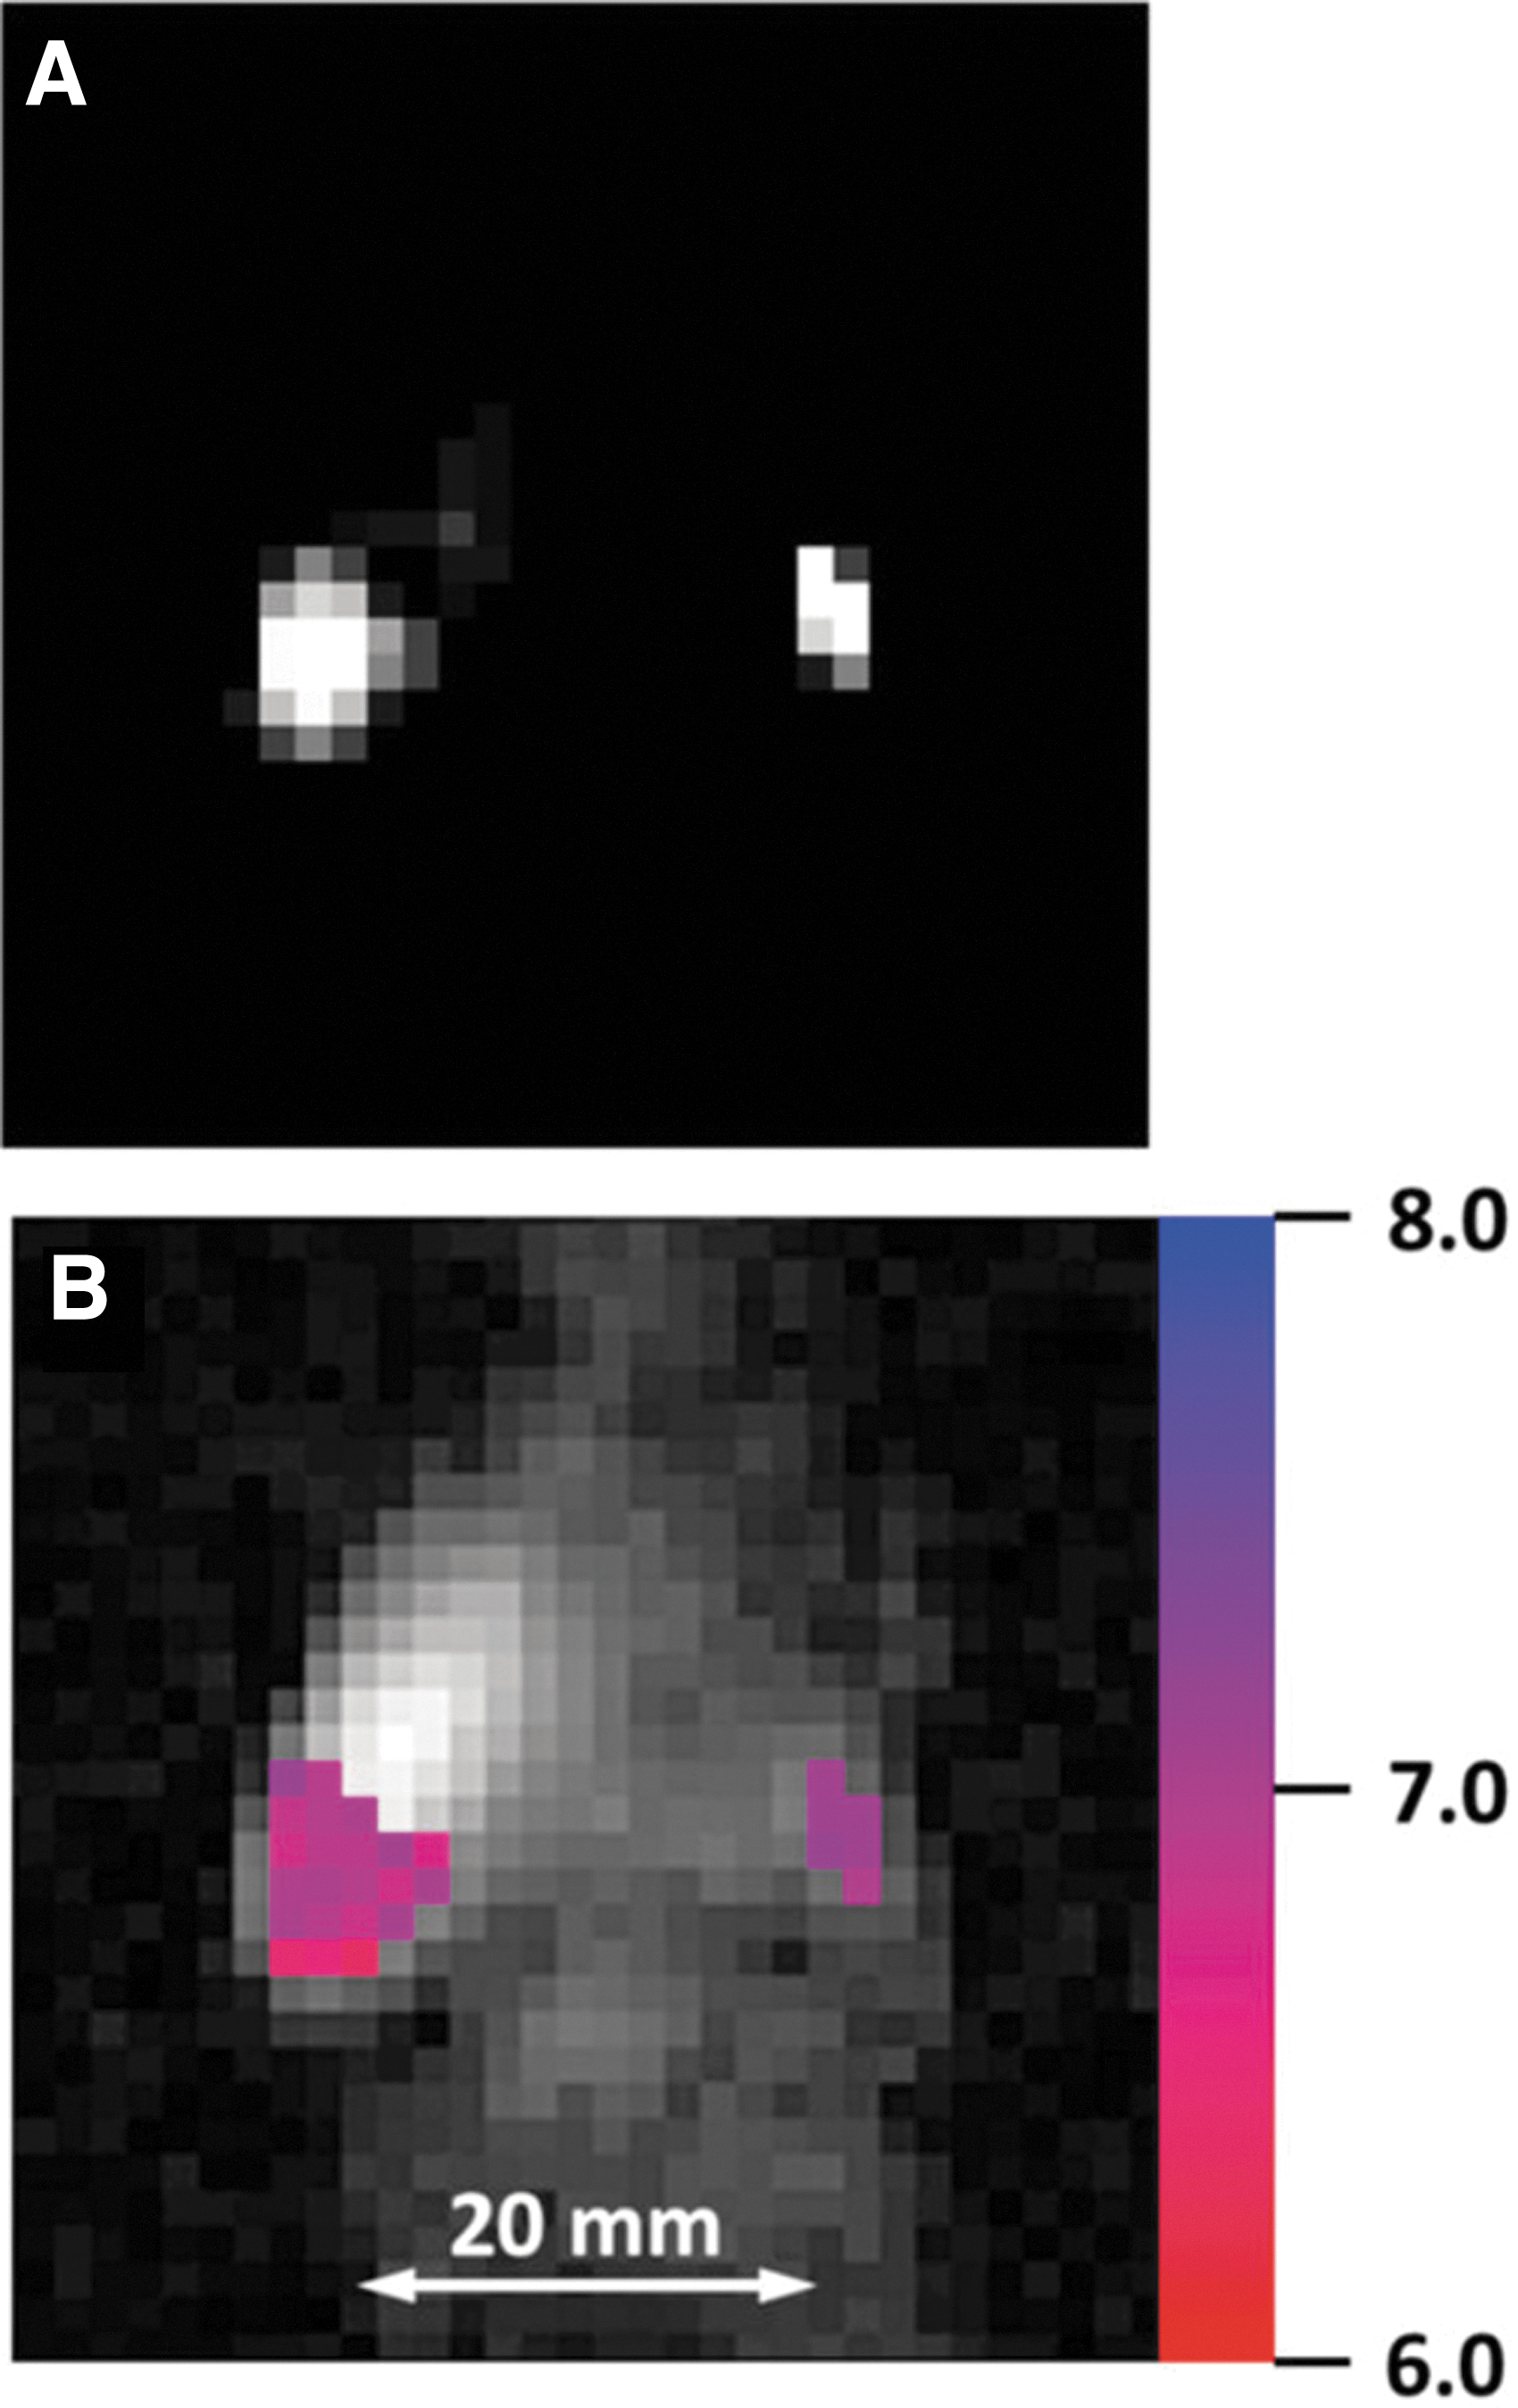
In addition, the microwave switching method facilitates the acquisition of not only pH but also other parameters, depending on the contrast agent. Gorodetskii et al. successfully performed multiparametric imaging using a microwave switching OMRI (26). In their experiments, they used monophosphonated perdeuterated trityl radical (dpTAM), which applies for multiparametric imaging, to visualize the spin probe concentration, pO2, extracellular pH, interstitial inorganic phosphate (Pi), and anatomical structures simultaneously with a single contrast agent (27). This multiparametric imaging method was demonstrated to apply for in vivo measurements. As described above, noninvasive in vivo simultaneous mapping of in vivo parameters, such as pO2, pH, and Pi, using the OMRI method may be a useful tool for elucidating the pathogenesis of diseases or for developing new therapeutic methods.
pO2 measurement using OMRI
pO2 and pH are among the most important biological parameters. pO2 is affected by various diseases, such as disorders characterized by ischemia–reperfusion (31). For example, pO2 is decreased in tumors due to significant oxygen deprivation (24, 30). pO2 decreases with an increase in the resistance of tumors to cancer therapies, such as radiotherapy (29, 58) and chemotherapy (29, 79). Therefore, evaluating pO2 in vivo can be a diagnostic and prognostic indicator of diseases, such as malignant tumors (85). Noninvasive in vivo pO2 imaging has been reported using MRI (15, 25, 55, 62), EPR (20, 31, 45, 80), and OMRI (26, 44, 56). The features of magnetic resonance oximetry methods are briefly described.
In the functional MRI method, a technique called blood oxygen level-dependent-MRI (BOLD-MRI) is mainly used (65, 81a). This measures blood oxygen saturation by utilizing the BOLD effect (65, 81a). However, quantitative oximetry is impossible with this method (38, 86). Although other in vivo oxygenation measurement methods using MRI such as19F-MRI have been proposed, they have certain limitations such as sensitivity and large chemical shift, which causes chemical shift artifact and decrease of spatial resolution (66). In the EPR method, the spectral information of oxygen-sensitive spin probes and their distribution can be obtained with high sensitivity, and quantitative measurements are possible. However, oximetry using EPRI does not provide anatomical information.
Compared with oximetry using the above-mentioned two magnetic resonance methods, OMRI is advantageous in oximetry because it is possible to measure with high sensitivity and high resolution, as well as to obtain anatomical images.
Molecular oxygen is a triplet radical that exists in nature; however, its relaxation time is extremely short in the dissolved state, and it is difficult to detect molecular oxygen directly with EPR or OMRI. Thus, oxygen-sensitive spin probes are commonly used to measure the oxygen concentration using EPR or OMRI. The changes in the EPR line width of the oxygen-sensitive spin probe are caused by the interaction between the oxygen molecule and the spin probe (10, 20, 44). The basic mechanism of the interaction between the spin probe and oxygen is mainly dominated by the Heisenberg spin exchange (16). The electrons of the spin probe relax more rapidly when they share the environment with oxygen.
The loss rate of both the phase and energy of the electrons in spin probe is proportional to the rate of encounter with oxygen, that is, it is directly proportional to the oxygen concentration and pO2. In the presence of oxygen, the spin exchange between oxygen and the spin probe results in a reversible broadening of the EPR spectrum (1, 20). Therefore, by measuring the broadening of the spectrum, it is possible to quantify pO2 using OMRI or EPR. In OMRI oximetry, a narrow-line paramagnetic contrast agent based on the trityl radical (triallylmethyl) is mainly used as an oxygen-sensitive probe. In OMRI, the enhancement of the proton NMR signal by spin probes depends on the oxygen concentration, which makes it possible to perform quantitative spatial encoding of pO2 in tissue.
However, whereas the spin probe enhances the proton NMR signal, this enhancement depends on both the local concentration of the probe and the oxygen concentration; therefore, the effect of concentration must be considered. The enhancement on a pixel scale also depends on the EPR radio frequency (RF) power and the concentration of the spin probe. Therefore, Krishna et al. performed OMRI with two EPR RF power levels to remove the effect of concentration-induced broadening and calculated the change in the EPR spectral line width due to the contrast agent (44).
This calculation can be used to generate a calibration curve for pO2 measurement. They used Oxo63, a type of trityl radical, as an oxygen-sensitive probing agent to perform OMRI of the whole body of mice (44). The mice had squamous cell carcinoma (SCC VII) implanted in their hind leg, with a tumor size of ∼1 cm. The results of OMRI are shown in Figure 10; the concentration of Oxo63 was high in the kidney and tumor, but the pO2 images showed a different distribution, particularly in the tumor. pO2 images showed that the tumor (SCC VII) was highly hypoxic (44).
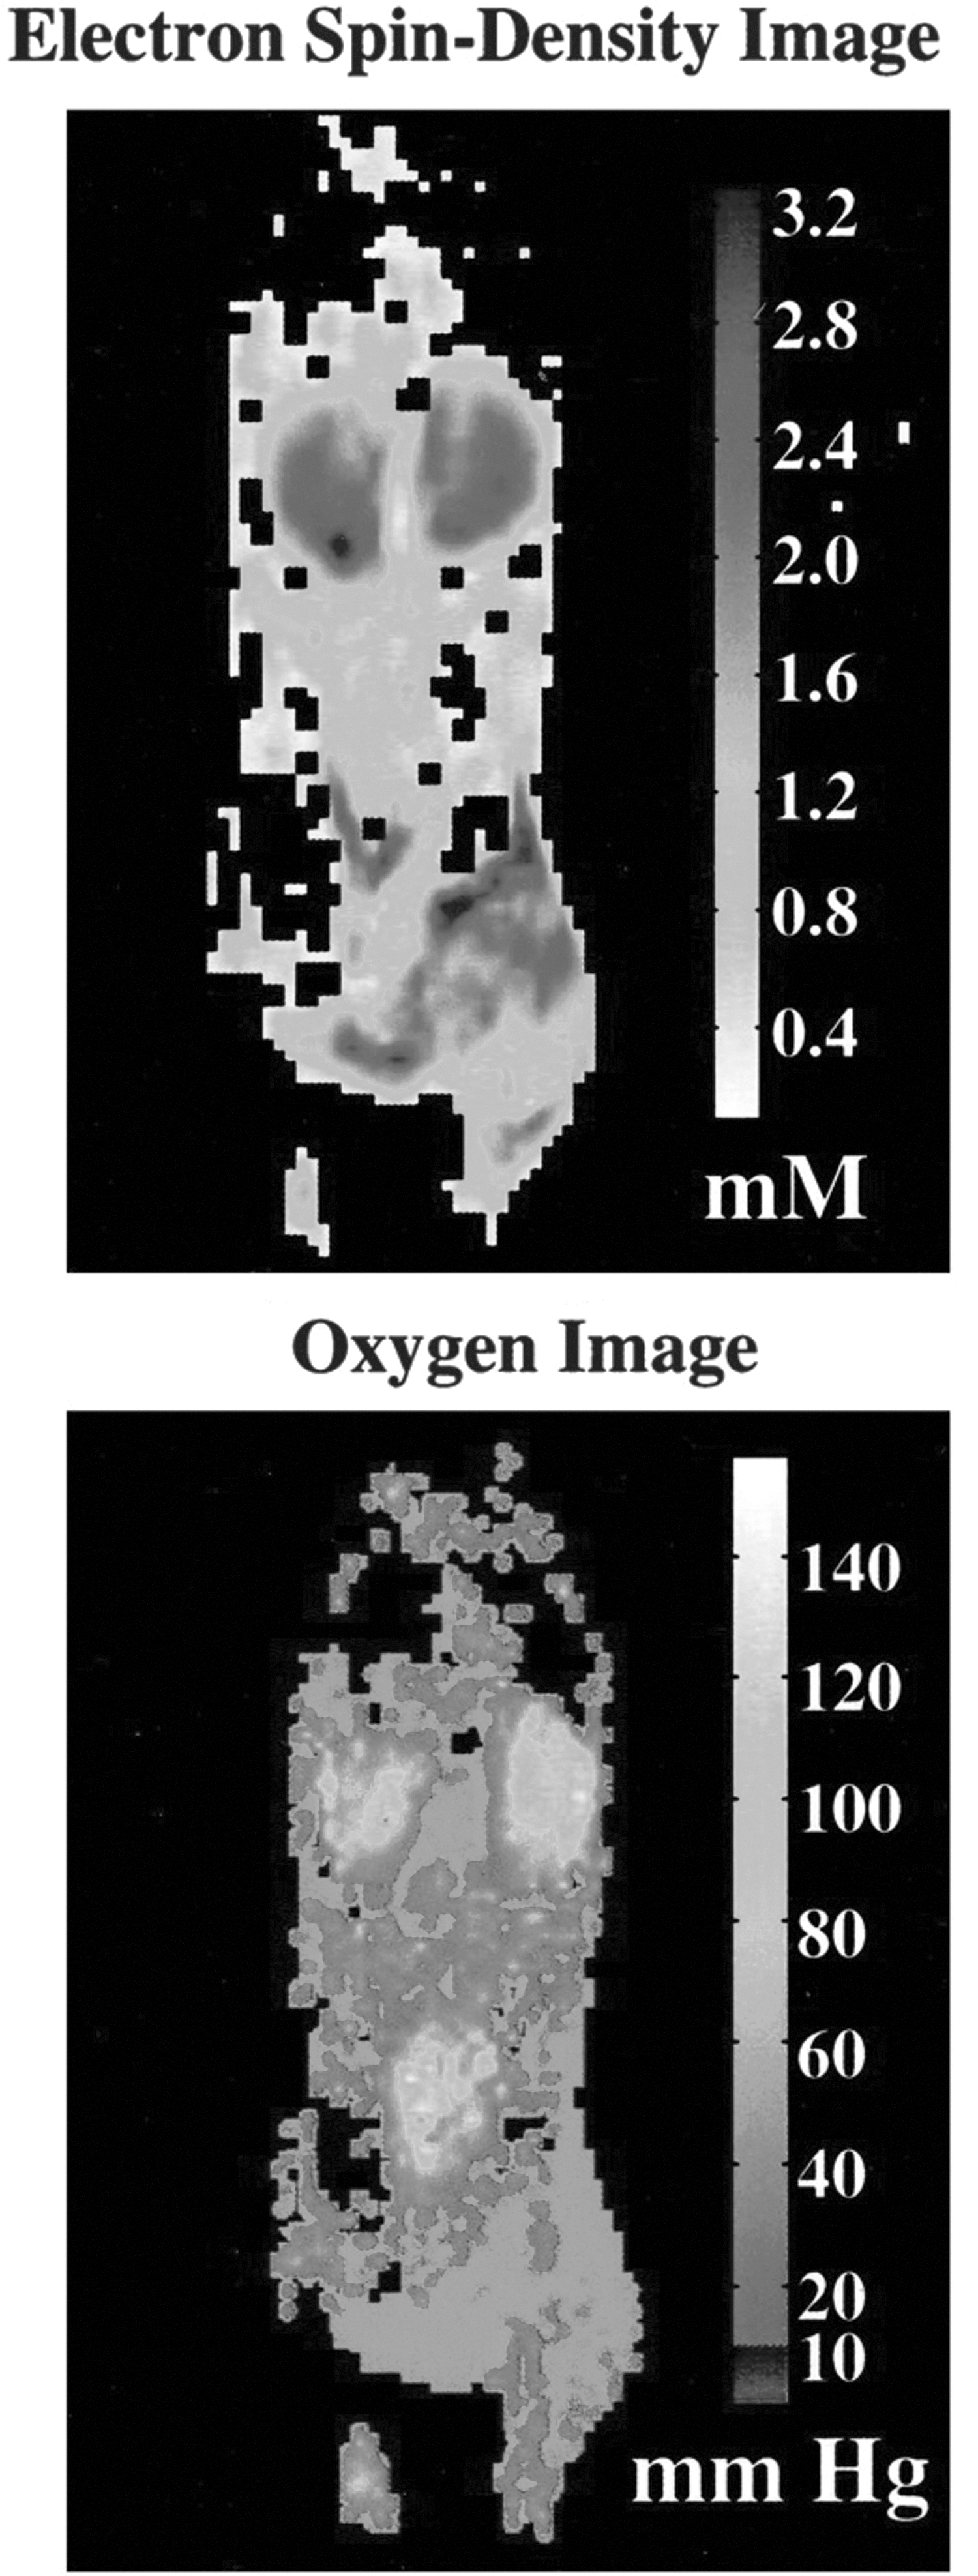
To increase the accuracy of OMRI oximetry, Matsumoto et al. investigated the effect of tissue proton T 1 on pO2, which varied depending on the sample, organ, and tissue types (56). They evaluated T 1 on a pixel-by-pixel basis using several RF power levels and found that by applying and correcting the results of this evaluation to OMRI oximetry, they could improve the results of in vivo pO2 evaluation.
Although most applications of OMRI oximetry have been for tumors, they have also been used for assessing changes in pO2 in the kidney in diabetes mellitus. Although renal hypoxia plays an important role in the progression of diabetic nephropathy, there is a lack of noninvasive and quantitative methods to monitor renal oxygenation. Therefore, Kodama et al. evaluated the feasibility of measuring oxygen levels in the kidney using OMRI with Oxo63 (42). In their experiment, they showed that it was possible to obtain a quantitative map of oxygen concentration in the renal cortex of mice. Furthermore, OMRI oximetry showed that pO2 was lower in the renal cortex of streptozotocin-induced type 1 and type 2 diabetic db/db mouse models than in the renal cortex of control mice and that pO2 in the kidneys of streptozotocin-treated mice was improved by insulin administration.
Thus, OMRI oximetry may be useful not only for studying the pathophysiological role of hypoxia but also for evaluating the effect of biomedical treatment.
Imaging of endogenous free radical compounds using OMRI
Although spin probe agents are often used in OMRI because of the short relaxation time and short half-life of endogenous radicals in vivo and their low abundance in the body, some studies have reported the direct detection of endogenous free radicals.
For example, Hyodo et al. showed that MRI signals are enhanced by EPR excitation of melanin radicals, which are endogenous free radicals in melanin pigments (33). Therefore, since melanin radicals do not require spin trapping or probing agents, they can be used as a bioprobe for OMRI measurements, which could allow noninvasive visualization of melanoma tissue. In fact, the authors successfully demonstrated the in vivo imaging of melanoma using endogenous free radicals in the melanin pigments of living mice as a spin probe.
Sometimes, the distribution of drugs has been evaluated by direct detection using the OMRI method without probe agents. Kato et al. examined the possibility of OMRI-based visualization of drug distribution, considering that a fraction of doxorubicin, an anticancer drug, exists in semiquinone radical form in solution (39). In their experiments, they directly administered 50 μL of 10 mM doxorubicin, which included ∼20 μM of the radical form of doxorubicin into mouse tumors and then performed OMRI. The results showed the OMRI signal was enhanced where doxorubicin was administered, indicating that doxorubicin can be visualized for OMRI. These results indicate that any agent that forms radicals can be used as a tracer using OMRI, even if the agent is present at as low as several tens of micromolar concentration. Thus, OMRI measurement can obtain antitumor agent distribution noninvasively and is expected to become a valuable tool in chemotherapy.
Conclusions
OMRI is a free radical imaging method based on the Overhauser effect. Because the first OMRI was achieved in 1988, the sensitivity of OMRI has been improved by using strategies, such as FC, and methods to measure various in vivo parameters have been actively developed. Thus, it is now possible to visualize the distribution of radicals with a resolution as high as that of MRI and with a sensitivity for detecting free radicals as high as that of EPR. With the advancements in OMRI techniques, they have been used in various applications for quantitative measurements, such as in vivo redox status, pH, and pO2 measurements. In addition, the improved detection sensitivity has allowed the detection of endogenous radicals and administered drugs in vivo without probing agents. Visualization of functional in vivo parameters and radical distribution by OMRI would be useful for the investigation of pathological conditions, diagnosis, and evaluation of therapeutic effects in various disease models in the future.
Footnotes
Acknowledgment
We would like to thank Editage for English language editing.
Authors’ Contribution
A.E. and K.I. authored this article.
Author Disclosure Statement
There are no conflicts of interest to declare.
Funding Information
This work was partially supported by Japan Society for the Promotion of Science (JSPS) KAKENHI 20K20188, 18KK0304 (A.E.), and 18H03526 (K.I.).