




Abstract
Aims:
Pancreatic cancer is among the top five leading causes of cancer-related deaths worldwide, with poor overall survival rates. Current therapies for pancreatic cancer lack tumor specificity, resulting in harmful effects on normal tissues. Therefore, developing tumor-specific agents for the treatment of pancreatic cancer is critical. NAD(P)H:quinone oxidoreductase 1 (NQO1), highly expressed in pancreatic cancers but not in associated normal tissues, makes NQO1 bioactivatable drugs a potential therapy for selectively killing NQO1-positive cancer cells. Our previous studies have revealed that the novel NQO1 bioactivatable drug deoxynyboquinone (DNQ) is 10-fold more potent than the prototypic NQO1 bioactivatable drug β-lapachone in killing of NQO1-positive cancer cells. However, DNQ treatment results in high-grade methemoglobinemia, a significant side effect that limits clinical development.
Results:
Here, we report for the first time on a DNQ derivative, isopentyl-deoxynboquinone (IP-DNQ), which selectively kills pancreatic ductal adenocarcinoma (PDAC) cells in an NQO1-dependent manner with equal potency to the parent DNQ. IP-DNQ evokes massive reactive oxygen species (ROS) production and oxidative DNA lesions that result in poly(ADP-ribose)polymerase-1 (PARP1) hyperactivation, mitochondrial catastrophe, and G2/M phase cell cycle arrest, leading to apoptotic and necrotic programmed cell death. Importantly, IP-DNQ treatment causes only mild methemoglobinemia in vivo, with a threefold improvement in the maximum tolerated dose (MTD) compared with DNQ, while it significantly suppresses tumor growth and extends the life span of mice in subcutaneous and orthotopic pancreatic cancer xenograft models.
Innovation and Conclusion:
Our study demonstrates that IP-DNQ is a promising therapy for NQO1-positive pancreatic cancers and may enhance the efficacy of other anticancer drugs. IP-DNQ represents a novel approach to treating pancreatic cancer with the potential to improve patient outcomes.
Introduction
A
Gemcitabine and other cytotoxic chemotherapies have been the standard of care for the treatment of pancreatic cancer for more than 20 years, but these treatments have not been found to be curative (Miller et al., 2020). Furthermore, the lack of tumor-selective activity of cancer chemotherapy contributes to toxicity and is a major limiting factor (Schirrmacher, 2019). Therefore, there is a critical need to develop novel potent and tumor-selective anticancer drugs for treating pancreatic cancer.
NAD(P)H:quinone oxidoreductase 1 (NQO1) is one of two major quinone reductases that play multiple roles in cellular adaptation to stress (Ross and Siegel, 2017). Accumulating evidence suggests that the expression of NQO1 is upregulated in many types of solid tumors, including nonsmall cell lung cancer (NSCLC), prostate, breast, colon, liver, and pancreatic cancers, in comparison with their respective nontumor tissues (Huang et al., 2016; Lewis et al., 2017; Logsdon et al., 2003; Su et al., 2021; Thapa et al., 2014; Zhao et al., 2021). NQO1 is capable of reducing some quinones to hydroquinones via catalysis of a two-electron reduction, bypassing the formation of semiquinones to generate reactive oxygen species (ROS) and reactive nitrogen species, resulting in cellular damage (Ross and Siegel, 2017).
Innovation
Challenges with current pancreatic cancer therapies include a lack of tumor specificity and the corresponding toxic side effects on normal tissues, and thus, developing tumor-specific agents for the treatment of pancreatic cancer is a critical need. Our study is the first to demonstrate isopentyl-deoxynboquinone (IP-DNQ) as a novel NAD(P)H:quinone oxidoreductase 1 (NQO1) bioactivatable drug that kills pancreatic cancer cells by NQO1-mediated futile cycle reactive oxygen species production, poly(ADP-ribose)polymerase (PARP) hyperactivation, and NAD+/ATP losses, which induces mitochondrial dysfunction and G2/M phase cell cycle arrest, resulting in both apoptotic and necrotic programmed cell death. Furthermore, we also demonstrate that IP-DNQ treatment shows efficient antitumor efficacy with low side effects in vivo. Our findings offer a novel potential therapy against NQO1-positive pancreatic cancers and enable mechanism-based synergy with other anticancer drugs.
In our previous studies, we found that NQO1 bioactivatable drugs, β-lapachone and deoxynyboquinone (DNQ) (Supplementary Fig. S1), selectively kill NQO1-positive pancreatic cancer cells (Huang et al., 2016; Huang et al., 2012; Jiang et al., 2022; Silvers et al., 2017). Both β-lapachone and DNQ initiate NQO1-dependent futile redox cycling, thereby generating reactive oxygen species (ROS) and oxidative stress, causing poly(ADP-ribose)polymerase-1 (PARP1) hyperactivation and DNA damage (Huang et al., 2016; Huang et al., 2012). However, β-lapachone has modest potency in vitro and limited aqueous solubility. Although DNQ is 10-fold more potent than β-lapachone in killing NQO1-positive cancer cells, it has undesired in vivo effects—high-grade methemoglobinemia at the maximum tolerated dose (MTD) of 5 mg/kg in mice (Huang et al., 2012). Thus, exploration of more effective DNQ derivatives that exhibit reduced methemoglobinemia, resulting in a significantly improved MTD and a larger therapeutic window, is urgently needed.
In this study, we investigate the potential of DNQ analog, isopentyl-deoxynboquinone (IP-DNQ) (Supplementary Fig. S1) (Parkinson et al., 2013), which shares a similar mechanism of killing NQO1-positive cancer cells as β-lapachone and DNQ. However, the effects of NQO1 bioactivatable drugs on mitochondria function have not been explored. We hypothesized that IP-DNQ could induce mitochondrial dysfunction with ATP loss, leading to programmed necrosis or apoptosis. Furthermore, we hypothesized that IP-DNQ could have greater potency in killing NQO1-expressing pancreatic cancer cells. We also planned to evaluate the NOQ1-dependent killing efficacy of IP-DNQ in vivo by establishing tumor xenograft models.
Results
IP-DNQ kills pancreatic cancer cells in an NQO1-dependent manner
Previously, findings obtained from our laboratory and other research groups have demonstrated that DNQ and NQO1 bioactivatable drugs induce cytotoxicity in an NQO1-dependent manner (Li et al., 2019; Li et al., 2016; Lundberg et al., 2017). As IP-DNQ is a DNQ derivative, we were interested in confirming that IP-DNQ kills cancer cells in an NQO1-depedent manner. To investigate the association between IP-DNQ lethality, NQO1 expression, and pancreatic cancer cells, we first tested NQO1 expression and enzyme activity in various pancreatic cancer cell lines. The expression of NQO1 was found to be significantly upregulated in pancreatic cancer cell lines MiaPaCa-2, BxPC-3, and HS766T compared with the pancreatic cancer cell lines PANC1 and S2-013, as assessed by Western blot (Fig. 1A).
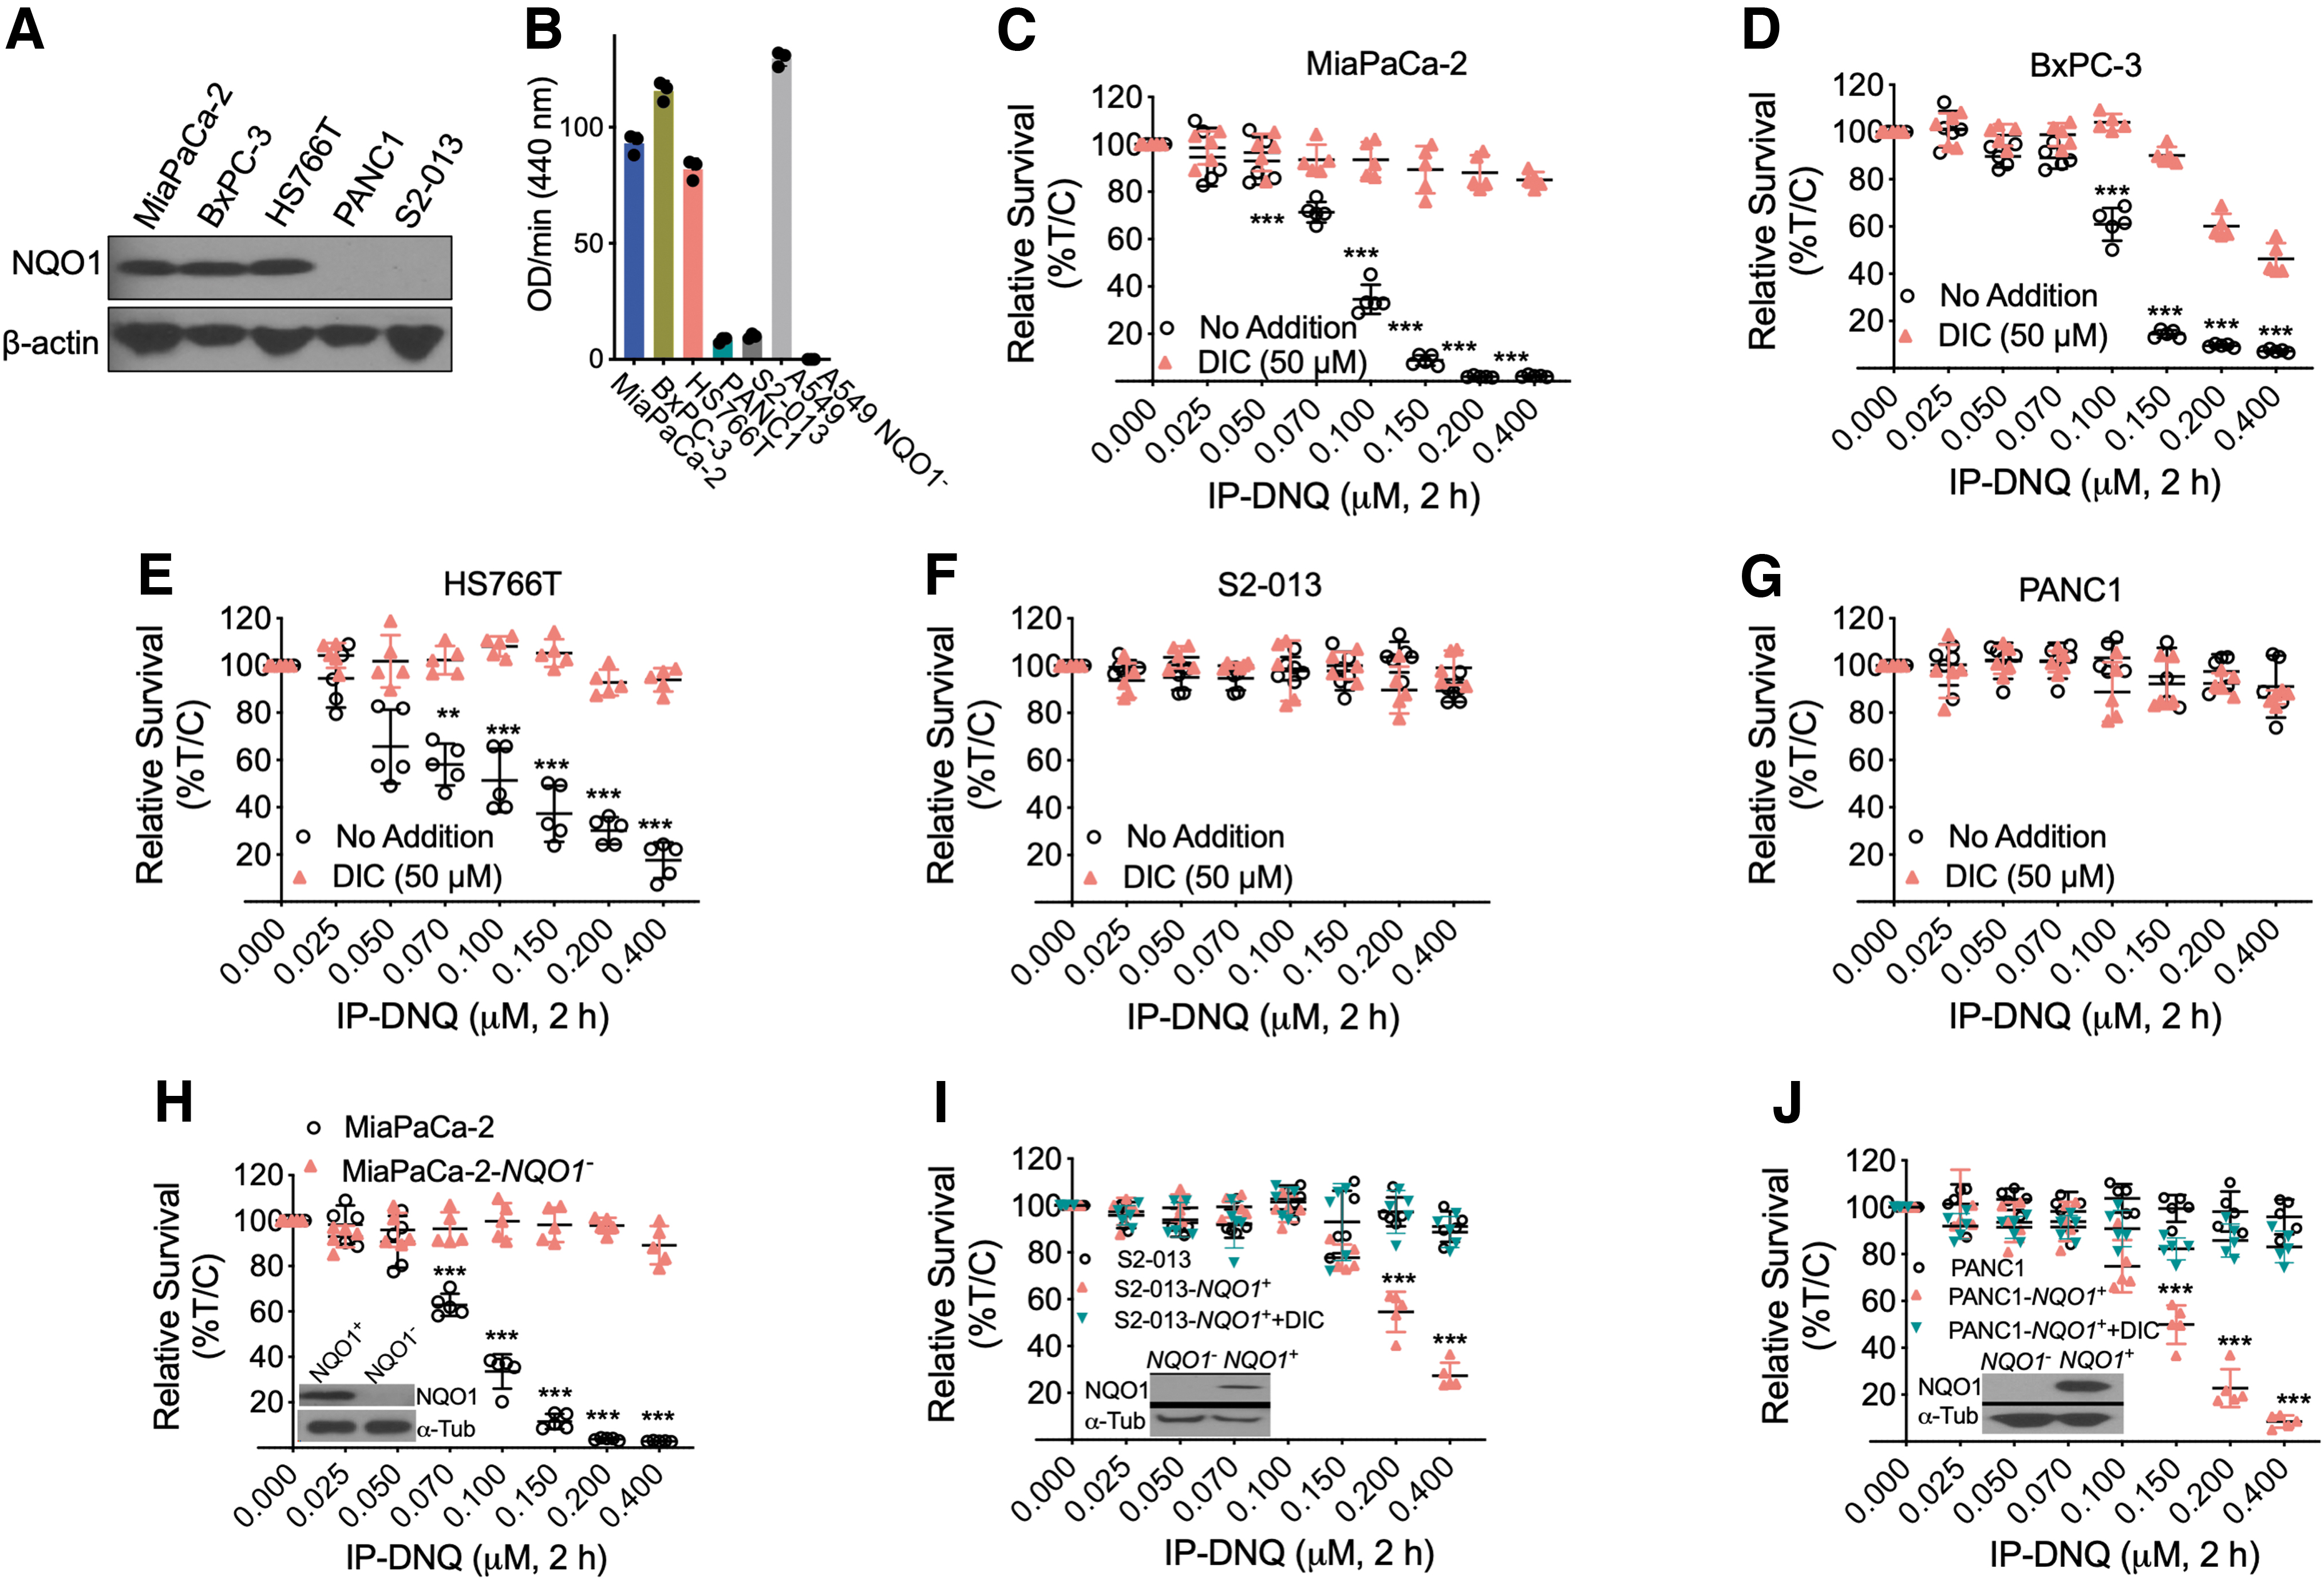
In addition, NQO1 enzyme activity was also found to be elevated in MiaPaCa-2, BxPC-3, and HS766T cells compared with PANC1 and S2-013 cells. In fact, these two low NQO1-expressing pancreatic cancer cell lines had NQO1 activity levels nearly as low as a cell line where the gene encoding NQO1 has been knocked out (see result for A549 [lung cancer] parental and NQO1 knockout cells in Fig. 1B).
Next, we explored the effect of IP-DNQ treatment on pancreatic cancer cell viability. As expected, NQO1-expressing MiaPaCa-2, BxPC-3, and HS766T cells were sensitive to IP-DNQ (IC50 values of 0.06–0.1 μM), and the addition of dicoumarol (DIC), an inhibitor of NQO1, spared IP-DNQ-induced lethality (Fig. 1C–E). NQO1-deficient PANC1 and S2-013 cells were insensitive to IP-DNQ with or without DIC (Fig. 1F, G). To further confirm that the lethality of IP-DNQ is NQO1-dependent, we utilized previously described CRISPR/Cas9-based stable NQO1 knockout MiaPaCa-2 cells, as well as S2-013 and PANC1 cells with the reconstituted NQO1 gene (Huang et al., 2016; Jiang et al., 2022; Siegel et al., 2012).
Consistent with the DIC results, we found that NQO1-KO MiaPaCa-2 cells were highly insensitive to IP-DNQ treatment (Fig. 1H). PANC1-NQO1 + and S2-013-NQO1+ cells were now rendered hypersensitive to IP-DNQ, and accordingly, the addition of DIC blocked this lethality (Fig. 1I, J). The observed significant sensitivity of NQO1-overexpressing MiaPaCa-2, BxPC-3, and HS766T cells to IP-DNQ treatment and the reversal of the observed cell sensitivity upon NQO1 inhibition through DIC treatment and CRISPR/Cas9-based stable NQO1 knockout MiaPaCa-2 cells demonstrate that IP-DNQ is an NQO1 bioactivatable drug that selectively kills NQO1-expressing pancreatic cancer cells.
IP-DNQ leads to NQO1-dependent ROS generation, PARP1 hyperactivation, and NAD+/ATP loss
After confirming the NQO1-dependent activity of IP-DNQ, we next evaluated whether this anticancer effect was exerted via NQO1-dependent futile redox cycling for ROS production, as previously reported in studies utilizing NQO1 substrates (Huang et al., 2012; Reinicke et al., 2005). To this end, we treated MiaPaCa-2 cells with either a sublethal (0.07 μM) or lethal (0.2 μM) dose of IP-DNQ and found that IP-DNQ induced a dose-dependent increase in hydrogen peroxide (H2O2) levels in MiaPaCa-2 cells following 2 h of treatment. Addition of DIC abolished this IP-DNQ-mediated induction of H2O2 levels (Fig. 2A). Similar results were found in IP-DNQ-treated BxPC-3 cells (Fig. 2B). Moreover, IP-DNQ-induced ROS generation was confirmed by 2,7-dichlorofluoroscin diacetate (DCFDA) staining in MiaPaCa-2 cells, and IP-DNQ-mediated ROS production was abolished upon DIC addition (Fig. 2C, D). These results indicate that IP-DNQ increases cell stress via ROS generation in an NQO1-dependent manner.
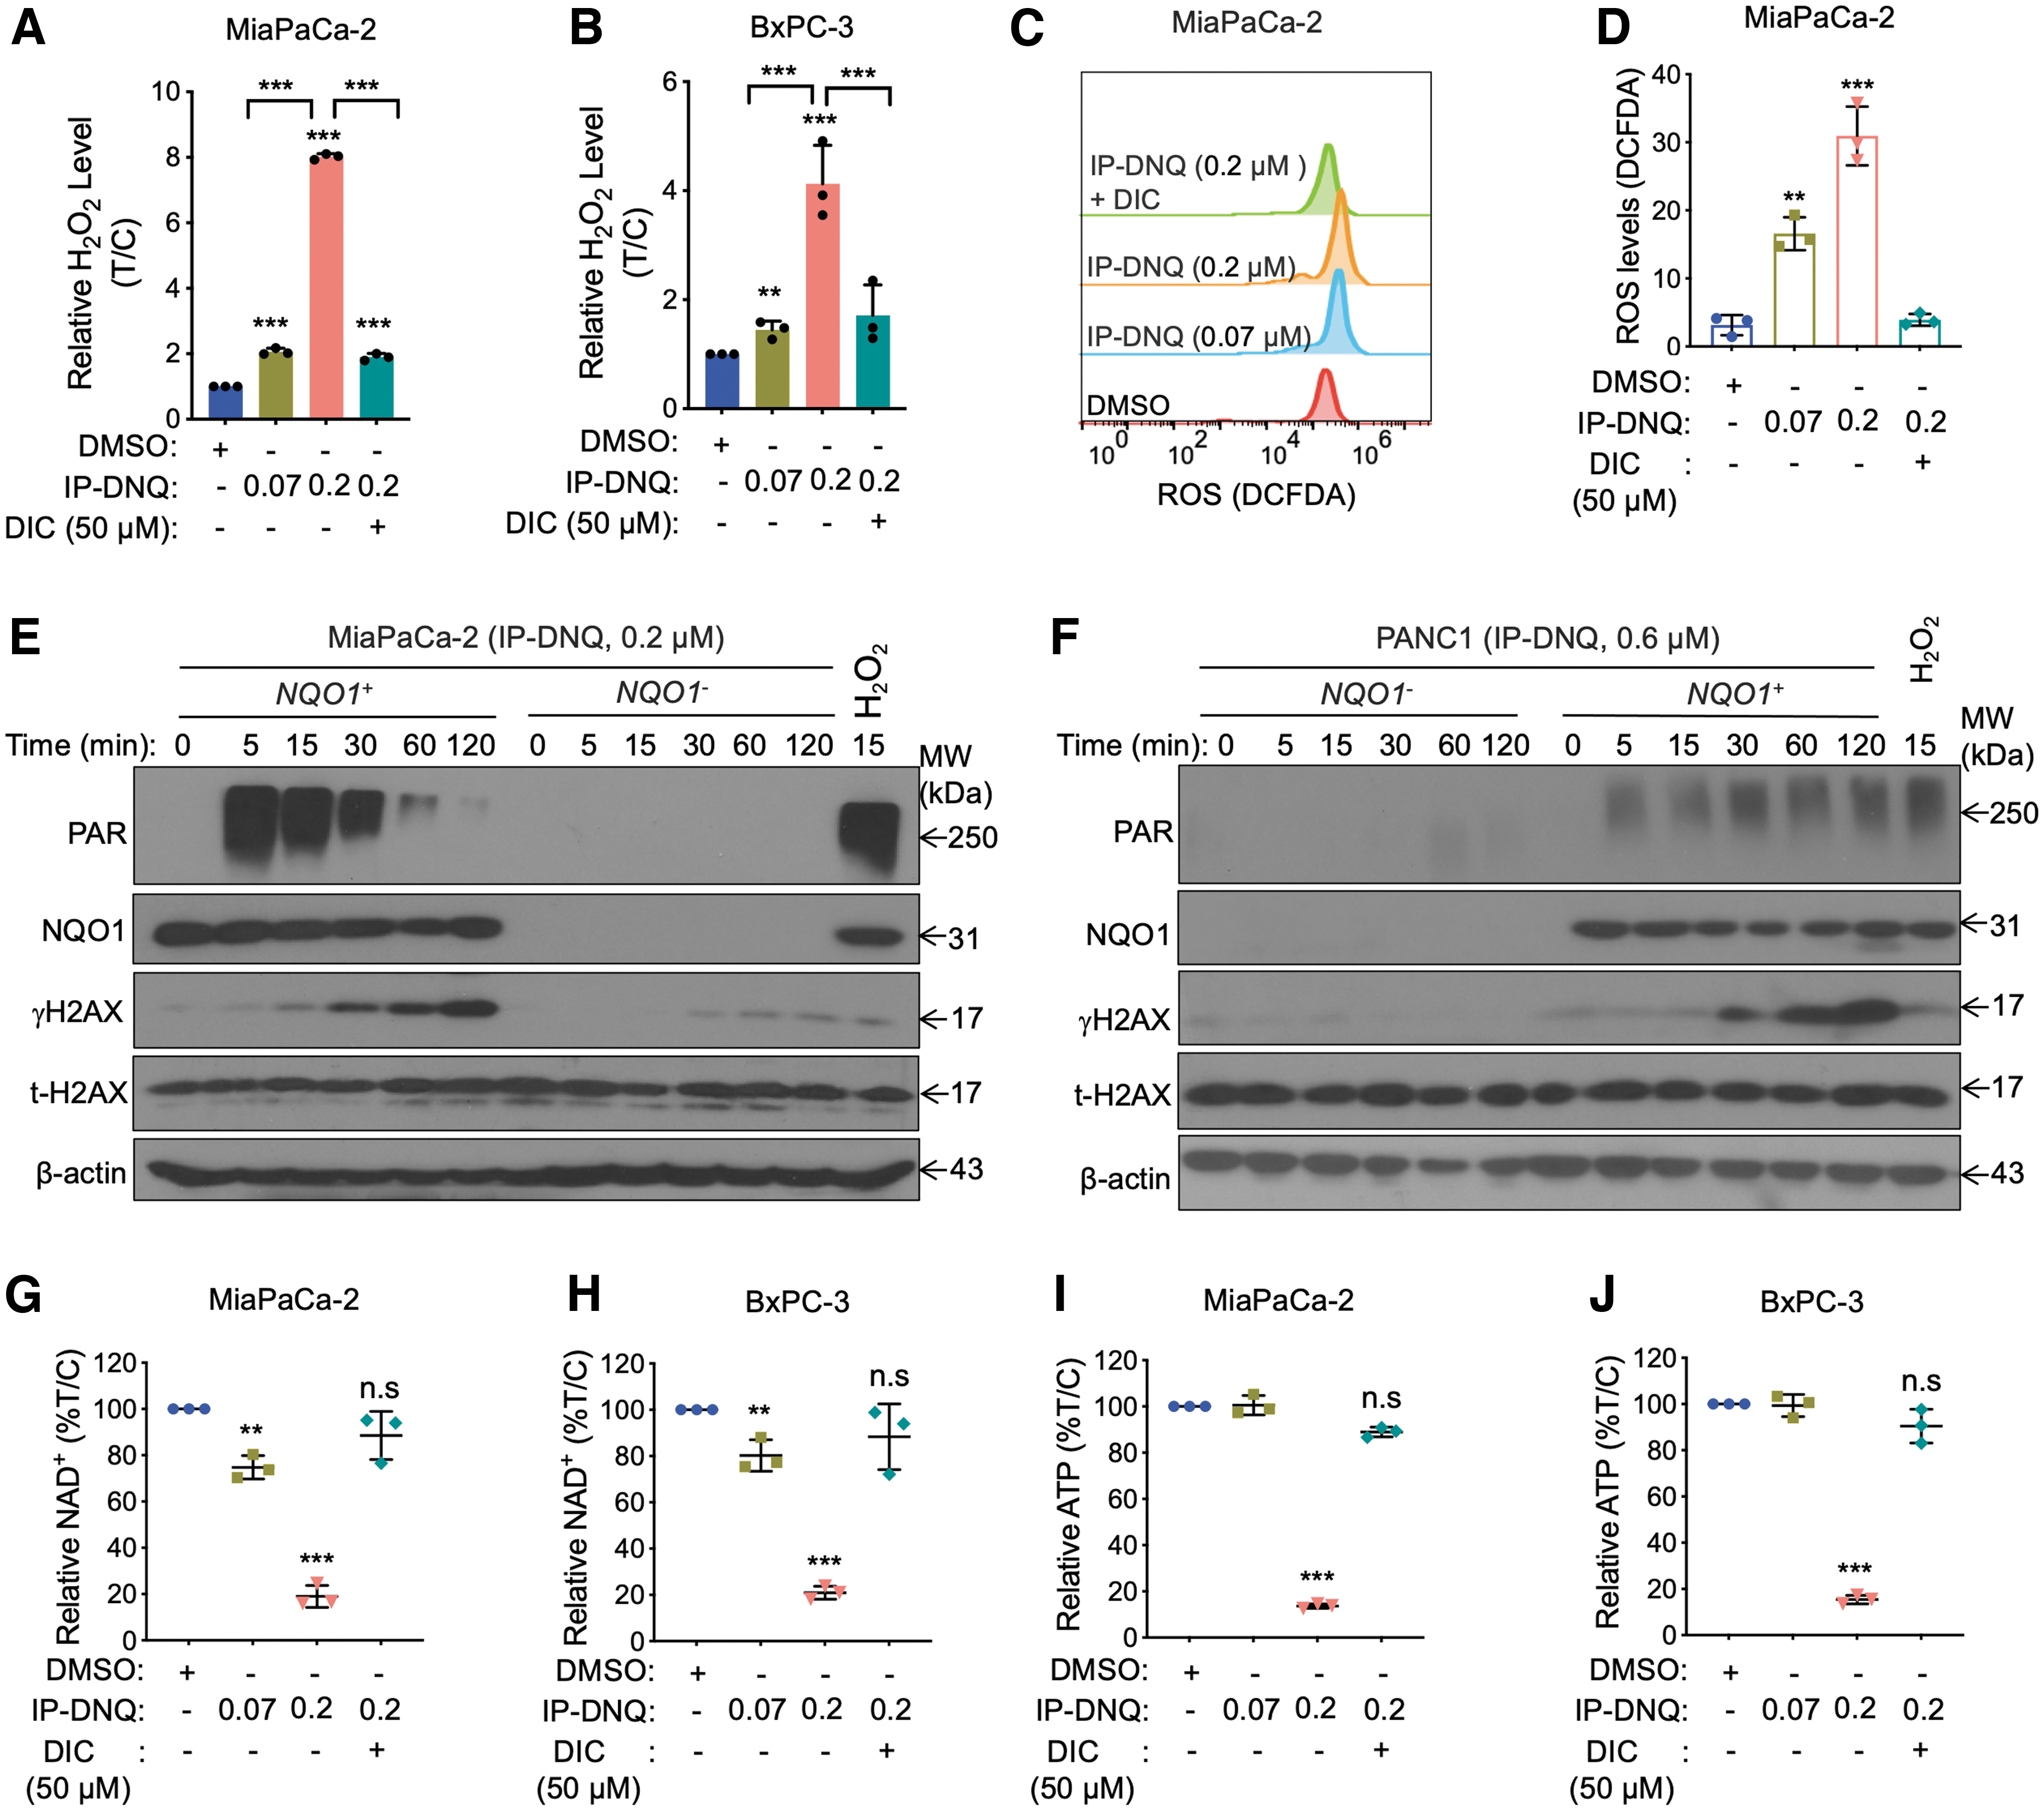
NQO1 bioactivatable drugs (such as β-lapachone and DNQ) induce DNA damage and the formation of poly(ADP-ribose) (PAR) (Huang et al., 2016; Huang et al., 2012). Therefore, we were interested in exploring whether IP-DNQ treatment can induce PARP1 activation and DNA damage. Western blot analysis demonstrated a peak of PAR formation at 5 min, at which point, levels of PAR then declined gradually, lasting ∼60 min in NQO1+ MiaPaCa-2 (Fig. 2E). At the same time, levels of γH2AX, a marker of DNA double-strand breaks (DSBs), accumulated over time in the NQO1-expressing cells (Fig. 2E). Neither NQO1 expression nor the total H2AX expressions were altered after IP-DNQ treatment in these cells. However, when NQO1 was knocked out, IP-DNQ-induced PAR formation and γH2AX accumulation were effectively suppressed (Fig. 2E).
We also investigated the effect of IP-DNQ on PANC-1 cells (which are NQO1 negative) and found that treatment of a high dose of IP-DNQ (0.6 μM) induced undetectable PAR and γH2AX levels in these cells, whereas it induced PAR formation and γH2AX accumulation when NQO1 expression was restored (Fig. 2F). Taken together, these results demonstrate that IP-DNQ causes PARP1 hyperactivation in an NQO1-dependent manner.
As PAR formation has been suggested to consume NAD+ and ATP (Luo and Kraus, 2012; Morales et al., 2014), we hypothesized that IP-DNQ might cause NAD+ and ATP losses. As expected, a 2-h treatment with a lethal dose of IP-DNQ (0.2 μM) in MiaPaCa-2 and BXPC-3 cells induced a dramatic decrease in NAD+ levels, while DIC effectively suppressed the loss (Fig. 2G, H). These NAD+ losses were accompanied by a dramatic decrease in ATP levels (Fig. 2I, J). The ATP loss following NAD+ depletion was prevented by DIC in both pancreatic cancer cells (Fig. 2I, J). Together, these results suggest that IP-DNQ disturbs essential cellular nucleotides.
IP-DNQ promotes NQO1-dependent DNA damage
ROS-induced cell stress has been found to cause DNA damage (Cadet and Wagner, 2013; Srinivas et al., 2019), and our results show that IP-DNQ induces γH2AX accumulation in NQO1+ pancreatic cancer cells (Fig. 2E, F). Therefore, we aimed to gain insights into the DNA damaging events triggered by IP-DNQ treatment. To achieve this, we utilized a confocal laser scanning microscopy imaging assay to assess DNA breaks and damage. We specifically examined the formation of γH2AX foci, which are known to be phosphorylated at Ser139 in response to DNA DSBs (Podhorecka et al., 2010). In addition, previous studies have indicated that the highest levels of γH2AX are observed within the first hour of treatment with high concentrations of H2O2 (Driessens et al., 2009; Ye et al., 2016). As a positive control, we treated cells with 500 μM H2O2 for 15 min.
In MiaPaCa-2 cells, which exhibit high endogenous NQO1 expression, treatment with a lethal dose of IP-DNQ (0.2 μM, 30 min or 2 h) resulted in a significant increase in γH2AX foci over time compared with the control group, However, when cotreated with DIC, the increase in γH2AX foci was effectively blocked (Fig. 3A, B). To directly assess the induction of DNA damage, we performed alkaline denaturing comet assays to measure changes in cell nuclear DNA migration due to base damage, single-strand breaks (SSBs), and DSBs in various treatment groups. Treatment of MiaPaCa-2 cells with either 0.07 or 0.2 μM of IP-DNQ for 2 h resulted in a significant increase in comet tail length, with values of 2.2 ± 1 and 62 ± 10 a.u., respectively, compared with the dimethyl sulfoxide (DMSO) control value of 0.001 ± 0.008 a.u. (Fig. 3C, D).
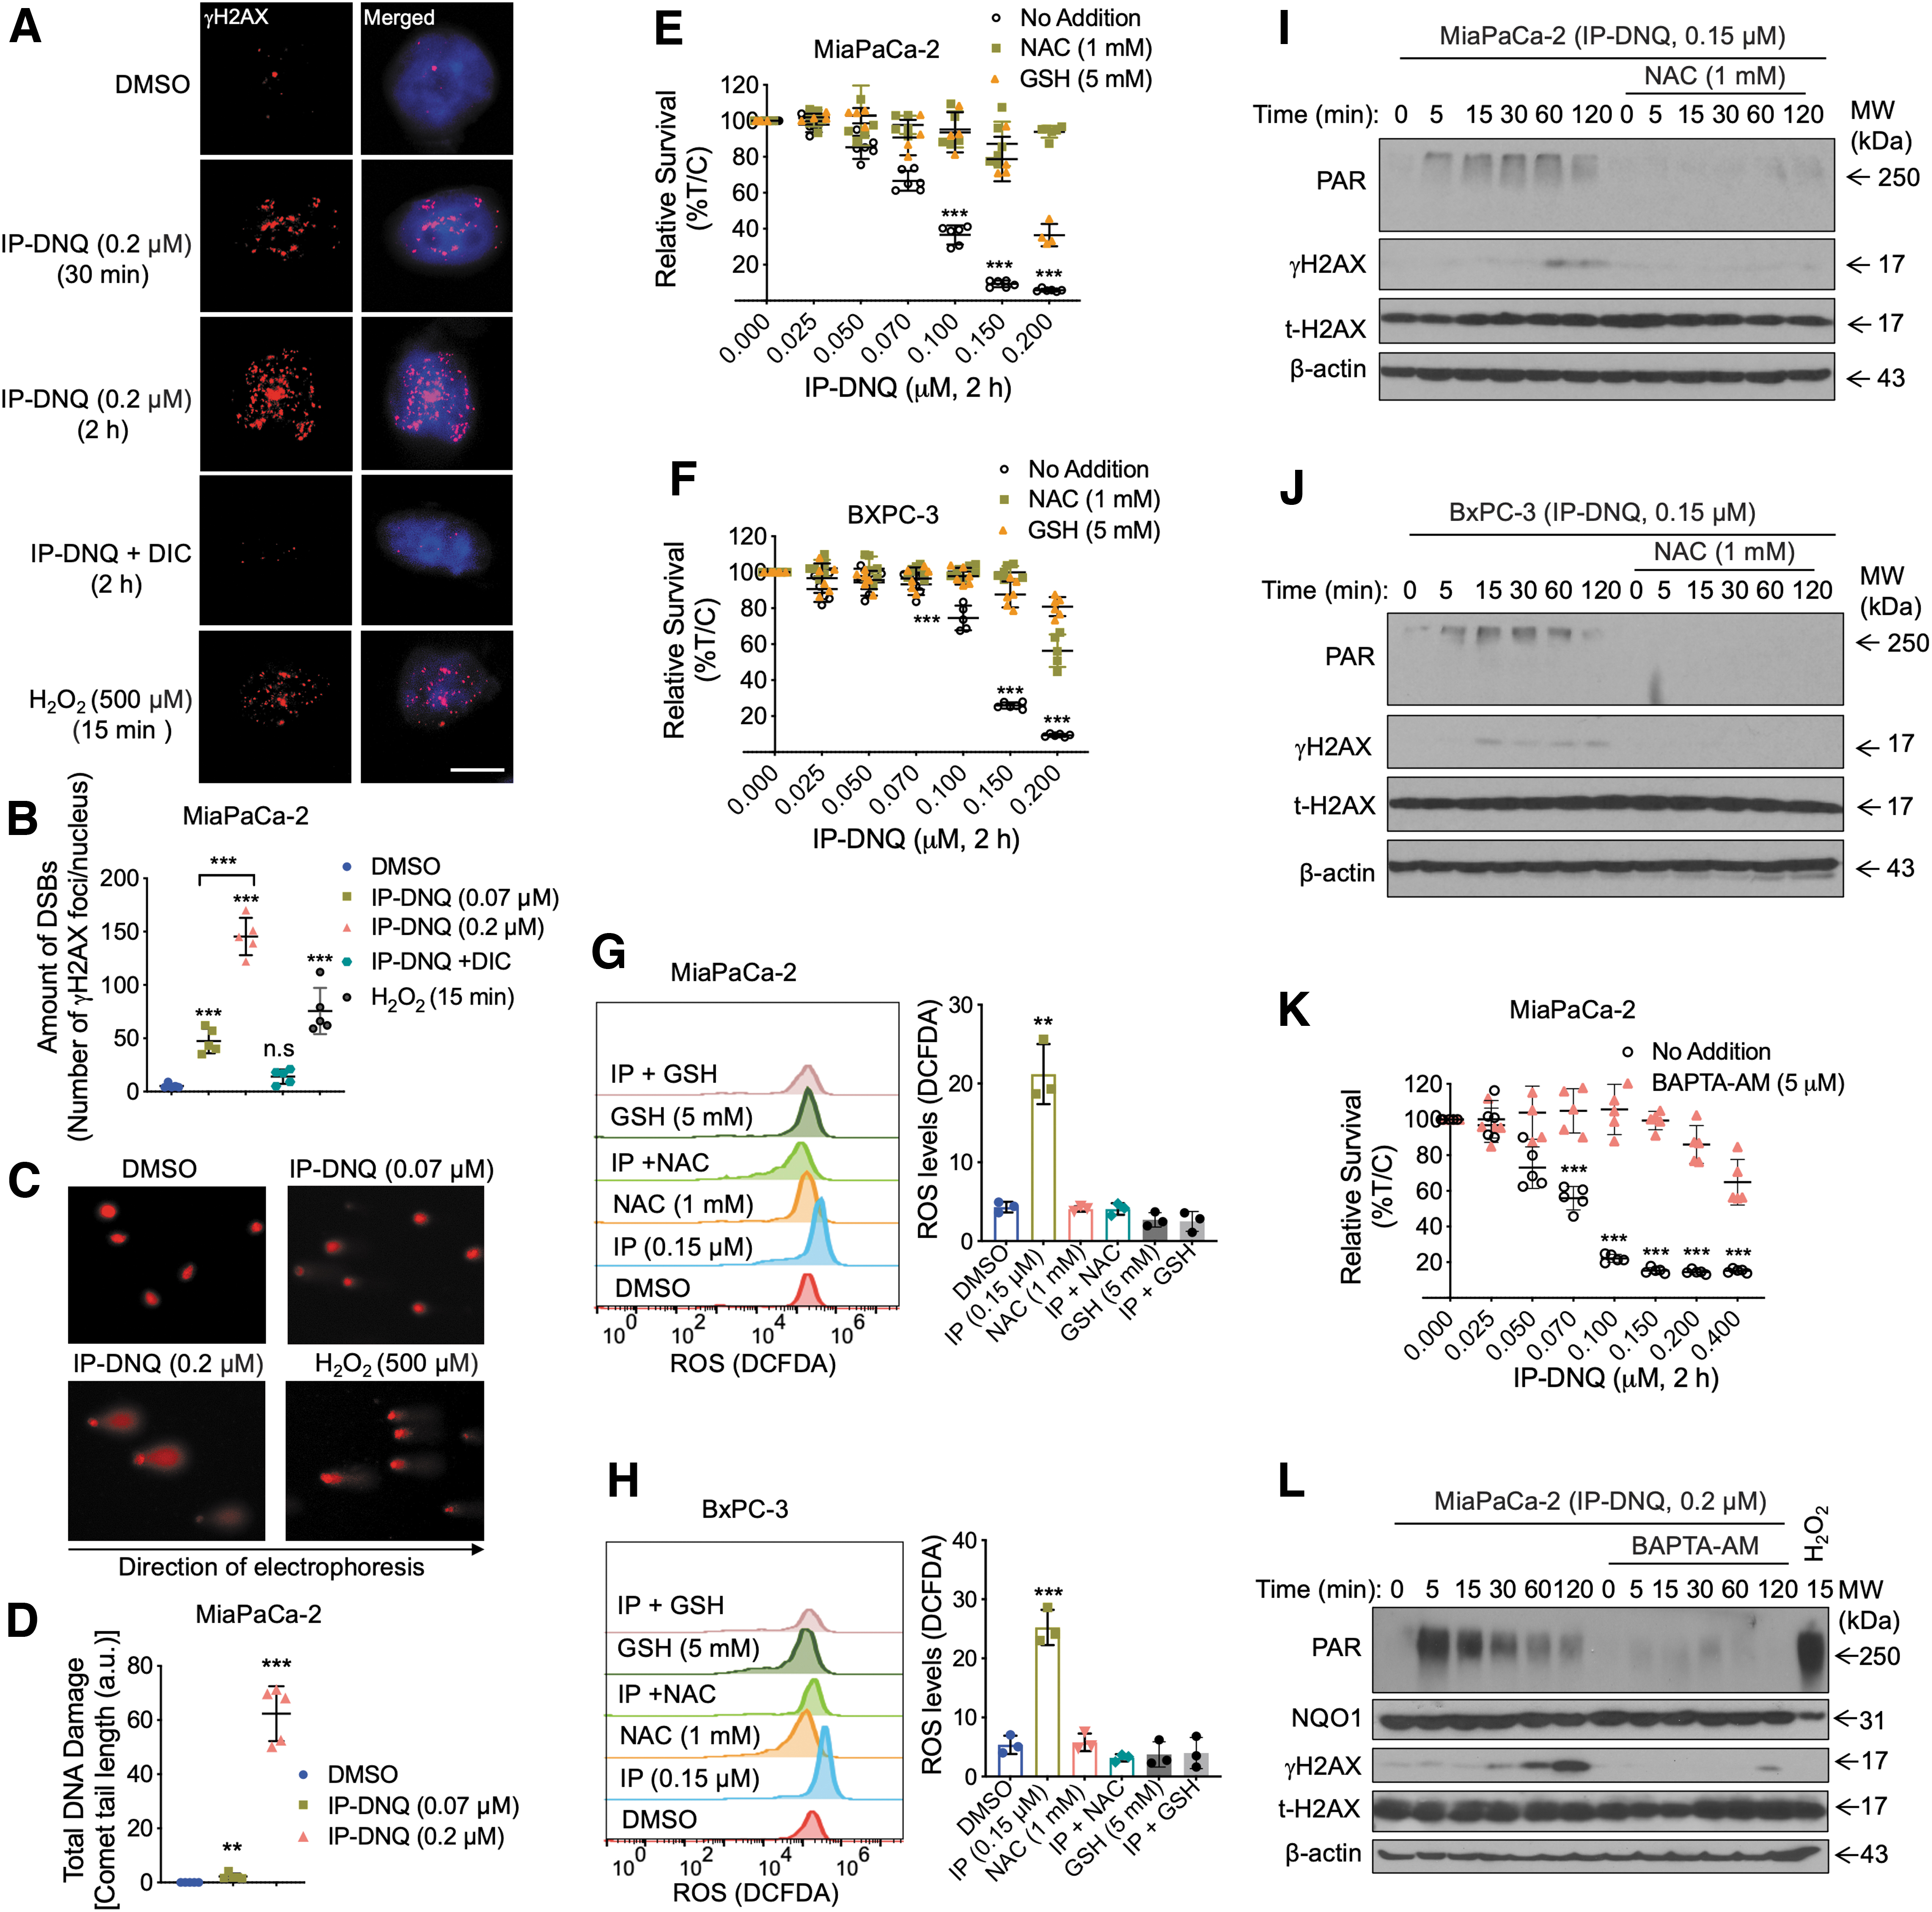
Taken together, these findings suggest that IP-DNQ treatment induces the formation of DNA DSBs, which contributes to the cytotoxicity of IP-DNQ in NQO1+ pancreatic cancer cells.
ROS and calcium are key modulators of IP-DNQ-induced lethality
To elucidate the potential pivotal role of IP-DNQ-induced ROS generation in the selective eradication of pancreatic cancer cells, we conducted a comprehensive assessment of IP-DNQ's impact on cell viability in the presence of ROS scavengers, specifically N-acetyl-L-cysteine (NAC) and glutathione (GSH). NAC, recognized as a thiol-containing synthetic antioxidant, boasts the capacity to scavenge ROS and also serves to replenish intracellular GSH levels, thereby fortifying cells against oxidative stress and enhancing cell viability (Atkuri et al., 2007; Rodriguez et al., 2019). Conversely, GSH, an endogenous tripeptide, functions in ROS scavenging and maintains cellular redox homeostasis (Aoyama and Nakaki, 2015; Lushchak, 2012). Under conditions of oxidative stress, reduced GSH undergoes oxidation to GSSG (oxidized glutathione) upon interaction with ROS.
To sustain intracellular redox equilibrium, GSSG is either extricated into the extracellular space or reacts with sulfhydryl groups of proteins, leading to a depletion of the available pool of GSH within the cell, consequently impairing the cell's defensive mechanisms against oxidative stress (Bansal and Simon, 2018; Lushchak, 2012). Interestingly, our results showed that IP-DNQ treatment induced a reduction in intracellular GSH levels in MiaPaCa-2 cells (Supplementary Fig. S2A), indicating oxidative stress. This also suggests the potential for GSH to act as a scavenger to reverse IP-DNQ-induced oxidative stress. Application of varying concentrations of NAC (1–10 mM) or GSH (1–5 mM) alone did not affect the cell viability of MiaPaCa-2 cells (Supplementary Fig. S2B).
However, coadministration of IP-DNQ with either NAC (1 mM) or GSH (5 mM) effectively attenuated the cytotoxicity induced by IP-DNQ in both MiaPaCa-2 and BXPC-3 cell lines (Fig. 3E, F). Notably, at excessively lethal concentrations of IP-DNQ (0.4 μM), neither NAC nor GSH mitigated the lethality (Supplementary Fig. S2C–F). Furthermore, flow cytometry analysis provided compelling evidence that the elevated ROS levels induced by IP-DNQ were effectively suppressed by NAC (1 mM) or GSH (5 mM) addition in both MiaPaCa-2 and BXPC-3 cells (Fig. 3G, H). These findings suggest that elevated ROS levels induced by IP-DNQ exposure modulate cell viability. Furthermore, Western blot analysis revealed that adding NAC (1 mM) significantly attenuated IP-DNQ-induced PAR formation and γH2AX expression in both MiaPaCa-2 and BXPC-3 cells (Fig. 3I, J). This suggests that IP-DNQ-induced ROS may underlie PARP1 hyperactivation and increased γH2AX expression, indicative of ROS-induced DNA damage. These results collectively highlight the significant role of ROS in IP-DNQ-induced cellular damage and subsequent cell death.
As other studies demonstrate that PARP1 hyperactivation requires endoplasmic reticulum calcium (Ca2+) release in NQO1 bioactivatable drug-induced cell lethality (Bentle et al., 2006; Bey et al., 2007), we next examined the role of Ca2+ in IP-DNQ-induced effects in pancreatic cancer cells. After 2 h of treatment, a Ca2+ chelator, BAPTA-AM (5 μM), efficiently prevented the killing effect of IP-DNQ in MiaPaCa-2 cells (Fig. 3K). We further validated the role of Ca2+ in the IP-DNQ-induced effects by utilizing a membrane impermeable extracellular Ca2+ chelator, BAPTA (sc-202076A). Similar to the results obtained with BAPTA-AM, treatment with BAPTA (2.5 mM) effectively restored the growth of MiaPaCa-2 cells under IP-DNQ treatment, and BAPTA did not completely prevent the lethal effects of IP-DNQ at higher doses (Supplementary Fig. S2G, H).
Furthermore, Western blot analysis demonstrated that BAPTA-AM significantly suppressed IP-DNQ-induced PARP1 hyperactivation (PAR formation) and γH2AX accumulation in these cells (Fig. 3L). Altogether, these data suggest that high levels of intracellular ROS and intracellular Ca2+ concentration play critical roles in the lethality induced by IP-DNQ in pancreatic cancer cells.
IP-DNQ disrupts mitochondrial function to repress ROS degradation
Mitochondrial function has been implicated in maintaining energy homeostasis in both physiological and pathological states (Eisner et al., 2018; Spinelli and Haigis, 2018). Based on our earlier findings that IP-DNQ causes rapid ATP loss (Fig. 2I, J), we hypothesized that IP-DNQ may cause mitochondrial dysfunction. To test this, we monitored mitochondrial health using a JC-1 staining assay. As expected, the population of JC-1 aggregates (P1), which indicate healthy and intact mitochondria, significantly decreased following IP-DNQ treatment (0.2 μM, 2, 6, or 26 h) in MiaPaCa-2 cells, and JC-1 monomers emitting green fluorescence (P2), representing low mitochondrial membrane potential, dramatically increased compared with control cells (Fig. 4A, B). This suggests that IP-DNQ indeed disrupts mitochondrial function.
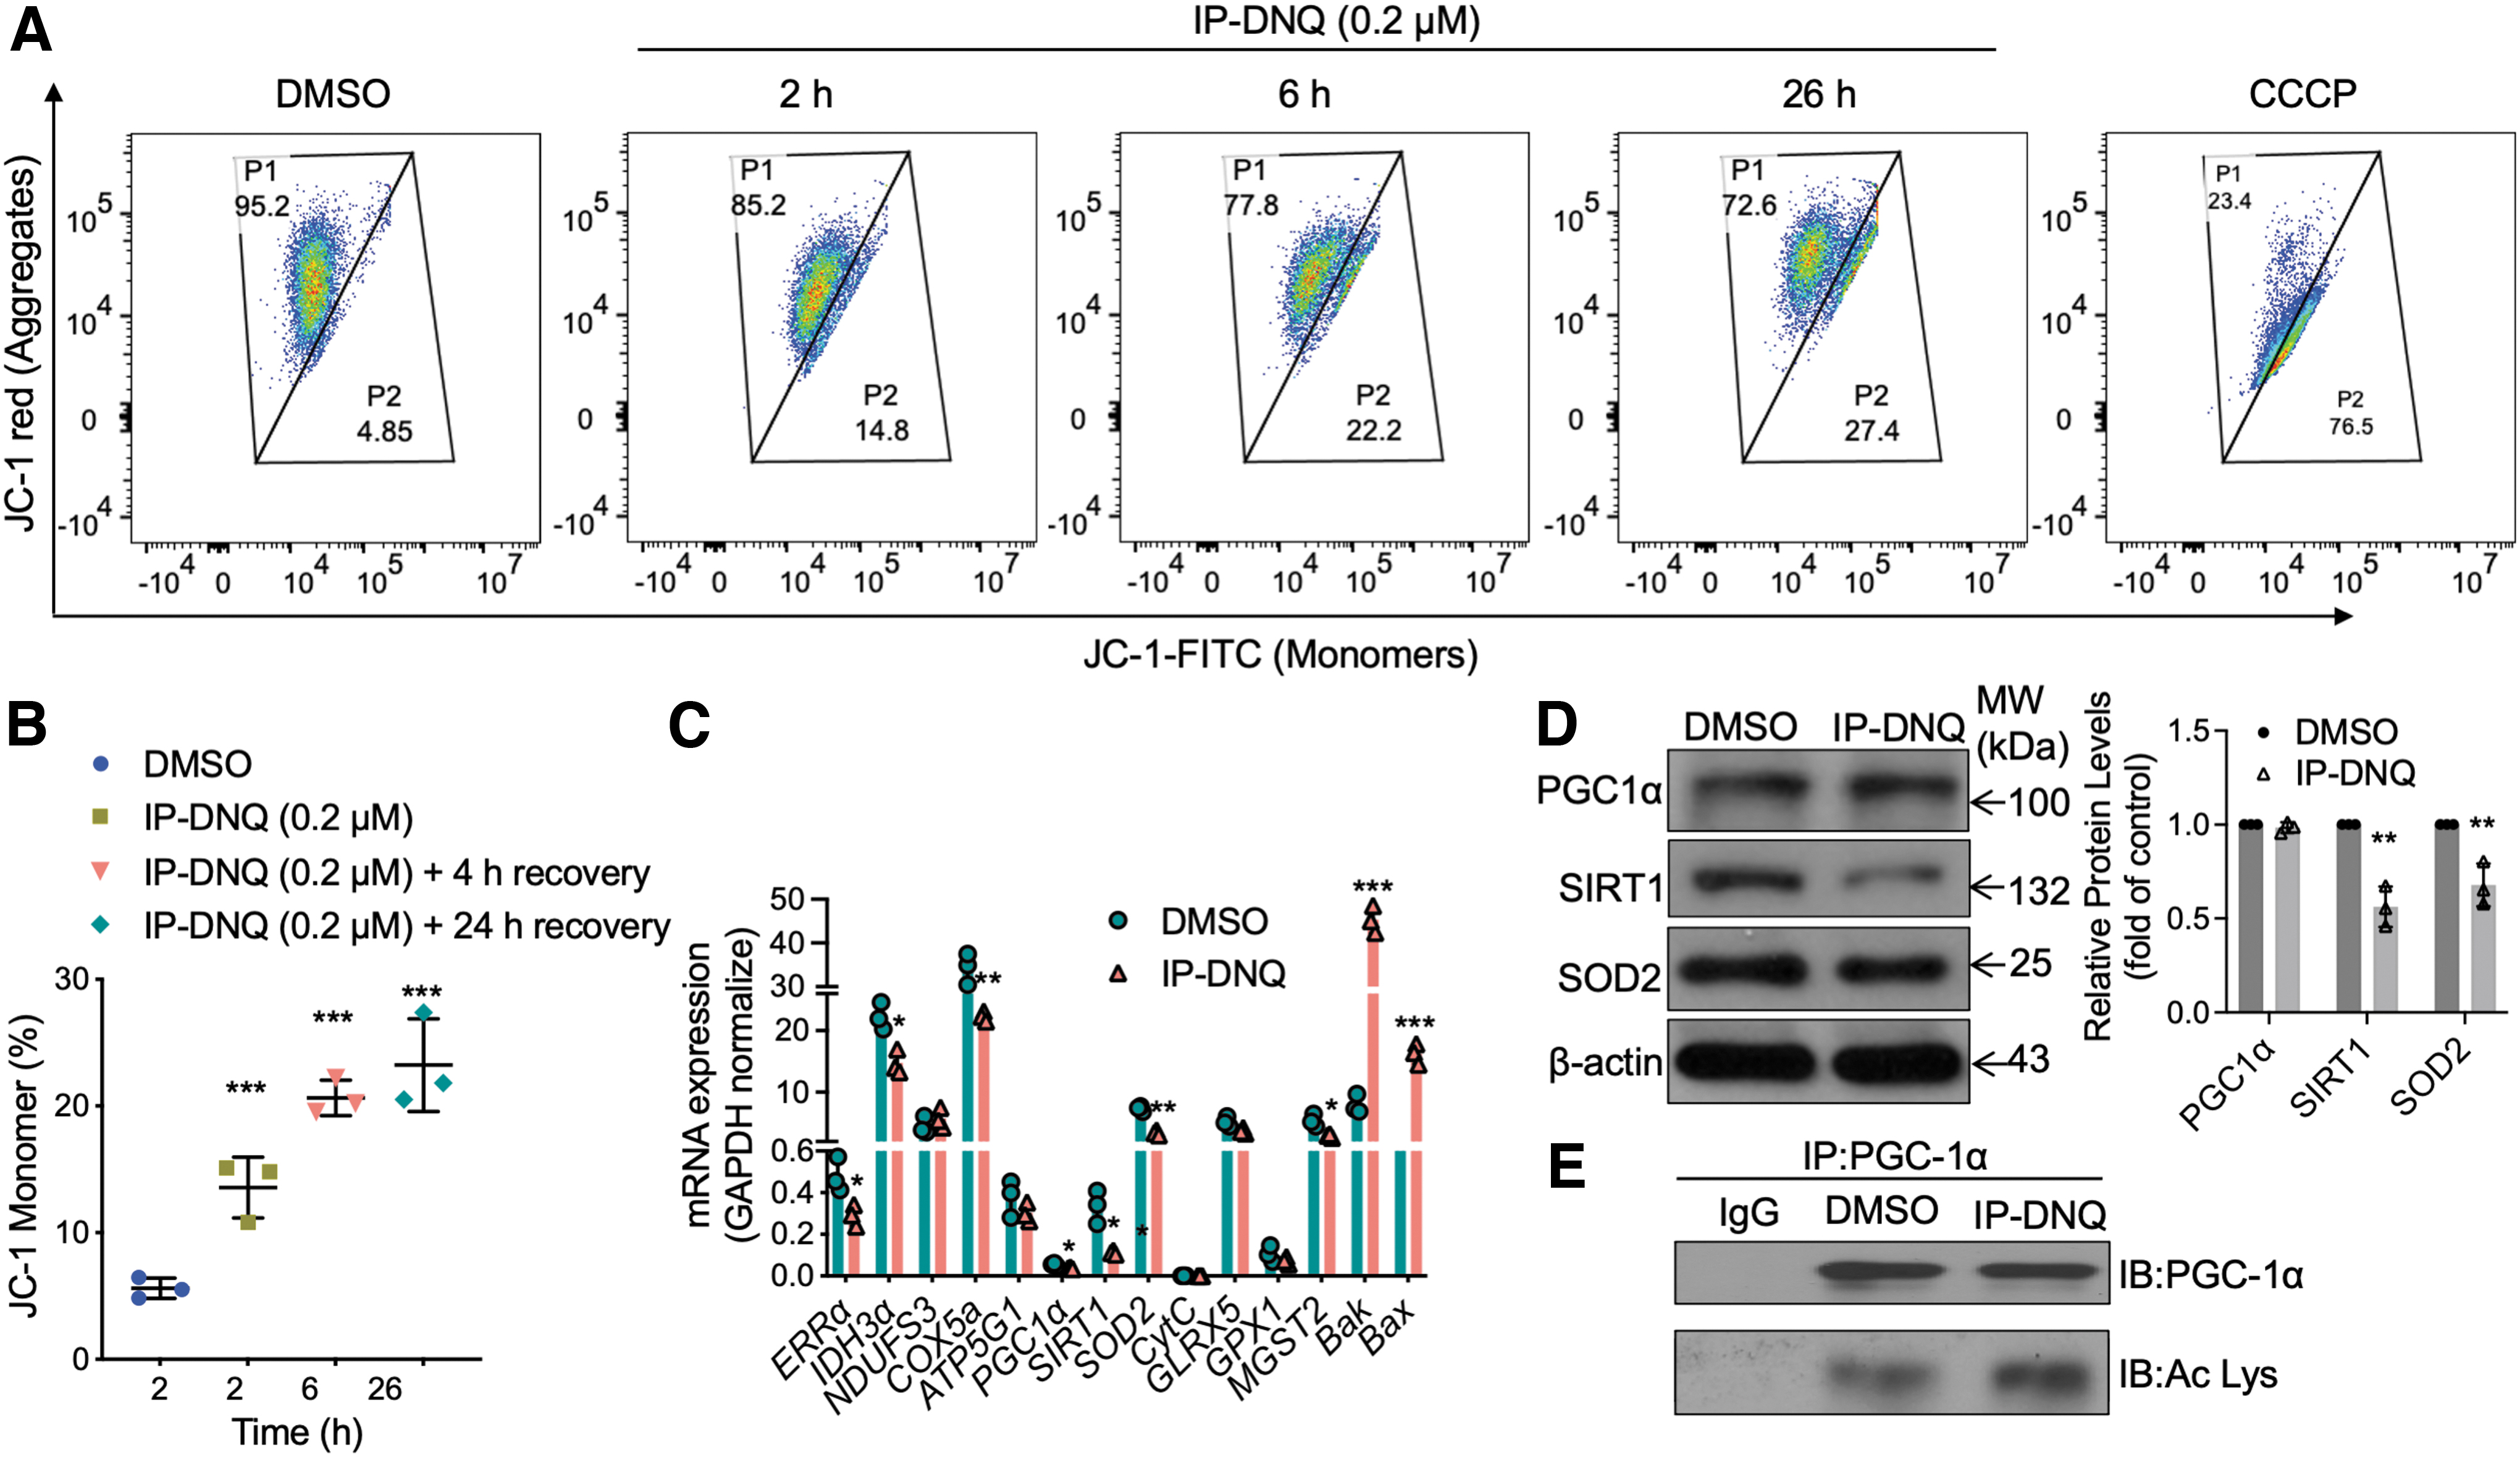
To further support this, we analyzed messenger RNA (mRNA) levels of several key genes involved in mitochondrial function. We found that the mRNA levels of genes involved in the mitochondrial respiratory chain (e.g., NDUFs3, ATP5g1, and GLRX5) were not obviously affected by a lethal dose of IP-DNQ (0.2 μM, 2 h), while the mRNA levels of genes involved in mitochondrial biogenesis or ROS generation (e.g., ERRa, COX5A, PGC1α, SIRT1, and SOD2) were significantly decreased, and mRNA levels of genes related to mitochondrial apoptosis (e.g., Bax and Bak) were obviously increased (Fig. 4C). We noticed that Cyt c levels were not affected, which might be due to investigating the expression in whole cells.
Western blot analysis further confirmed that the protein levels of SIRT1 and SOD2 were decreased by a lethal dose of IP-DNQ (0.2 μM, 2 h), whereas PGC1α levels were not significantly affected (Fig. 4D). Because PGC1α is a transcription coactivator that plays a central role in the regulation of cellular energy and stimulates mitochondrial biogenesis (Liang and Ward, 2006), and is regulated by SIRT1 via deacetylation, we next examined the activity of PGC1α. As expected, in immunoprecipitation assays using the PGC1α antibody, acetyl lysine PGC1α was increased in MiaPaCa-2 cells treated with a lethal dose of IP-DNQ (0.2 μM) compared with DMSO-treated control cells (Fig. 4E), indicating that IP-DNQ-induced SIRT1 regulates PGC1α. Together, these results indicate that IP-DNQ dysregulates mitochondrial function via decreasing the expression of genes involved in mitochondrial biogenesis and may repress ROS degradation through the SIRT1/PGC1α/SOD2 pathway.
IP-DNQ treatment promotes a G2/M phase cell cycle arrest leading to NQO1-dependent apoptosis and programmed necrosis
Based on our findings that IP-DNQ exerts potent anticancer effects and regulates mitochondrial dysfunction in NQO1 + pancreatic cancer cells, we hypothesized that IP-DNQ might affect cell cycle progress to induce cell death. To this end, the percentages of cells in the G1, S, and G2/M phases of the cell cycle were measured by propidium iodide (PI) staining and analyzed by flow cytometry. As shown, treatment with IP-DNQ (0.2 μM, 6 or 26 h) dramatically increased the frequency of arrested cells at G2/M phase (22.8% and 17.4% at 6 h to 57.5% and 42.6% at 26 h) and simultaneously decreased the cell population in G1 and S phases compared with control treatment (Fig. 5A, B), indicating a G2/M arrest.

To investigate the mechanism of IP-DNQ-induced cell cycle arrest, we analyzed the levels of genes involved in the G2/M phase. Western blot results showed that IP-DNQ treatment increased the expression of cyclin A2, cyclin-dependent kinase 2 (Cdk2), phosphorylated cell division cycle 2 (pCdc2 [Tyr15], indicating inactivation), and phosphorylated checkpoint kinase 2 (pChk2 [Thr68]), while it decreased the expression of cell division cycle 25c (Cdc25c) and cyclin B1 (Fig. 5C, D). Cyclin A2/Cdk2 plays a critical role during the S phase and G2/M transition, with its activity peaking at G2/M (Pagano et al., 1993). Cdc2, also known as Cdk1 (cyclin-dependent kinase 1), is a member of the Cdk family of serine/threonine kinases, cyclin B1/Cdc2 is required for cells to enter mitosis (Ferrell, 2013), while Chk2 is activated upon DNA damage and regulates cell division, and its activity is associated with G1/S and G2/M arrests (Dalton, 1992; Zannini et al., 2014). In addition, Cdc25c participates in the regulation of G2/M progress and mediates DNA damage repair (Liu et al., 2020).
The increased levels of cyclin A2/Cdk2, low levels of cyclin B1, and high levels of tyrosine-phosphorylated Cdc2 indicate that cells were in G2 phase. These changes in cell cycle markers in both cell lines were accompanied with the elevation of γH2AX (Fig. 5C, D). Together, these results indicate that IP-DNQ induces DNA damage and cells are arrested in G2/M phase and try to repair these damages.
Loss of mitochondrial membrane potential has been suggested to regulate apoptosis induction (Ly et al., 2003; Wang and Youle, 2009), and our results show that IP-DNQ induces the loss of mitochondrial membrane potential and decreases the gene expression of mitochondrial apoptosis (Fig. 4). Thus, we hypothesized that IP-DNQ could induce cell apoptosis in NQO1+ pancreatic cancer cells. Unlike β-lapachone and DNQ antitumor agents that induce programmed necrosis, IP-DNQ (0.2 μM) treatment significantly increased the early apoptosis (Q3) and total cell death populations (Q1+Q2+Q3) compared with the control group in MiaPaCa-2 and BxPC-3 cells confirmed by flow cytometry analysis (Fig. 5E, F). However, knockout of NQO1 in MiaPaCa-2 cells completely blocked IP-DNQ-induced cell death (Fig. 5E, bottom).
Proteolysis of PARP1 at 89 kDa and the formation of cleaved caspase-3/7 are key markers of cell apoptosis (Germain et al., 1999; Salvesen and Dixit, 1997). As shown, 0.2 μM IP-DNQ treatment caused clear 89 kDa PARP1 cleavage and caspase-3/7 activation in MiaPaCa-2 cells (Fig. 5G, lane 2). Addition of DIC or pan-caspase inhibitor, z-VAD-fmk, efficiently blocked the IP-DNQ-induced PARP1 and caspase-3/7 proteolysis (Fig. 5G, lanes 3 and 4). Cells treated with staurosporine (STS), as an apoptotic positive control, confirmed the appearance of 89 kDa PARP1 cleavage and caspase-3/7-mediated proteolysis (Fig. 5G, lane 6). STS-induced cleavage was blocked by z-VAD-fmk (Fig. 5G, lane 7). Overall, these results may suggest that IP-DNQ-induced cell death has some partial apoptotic behavior. However, we further observed that IP-DNQ treatment led to 40 kDa p53 atypical proteolysis (Fig. 5G, lane 2), a potential indicator for programmed necrosis (Huang et al., 2016; Tagliarino et al., 2003), and z-VAD-fmk did not block this cleavage in MiaPaCa-2 cells (Fig. 5G, lane 4), indicating programmed necrosis is likely involved in IP-DNQ-mediated cell death.
To further confirm whether programmed necrosis and apoptosis mechanisms both contribute to the cell death, we investigated cell viability after z-VAD-fmk blocking using flow cytometry. Under the microscope, we observed that a lethal dose of IP-DNQ (0.2 μM) led to dramatic cell death, whereas z-VAD-fmk partially blocked IP-DNQ-induced cell death in MiaPaCa-2 cells (Supplementary Fig. S3A), and flow cytometry analysis confirmed partial blocking of cell death by z-VAD-fmk (Supplementary Fig. S3B). Taken together, these data indicate that IP-DNQ treatment induces dramatic ROS formation and DNA damage, leading to PAR formation and necrotic cell death. The G2/M cell cycle arrest and partial apoptosis observed in pancreatic cancer cells are likely a secondary consequence of ROS formation.
MTD study and measurement of methemoglobinemia in vivo
To develop IP-DNQ into a clinically applicable form, we started performing a series of preclinical animal studies. First, we determined the lethal dose or MTD of IP-DNQ, DNQ, and β-lapachone in no tumor-bearing NSG mice. The detailed group design is shown in the Materials and Methods section. For the high dose of IP-DNQ (20 mg/kg), one mouse was found dead on day 5, and two mice were found dead on day 7. For the high dose of DNQ (7.5 mg/kg), one mouse was found dead on day 2, two mice were found dead on day 4, and two had >20% of body weight loss on day 5. For the high dose of β-lapachone (30 mg/kg), two mice were found dead on day 4, and two were found dead on day 6.
Within 2 weeks of observation, no mice died or had more than 20% of their body weight losses for the low and middle doses of IP-DNQ at 10 or 15 mg/kg, DNQ at 2.5 or 5 mg/kg, and β-lapachone at 20 or 25 mg/kg. These results suggest that the MTDs of IP-DNQ, DNQ, and β-lapachone are 15, 5, and 25 mg/kg, respectively, and the MTD of IP-DNQ is threefold of the parent DNQ (Fig. 6A). We also compared the symptoms after five injections of the MTDs of IP-DNQ, DNQ, and β-lapachone. Compared with DNQ and β-lapachone, IP-DNQ treatment caused the least side effects in mice by comparing tachypnea and jump, the time of hunched down and stand up again, hypoactivity days, body weight loss, and ruffled fur (Fig. 6A).
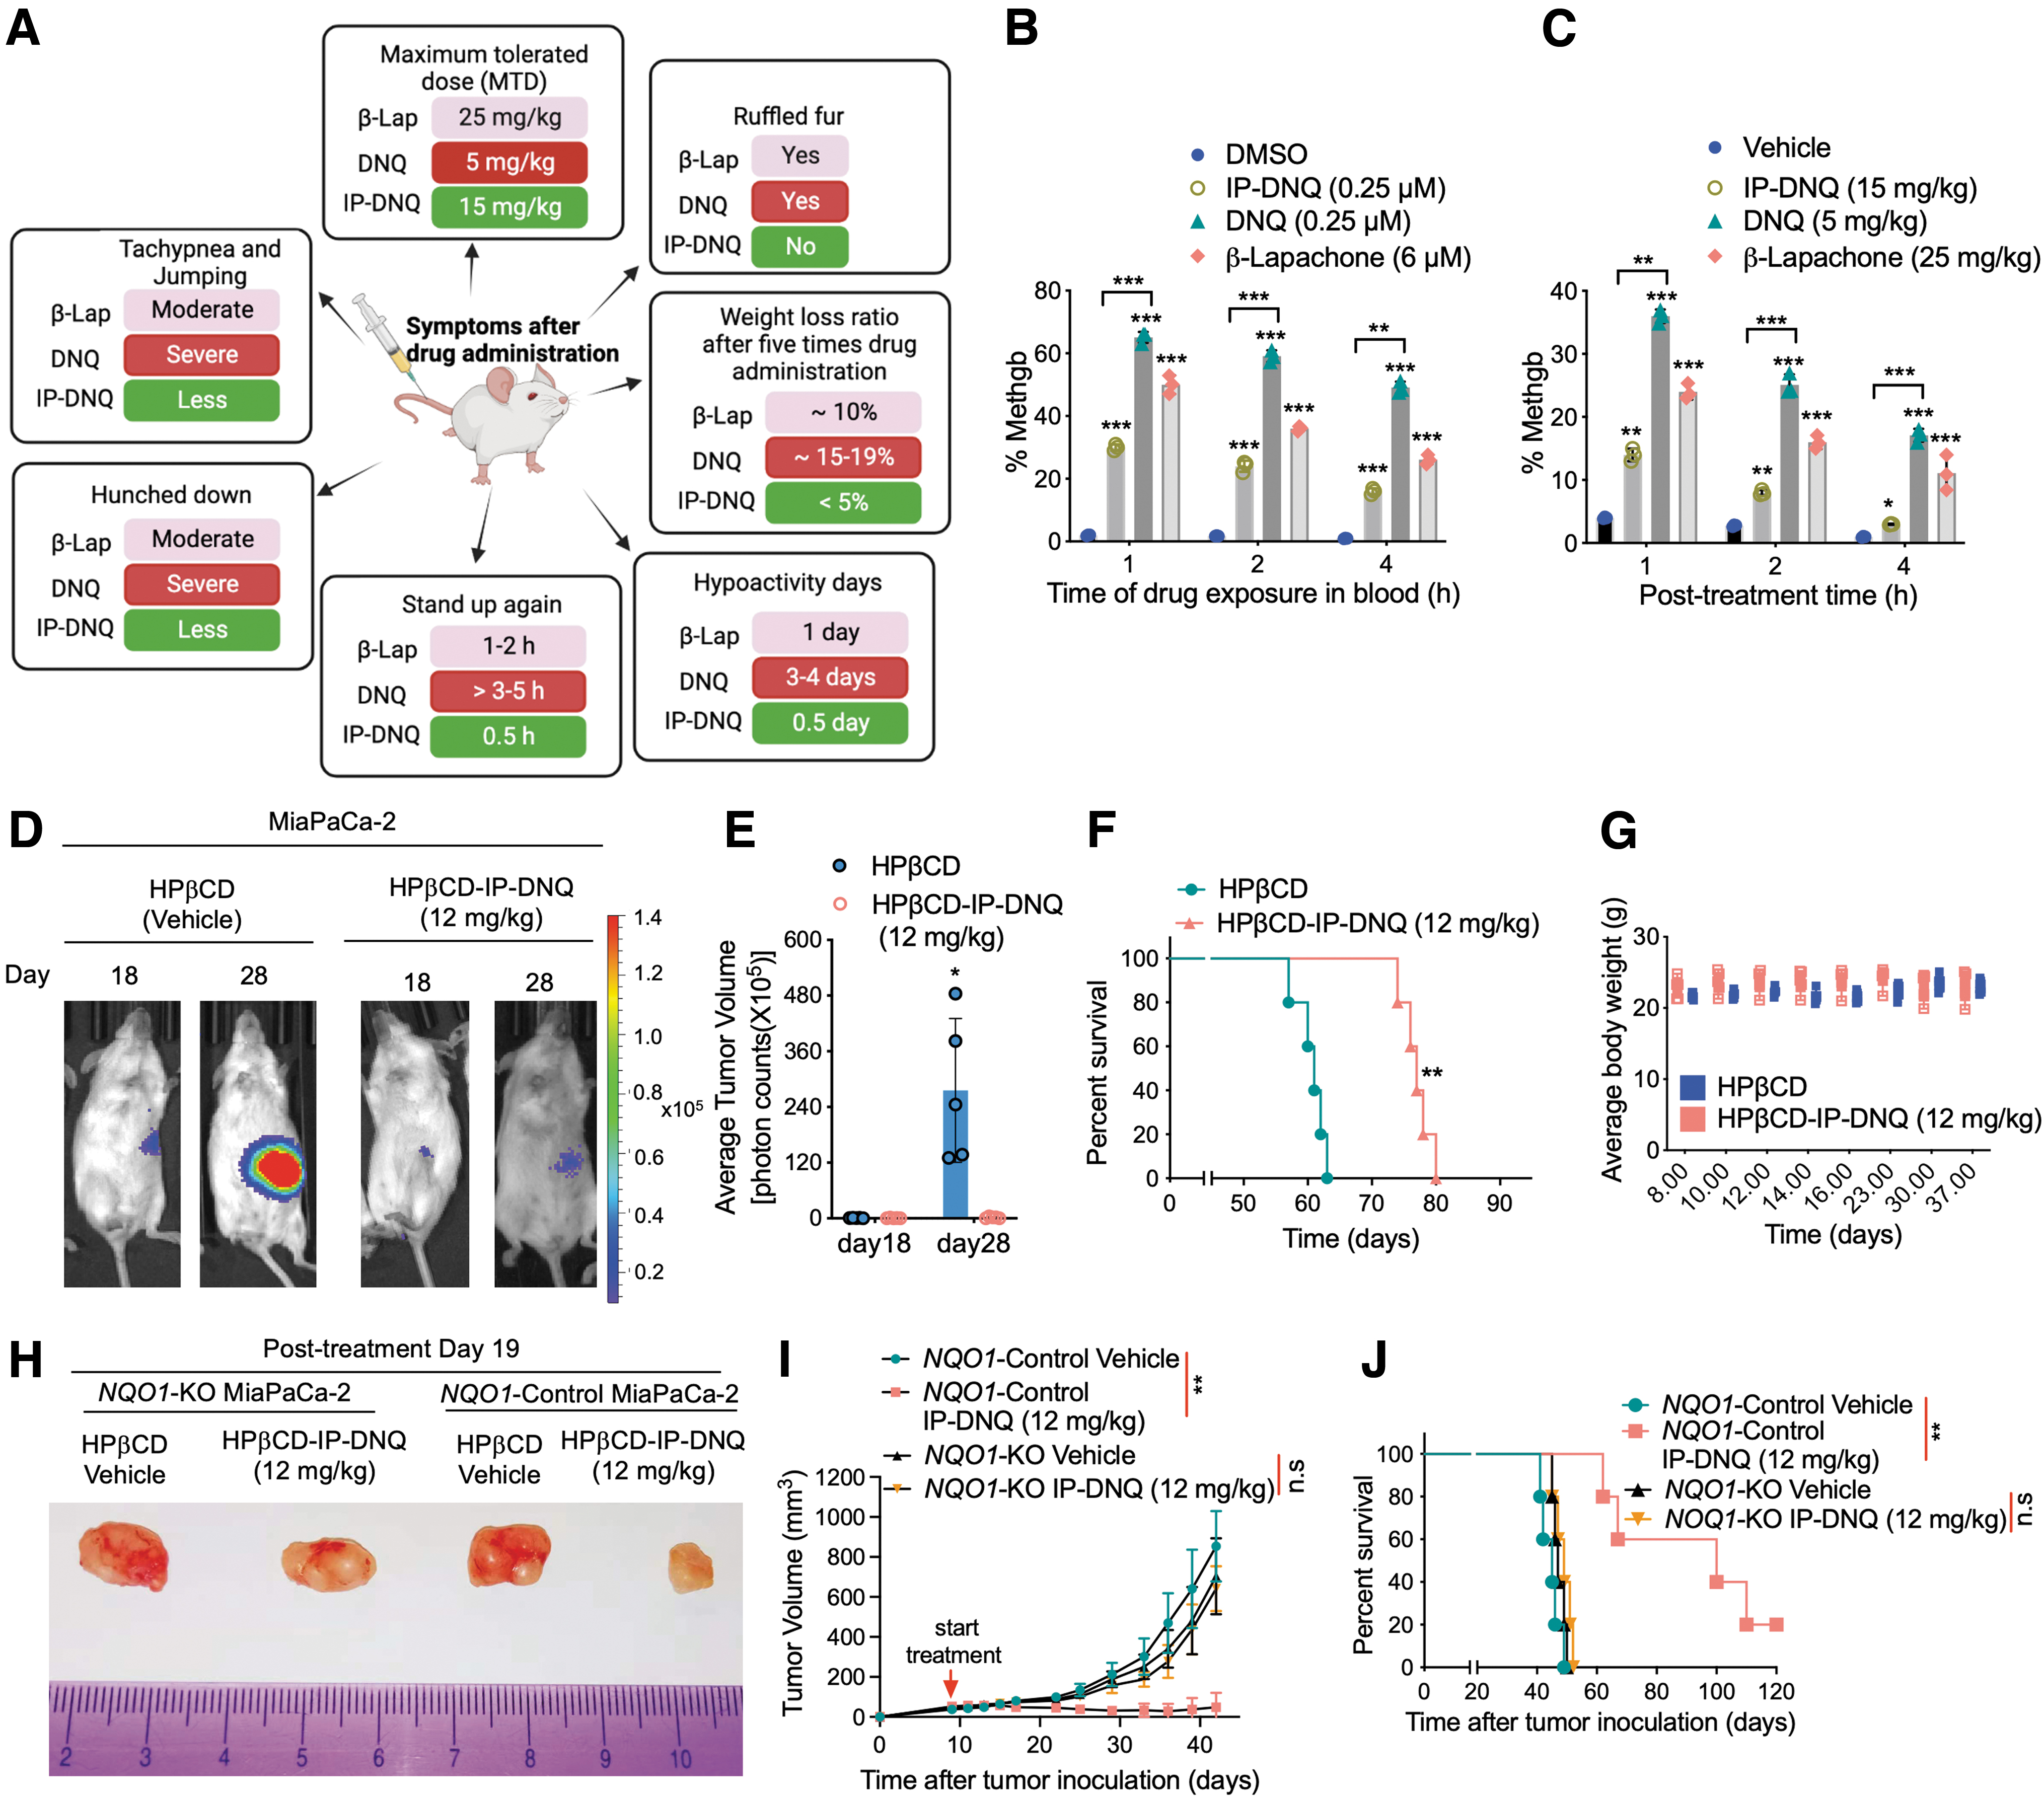
Based on our previous studies, β-lapachone and DNQ treatments induce methemoglobinemia (methgb) (Huang et al., 2016; Huang et al., 2012; Ma et al., 2015a; Ma et al., 2015b; Ma et al., 2014), which is a form of hemoglobin that has been oxidized, causing its heme iron configuration to change from ferrous (Fe2+) to ferric (Fe3+), and cannot bind to oxygen, leading to the inability to deliver oxygen to tissues (Cortazzo and Lichtman, 2014). To test whether IP-DNQ induces methgb in vitro in red blood cells (RBCs), RBCs were incubated with 0.25 μM (lethal dose) of IP-DNQ or DNQ, 6 μM (lethal dose) of β-lapachone or DMSO (control) for 1, 2, and 4 h at 37°C. Blood samples were then examined for methgb. As expected, RBCs treated in vitro with these three drugs showed rapid and robust methgb production that declined gradually over time (1–4 h) (Fig. 6B). However, RBCs incubated in vitro with a lethal dose of IP-DNQ showed much less methgb production compared with incubation with DNQ or β-lapachone (Fig. 6B).
We further examined the induction of methgb in vivo. Interestingly, post-treatment of IP-DNQ (15 mg/kg, MTD) for 1 h caused an extremely low incidence of methgb (∼13%) compared with the treatment with the MTD of DNQ (∼36%) or β-lapachone (∼24%), which returned to baseline (∼3%, equivalent to vehicle treatment) after 4 h of post-treatment (Fig. 6C). Together, our findings suggest that IP-DNQ treatment causes mild toxicity and methemoglobinemia, and shows threefold improvement in the MTD compared with the parent drug DNQ.
Antitumor efficacy of IP-DNQ against orthotopic pancreatic cancer MiaPaCa-2 xenograft
Our data clearly show that IP-DNQ kills pancreatic cancer cells in an NQO1-dependent manner in a variety of cell culture experiments. Next, we aimed to validate these findings in vivo. We established an orthotopic pancreatic MiaPaCa-2 xenograft by injecting NSG mice with MiaPaCa-2 (luciferase-positive) cells (∼1 × 10⁶ cells per mouse) into the pancreas. After 7 days post-tumor cell inoculation, mice were then randomly divided into two groups (n = 5/group). Mice were treated every other day for a total of five injections with HPβCD alone (intravenously, i.v.) or HPβCD-IP-DNQ (12 mg/kg, i.v.) and then monitored for changes in tumor volumes (Fig. 6D, E), overall survival (Fig. 6F), and mice body weight loss (Fig. 6G).
Bioluminescence imaging (BLI) showed rapid tumor growth in the vehicle-treated group (HPβCD) at days 18 and 28. In contrast, treatment with HPβCD-IP-DNQ resulted in obvious tumor suppression compared with control tumor growth rates (Fig. 6D, E). Overall survival from Kaplan–Meier survival curves showed that HPβCD-IP-DNQ (12 mg/kg) treatment exhibited longer overall survival than the vehicle (Fig. 6F, p < 0.01). No significant mouse body weight loss (monitored 30 days from the first treatment) was observed (Fig. 6G). In addition, to confirm whether the antitumor activity of IP-DNQ is NQO1-dependent in vivo, we established subcutaneous mouse models using NQO1 +/− MiaPaCa-2 cells. As shown in Figure 6H–J and Supplementary Figure S4, HPβCD-IP-DNQ prevented tumor growth and prolonged the life span of mice bearing NQO1 + MiaPaCa-2 tumors, with one mouse being cured, whereas no inhibitory effect was observed in mice bearing NQO1 − MiaPaCa-2 tumors. Taken together, these results suggest that IP-DNQ is a potent anticancer agent that efficiently kills NQO1-positive pancreatic cancer cells.
Discussion
Exploring efficient anticancer drugs with fewer side effects on healthy tissue is crucially important for pancreatic cancer treatment. NQO1 is overexpressed in many solid tumors, including pancreatic cancer, with low expression in healthy tissue, making it an emerging target for personalized antitumor therapy (Awadallah et al., 2008; Huang et al., 2016; Lewis et al., 2017; Lundberg et al., 2021). Previous studies have revealed that NQO1 bioactivatable drugs, such as β-lapachone and DNQ, are promising agents for killing NQO1-expressing cancer cells. However, multiple factors have limited their clinical application. In this study, we aimed to investigate a novel NQO1 bioactivatable drug to overcome the hurdles of β-lapachone and DNQ and efficiently kill NQO1-expressing pancreatic cancer.
In this study, we show that IP-DNQ, a novel NQO1 bioactivatable drug, induces ROS production in NQO1-expressing pancreatic cancer cells, resulting in DNA damage, G2/M cell cycle arrest, and mitochondrial dysfunction, and causing both apoptotic and necrotic programmed cell death (Supplementary Innovation image).
As an NQO1 bioactivatable drug, we hypothesize that IP-DNQ could kill cancer cells via PAR-PARP1 formation, also known as PARP1 hyperactivation, and DNA DSBs. We observed that IP-DNQ indeed promoted PARP1 hyperactivation, accompanied by the accumulation of γH2AX, a hallmark of DNA damage. It is noteworthy that PARP1 hyperactivation is reliant on the availability of NAD+ and ATP (Andrabi et al., 2008; Murata et al., 2019). In this context, our investigations further unveiled a depletion of both NAD+ and ATP in IP-DNQ-induced cell death. The dynamic equilibrium of ROS generation and elimination plays a pivotal role in cellular homeostasis. Although chemotherapy initially demonstrates potent anticancer effects, the development of chemoresistance over prolonged exposure to anticancer drugs is a recognized challenge.
A contributing factor to this phenomenon is the cancer cells' ability to modulate ROS levels, thereby acquiring cytoprotection through antioxidant proteins such as catalase, Prxs, and SODs (Kim et al., 2019a; Kim et al., 2019b). In pancreatic cancer, low catalase levels are observed in NQO1 + patient tumors, while high levels are observed in associated normal tissues that have low NQO1 expression (Awadallah et al., 2008; Huang et al., 2016; Lewis et al., 2017). This unique attribute suggests that pancreatic cancer may represent an ideal therapeutic target for NQO1 bioactivatable drugs. Consistent with the action of compounds such as β-lapachone or DNQ, a lethal dose of IP-DNQ significantly elevated ROS generation in NQO1 + pancreatic cancer cells, while NQO1 − cells remained unaffected.
Crucially, within the cellular milieu, the presence of GSH, a natural antioxidant, serves as a critical defense mechanism against intracellular ROS by scavenging them, particularly in the form of H2O2, and under conditions of severe oxidative stress, GSH becomes oxidized to protect against cell death (Dunning et al., 2013; Lushchak, 2012). Interestingly, our findings indicate that restoration of GSH levels or addition of NAC, a precursor for GSH synthesis, effectively attenuated IP-DNQ-induced oxidative stress. This intervention not only prevented PARP1 hyperactivation but also reduced γH2AX accumulation, ultimately mitigating the lethality of IP-DNQ toward pancreatic cancer cells. At the same time, Ca2+ release also plays a crucial role in the IP-DNQ-induced PARP1 hyperactivation and cell death, as Ca2+ chelators blocked the effects. Molecular insights into how IP-DNQ exerts its anticancer effect can help future efforts to combine other therapeutic interventions to enhance or synergize with IP-DNQ treatment (Lee et al., 2017), and to help select patients whose tumors are likely to be most sensitive to this therapeutic drug.
Mitochondrial dysfunction caused by IP-DNQ leads to metabolic catastrophe and cell death. Mitochondrial membrane potential is a key indicator of mitochondrial activity and is required for ATP production, and loss or decrease of mitochondrial membrane potential leads to ATP depletion (Griffiths, 2000; Simbula et al., 1997). ATP depletion is suggested to induce the mitochondrial permeability transition (MPT) under the conditions of excessive uptake of Ca2+ by mitochondria (Simbula et al., 1997), resulting in the collapse of mitochondrial membrane potential and cell death (Griffiths, 2000). However, increased cellular Ca2+ together with depletion of ATP is also reported to substantially kill cells, suggesting that cellular Ca2+ induces MPT (Simbula et al., 1997). In our study, IP-DNQ induced loss of mitochondrial membrane potential and elevated intracellular Ca2+.
Thus, we propose that IP-DNQ could induce mitochondrial dysfunction via Ca2+ releasing-induced MPT leading to the loss of mitochondrial membrane potential and prevention of ATP resynthesis. With the investigation of genes involved in mitochondrial function, we found that IP-DNQ downregulated SIRT1 and accelerated acetylation of PGC1α to affect mitochondrial biogenesis. In addition, we also found IP-DNQ suppressed SOD2 expression, which would help keep high ROS levels in cells that in turn regulate mitochondrial dysfunction.
Multiple cell death pathways may coexist in IP-DNQ-induced pancreatic cell death. Apoptosis and programmed necrosis appear to be distinct forms of cell death, but studies suggest that these two cell death pathways may occur simultaneously or mutually transform cells by using common pathways (Chen et al., 2018). In our study, IP-DNQ dramatically reduced ATP levels, and acute metabolic disruption of ATP levels induces necrotic cell death; we thus propose that IP-DNQ, such as β-lapachone and DNQ, could induce cell necrosis. Indeed, we observed p53 atypical proteolysis at 40 kDa, which is suggested to be an indicator for programmed necrosis (Huang et al., 2016; Tagliarino et al., 2003).
At the same time, we found that the expression of genes involved in mitochondrial apoptosis was induced, some apoptotic death could be detected via flow cytometry analysis, and caspase-mediated PARP1 proteolysis, cleaved caspase-7 and -3 were observed in the later stages of dead cells. Furthermore, our measurement of ATP levels in the cells after treatment showed a recovery of ATP, which would support the notion that apoptotic cell death is a regulated process involving a number of ATP-dependent steps (Zamaraeva et al., 2005).
IP-DNQ exhibits more anticancer activity with less side effects both in vitro and in vivo, indicating a strong translational potential. NQO1 bioactivatable drugs have been known to induce methemoglobinemia, which is a major toxicity concern (Cortazzo and Lichtman, 2014; Huang et al., 2012; Ma et al., 2015a; Ma et al., 2015b; Ma et al., 2014). In our study, we found that a minimally lethal dose of IP-DNQ (0.2 μM) with a minimum exposure time (2 h) was sufficient to kill ∼100% NQO1+ pancreatic cancer cells in vitro, while not affecting the NQO1− cells. This dose is well below the reported levels achieved by IP-DNQ in vitro (Lundberg et al., 2021). The mild methemoglobinemia induced by IP-DNQ could be due to the introduction of the isopentyl group in DNQ's precursor. This modification results in less oxidization of hemoglobin, which can still bind to oxygen and deliver it to the tissues.
Our in vivo investigation confirmed the efficacy of IP-DNQ in repressing pancreatic tumor growth, which significantly extended the survival time of NQO1-expressing MiaPaCa-2 bearing mice at lower doses compared with β-lapachone (30 mg/kg) (Huang et al., 2016). Furthermore, compared with β-lapachone and DNQ, IP-DNQ-treated mice exhibited fewer signs of methemoglobinemia, such as no ruffled fur, no weight loss, less hunched down, and less tachypnea and jumping (Fig. 6A–C). These results are consistent with other preliminary reports on DNQ derivatives (Lundberg et al., 2021). All these characteristics make IP-DNQ a high promising candidate for the treatment of pancreatic cancer.
Moreover, as demonstrated in our previous studies (Huang et al., 2016; Jiang et al., 2022), NQO1 bioactivatable drugs are effective irrespective of oncogenic driver or passenger mutations. Given that NQO1 is highly expressed in pancreatic cancer and early-stage pancreatic cancer is generally less aggressive, we speculate that IP-DNQ treatment may be particularly effective in early neoplasms that overexpress NQO1. In conclusion, the mechanism of IP-DNQ revealed in this study suggests that this novel and potent NQO1 bioactivatable drug may be used in combination with PARP inhibitors, ionizing radiation, and base excision repair inhibitors to develop improved therapies for pancreatic cancer.
Materials and Methods
Cell lines and cell culture
MiaPaCa-2, BxPC-3, HS766T, and PANC1 cells were obtained from American Tissue Culture Collection (ATCC, Manasas, VA). S2-013 cells were obtained from Dr. M.A. Hollingsworth (Eppley Cancer Institute, Omaha, NE). MiaPaCa-2 NQO1− , S2-013 NQO1+ , and PANC1 NQO1+ stable cell lines were generated as described previously (Huang et al., 2016; Siegel et al., 2012). Cells were cultured in Dulbecco's modified Eagle's medium (DMEM; Cat. No. SH30243FS; Hyclone, Logan, UT) supplemented with 10% fetal bovine serum (FBS; Cat. No. SH3008003; Hyclone) in a humidified incubator at 37°C with 5% CO2.
Chemicals and reagents
IP-DNQ was synthesized as described previously (Parkinson et al., 2013). Synthesized compound was confirmed by NMR and high-resolution mass spectrometry. Purity was confirmed by liquid chromatography–mass spectrometry (LC-MS). IP-DNQ was formulated in DMSO for in vitro experiments and 20% HPβCD for in vivo study. HPβCD (>98% purity) was obtained from Cyclodextrin Technologies Development, Inc. (Gainesville, FL). DIC (Cat. No. 287897), Hoechst 33258 (Cat. No. 94403), H2O2 (Cat. No. H1009), NAC (Cat. No. A9165), GSH (Cat. No. G6013), and BAPTA-AM (Cat. No. A1076) were purchased from Sigma Aldrich. BAPTA (Cat. No. sc-202076A) was purchased from Santa Cruz (La Jolla, CA). z-VAD-fmk was obtained from Merck Millipore (Bedford, MA; Cat. No. 219007).
Antibodies used in this study were as follows: NQO1 (A180, Cat. No. sc-32793; Santa Cruz), PARP1 (C2-10, Cat. No. 4338-MC; R&D Systems, Minneapolis, MN), PAR (Cat. No. 4335-MC-100-AC; Trevigen, Gaithersburg, MD), cleaved caspase 7 (D6H1, Cat. No. 8438S; Cell Signaling, Danvers, MA), cleaved caspase 3 (5A1E, Cat. No. 9978S; Cell Signaling), p53 (DO-1, Cat. No. sc-126; Santa Cruz), catalase (D4P7B, Cat. No. 12980S; Cell Signaling), γH2AX (JBW301, Cat. No. 05-636; Millipore, Temecula, CA), phospho-Cdc2 (10A11, Cat. No. 4539S; Cell Signaling), phospho-Chk2 (C13C1, Cat. No. 2197S; Cell Signaling), Chk2 (D9C6, Cat. No. 6334S; Cell Signaling), SIRT1 (H-300, Cat. No. sc-15404; Santa Cruz), PGC-1 (Cat. No. ST1204; Millipore, Billerica, MA), Cdc25c (5H9, Cat. No. 4688S; Cell Signaling), Cdk2 (E8J9T, Cat. No. 18048s; Cell Signaling), cyclin A2 (E6D1J, Cat. No. 67955s; Cell Signaling), cyclin B1 (D5C10, Cat. No. 12231T; Cell Signaling), H2AX (D17A3, Cat. No. 7631S; Cell Signaling), β-actin (13E5, Cat. No. 4970S; Cell Signaling), and α-tubulin (B-7, Cat. No. sc-5286; Santa Cruz).
Cell viability assay
Cells were seeded at a density of 5000 cells/well in 96-well plates 24 h in advance and treated for 2 h with various doses of IP-DNQ (0–0.4 μM/L) ± DIC (50 μM/L) in six replicates/dose, followed by washing and replacing with fresh 5% FBS DMEM. After 7 days (or until 100% confluence for the untreated control), the medium was removed, cells were washed with 1 × phosphate-buffered saline (PBS), and 100 μL/well of distilled H2O was added into plates and frozen at −80°C for at least 1 h. Cells were lysed by the freeze–thaw method and stained with 150 μL of TNE buffer (50 mM Tris-HCl [pH 7.4], 100 mM NaCl, 0.1 mM EDTA), including Hoechst 33258 (1 μg/mL). DNA content was quantified by fluorescence (460 nm) using Victor X3 plate reader (PerkinElmer Life Sciences, Waltham, MA).
Western blot analysis
Cells were seeded and treated as for the cell viability assay. After the indicated time, cells were harvested, and total proteins were extracted by RIPA lysis buffer (Cat. No. PI89900; Thermo Fisher, Waltham, MA) and quantified using a BCA Protein Assay Reagent Kit. The same amounts of total proteins were subjected to sodium dodecylsulfate polyacrylamide gel electrophoresis, followed by transferring to PVDF membranes and incubating with primary antibodies and then horseradish peroxidase-conjugated secondary antibodies. Peroxidase labeling was visualized with Super Signal West Femto Substrate (Cat. No. 34095; Thermo Fisher) and exposed to film.
NQO1 enzyme activity assay
NQO1 enzyme activity was measured using the NQO1 Activity Assay Kit (Cat. No. ab184867; Abcam) according to the manufacturer's protocol. The NQO1 activity of equal 250 μL of cell lysates was measured at 450 nm wavelength, and DIC was used as an inhibitor for NQO1 activity. The activity was calculated by substracting Optical Density (OD) with DIC from OD without dicumarol. NSCLC A549 and A549 NQO1− cells were used as positive and negative controls, respectively.
ROS detection assay
Cells treated with DMSO or IP-DNQ (0.2 μM) or NAC (1 mM) or GSH (5 mM) were incubated with 2,7-dichlorofluorescein diacetate (DCFDA) (Cat. No. D6883; Sigma-Aldrich) for 10 min, then washed with cold 1 × PBS, and harvested and resuspended in FCM buffer (1 × PBS with 4% FBS) for flow cytometry (Attune NxT Flow Cytometer; Invitrogen). The data were analyzed using FlowJo 10 software (Tree Star).
ATP/H2O2/NAD+/GSH assessments
Cells were seeded into 96-well plate 24 h in advance, and then, ATP, H2O2, NAD+, total GSH, and GSSG levels were assayed according to the manufacturer's instruction following IP-DNQ treatment (2 h) in the absence or presence of 50 μM DIC by using CellTiter-Glo® 2.0, ROS-Glo™ H2O2, NAD/NADH-Glo™, and CellTiter- assay kits (Cat. Nos. G9241, G8820, G9071; Promega, Madison, WI), respectively.
Immunofluorescence staining
Cells were plated on microcover glass at a density of 1.6 × 10⁵ cells per cover glass 24 h in advance and treated with or without IP-DNQ ± DIC, and then fixed with 100% methanol for 30 min at −20°C. Cells were permeabilized with 0.5% Triton X-100 for 10 min and blocked with 5% goat serum in PBS for 1 h at room temperature and then incubated with γH2AX (Ser139) antibody (1:500) at 4°C overnight. After that, the DyLight594-conjugated secondary antibody (1:200; EarthOx, San Francisco, CA) was overlayed onto the cells and incubated at room temperature for 1 h, and cells were mounted using mounting media with DAPI.
Comet assay
Experiment was conducted following the manufacturer's instructions (OxiSelect™ Comet Assay Kit, Cat. No. STA-351; Cell Biolabs, Inc.). Briefly, cells treated with DMSO or IP-DNQ were collected and washed with 1 × PBS, and then resuspended at 1 × 10⁵ cells/mL in ice-cold PBS. Cell samples were mixed with 0.7% (f.c.) low melting agarose at a ratio of 1:10 (v/v) and layered on comet slides. Slides were then immersed in lysis buffer (pH 10) at 4°C for 45 min, followed by transferring into prechilled alkaline buffer (1 mM EDTA, 300 mM NaOH, pH >13) and subjected to alkaline electrophoresis (30 min, 1 V/cm). After that, slides were washed with cold distilled H2O and 70% ethanol, and dried at room temperature overnight and stained with PI. Images were captured by fluorescence microscopy. Comet tail lengths from at least 50 cells per group were analyzed by CASP software.
Flow cytometry analysis
Cells were seeded in plates 24 h in advance and treated with or without IP-DNQ for 2 h, followed by washing and replacing with fresh medium, and then, cells were harvested at indicated times. For apoptosis analysis, cells were washed with 1 × PBS, around 1 × 10⁶ cells were resuspended in 100 μL of staining buffer and stained by PI- and FITC-conjugated Annexin-V (TACS Annexin V-FITC kit, Cat. No. 4830-01-K; R&D Systems) for 10 min according to the manufacturer's protocol. Next, 400 μL of staining buffer (provided in the kit) was added before the cells were analyzed by flow cytometry. For cell cycle assay, harvested cells (1 × 10⁶ cells/group) were fixed in 100% methanol (Fisher Chemical™, Cat. No. A412-1; Fisher Scientific), washed with 1 × PBS, and incubated in 1 × PBS buffer containing 100 μg/mL propidium iodine, 1% Triton X-100, and 10 μg/mL RNase for 30 min.
For mitochondrial membrane potential assay, the collected cells were washed and resuspended in 1 × PBS, and then incubated with JC-1 (2 μM) for 30 min according to the protocol of the manufacturer (MitoProbe™ JC-1 Assay Kit, Cat. No. M34152; Invitrogen). Experiments were performed using FACSAria (BD Biosciences, San Jose, CA) and analyzed by FlowJo 10 software.
Quantitative real-time polymerase chain reaction
High-quality total RNA was isolated with Trizol (Invitrogen), quality of RNA was determined by the measurements of 260/280 (2.0 indicating pure RNA) and 260/230 ratios (2.0–2.2 indicating pure RNA) using a spectrophotometer. Complementary DNA (cDNA) synthesis was performed using 2 μg of total RNA with the iScript™ cDNA Synthesis Kit (Bio-Rad Laboratories, Inc.). Quantitative real-time polymerase chain reaction (qRT-PCR) was carried out using iTaq universal SYBR Green supermix (Bio-Rad Laboratories, Inc.). The relative quantity of mRNA expression was calculated using the 2−ΔΔCq method. The sequences of the primers used for qRT-PCR were as follows (the primers without reference were designed by us):
PGC1α forward: GTAAATCTGCGGGATGATGG, PGC1α reverse: AATTGCTTGCGTCCACAAA (Abildgaard et al., 2017); SOD2 forward: TTGGCCAAGGGAGATGTTAC, SOD2 reverse: AGTCACGTTTGATGGCTTCC (Kang et al., 2017); GPX1 forward: CCCTCTGAGGCACCACGGT, GPX1 reverse: TAAGCGCGGTGGCGTCGT (Nieman et al., 2020); Cyt C forward: GGAGGCAAGCATAAGACTGG, Cyt C reverse: TCCATCAGGGTATCCTCTCC (Samanta et al., 2018); SIRT1 forward: GACTCCAAGGCCACGGATAG, SIRT1 reverse: GTGGAGGTATTGTTTCCGGC (Luo et al., 2020); ERRα forward: TGAGAAGCTCTATGCCATGCCTGAC, ERRα reverse: CCAGCACCAGCACCTCCATCC (Gaillard et al., 2006); NDUFS3 forward: GCTGACGCCCATTGAGTCTG, NDUFS3 reverse: GGAACTCTTGGGCCAACTCC (Abildgaard et al., 2017); COX5a forward: GGGAATTGCGTAAAGGGATAA, COX5a reverse: TCCTGCTTTGTCCTTAACAACC (Abildgaard et al., 2017); ATP5G1 forward: ATCATTGGCTATGCCAGGAA, ATP5G1 reverse: ATGGCGAAGAGGATGAGGA (Abildgaard et al., 2017); GLRX5 forward: AGCTCCGACAAGGCATTAAA, GLRX5 reverse: AGTGGATCCCCAGCTTTTTC (Choi, 2020); MGST2 forward: CTGCTGGCTGCTGTCTCTATTC, MGST2 reverse: TTGTTGTGCCCGAAATACTCTC (Choi, 2020); IDH3A forward: CTGCTCAGTGCCGTGATG, IDH3A reverse: TCCTCTGTGAAGTCTGAGCATTT; Bak forward: TGTTCTGCATACCAAGCTGAGCAC, Bak reverse: TGATTGAGCGAGCCTTTCCATCC; Bax forward: GGTCTGGATGCATATAGCGTTCCC, Bax reverse: AGGCTGGGCCTGTATCCTACATTC; GAPDH forward: TGCACCACCAACTGCTTAGC, GAPDH reverse: GGCATGGACTGTGGTCATGAG (Cicinnati et al., 2008).
MTD study
All animal procedures were approved by the IU IACUC committee. The study of the MTD of IP-DNQ, DNQ, and β-lapachone was carried out in 6–8-week female nontumor-bearing NSG mice (18–20 g, purchased from the Jackson Laboratory), with once-daily (QD) dosing for 5 consecutive days. A total of 60 female NSG mice (n = 5/group) were randomly assigned to the study. The animals received HPβCD-IP-DNQ, HPβCD-DNQ, or HPβCD-β-lapachone at various dosages or the vehicle (20% HPβCD) via i.v. tail vein injection.
The MTD in this study is defined as the highest dose that will be tolerated and will not produce major life-threatening toxicity for the study duration (Robinson et al., 2008; Zhang et al., 2015). The mice were observed for a period of 2 weeks. They were sacrificed if they lost more than 20% of their body weight or if there were other signs of significant toxicity. If all five mice needed to be sacrificed, the next lower three dose levels were tested in a similar manner. This process was repeated until a tolerated dose was found. The starting dose level (IP-DNQ, DNQ, and β-lapachone) for the MTD study was selected based upon our previous findings (Huang et al., 2016; Huang et al., 2012). The detailed group design is listed in Table 1.
Five-Day Maximum Tolerated Dose Study
DNQ, deoxynyboquinone; IP-DNQ, isopentyl-deoxynboquinone.
In vitro induction of methemoglobinemia
Blood was obtained from nontumor-bearing NSG mice by cardiac puncture (1 mL blood/mouse) and transferred into K2EDTA ·2H2O collection tubes. RBCs were washed three times with 1 × PBS (pH 7.4) at room temperature and resuspended in 1 × PBS at 30% hematocrit. IP-DNQ (1 mM), DNQ (1 mM), or β-lapachone (48 mM) dissolved in DMSO was added to 200 μL of blood (30% hematocrit) at a final concentration of 0.25 μM for IP-DNQ and DNQ and 6 μM for β-lapachone, then incubated at 37°C. Blood treated with DMSO was used as a control. Blood samples were taken at 1, 2, and 4 h after treatment for methgb measurements.
In vivo induction of methemoglobinemia
No tumor-bearing NSG mice (n = 4/group) received a single intravenous injection of either 20% HPβCD as vehicle or IP-DNQ (15 mg/kg), DNQ (5 mg/kg), or β-lapachone (25 mg/kg) dissolved in 20% HPβCD. Blood samples were obtained by submandibular bleeding of mice using a 5 mm lancet (Goldenrod; Medipoint, Inc.) into blood collection tubes prepared with K2EDTA ·2H2O as an anticoagulant (Safe-T-Fill; Ram Scientific). Blood samples were taken at 1, 2, and 4 h after treatment for methgb measurements.
Measurement of methemoglobinemia
The percentage of methgb in a blood sample was determined using the method developed by Dr. Nussbaum research group (Kuo and Nussbaum, 2015). Eighty microliters of blood was added to 1.2 mL of distilled water and mixed by inversion to hemolyze the RBCs and ensure complete oxygenation of hemoglobin. The mixture was left at room temperature for 2–3 min, then 0.24 mL of 0.5 M phosphate buffer (0.22 M Na2HPO4, 0.28 M KH2PO4, pH 6.5) was added, and the buffered hemolysate was immediately cooled on ice, followed by centrifugation at 1600 g for 5 min at 4°C. The cleared, buffered hemolysate is the designated solution S. To measure the percentage of methgb, 1 mL of solution S was added to a cuvette (10 mm light path), and the absorbance at 630 nm was measured (S1).
Immediately following measurement of S1, 5 μL of KCN (100 mg/mL, 10% w/v) was added to the cuvette and mixed by inversion. After waiting for 2–3 min to allow air bubbles to rise from the solution, the absorbance at 630 nm was read (S2). To calculate the percentage of methgb, 0.2 mL of solution S was added to 1.0 mL of 0.1 M phosphate buffer (pH 6.5), and 5 μL of K3Fe(CN)6 (200 mg/mL, 20% w/v) was added to the above mixture, which was mixed by inversion and left for at least 5 min at room temperature.
The final mixture is the designated solution R. Solution R was transferred to a cuvette as above, and the absorbance at 630 nm was read (R1). The absorbance was then reread at 630 nm (R2) after adding 5 μL of KCN (100 mg/mL, 10% w/v), mixing, and allowing it to stand for 2–3 min. The percentage of methgb was calculated as 100(S1 − S2)/6(R1 − R2). The blood was incubated at 37°C and triplicate samples were taken at various time points for methgb measurements.
IP-DNQ efficacy against orthotopic and subcutaneous MiaPaCa-2 pancreatic cancers
For the orthotopic xenograft model, around 1 × 10⁶ cells (for one mouse) were directly injected into pancreases after NSG female mice (18–20 g) were opened at the spleen site. After 7 days of injections, mice were randomly divided into two groups (n = 5/group) and given i.v. tail vein injection of 20% HPβCD as vehicle or IP-DNQ (12 mg/kg) dissolved in 20% HPβCD every other day for a total of five injections. Mice weights were monitored every other day during the injection period and then once a week till the weight had increased more than 30% of the original due to the increase in tumor burden and ascites.
For the subcutaneous xenograft models, around 1 × 10⁶ NQO1 + MiaPaCa-2 cells or 1.2 × 10⁶ NQO1 − MiaPaCa-2 cells (for one mouse) were injected into the subcutaneous space on the right flank of NSG female mice (18–20 g). When tumor volume reached up to ∼50 mm3, mice were divided randomly into two groups (n = 5/group) with no statistical differences in tumor sizes and treated with an intratumor injection of 20% HPβCD as vehicle or HPβCD-IP-DNQ (12 mg/kg) every other day for a total of five injections. Tumor volumes were measured twice a week with a caliper and calculated using the formula 0.5 × length × width2. When the tumor volume reached up to 1000 mm3, mice were sacrificed, and a survival curve was plotted. All animal procedures were approved by the Indiana University IACUC Committee.
Statistical analyses
Statistical analyses were performed by using GraphPad Prism 8 (GraphPad Software, Inc.). Student t tests were used to determine statistical significance. Images were representative of results of experiments or staining repeated at least three times. p Value of <0.05 was considered to be a statistically significant difference between compared groups and reported by asterisks as indicated.
Electronic laboratory notebook
Electronic laboratory notebooks were not used.
Data Availability Statement
The data that support the findings of this study are available from the corresponding author upon reasonable request.
Footnotes
Acknowledgments
This article is dedicated to the memory of our mentor, Dr. David A. Boothman, who contributed significantly to this study. He will be greatly missed. We thank the IU School of Medicine animal breeding core facility and and IU Simon Cancer CCSG grant P30 CA087209. We thank IU corresponding cores of flow cytometry and biostatistics core for their support of this research.
Authors' Contributions
L.J., Y.L., and X.H. designed the experiments. L.J., Y.L., S.T., J.W., and X.S. performed the experiments and analyzed the data. M.W.B. and L.E.C. synthesized IP-DNQ. L.J. and X.H. wrote the article. L.J., M.W.B., L.E.C., K.R.Z., S.T., K.L., Y.C., K.Y., P.J.H., and X.H. reviewed and edited the article. P.J.H. and X.H. supervised all the experiments.
Author Disclosure Statement
The authors declare conflicts of interest for Dr. Hergenrother as a scientific board advisor for Systems Oncology. UIUC and UTSW have filed patent on compounds described in this article (U.S. patent No. 10576096, February 4, 2020). IU, UTSW, and UIUC have filed patent on compounds described in this article (U.S. patent application No. 17440787, May 26, 2022).
Funding Information
This work was supported by the NIH NCI grants R01CA221158, R01CA224493, and R01CA240952 to X.H., and R01-DE026836 to P.J.H. M.W.B. and L.E.C. were members of the NIH Chemistry-Biology Interface Training Program (T32-GM136629). M.W.B. was an ACS Medicinal Chemistry predoctoral fellow and was also supported by an NCI F99 predoctoral fellowship (F99-CA253731).
Supplementary Material
Supplementary Figure S1
Supplementary Figure S2
Supplementary Figure S3
Supplementary Figure S4
Innovation image
Abbreviations Used
References
Supplementary Material
Please find the following supplemental material available below.
For Open Access articles published under a Creative Commons License, all supplemental material carries the same license as the article it is associated with.
For non-Open Access articles published, all supplemental material carries a non-exclusive license, and permission requests for re-use of supplemental material or any part of supplemental material shall be sent directly to the copyright owner as specified in the copyright notice associated with the article.
