




Abstract
Aims:
Mitochondrial dynamics in alveolar macrophages (AMs) are associated with sepsis-induced acute lung injury (ALI). In this study, we aimed to investigate whether changes in mitochondrial dynamics could alter the polarization of AMs in sepsis-induced ALI and to explore the regulatory mechanism of mitochondrial dynamics by focusing on sirtuin (SIRT)3-induced optic atrophy protein 1 (OPA1) deacetylation.
Results:
The AMs of sepsis-induced ALI showed imbalanced mitochondrial dynamics and polarization to the M1 macrophage phenotype. In sepsis, SIRT3 overexpression promotes mitochondrial dynamic equilibrium in AMs. However, 3-(1H-1, 2, 3-triazol-4-yl) pyridine (3TYP)-specific inhibition of SIRT3 increased the mitochondrial dynamic imbalance and pro-inflammatory polarization of AMs and further aggravated sepsis-induced ALI. OPA1 is directly bound to and deacetylated by SIRT3 in AMs. In AMs of sepsis-induced ALI, SIRT3 protein expression was decreased and OPA1 acetylation was increased. OPA1 acetylation at the lysine 792 amino acid residue (OPA1-K792) promotes self-cleavage and is associated with an imbalance in mitochondrial dynamics. However, decreased acetylation of OPA1-K792 reversed the pro-inflammatory polarization of AMs and protected the barrier function of alveolar epithelial cells in sepsis-induced ALI.
Innovation:
Our study revealed, for the first time, the regulation of mitochondrial dynamics and AM polarization by SIRT3-mediated deacetylation of OPA1 in sepsis-induced ALI, which may serve as an intervention target for precision therapy of the disease.
Conclusions:
Our data suggest that imbalanced mitochondrial dynamics promote pro-inflammatory polarization of AMs in sepsis-induced ALI and that deacetylation of OPA1 mediated by SIRT3 improves mitochondrial dynamic equilibrium, thereby ameliorating lung injury. Antioxid. Redox Signal. 41, 1014–1030.
Introduction
Sepsis is defined as a life-threatening multiorgan dysfunction caused by dysregulated host response to infection (Singer et al., 2016). The lungs are the most vulnerable target organ during sepsis. Among the multiple organ injuries associated with sepsis, acute lung injury (ALI)/acute respiratory distress syndrome (ARDS) occurs earliest, has the highest incidence, and is an important cause of patient death (Jia et al., 2021; Park et al., 2019). Sepsis-induced ALI/ARDS is characterized by an extensive pulmonary inflammatory response, with alveolar macrophages (AMs) and neutrophils accounting for >90% of the total cells in bronchoalveolar lavage fluid (BALF) during the acute phase (Hao and Wei, 2022). Quiescent macrophages differentiate into pro-inflammatory (M1) or anti-inflammatory (M2) macrophages in response to different environmental cues and molecular mediators. During the development of sepsis, macrophages are activated with an increased M1 phenotype and decreased M2 phenotype, resulting in an imbalance in the M1/M2 ratio, release of pro-inflammatory mediators and chemokines, excessive inflammatory response, and organ injury (Fan and Fan, 2018; Li et al., 2016).
Sepsis and sepsis-induced ALI/ARDS are linked to mitochondrial dysfunction, and mitochondrial defects have been extensively described in human subjects with sepsis or severe pneumonia-associated ARDS, as well as in animal models of sepsis (Bos et al., 2019; Cen et al., 2021; Singer, 2014). However, the link between sepsis-induced ALI/ARDS and mitochondrial impairment is not well-understood at the molecular level. Mitochondria regulate their size, connectivity, and ultrastructure through fusion, fission, and cristae remodeling, which are known as mitochondrial dynamics. Mitochondrial dynamics regulate mitochondrial biogenesis, reactive oxygen species generation, Ca2+ signaling, and cell growth and death (Eisner et al., 2018). Previous studies have reported that lipopolysaccharide (LPS) exposure promotes mitochondria fission, as evidenced by elevated levels of dynamin-related protein 1 (DRP1) mRNA and protein, as well as decreased levels of mitofusin1 (MFN1), mitofusin2 (MFN2), and optic atrophy protein 1 (OPA1) in vitro and in vivo. In contrast, promoting mitochondrial dynamic equilibrium in AMs can alleviate endotoxin-induced ALI (Yu et al., 2016; Yuan et al., 2014). However, the mechanism of action underlying the mitochondrial dynamic imbalance and its functional significance in sepsis-induced ALI/ARDS remain largely unknown.
SIRT3 is a member of the sirtuin family and a nicotinamide adenine dinucleotide+-dependent type III histone deacetylase. SIRT3 exhibits the strongest deacetylase activity among the mitochondrial sirtuins and participates in the regulation of many mitochondrial functions through deacetylation, such as changes in mitochondrial dynamics, fatty acid oxidation, glucose metabolism, and antioxidant responses. Studies have shown that SIRT3 deacetylates and activates OPA1, promotes mitochondrial fusion, and alleviates renal ischemia–reperfusion injury (Wang et al., 2019). Our reports and those of other investigators have demonstrated that mitochondrial dysfunction caused by SIRT3 inhibition mediates multiple organ dysfunction during sepsis (Kurundkar et al., 2019; Wu et al., 2020). Recent studies have reported that macrophages from SIRT3 knockout mice display altered mitochondrial biofunction and a pro-inflammatory phenotype characterized by NOD-like receptor family pyrin domain-containing protein 3inflammasome activation (Kurundkar et al., 2019). However, it remains unclear how SIRT3 regulates changes in mitochondrial dynamics and the AM phenotype in sepsis-induced ALI/ARDS.
OPA1 is a key molecule that regulates mitochondrial fusion and is the first protein discovered to regulate the mitochondrial cristae structure (Baker et al., 2019). Deletion of OPA1 or cleavage of the long form of OPA1 (L-OPA1) to the short form of OPA1 (S-OPA1) results in blocked mitochondrial fusion, hyperfragmentation of mitochondria, and abnormal mitochondrial cristae (Anand et al., 2014; Varanita et al., 2015). In the LPS-induced ALI model mice, L-OPA1 deficiency impaired mitochondrial function and aggravated necroptosis in the alveolar epithelial cells (AECs) (Jiang et al., 2022). In addition, OPA1 is regulated by a wide range of post-translational modifications, including phosphorylation, acetylation, methylation, and ubiquitination. Current studies have mainly focused on the acetylation modification of OPA1 (Adaniya et al., 2019). Samant et al. first found hyperacetylation of OPA1 in animal models of cardiac pressure overload and found that OPA1 acetylation leads to the fragmentation of cardiac mitochondria (Samant et al., 2014). Another study reported that the acetylation of OPA1 can also promote the cleavage of L-OPA1 to S-OPA1 and ultimately induce apoptosis (Signorile et al., 2017). However, the role and mechanism of action of OPA1 acetylation in sepsis-induced ALI/ARDS remain unknown, and whether OPA1 acetylation is regulated by SIRT3 is worth exploring.
In this study, we investigated whether changes in the mitochondrial dynamic equilibrium alter the polarization of AMs during sepsis-induced ALI. We further analyzed the mechanisms that regulate mitochondrial dynamic equilibrium in AMs and focused on the SIRT3-induced OPA1 deacetylation pathway.
Results
AMs are activated to shift from an anti-inflammatory phenotype to a pro-inflammatory phenotype in sepsis-induced ALI
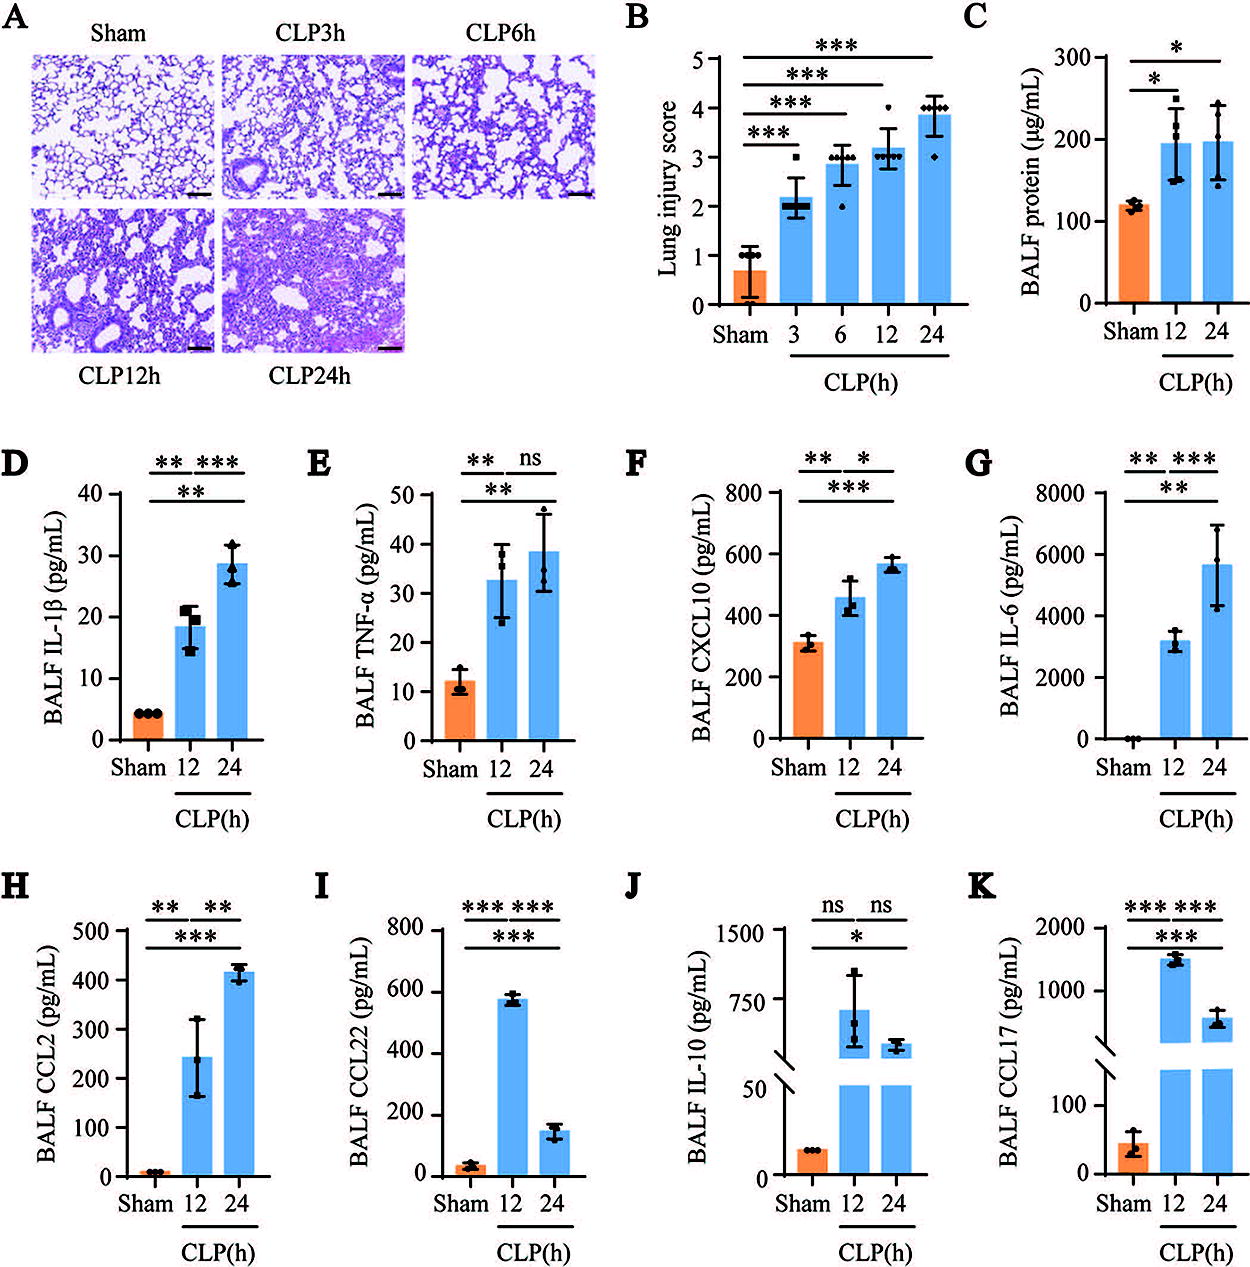
We first analyzed the characteristics of lung injury in the cecal ligation and puncture (CLP)-induced septic ALI mouse model. Hematoxylin and eosin (H&E) staining of lung tissues revealed alveolar damage, significant reduction of alveolar airspaces, and alveolar wall thickening in CLP-induced septic mice (Fig. 1A and B). Furthermore, the total protein concentration in the BALF was significantly higher in the CLP group than in the sham group (Fig. 1C). Next, we used the Luminex assay to determine the levels of the M1 macrophage marker cytokines (interleukin [IL]-1β, tumor necrosis factor [TNF]-α, C-X-C motif ligand [CXCL]10, IL-6, and C-C motif ligand [CCL]2) and the M2 macrophage marker cytokines (CCL22, IL-10, and CCL17) in the BALF of the mice in the sham and CLP groups. Compared with the sham group, the levels of IL-1β, TNF-α, CXCL10, IL-6, and CCL2 continued to increase in the CLP group (Fig. 1D–H). Compared with the sham group, the levels of CCL22 and CCL17 in the CLP12h group were significantly increased, but the levels of CCL22 and CCL17 in the CLP24h group were significantly lower than those in the CLP12h group (Fig. 1I and K). Although not statistically significant, the change trend of IL-10 levels in the CLP group was consistent with that of CCL22 and CCL17 (Fig. 1J). These results suggest that AMs were activated in the CLP-induced septic ALI mouse model and that the polarization of AMs toward pro-inflammatory M1 increased and polarization toward anti-inflammatory M2 decreased with disease progression.
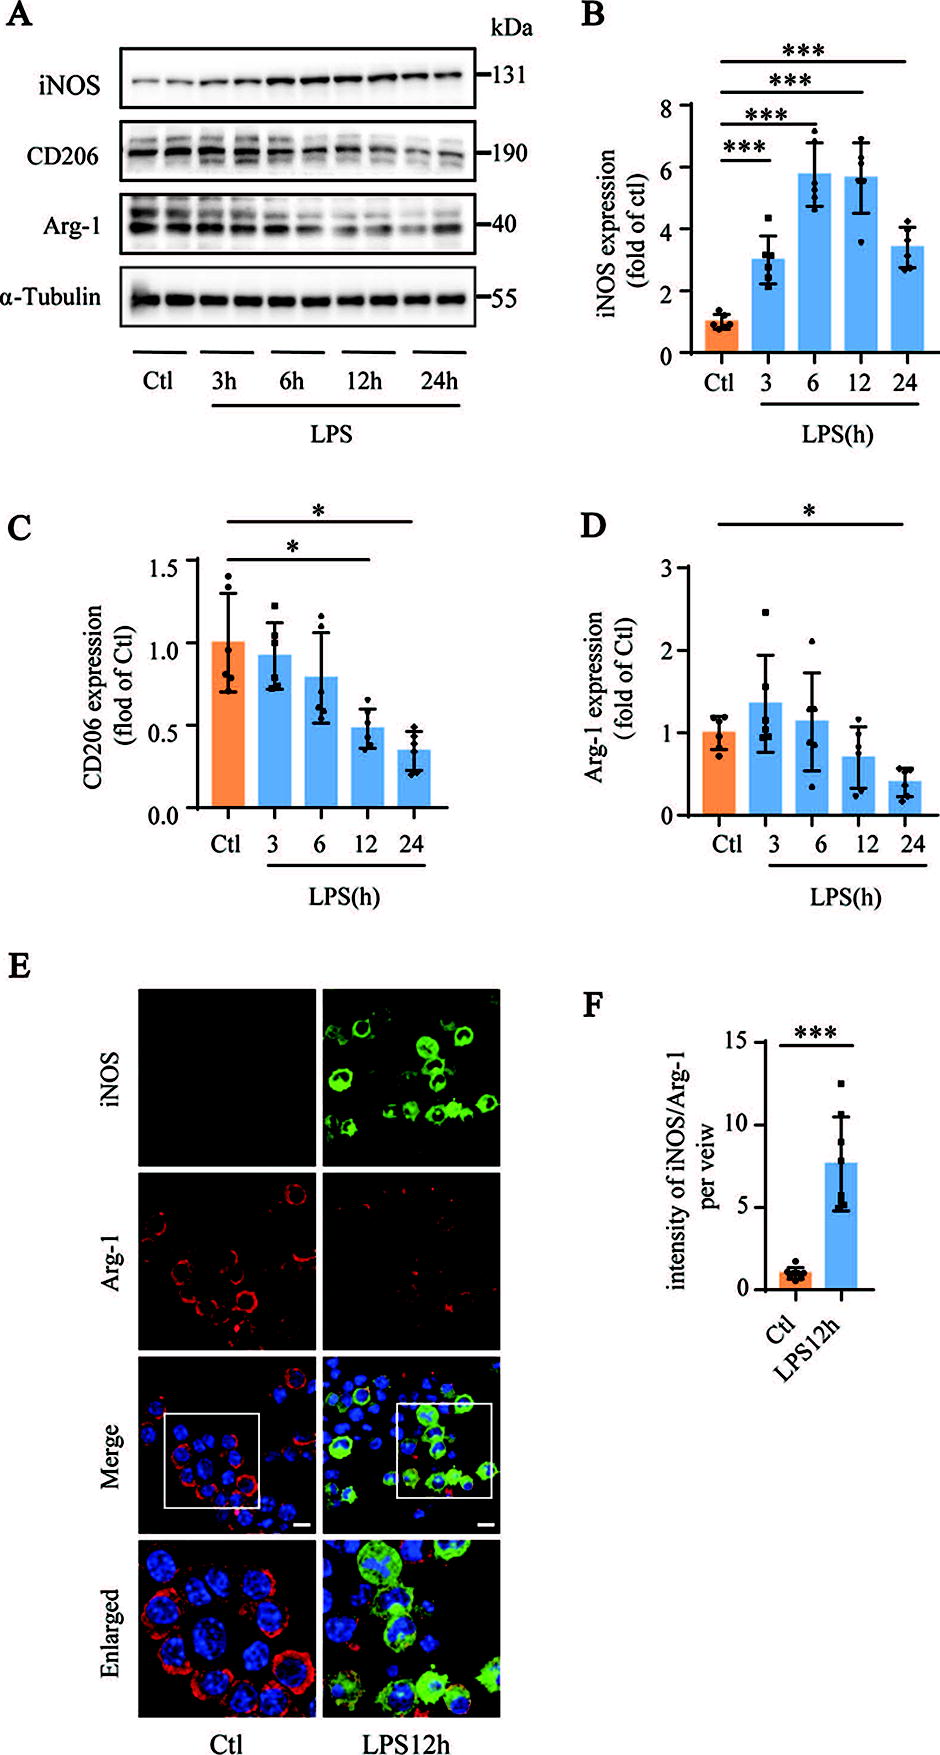
Next, we analyzed the expression levels of inducible nitric oxide (iNOS), CD206, and arginase (Arg)-1 in the LPS-stimulated mouse AMs (MH-S cells). CD206 and Arg-1 are marker proteins of M2 macrophages, whereas iNOS is a marker protein of M1 macrophages. Western blotting results showed that LPS treatment increased the expression levels of iNOS and decreased the expression levels of CD206 and Arg-1 in MH-S cells compared with the corresponding controls (Fig. 2A–D). The immunofluorescence staining results were comparable to those of Western blotting and showed higher iNOS and lower Arg-1 expression levels in LPS-treated MH-S cells (Fig. 2E and F). These results showed that LPS treatment induced the polarization of MH-S cells toward the M1 macrophage phenotype and decreased their polarization toward the M2 macrophage phenotype.
AM mitochondrial dynamics are imbalanced in sepsis-induced ALI
We isolated and identified AMs from the mouse BALF (Fig. 3A). Confocal fluorescence images showed that the mitochondria in the AMs transformed from long rods in the sham group to a fragmented shape in the CLP group (Fig. 3B and C). Transmission electron microscopy (TEM) images showed that the mitochondrial cristae lumen of the AM was significantly widened in CLP-induced septic mice (Fig. 3D and E). In addition, mitochondrial network fragmentation and cristae remodeling with widening of cristae junctions are required for the complete release of cytochrome c (Cyt C). We also detected Cyt C expression in the cytoplasm and mitochondria in vitro. Compared to the control group, Cyt C levels were significantly increased in the cytoplasm and significantly decreased in the mitochondria of LPS-treated MH-S cells (Fig. 3F–H). Confocal images also showed that the colocalization of Cyt C with mitochondria was significantly reduced in the LPS-treated group compared with that in the control group (Fig. 3I and J). This suggests the remodeling of the mitochondrial cristae. Taken together, these results suggest that during sepsis-mediated ALI, mitochondrial dynamics are imbalanced in AMs due to increased mitochondrial fission and/or decreased mitochondrial fusion and remodeling of the mitochondrial cristae.

SIRT3 promotes mitochondrial dynamic equilibrium, reduces AM polarization into M1 phenotype, and attenuates sepsis-induced ALI
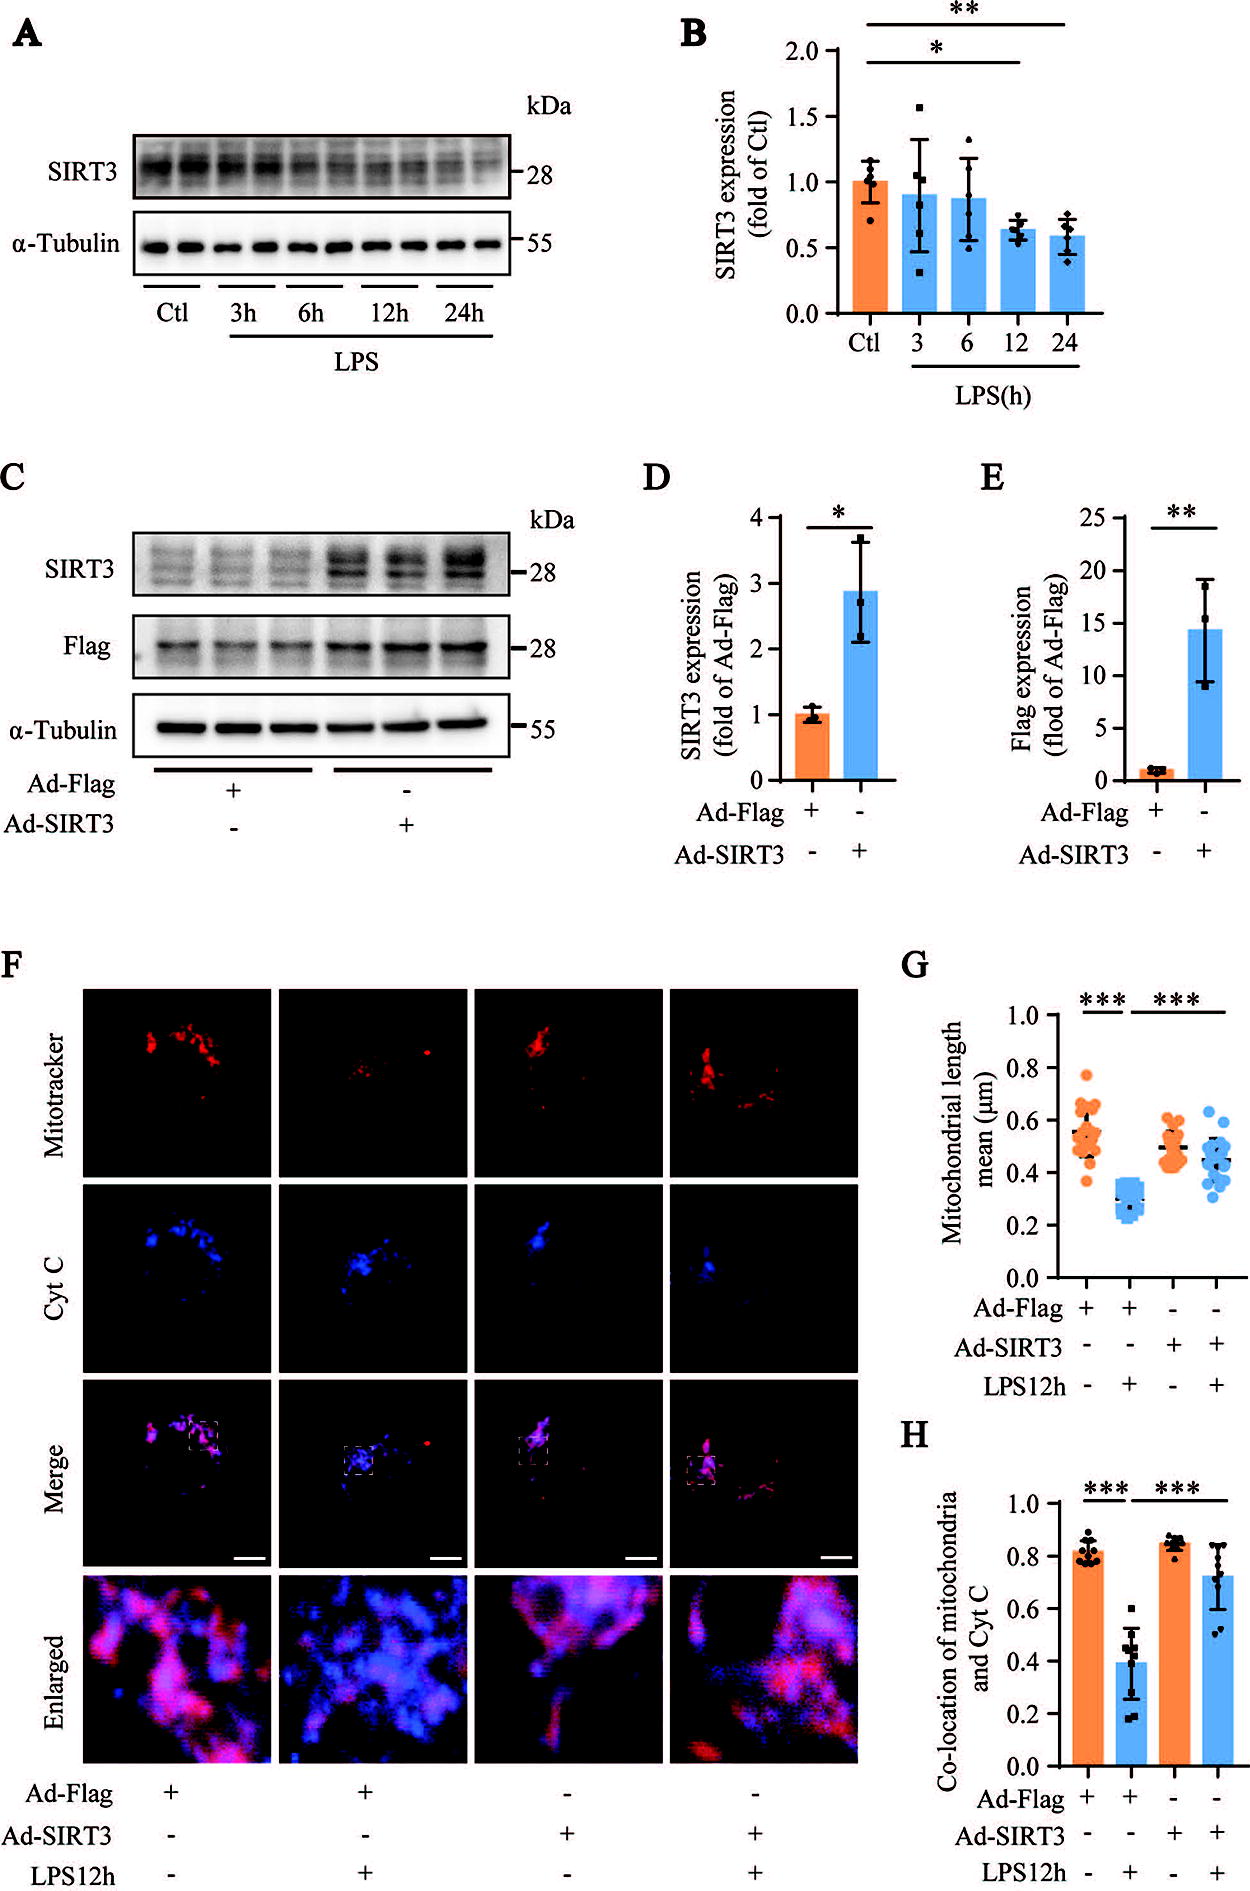
Because SIRT3 is a key regulator of mitochondrial function, we analyzed the expression levels of SIRT3 in LPS-stimulated MH-S cells. Western blotting results showed that the expression levels of SIRT3 were significantly decreased in LPS-treated MH-S cells compared with those in the control group (Fig. 4A and B). We generated an adenovirus overexpressing SIRT3 (Ad-SIRT3) (Fig. 4C–E). Confocal fluorescence images showed that transfection of MH-S cells with Ad-SIRT3 protected against LPS-stimulated mitochondrial fragmentation and significantly inhibited the release of Cyt C from the mitochondria into the cytoplasm (Fig. 4F–H). These results suggest that SIRT3 promotes the equilibrium of mitochondrial dynamics in AMs during sepsis-induced ALI.
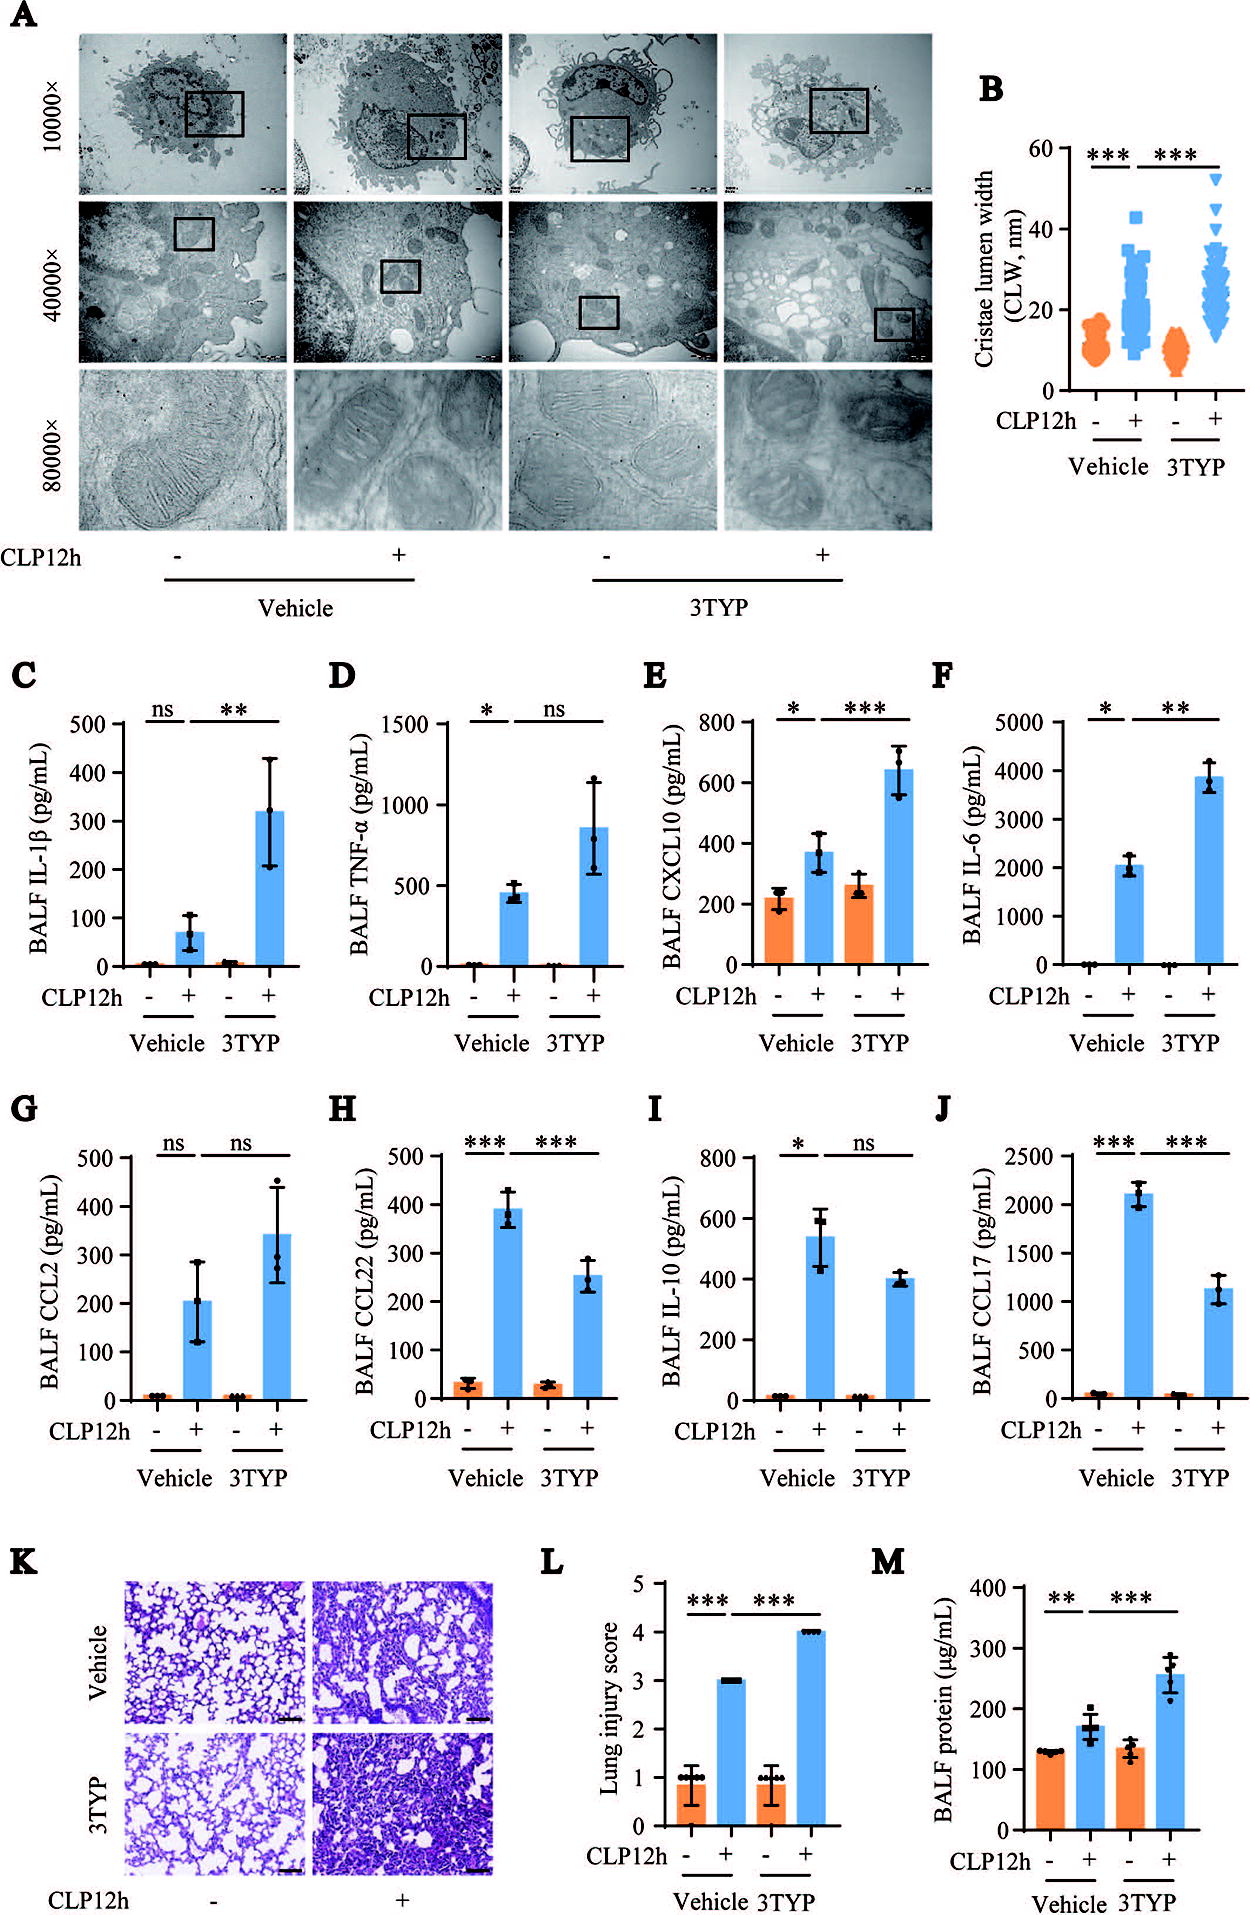
Furthermore, the effects of SIRT3 on mitochondrial dynamics and AM polarization were confirmed in mice with CLP-induced sepsis using 3TYP, a selective SIRT3 inhibitor. We first detected mitochondrial protein acetylation levels in lung tissue after the inhibition of SIRT3 with 3TYP. Treatment with 3TYP further exacerbated mitochondrial protein acetylation in the lung tissues of mice with CLP-induced sepsis (Supplementary Fig. S1). TEM images showed further widening of the AM mitochondrial cristae lumen in CLP-induced septic mice following SIRT3 inhibition by 3TYP (Fig. 5A and B). The Luminex assay results showed that the inhibition of SIRT3 with 3TYP significantly increased the levels of CXCL10 and IL-6 and significantly decreased the levels of CCL22 and CCL17 in the BALF of CLP-induced septic mice. The changes in the levels of IL-1β, TNF-α, and CCL2 were similar to the changes in the levels of CXCL10 and IL-6, whereas changes in IL-10 levels were similar to the changes in the levels of CCL22 and CCL17 in the CLP group, but these changes were statistically insignificant (Fig. 5C–J). These data suggest that inhibition of SIRT3 with 3TYP exacerbated the imbalanced mitochondrial dynamics and further increased the polarization of AMs toward the M1 macrophage phenotype in the CLP group. In addition, 3TYP treatment aggravated CLP-induced lung injury and further increased the BALF protein levels in the CLP-induced ALI mouse model (Fig. 5K–M). These results suggest that SIRT3 inhibition significantly exacerbates sepsis-induced ALI.
SIRT3 overexpression decreased acetylation of OPA1 in LPS-stimulated MH-S cells
To explore the mechanisms underlying the imbalanced mitochondrial dynamics, we analyzed the expression levels of mitochondrial fusion proteins in LPS-stimulated MH-S cells. Western blotting results showed that, compared with the control group, the levels of S-OPA1 in MH-S cells gradually increased with LPS treatment (Fig. 6A and B). Immunoprecipitation results showed that LPS treatment increased acetylated OPA1 levels (Fig. 6C). However, the expression and acetylation levels of two other mitochondrial fusion-related proteins, MFN1 and MFN2, did not change significantly in LPS-stimulated MH-S cells compared with those in the controls (Fig. 6D–G). These data suggest that OPA1 acetylation plays a significant role in the dysregulation of mitochondrial dynamic equilibrium in LPS-stimulated MH-S cells. Previous reports have shown that in cardiomyocytes under stress, SIRT3 directly binds to and deacetylates OPA1, thereby ameliorating mitochondrial dysfunction (Samant et al., 2014). Coimmunoprecipitation results showed that SIRT3 directly interacted with OPA1 in LPS-stimulated MH-S cells (Fig. 6H). Immunoprecipitation results showed that SIRT3 overexpression reduced the levels of OPA1 acetylation in LPS-stimulated MH-S cells compared with those in the control group (Fig. 6I). These results suggest that SIRT3 overexpression protects against lung injury in the sepsis-induced ALI model by promoting the mitochondrial dynamics equilibrium in AMs through the deacetylation of OPA1.
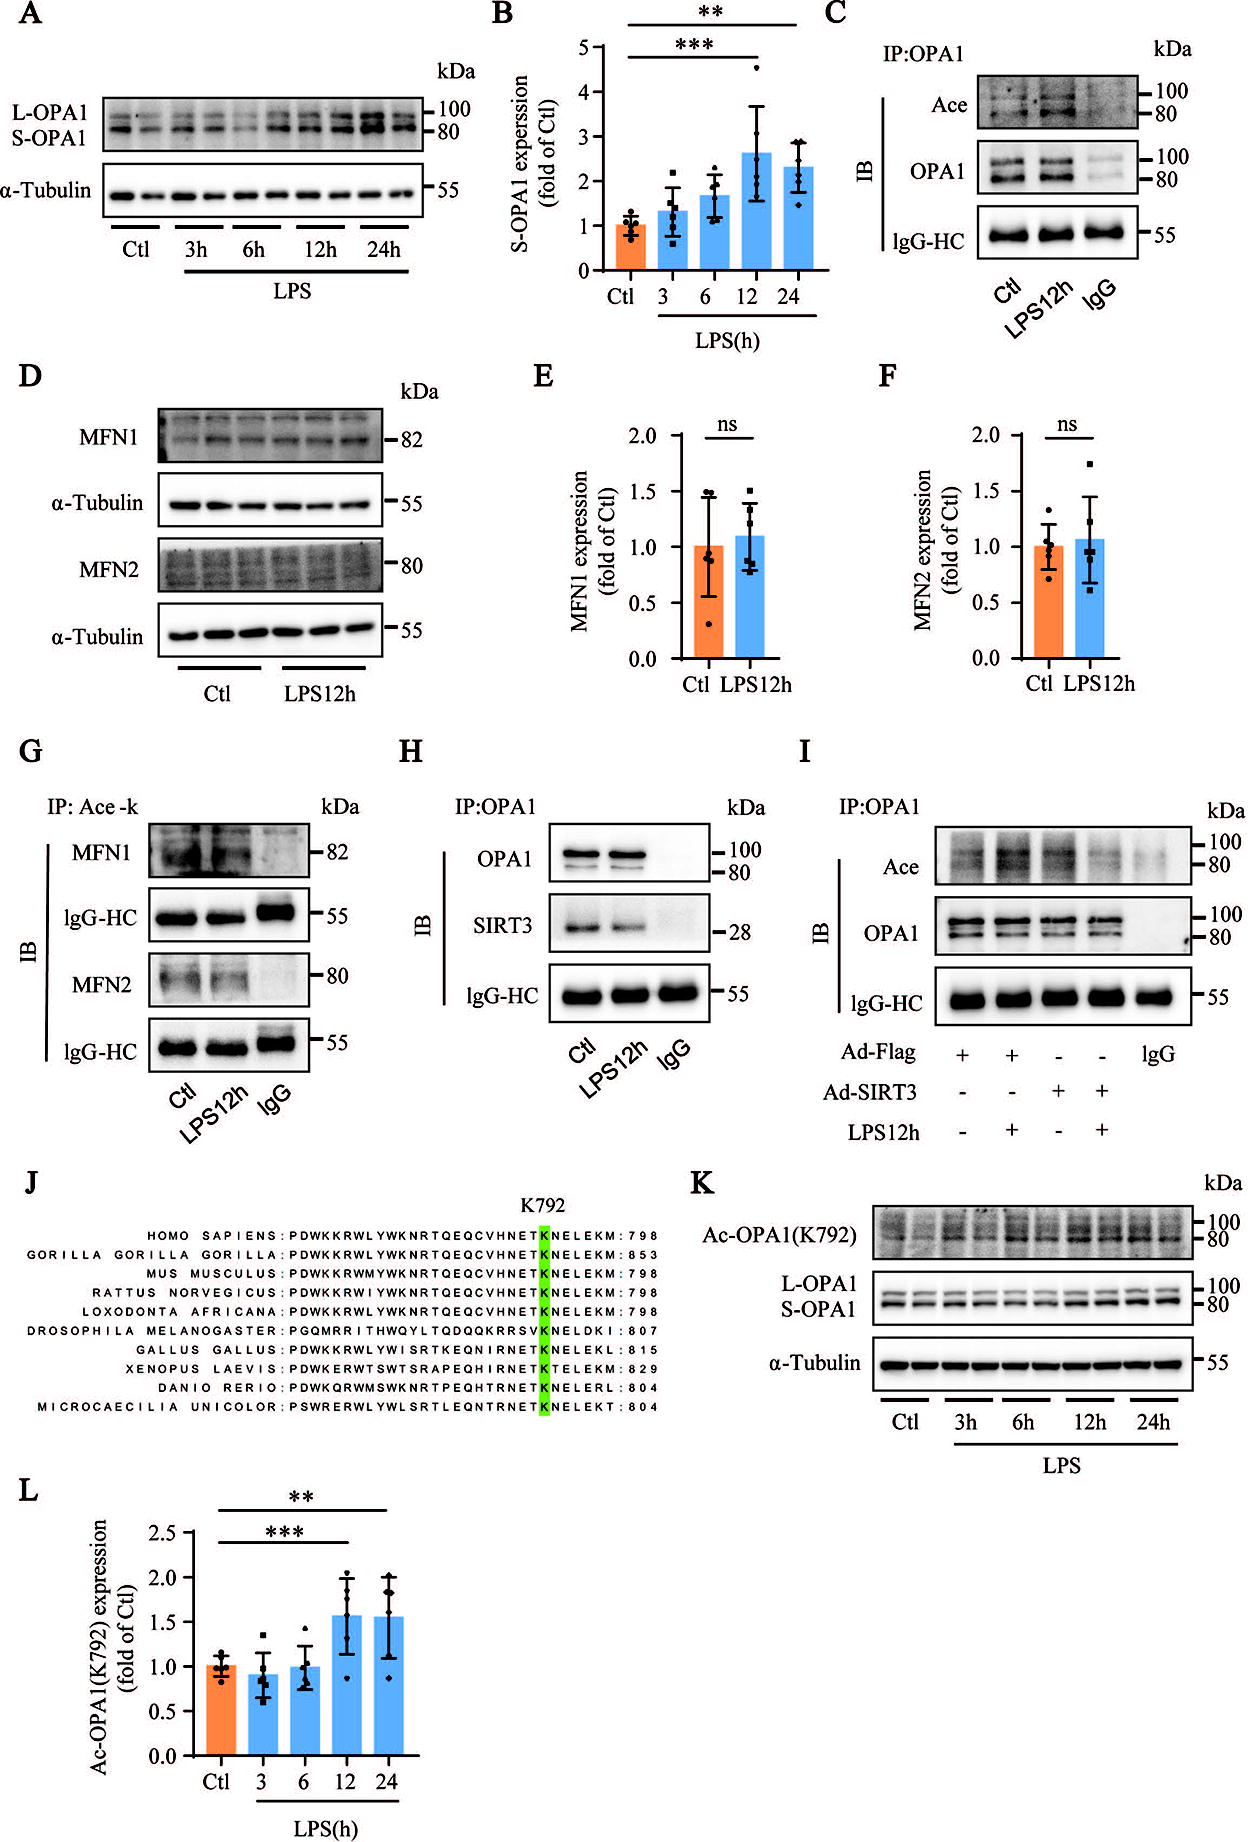
We then performed amino acid conservation analysis by aligning the OPA1 protein sequences from different species downloaded from the UniProt database using MEGA software and found that Lys792 (OPA1-K792) was highly conserved (Fig. 6J). We synthesized an Ac-OPA1 (K792) antibody to recognize OPA1-K792 acetylation. The results from both Western blotting and immunoprecipitation showed that, compared to the control group, the acetylation levels of OPA1-K792 in MH-S cells were higher at later time points of LPS treatment (Fig. 6K and L; Supplementary Fig. S2A–C). We also explored whether SIRT3 deacetylates OPA1-K792. OPA1-K792 acetylation was detected after the treatment of MH-S cells with Ad-SIRT3, 3TYP, or SIRT3 small interfering RNA (siSIRT3). Immunoprecipitation results showed that SIRT3 overexpression decreased the acetylation levels of OPA1-K792 in LPS-stimulated MH-S cells compared with that in the control group, whereas inhibition or knockdown of SIRT3 increased the acetylation levels of OPA1-K792 (Supplementary Fig. S5). These results suggest that the OPA1-K792 amino acid site is a reversible PTM lysine site in LPS-stimulated MH-S cells and that SIRT3 could reduce its acetylation. Taken together, these results suggest that acetylation of OPA1-K792 plays an essential regulatory role in LPS-stimulated MH-S cells and may represent an amino acid site for therapeutic intervention in sepsis-induced ALI.
OPA1-K792 acetylation causes altered polarization phenotype and imbalanced mitochondrial dynamics in AMs during sepsis-induced ALI
To further explore the role of OPA1-K792 acetylation in AMs during sepsis-induced ALI, we generated adenoviruses overexpressing OPA1 (Ad-OPA1), OPA1 with inactivated acetylation (Ad-OPA1-K792R), and OPA1 with activated acetylation (Ad-OPA1-K792Q) (Fig. 7A–C; Supplementary Fig. S3A–C). Western blotting results showed that, compared to the corresponding control, LPS-stimulated MH-S cells transfected with Ad-OPA1-K792R, the reduction in OPA1 acetylation attenuated the expression levels of iNOS and enhanced the expression levels of CD206 and Arg-1 (Fig. 7D, F–H), whereas the opposite results were obtained in LPS-stimulated MH-S cells transfected with Ad-OPA1-K792Q (Supplementary Fig. S3D, 3F–H).
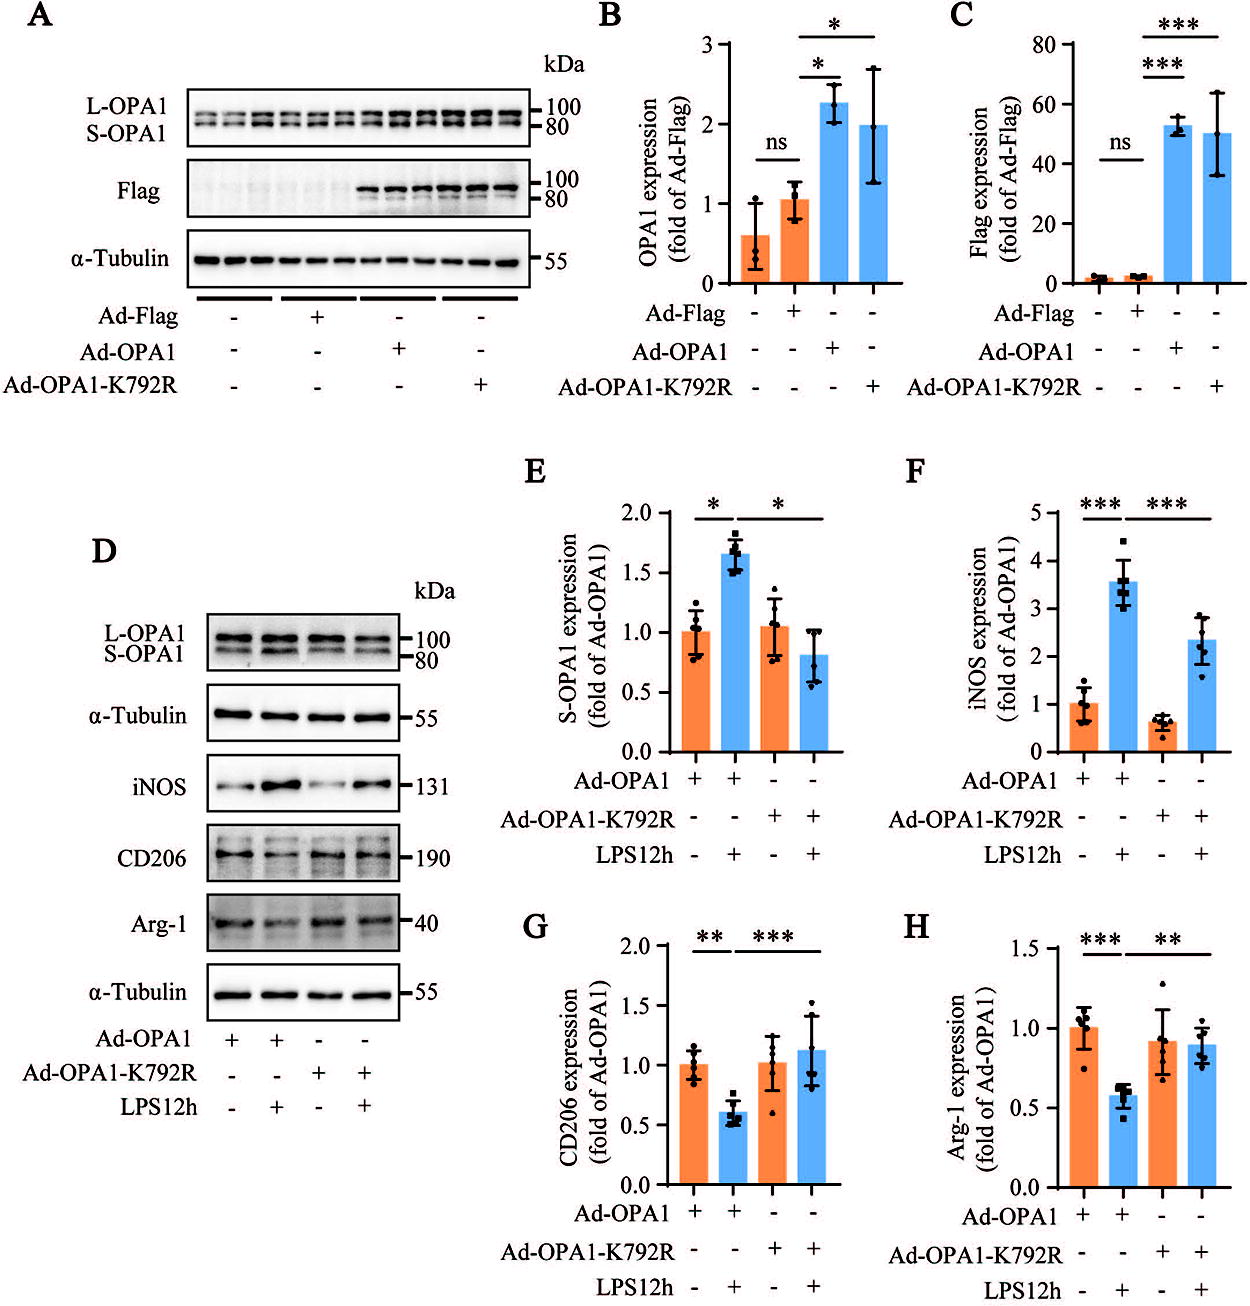
The cleavage of L-OPA1 into S-OPA1 mediates mitochondrial fragmentation (Mishra et al., 2014). Therefore, we analy6.35mmzed whether OPA1-K792 acetylation increased S-OPA1 levels. Western blotting results showed that compared to the Ad-OPA1 transfection group, the S-OPA1 levels in LPS-stimulated MH-S cells transfected with Ad-OPA1-K792R were lower, whereas the S-OPA1 levels in LPS-stimulated MH-S cells transfected with Ad-OPA1-K792Q were higher (Fig. 7D and E; Supplementary Fig. S3D and 3E). This suggests that OPA1-K792 acetylation promotes self-cleavage of L-OPA1 into S-OPA1. Confocal fluorescence images showed that in LPS-stimulated MH-S cells transfected with Ad-OPA1, mitochondria were fragmented, and Cyt C was released from the mitochondria into the cytoplasm, which could be inhibited by Ad-OPA1-K792R transfection (Fig. 8A–C). Conversely, Ad-OPA1-K792Q transfection further aggravated the imbalance in mitochondrial dynamics in LPS-stimulated MH-S cells (Supplementary Fig. S4A–C). These results suggested that OPA1-K792 acetylation caused an imbalance in mitochondrial dynamics by promoting the generation of S-OPA1 from L-OPA1.
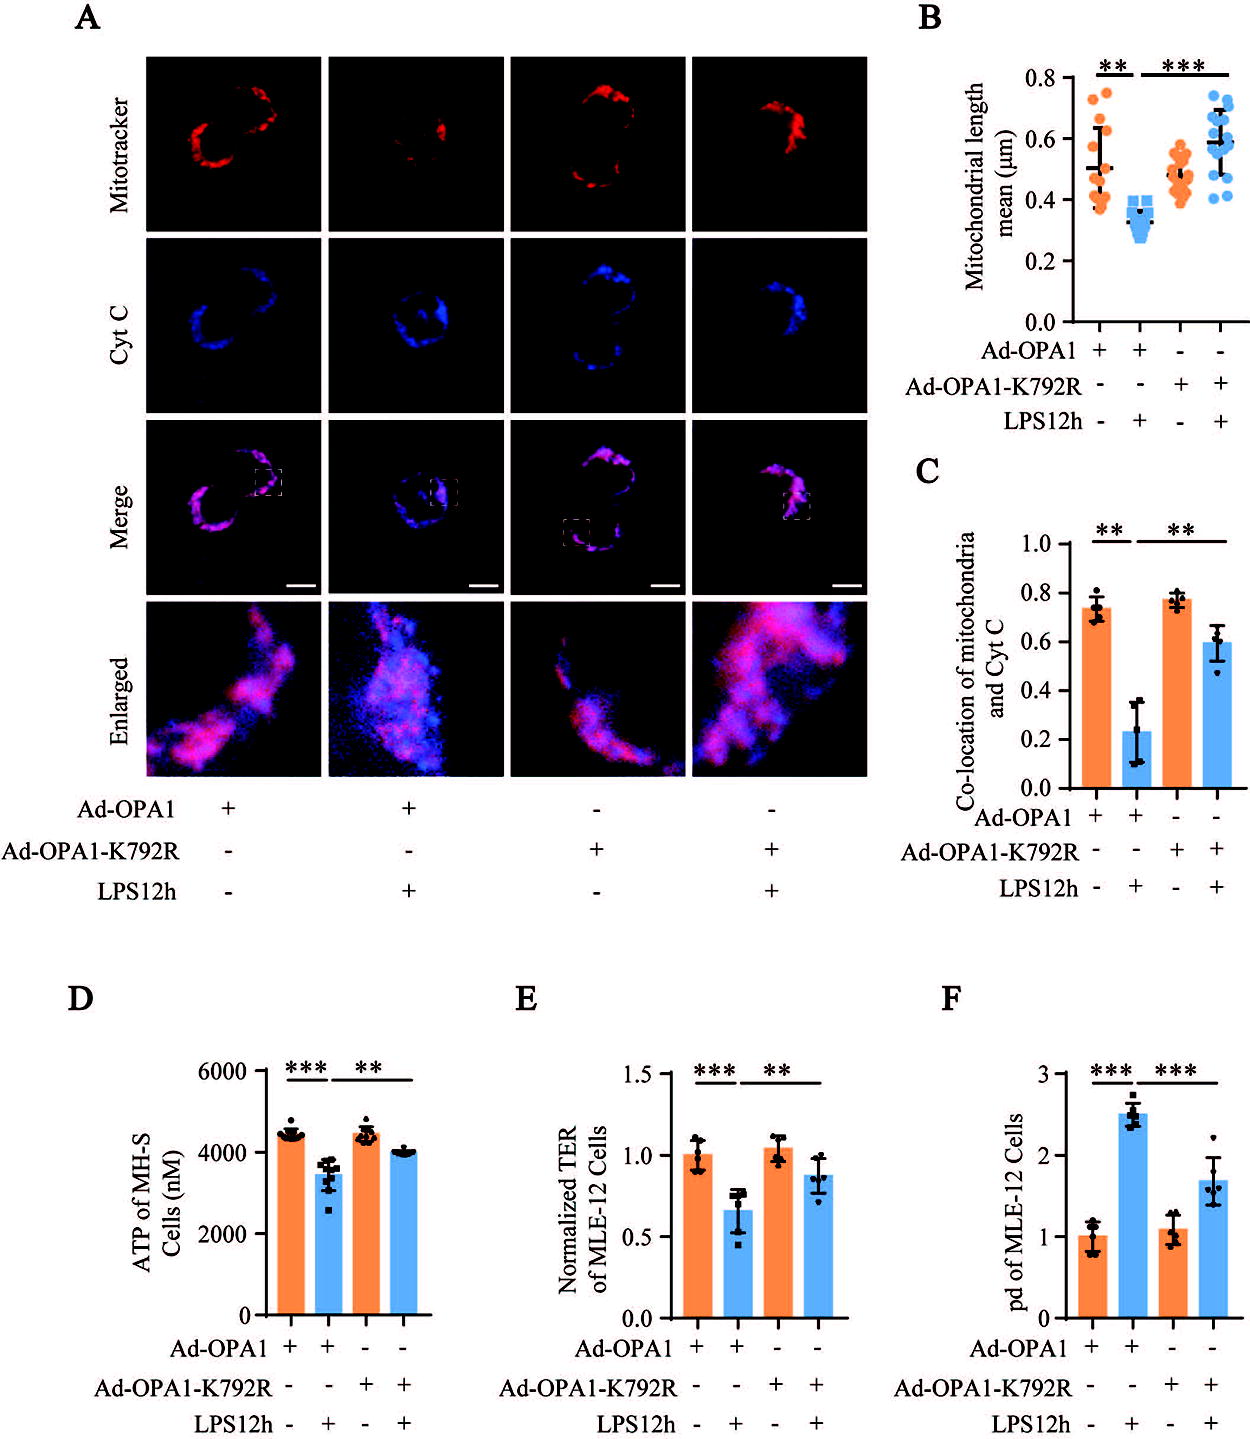
Next, we analyzed adenosine triphosphate (ATP) levels to determine the relationship between OPA1 acetylation and mitochondrial function. The LPS-stimulated MH-S cells transfected with Ad-OPA1 showed higher OPA1 acetylation and lower ATP levels, whereas decreased OPA1 acetylation in the LPS-stimulated MH-S cells transfected with Ad-OPA1-K792R showed lower OPA1 acetylation and higher ATP levels (Fig. 8D). AECs are among the first cells to be destroyed during sepsis-induced ALI and are adjacent to AMs. Therefore, we analyzed whether OPA1-K792 deacetylation in AMs alleviated AEC damage during sepsis. We found that the culture supernatant of LPS-stimulated MH-S cells transfected with Ad-OPA1-K792R increased transepithelial electrical resistance (TER) and decreased the leakage of fluorescein isothiocyanate (FITC)-dextran from MLE-12 cells compared with the corresponding controls (Fig. 8E and F). This suggests that OPA1 deacetylation in AMs protects the barrier function of AECs during sepsis-induced ALI.
OPA1-K792 deacetylation in AMs ameliorates inflammation and lung injury during sepsis
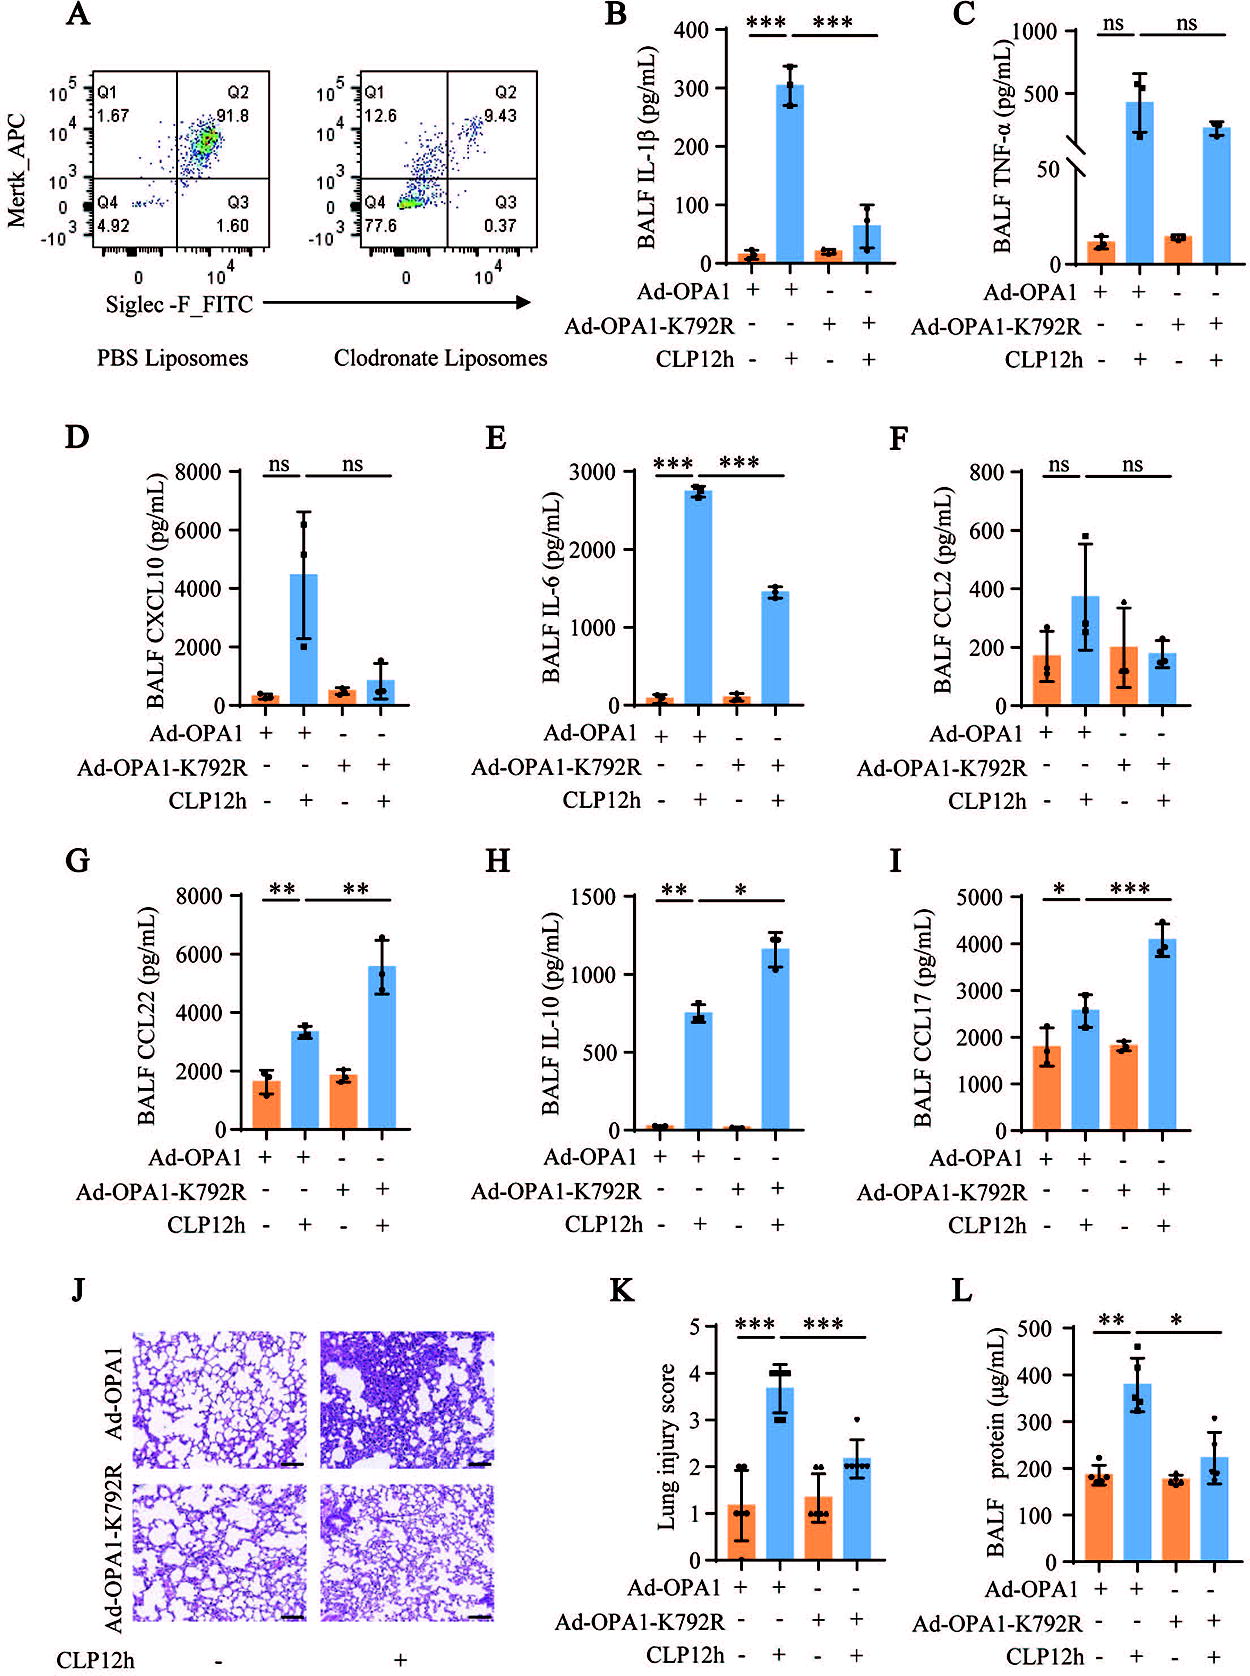
To explore the in vivo effects of altered OPA1-K792 acetylation on AMs during sepsis-induced ALI, adoptive transfer experiments were performed in mice. After depletion of AMs using clodronate liposomes (Fig. 9A), MH-S cells transfected with Ad-OPA1 or Ad-OPA1-K792R were adoptively transferred to the mice. Luminex assay results showed that the levels of IL-1β and IL-6 in the BALF were significantly decreased and the levels of CCL22, IL-10, and CCL17 were significantly increased in the CLP-induced sepsis mouse model where Ad-OPA1-K792R-transfected MH-S cells were adoptively transferred to the mice. The changes in the levels of TNF-α, CXCL10, and CCL2 were consistent with those of IL-1β and IL-6, but were not statistically significant (Fig. 9B–I). Adoptive transfer of Ad-OPA1-K792R-transfected MH-S cells into mice also attenuated CLP-induced lung injury and decreased BALF protein levels in the CLP-induced ALI mouse model (Fig. 9J–L). Taken together, these results show that deacetylation of OPA1 in AMs ameliorated sepsis-induced ALI and inflammation.
Discussion
In this study, we demonstrated that sepsis-induced ALI induced a mitochondrial dynamic imbalance in AMs and polarization of AMs toward the pro-inflammatory M1 macrophage phenotype. These changes were mediated by hyperacetylation of OPA1 caused by SIRT3 inhibition. Furthermore, we demonstrated that the overexpression of SIRT3 deacetylase attenuated sepsis-induced ALI by directly binding to and reducing the acetylation levels of OPA1 (Fig. 10). These data demonstrate that OPA1 acetylation levels regulate the balance of mitochondrial dynamics and polarization of AMs into M1 or M2 macrophage phenotypes during sepsis-induced ALI. Therefore, our data suggest that targeting the SIRT3/OPA1 signaling pathway is a promising therapeutic strategy to combat sepsis-induced lung injury.
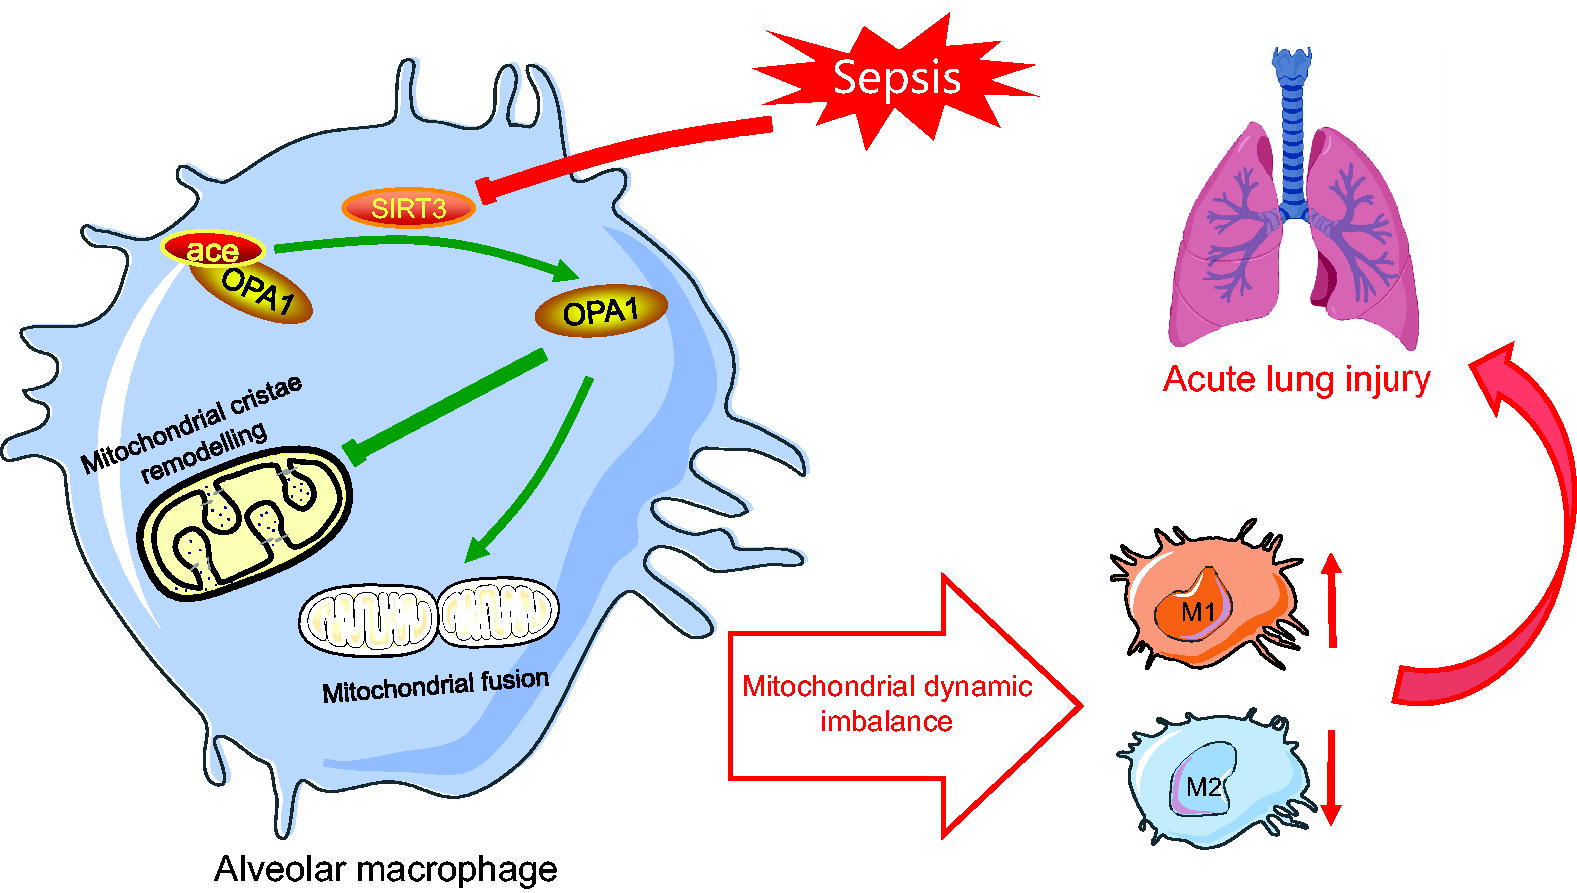
The lungs are the primary target organs that are adversely affected during sepsis (Jia et al., 2021; Park et al., 2019). Despite supportive measures, such as lung-protective ventilation strategies, the mortality rate of patients with sepsis-induced ALI is >30% (Matthay et al., 2019). AMs colonize the alveoli, account for 80% of the alveolar resident cells, and are the main resident phagocytic cells in the lungs (Li et al., 2016). Macrophage phenotypic plasticity is tightly regulated by the pathological microenvironment that initiates or resolves inflammatory responses. Overactivation of M1 macrophage polarization causes tissue damage, whereas the delay in polarization toward M2 macrophages may impair tissue repair (Novak and Koh, 2013). M1 macrophages express pro-inflammatory cytokines and chemokines such as IL-1β, TNF-α, CXCL10, IL-6, CCL2, IL-12, CD80, CD86, and iNOS. In contrast, M2 macrophages produce anti-inflammatory cytokines and chemokines such as CCL22, IL-10, CCL17, transforming growth factor-beta, CD206, and Arg-1 (Kadomoto et al., 2021; Zhang et al., 2021). Previous studies have reported that in isoproterenol-induced myocardial fibrosis tissue, the expression of M1 biomarkers is increased, and the M2 biomarker expression is decreased (Cheng et al., 2020). Our study demonstrated that AM polarization shifted significantly toward the M1 macrophage phenotype in a CLP-induced ALI mouse model and in LPS-stimulated MH-S cells. Both M1 and M2 biomarkers were elevated in the BALF of mice in the CLP12h group compared with those in the sham group, whereas M1 macrophage biomarkers continued to increase in the BALF of mice in the CLP24h group as M2 markers were reduced. This suggests that clinical intervention during the early stages of sepsis may be more effective in exerting anti-inflammatory effects and promoting tissue repair functions in M2 macrophages.
Previous studies have shown that the mitochondrial shape (rod versus fragmented) and structure of the mitochondrial cristae are determined by factors that regulate the mitochondrial dynamic equilibrium (mitochondrial fission versus mitochondrial fusion) and play a significant role in defining the status of mitochondrial function (Eisner et al., 2018). Our study revealed imbalanced mitochondrial dynamics in AMs isolated from the BALF of CLP-induced septic mice and LPS-stimulated MH-S cells. The imbalanced mitochondrial dynamics in AMs are characterized by hyperfragmentation of the mitochondria, disorganized structure of the mitochondrial cristae, and widened cristae lumen. Mitochondrial cristae remodeling leads to the release of mitochondrial resident Cyt C into the cytoplasm and activates apoptotic signals. AM apoptosis further enhances inflammation and promotes progression of ALI (Fan and Fan, 2018; Li et al., 2016). This suggests that maintaining the mitochondrial dynamic equilibrium is critical for inhibiting the polarization of AMs toward the pro-inflammatory M1 phenotype. During acetaminophen-induced liver injury, increased mitochondrial fusion restores mitochondrial function by inhibiting the release of pro-inflammatory factors from macrophages (Guo et al., 2022). Our previous study demonstrated a positive correlation between the DRP1 phosphorylation-mediated mitochondrial fragmentation and pro-inflammatory cytokine production in LPS-treated Kupffer cells (Zhang et al., 2022). In the present study, we demonstrated that in sepsis-induced ALI, the mitochondrial dynamic equilibrium maintained by OPA1 deacetylation reversed the pro-inflammatory polarization of AMs and ameliorated lung injury.
We demonstrated that SIRT3 ameliorates sepsis-induced ALI by promoting mitochondrial dynamic equilibrium and inhibiting the polarization of AMs into the pro-inflammatory M1 macrophage phenotype. Furthermore, the pharmacological inhibition of SIRT3 by 3TYP significantly exacerbated lung injury in a mouse model of sepsis. These results suggest that SIRT3 regulates the mitochondrial dynamic equilibrium in AMs. SIRT3 is one of seven sirtuin family members in mammals and is localized to the mitochondria. SIRT3 is a major mitochondrial protein deacetylase because mitochondrial protein acetylation is significantly elevated in SIRT3 knockout mice (Ji et al., 2022). However, few studies have investigated the mechanistic role of mitochondrial protein deacetylation by SIRT3 during sepsis-induced ALI. In cardiomyocytes, SIRT3 directly binds to and deacetylates OPA1, thereby enhancing the GTPase activity and improving mitochondrial function (Samant et al., 2014). We demonstrated that SIRT3 directly interacts with OPA1 in LPS-stimulated MH-S cells and that overexpression of SIRT3 reduces the levels of OPA1 acetylation. Therefore, targeting the SIRT3/OPA1 signaling pathway is a potential therapeutic strategy to alleviate mitochondrial dysfunction in human diseases, including sepsis-induced ALI.
OPA1 is a conserved GTPase belonging to the dynamin family, which mediates mitochondrial fusion. Loss of OPA1 impairs mitochondrial fusion, alters cristae structure, and increases cellular apoptosis (Baker et al., 2019; Varanita et al., 2015). L-OPA1 is cleaved into S-OPA1 under several stress conditions (Rainbolt et al., 2016). Several studies have shown that L-OPA1 alone is sufficient for mitochondrial fusion, whereas S-OPA1 alone is incapable of forming fusion machinery or plays a minor role in mitochondrial fusion (Adaniya et al., 2019; Del Dotto et al., 2017; Lee et al., 2017). Our data showed that the levels of S-OPA1 increased gradually over time when MH-S cells were treated with LPS. The acetylation of OPA1 induces apoptosis in rat cardiomyocytes by promoting the cleavage of L-OPA1 into S-OPA1 (Signorile et al., 2017). Moreover, acetylation of the K926 and K931 residues decreases the GTPase activity of OPA1 and induces mitochondrial dysfunction (Samant et al., 2014). These studies suggested that OPA1 acetylation regulates mitochondrial dynamics by promoting self-cleavage. Our data show that the acetylation levels of OPA1 were significantly increased in LPS-stimulated MH-S cells, thereby increasing the expression of S-OPA1. Moreover, SIRT3 overexpression decreased OPA1 acetylation.
The mitochondrial morphology depends on the integrity of the C-terminal coiled-coil domain of OPA1 (Cipolat et al., 2004). The K792 acetylation site investigated in the current study resides in the C-terminal region of OPA1 and is highly conserved across mammalian species. Our data suggest that the OPA1-K792 amino acid site is a reversible PTM lysine site in LPS-stimulated MH-S cells and that its acetylation can be inhibited by SIRT3. Therefore, we mimicked the deacetylated or acetylated status of OPA1 in AMs by transfecting cells with adenovirus containing mutant OPA1 (Ad-OPA1-K792R or Ad-OPA1-K792Q) and found that decreased acetylation of OPA1 during sepsis-induced ALI reduced the self-splicing of OPA1, restored mitochondrial dynamics equilibrium, and suppressed the polarization of AMs into pro-inflammatory M1 macrophages. Moreover, our study showed that acetylation of K792 in OPA1 plays an important regulatory role during sepsis-induced ALI. However, how OPA1 acetylation links mitochondrial dynamics to the polarization of AMs into M1 or M2 macrophage phenotypes remains unclear. Recent evidence suggests that OPA1 is a key metabolic driver of macrophage function (Sánchez-Rodríguez et al., 2023). OPA1 knockout macrophages showed a defective tricarboxylic acid (TCA) cycle, including accumulation of TCA cycle metabolic intermediates such as succinate and α-ketoglutarate, which promoted imbalance in the M1/M2 macrophage polarization (Sánchez-Rodríguez et al., 2023). Therefore, we speculated that OPA1 acetylation regulates the polarized phenotype of AMs through metabolic reprogramming. However, this aspect should be investigated in future studies.
The status of mitochondrial function can be inferred based on intracellular ATP levels. Our study showed that ATP levels in LPS-stimulated MH-S cells were increased by OPA1 deacetylation and restoration of mitochondrial dynamic equilibrium. The interaction between AMs and AECs is critical for maintaining lung homeostasis. The excessive release of inflammatory cytokines from M1 macrophages impairs the barrier function of AECs (Baloglu et al., 2022; Tao et al., 2023). Our data demonstrated that reduced OPA1 acetylation in AMs protects the barrier function of AECs. Few studies have focused on OPA1 acetylation, mainly on mitochondria in the heart and kidneys (Adaniya et al., 2019; Guan et al., 2021; Benigni et al., 2019). Our study demonstrated, for the first time, that OPA1 acetylation regulates mitochondrial dynamics and polarization of AMs during sepsis-induced ALI and may serve as a plausible target for precision therapy.
In conclusion, our data show significant changes in mitochondrial dynamics and alterations in the polarization phenotype of AMs during sepsis-induced ALI. Furthermore, our data showed that SIRT3-induced deacetylation of OPA1 regulated the mitochondrial dynamic equilibrium and reduced lung inflammation by decreasing the polarization of AMs to the M1 macrophage phenotype, thereby ameliorating lung injury. This study highlights a novel regulatory mechanism underlying sepsis-induced ALI and provides a plausible therapeutic target for the treatment of this disease.
Material and Methods
Animal studies
We obtained 6–8-week-old C57/BL mice weighing 20–22 g from the Animal Lab Center of Southern Medical University, Guangzhou, China. All the animal experiments were conducted in strict accordance with the recommendations from the Guide for the Care and Use of Laboratory Animals (US National Institutes of Health, Bethesda, MD, USA). The study protocol was approved by the National Institutional Animal Care and Ethics Committee of Southern Medical University.
In vivo drug administration
We used a mouse model of CLP-induced sepsis. CLP was performed as described previously (Sun et al., 2021). Mice were intraperitoneally injected with vehicle or 5 mg/kg 3TYP (Zeng et al., 2016) 1 h before the CLP procedure. The vehicle formulation included 5% dimethyl sulfoxide (DMSO), 40% Polyethylene glycol 300 (PEG 300), 5% Tween 80, and 50% double-distilled water according to the manufacturer’s recommendations.
To explore the effects of OPA1 acetylation on the mitochondrial dynamics and polarization of AMs in the CLP-induced ALI model, we generated Ad-OPA1 and acetylation-inactivated OPA1-K792R [lysine (K) was mutated to arginine (R); Ad-OPA1-K792R] (GeneChem Co. Ltd., Shanghai, China). MH-S cells (cat. No. CRL-2019; ATCC) were transfected with Ad-OPA1 or Ad-OPA1-K792R and adoptively transferred to the trachea of AM-depleted mice 30 min before CLP.
According to the experimental design, mice were sacrificed at different time intervals after CLP, and lung tissues, BALF, and primary AMs were obtained for further investigation.
In vitro cell culture
In the present study, we used the MH-S cell line, mouse AEC line (MLE-12) (cat. No. CRL-2110; ATCC, Manassas, VA, USA), and mouse primary AMs to perform in vitro cellular experiments. MH-S cells were cultured in RPMI-1640 medium (Gibco, Billings, MT, USA) containing 10% fetal bovine serum (FBS) (Gibco) and 0.05 mM 2-mercaptoethanol in a humidified chamber maintained at 37°C with 5% CO2. MH-S cells were stimulated with 1 µg/mL LPS (cat. No. L2630; Sigma-Aldrich, St. Louis, MO, USA) to generate the cellular sepsis model. MLE-12 cells were cultured in RPMI-1640 medium containing 10% FBS in a humidified chamber maintained at 37°C with 5% CO2. MH-S cells were transduced with the negative control virus (Ad-Flag), Ad-SIRT3 (GeneChem Co. Ltd), Ad-OPA1, Ad-OPA1-K792R, acetylation-activated OPA1-K792Q [lysine (K) was mutated to glutamine (Q); Ad-OPA1-K792Q; GeneChem Co. Ltd], control small interfering RNA (NC), or siSIRT3 (GenePharma) for 48 h before LPS stimulation. MH-S cells were treated with DMSO or 3TYP and LPS for 12 h. The polarized phenotype, mitochondrial dynamics, protein expression, protein acetylation levels, and ATP levels of macrophages were observed. To determine whether macrophage polarization and the subsequent release of cytokines from the MH-S cells affected the function of the MLE-12 cells, the supernatants of the MH-S cells in each group were collected as conditioned medium and incubated for 12 h with the MLE-12 cells. Subsequently, the TER and FITC-dextran leakage in MLE-2 cells were analyzed.
Isolation of primary AMs
Primary AMs were isolated using the BALF method as described previously (Nayak et al., 2018). Mice were anesthetized, sterilized, and placed on an operating table in the supine position. The abdominal and thoracic cavities of the mice were opened, and the inferior vena cava was incised for exsanguination. Next, 10 mL of ice-cold phosphate-buffered saline (PBS) was injected into the right ventricle to flush the circulating blood cells until the lung tissue was visually blanched. The trachea was exposed by incising the skin and neck muscles. A small incision (<2 mm) was made in the trachea to insert an endotracheal tube. After securing the tracheal tube with sutures, bronchoalveolar lavage (BAL) buffer (Dulbecco’s phosphate-buffered saline (DPBS) + 1 mM EDTA; Gibco) was slowly injected into the lungs using a 1-mL syringe and collected after 5 s. The lavage was repeated 7–9 times. The collected BAL buffer with cells was centrifuged at 350×g for 10 min at 4°C to pellet the cells. The cell pellet was resuspended in RPMI-1640 medium containing 10% FBS and seeded in a Petri dish. The medium was changed after culturing the cells in a humidified incubator maintained at 37°C with 5% CO2 for 2 h. The purity of the AMs obtained by the BAL method was >90% as measured by flow cytometry. Primary AMs were isolated from the mice belonging to all groups and used for further experiments.
Cell transfections
MH-S cells were incubated with adenoviruses or siRNA in serum-free RPMI-1640 medium for 3–6 h in a humidified incubator at 37°C with 5% CO2. Subsequently, the cells were rinsed and cultured in fresh RPMI-1640 with 10% FBS for 48 h before LPS stimulation. The overexpression efficiency of OPA1 and SIRT3 and the knockdown efficiency of SIRT3 in transfected MH-S cells were determined by Western blotting.
Western blotting
MH-S cells were homogenized by ultrasound and lysed by incubation in radioimmunoprecipitation assay (RIPA) lysis buffer containing 1× protease inhibitor cocktail (Selleck Chemicals, Houston, TX, USA). To detect the acetylation levels of the target proteins, a 1× deacetylase inhibitor cocktail (Beyotime, Jiangsu, China) was added to the RIPA lysis buffer for protein extraction. The protein lysates were then centrifuged for 15 min at 12,000 rpm at 4°C, and the soluble protein supernatants were separated from the cellular debris. Equal amounts of total cellular protein were separated using sodium dodecyl sulfate polyacrylamide gel electrophoresis (SDS-PAGE) and transferred onto polyvinylidene difluoride membranes. The membranes were then blocked by incubating with 5% bovine serum albumin (BSA) for 1 h and incubated overnight at 4°C with the primary antibodies. Membranes were then incubated with secondary antibodies at room temperature for 1 h. The blots were developed using an enhanced chemiluminescence reagent, and target protein concentrations were estimated from the protein bands. The primary antibodies used for Western blot analyses were as follows: α-tubulin (1:5000; RM2007; Beijing Ruikang, Beijing, China), CD206 (1:1000; 60143-1; Proteintech, Rosemont, IL, USA), iNOS (1:1000; ab178945; Abcam, Cambridge, UK), Arg-1 (1:1000; 66129-1; Proteintech), OPA1 (1:1000; 612607; BD Pharmingen, San Diego, CA, USA), SIRT3 (1:1000; ab189860; Abcam), MFN1 (1:1000; #14739; Cell Signaling Technology, Danvers, MA, USA), MFN2 (1:1000; 12186; Proteintech), Flag-tag (1:5000; RM1002; Beijing Ruikang), and pan-acetylated lysine (1:1000; PTM102; PTM Biolabs, Chicago, IL, USA). The Ac-OPA1 (K792) antibody (1:1000) was customized by BIORESEARCH (contract No. R10173). The secondary antibodies used were as follows: goat anti-mouse IgG-HRP (1:5000; RM3001; Beijing Ruikang) and goat anti-rabbit IgG-HRP (1:5000; RM3002; Beijing Ruikang).
Immunoprecipitation and coimmunoprecipitation assays
We washed 30 μL of Protein A + G magnetic beads (P2108; Beyotime) in 700 μL Tris-buffered saline (TBS) in a clean EP tube on a magnetic stand. The beads were washed thrice. Then, 2 μg of target protein antibody (anti-OPA1 or pan-acetylated lysine antibody) was incubated for 1 h at room temperature in the EP tube with 700 μL TBS and washed with magnetic beads on a flip mixer. The supernatant was then removed. Next, the protein samples were incubated with the antibody-tagged magnetic beads overnight at 4°C with inversion. The next day, after discarding the supernatant, 100 μL of loading buffer was added to the beads and heated to 100°C for 5 min. Western blotting was performed to determine the proteins captured by the antibody-tagged beads. The primary antibodies used were anti-pan-acetylated lysine, anti-MFN1, anti-MFN2, anti-SIRT3, anti-OPA1, and anti-Ac-OPA1 (K792). Protein expression levels were standardized relative to the IgG-HC levels.
Histology analysis
H&E staining of mouse lung tissues was performed to determine the histological changes. Briefly, fresh lung cortical tissue was sectioned, fixed in 10% formalin for approximately 24 h, and stained with H&E. The stained sections were observed and photographed under an optical microscope (LSM780; Carl Zeiss, Thuringia, Germany). Lung damage was scored by two professional pathologists blinded to the experimental protocol and experimental groups. Histological assessment of lung damage includes proteinaceous debris in the alveolar space, alveolar septal thickening, and alveolar congestion (Chimenti et al., 2020; Shah et al., 2021). The scoring criteria were as follows: 0, no damage; 1, ≤10% damage; 2, 11%–25% damage; 3, 26%–45% damage; 4, 46%–75% damage; and 5, ≥76% damage.
Measurement of BALF protein concentrations
The total protein concentration in BALF was determined using a Bradford Protein Assay Kit (GBCBIO Technologies, Guangdong, China). Protein standards were prepared with BSA in PBS (0–500 µg/mL). Then, 20 µL of the standard protein solutions or BALF samples were incubated with 200 µL of the reagent solution for 10 min. The absorbance was measured at 595 nm. The concentrations of the BALF samples were measured using a standard protein curve.
TEM
Primary AMs were cryosectioned in 2.5% glutaraldehyde for 1 h and washed with PBS for 2 days. The samples were then fixed in 1% osmic acid, dehydrated using ethanol and acetone gradients, embedded in epoxy resin, and cut into ultrathin sections. The sections were then stained with uranyl acetate and lead citrate and then observed and photographed under an H-7500 TEM (Hitachi, Tokyo, Japan). The width of the mitochondrial cristae lumen was measured in randomly selected fields for each group at 40,000× magnification using Nano Measurer software. Representative fields are shown at 80,000× magnification.
Immunofluorescence
The cells were incubated in Petri dishes with a medium containing 100 nM MitoTracker Red CMXRos (M7512; Invitrogen, Carlsbad, CA, USA) for 20 min. Then, the cells were fixed with 4% paraformaldehyde for 15 min, permeabilized with 0.5% Triton X-100 for 15 min, blocked with 5% BSA for 1 h, and incubated overnight at 4°C with the primary antibodies. The following day, cells were incubated with fluorescent-tagged secondary antibodies at room temperature for 1 h. Nuclei were stained with 4', 6-diamidino-2-phenylindole. The cells were washed with PBS at each staining step. Stained cells were observed under a confocal laser scanning microscope (LSM 780; Carl Zeiss) using a 63× oil immersion objective. ImageJ software was used to assess the colocalization of Cyt C with the mitochondria and the fluorescence intensity of iNOS/Arg-1. The mean mitochondrial length was estimated using Fiji software. The primary antibodies used for the immunofluorescence analysis were anti-iNOS (1:500), anti-Arg-1 (1:100), and anti-Cyt C (1:500; ab133504; Abcam). The following fluorescent-tagged secondary antibodies were used: Alexa Fluor 488-conjugated goat anti-rabbit IgG (H + L) (1:200; RS23220; ImmunoWay, Plano, TX, USA), Alexa Fluor 594-conjugated goat anti-mouse IgG (H + L) (1:200; RS23410; Immunoway), and AMCA-conjugated Affinipure goat anti-rabbit IgG (H + L) (1:200; SA00010-2; Proteintech).
Flow cytometry
The primary AM samples were stained in the dark at 4°C for 20 min with four specific antibodies as follows: PE-conjugated anti-CD64 (139304; BioLegend, San Diego, CA, USA), APC-conjugated anti-mer tyrosine kinase (151508; BioLegend), APC/FireTM-conjugated anti-CD11b (101261; BioLegend), and FITC-conjugated anti-sialic acid-binding Ig-like lectin F (155503; BioLegend), as previously described (Svedberg et al., 2019). The samples were washed and immediately analyzed using a flow cytometer (BD Biosciences, Franklin Lakes, NJ, USA). The results were analyzed using FlowJo software (v10.6.2).
Luminex assay
We used a customized Luminex 8-factor assay to detect cytokine or chemokine levels in BALF samples. The lungs of the mice were lavaged once with 1 mL of bronchoalveolar lavage buffer. The lavage fluid was collected and centrifuged at 350×g for 10 min at 4°C to pellet the cells. The supernatant was then centrifuged at 3000×g for 10 min at 4°C. The supernatant was collected and analyzed using a Luminex assay.
ATP assay
The CellTiter-LumiTM Steady Plus Luminescent Cell Viability Assay Kit (Beyotime) was used to measure the total cellular ATP concentration in MH-S cells, according to the manufacturer’s instructions.
AEC barrier function assays
The TER of the monolayer of MLE-2 cells was determined using an STX2 electrode and an EVOM2 meter, according to the manufacturer’s protocol (World Precision Instruments, Sarasota, FL, USA). Briefly, 200 μL of MLE-12 cells (1 × 10⁵ cells/mL) were seeded onto the upper chamber of the Transwell. The resistance values of multiple Transwell inserts in the experimental group were sequentially measured. The mean resistance values were expressed in Ωcm2 after subtracting the value of the blank cell-free filter.
The barrier function of the MLE-2 cell monolayer was analyzed by measuring the FITC-dextran leakage of MLE-2 cells, as previously described (Wu et al., 2020). Briefly, MLE-12 cells were grown in the upper chamber of transwell membranes and incubated with FITC-labeled dextran (1 mg/mL) for 1 h. The samples were collected from the upper and lower chambers. The concentration of the FITC-labeled dextran was determined using an HTS 7000 microplate reader. The permeability of epithelial monolayer was evaluated by calculating the permeability coefficient of dextran (Pd) as follows: Pd = [A]/t × 1/A × V/[L], where [A] refers to the dextran concentration in the bottom chamber, “t” denotes the time in seconds, “A” refers to the membrane area in cm2, “V” denotes the bottom chamber volume, and [L] refers to the concentration of dextran in the upper chamber.
Adoptive transfer of murine AMs
The adoptive transfer assay was performed as previously described, according to the manufacturer’s recommendations (Cohen et al., 2018; Moser et al., 2018). The anesthetized mice were administered 100 μL of clodronate liposomes (macrophage scavenger; LIPOSOMA, Amsterdam, NL) for 2 consecutive days, whereas the control mice were administered equal amounts of the PBS liposomes. After 48 h, MH-S cells (2 × 10⁵ cells resuspended in 50 μL PBS) transfected with Ad-OPA1 (overexpressing adenovirus) or Ad-OPA1-K792R (acetylation inactivated adenovirus) were injected into the trachea of the macrophage-depleted mice via tracheal intubation. After 30 min, mice were subjected to CLP for subsequent experiments.
Statistical analyses
Statistical analyses were performed using SPSS statistical software (ver. 23.0; IBM, Armonk, NY, USA). The data are presented as mean ± SEM. Differences between groups were analyzed using the two-tailed unpaired Student’s t-test, one-way analysis of variance with the least significant difference test, or Dunnett’s T3 test for post hoc comparisons. Statistical significance was set at p < 0.05.
Footnotes
Acknowledgments
The authors thank the Shanghai Universal Biotech Co., Ltd. (China) for technical assistance. The authors also thank Run Lin and Rui Duan from the Southern Medical University for helpful advice regarding the flow cytometry experiments.
Authors’ Contributions
J.W., Q.H., and Z.C. conceived and designed the study and supervised the research project. M.S., Y.L., G.X., J.Z., R.L., S.A., R.C., Y.Y., and J.W. performed the experiments. M.S. and J.W. analyzed the data. Z.Z. and Z.D. provided scientific advice. Y.Z. and H.H. collected the experimental samples. M.S. and S.A. prepared the figures. M.S., J.W., and Z.C. interpreted the results of the experiments. M.S., J.W., and Q.H. wrote the article. All the authors read and approved the final article for publication.
Data Availability
The data presented in this article and the Supplementary Information files are available from the authors upon request.
Author Disclosure Statement
The authors declare that there are no conflicts of interest.
Funding Information
This work was supported by funds from the
Supplementary Material
Supplementary Figure S1
Supplementary Figure S2
Supplementary Figure S3
Supplementary Figure S4
Supplementary Figure S5
Abbreviations Used
References
Supplementary Material
Please find the following supplemental material available below.
For Open Access articles published under a Creative Commons License, all supplemental material carries the same license as the article it is associated with.
For non-Open Access articles published, all supplemental material carries a non-exclusive license, and permission requests for re-use of supplemental material or any part of supplemental material shall be sent directly to the copyright owner as specified in the copyright notice associated with the article.
