




Abstract
Aims:
Diabetic nephropathy (DN) is a major cause of end-stage renal disease, with no therapeutic interventions available to control its progression. Ferroptosis, an iron-dependent regulated cell death characterized by lipid peroxidation, plays a pivotal role in the pathogenesis of DN. Human umbilical cord mesenchymal stem cells (hUCMSCs) are an effective treatment modality for DN; however, the underlying mechanism of action remains unclear. The aim of the present study was to investigate whether hUCMSCs alleviate DN via inhibiting ferroptosis and its molecular mechanisms in type 2 diabetic mice and high-glucose and palmitate-stimulated human renal tubular epithelial cell (HK-11) models.
Results:
Our findings revealed that hUCMSCs improved the renal structure and function and tubular injuries. HUCMSC treatment can inhibit ferroptosis by decreasing iron content, reducing reactive oxygen species, malondialdehyde and 4-hydroxynonenal generation, decreasing the expression of positive ferroptosis mediator transferrin receptor 1 and long-chain acyl-CoA synthetase 4, and enhancing the expression of negative ferroptosis mediators (i.e., ferritin heavy chain, glutathione peroxidase 4, and system Xc-cystine/glutamate reverse transporter). Mechanistically, hUCMSC treatment inhibited c-Jun N-terminal kinase (JNK) and Kelch-like ECH-associated protein 1 (KEAP1) activation while increasing the expression of nuclear factor erythroid 2-related factor 2 (NRF2). Furthermore, pretreatment of HK-11 cells with NRF2 siRNA, the JNK inhibitor SP600125, or the JNK agonist anisomycin demonstrated the regulation of the JNK/KEAP1/NRF2 signaling pathway by hUCMSCs.
Innovation and Conclusion:
HUCMSCs inhibit ferroptosis in DN via the JNK/KEAP1/NRF2 signaling pathway, providing a new perspective and scientific evidence for treating DN. Antioxid. Redox Signal. 42, 807–826.

Introduction
Diabetic nephropathy (DN) is a serious microvascular complication of diabetes mellitus that leads to end-stage renal disease (ESRD) (Naaman and Bakris, 2023). The incidence proportion of ESRD due to DN increased from 22.1% in 2000 to 31.3% in 2015 worldwide. Furthermore, the global annual incidence of ESRD among patients with DN increased from 375.8 to 1,016.0/million during 2000–2015 (Cheng et al., 2021). Patients with DN require maintenance dialysis or renal transplantation once they progress to ESRD. However, these treatments are associated with significant economic and psychological burdens for patients and their families and consume substantial medical resources.
Traditionally, DN has been thought to be dominated by glomerular involvement. Indeed, glomerular lesions appear as the disease course advances, followed by progressive proteinuria and renal impairment (Liang et al., 2020). However, given that the diabetic proximal tubule exhibits morphological and metabolic alterations before the onset of glomerular alterations, a “tubule-centric” view has progressively developed (Gilbert, 2017), highlighting the potential integral role of the proximal tubule in DN pathogenesis (Coughlan et al., 2016; Hasegawa et al., 2013). Additionally, proximal tubular injury is closely associated with proteinuria, decreased renal function, podocytes, extensive glomerular injury, and long-term kidney prognosis (Nihalani and Susztak, 2013; Vallon and Thomson, 2020; Zhao et al., 2021). Therefore, while not neglecting the glomerulus, focusing on the proximal tubules in diabetes mellitus to understand the pathophysiology and discover therapeutic options seems prescient.
Renal proximal tubular epithelial cells are rich in mitochondria due to their high energy metabolic requirements (Yao et al., 2022); mitochondrial dysfunction and injury promote oxidative stress, inducing ferroptosis (Li et al., 2023). Ferroptosis is a novel iron-dependent form of cell death that involves the reactive oxygen species (ROS)-mediated accumulation of lethal levels of lipid peroxides (Li et al., 2020). The critical mediators of ferroptosis are the system Xc-cystine/glutamate antiporter (xCT) and glutathione peroxidase 4 (GPX4) (Yang and Yang, 2022), low levels of which reduce intracellular cystine concentrations and glutathione (GSH) synthesis and lipid peroxide degradation, respectively. These changes lead to the intracellular accumulation of lipid peroxide and promote ferroptosis (Kim et al., 2021). DN initiation and development are influenced by tubular epithelial cell ferroptosis (Feng et al., 2021; Shen et al., 2022). Therefore, targeted inhibition of ferroptosis may be a novel strategy to ameliorate DN.
Mesenchymal stem cells (MSCs) have homing and paracrine abilities, allowing them to migrate to damaged tissues and release extracellular vesicles, growth factors, chemokines, and cytokines to repair tissue damage (Doorn et al., 2012); their potential therapeutic role in diabetes and its complications has attracted considerable research attention. Human umbilical cord MSCs (hUCMSCs), derived from human umbilical cord tissue, are the preferred MSCs for transplantation due to their low immunogenicity, high regenerative capacity, and paracrine potential (Yin et al., 2020). In preclinical studies, hUCMSCs improve inflammatory responses (Wang et al., 2023) and attenuate oxidative damage in the context of DN (Nie et al., 2021). HUCMSCs are also involved in regulating ferroptosis (Cheng et al., 2024; Feng et al., 2022). However, the effects of hUCMSCs on ferroptosis in DN remain unclear.
In the present study, we aimed to explore the nephroprotective effects of hUCMSCs on type 2 diabetic mice and high glucose- and palmitate-stimulated human renal tubular epithelial cells (HK-11) models and reveal its underlying mechanisms. Our findings strongly confirmed that hUCMSCs attenuated diabetic kidney injury by inhibiting ferroptosis, in which the c-Jun N-terminal kinase (JNK)/Kelch-like ECH-associated protein 1 (KEAP1)/nuclear factor erythroid 2-related factor 2 (NRF2) signaling pathway played a significant role. Overall, this study proposed a new perspective for investigating the potential of hUCMSCs in DN treatment.
Results
hUCMSCs attenuate kidney injury in type 2 diabetic mice
A mouse model of type 2 diabetes was established to investigate the nephroprotective effects of hUCMSCs (Fig. 1A). After a prolonged period of hyperglycemic stimulation, the diabetic mice exhibited markedly lower body weight (Fig. 1B), visibly hypertrophied kidneys (Fig. 1C), and significantly higher blood glucose (Fig. 1D), urinary albumin/creatinine ratio (uACR; Fig. 1E), serum creatine (SCr; Fig. 1F), and blood urea nitrogen (BUN; Fig. 1G) levels than the control mice (all p < 0.001). Although hUCMSC treatment significantly improved blood glucose (p < 0.001), body weight (p < 0.01), uACR (p < 0.01), and SCr (p < 0.001) levels in diabetic mice (DM group), the kidney hypertrophy index and BUN were not significantly changed after treatment (p > 0.05). Light microscopy revealed that the DM group exhibited glomerular hypertrophy, mesangial stromal proliferation, degeneration of renal tubule vacuoles, loss of the brush border, detachment of tubular epithelial cells and bare basement membrane, and conspicuous deposition of tubulo-interstitial collagen fibers compared with the control mice (Fig. 1H). Transmission electron microscopy (TEM) revealed notable thickening of the tubular basement membrane (TBM) in the DM group compared with the control group (p < 0.001, Fig. 1I). However, hUCMSCs significantly attenuated these pathological changes.
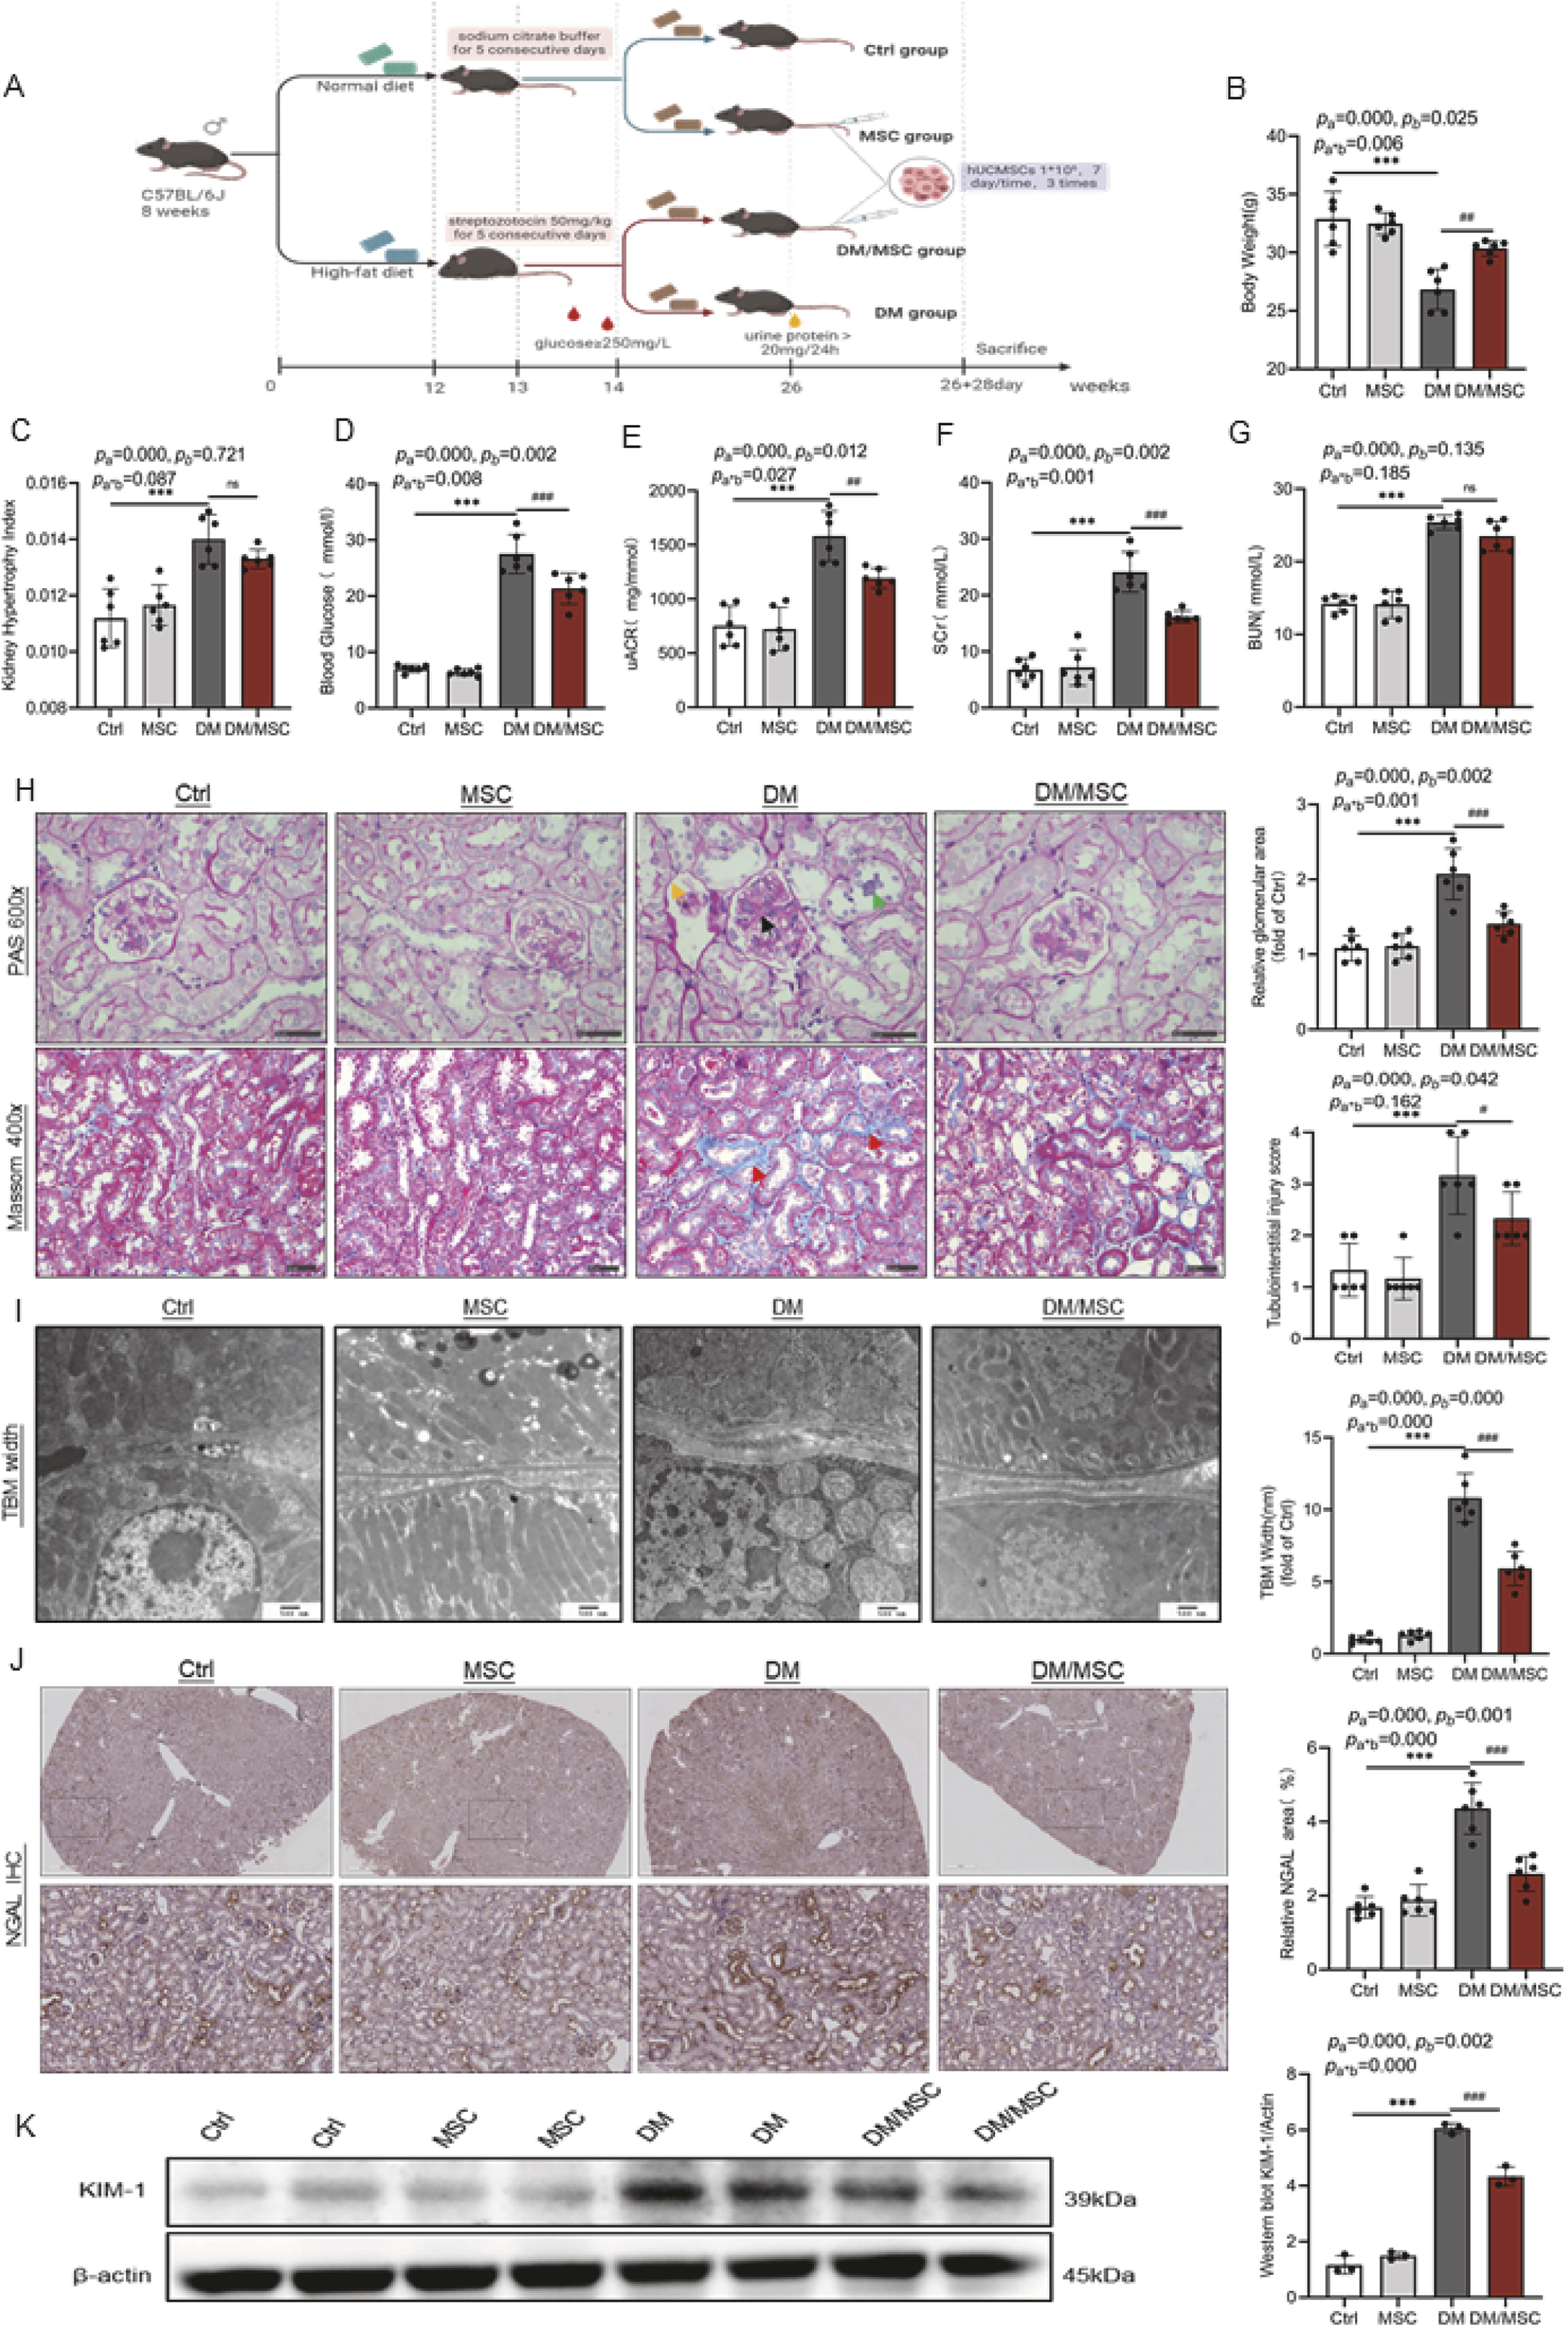
Renal tubular damage was further evaluated by assessing the expression levels of neutrophil gelatinase-associated lipocalin (NGAL) and kidney injury molecule-1 (KIM-1)—markers of renal tubular injury. Immunohistochemical (IHC) staining and western blotting showed that the expressions of both proteins were significantly elevated in the DM group and downregulated after hUCMSC treatment (Fig. 1J and K).
hUCMSCs inhibit renal ferroptosis in type 2 diabetic mice
Ferroptosis is characterized by mitochondrial damage (Xie et al., 2016). Thus, TEM was used to observe the mitochondria of renal tubular epithelial cells in mice (Fig. 2A). The mitochondrial volume was reduced in the DM group, accompanied by increased mitochondrial membrane density and broken cristae. However, hUCMSC treatment improved the mitochondrial volume, cristae structure, and membrane density. The iron levels in the kidneys of the DM group were significantly higher than those in the control group (p < 0.001, Fig. 2B); furthermore, Prussian blue staining revealed significant iron deposition in the renal tubules of diabetic mice (Fig. 2C), which was relieved by hUCMSC treatment (p < 0.001). Additionally, substantial levels of ROS were produced in the kidneys of DM group; hUCMSC treatment decreased ROS levels (Supplementary Fig. S1). Moreover, the levels of lipid peroxidation products, including malondialdehyde (MDA) and 4-hydroxynonenal (4HNE), were significantly increased, whereas antioxidant GSH level was significantly decreased in the DM group compared with the control group (all p < 0.001, Fig. 2D–F). However, hUCMSCs reduced 4HNE and MDA abundance while increasing that of GSH in diabetic mice. Western blotting analysis revealed that the transferrin receptor 1 (TFR-1) and long-chain acyl-CoA synthetase 4 (ACSL4) proteins—positive indicators of ferroptosis—were elevated in the DM group compared to the control group (all p < 0.001). Conversely, the expressions of GPX4, ferritin heavy chain 1 (FTH1), and xCT—negative indicators of ferroptosis—were decreased (all p < 0.001). However, the protein levels were reversed after hUCMSC treatment (Fig. 2H). IHC staining of renal tissues indicated that hUCMSCs inhibited ACSL4 expression and enhanced xCT and GPX4 protein levels (Fig. 2G).

Expression of ferroptosis-related genes in renal cells
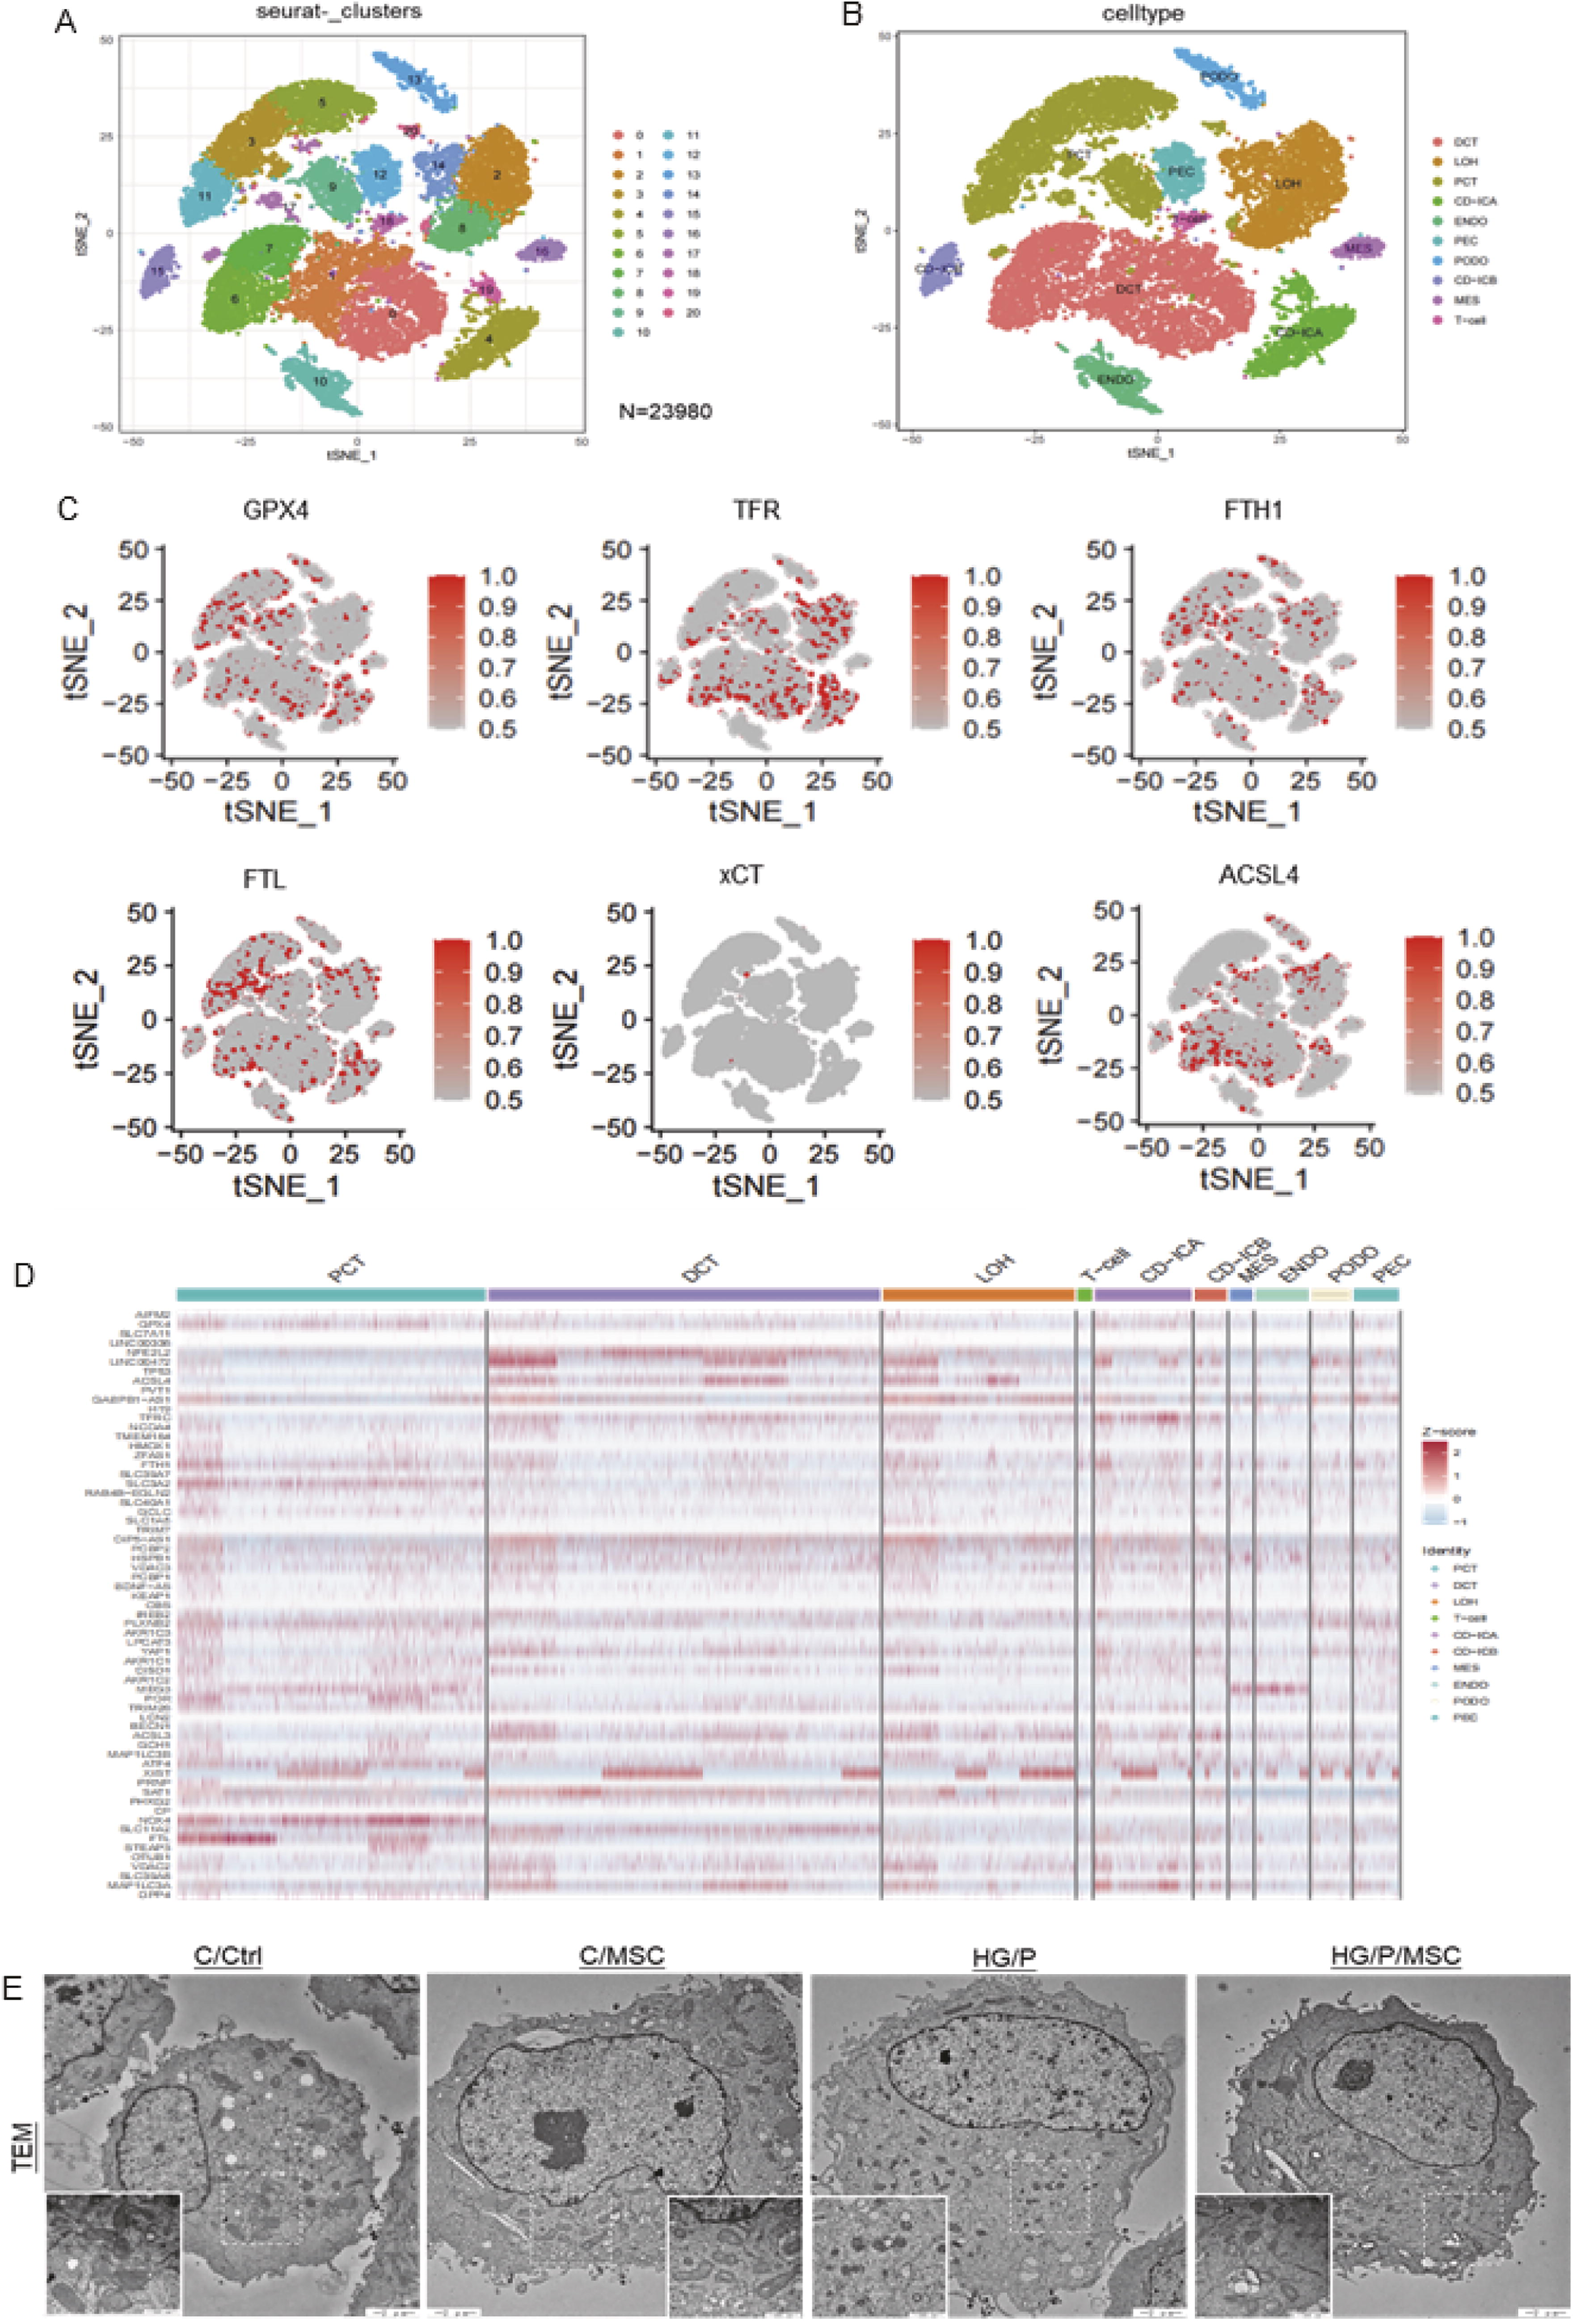
The single-cell dataset GSE131882 from the Gene Expression Omnibus (GEO; www.ncbi.nlm.nih.gov/geo/) genomics database was used to explore the expression of ferroptosis-related genes across different nephrocytes in renal tissues. This dataset was derived from three non-diabetic control patients and three patients with early DN using single-nucleus RNA sequencing (snRNA-seq) data. Following data filtering, 23,980 nuclei were analyzed (Fig. 3A). Using established markers, nine kidney cell types and one immune cell type (Fig. 3B) were manually identified. This included proximal tubular convoluted cells, cells of the loop of Henle, distal convoluted tubule cells, collecting duct intercalated cell type A/B, endothelial cells, podocytes, mesangial cells, parietal epithelial cells, and T lymphocytes. Subsequently, ferroptosis hallmark genes were mapped to the cellular expression matrix to generate plots for each gene (Fig. 3C). Ferroptosis-related genes such as GPX4, FTH1, ferritin light chain (FTL), and xCT showed predominant expression in renal tubular cells, rather than in podocytes or mesangial cells. To further assess whether ferroptosis primarily occurs in renal tubular cells, ferroptosis-related genes scoring higher than three scores on genecards (https://www.genecards.org/) were compiled, and the heatmaps were generated (Fig. 3D). The genecard and the heatmap results were consistent with the cellular expression matrix results.
hUCMSCs reduce ferroptosis in HK-11 cells
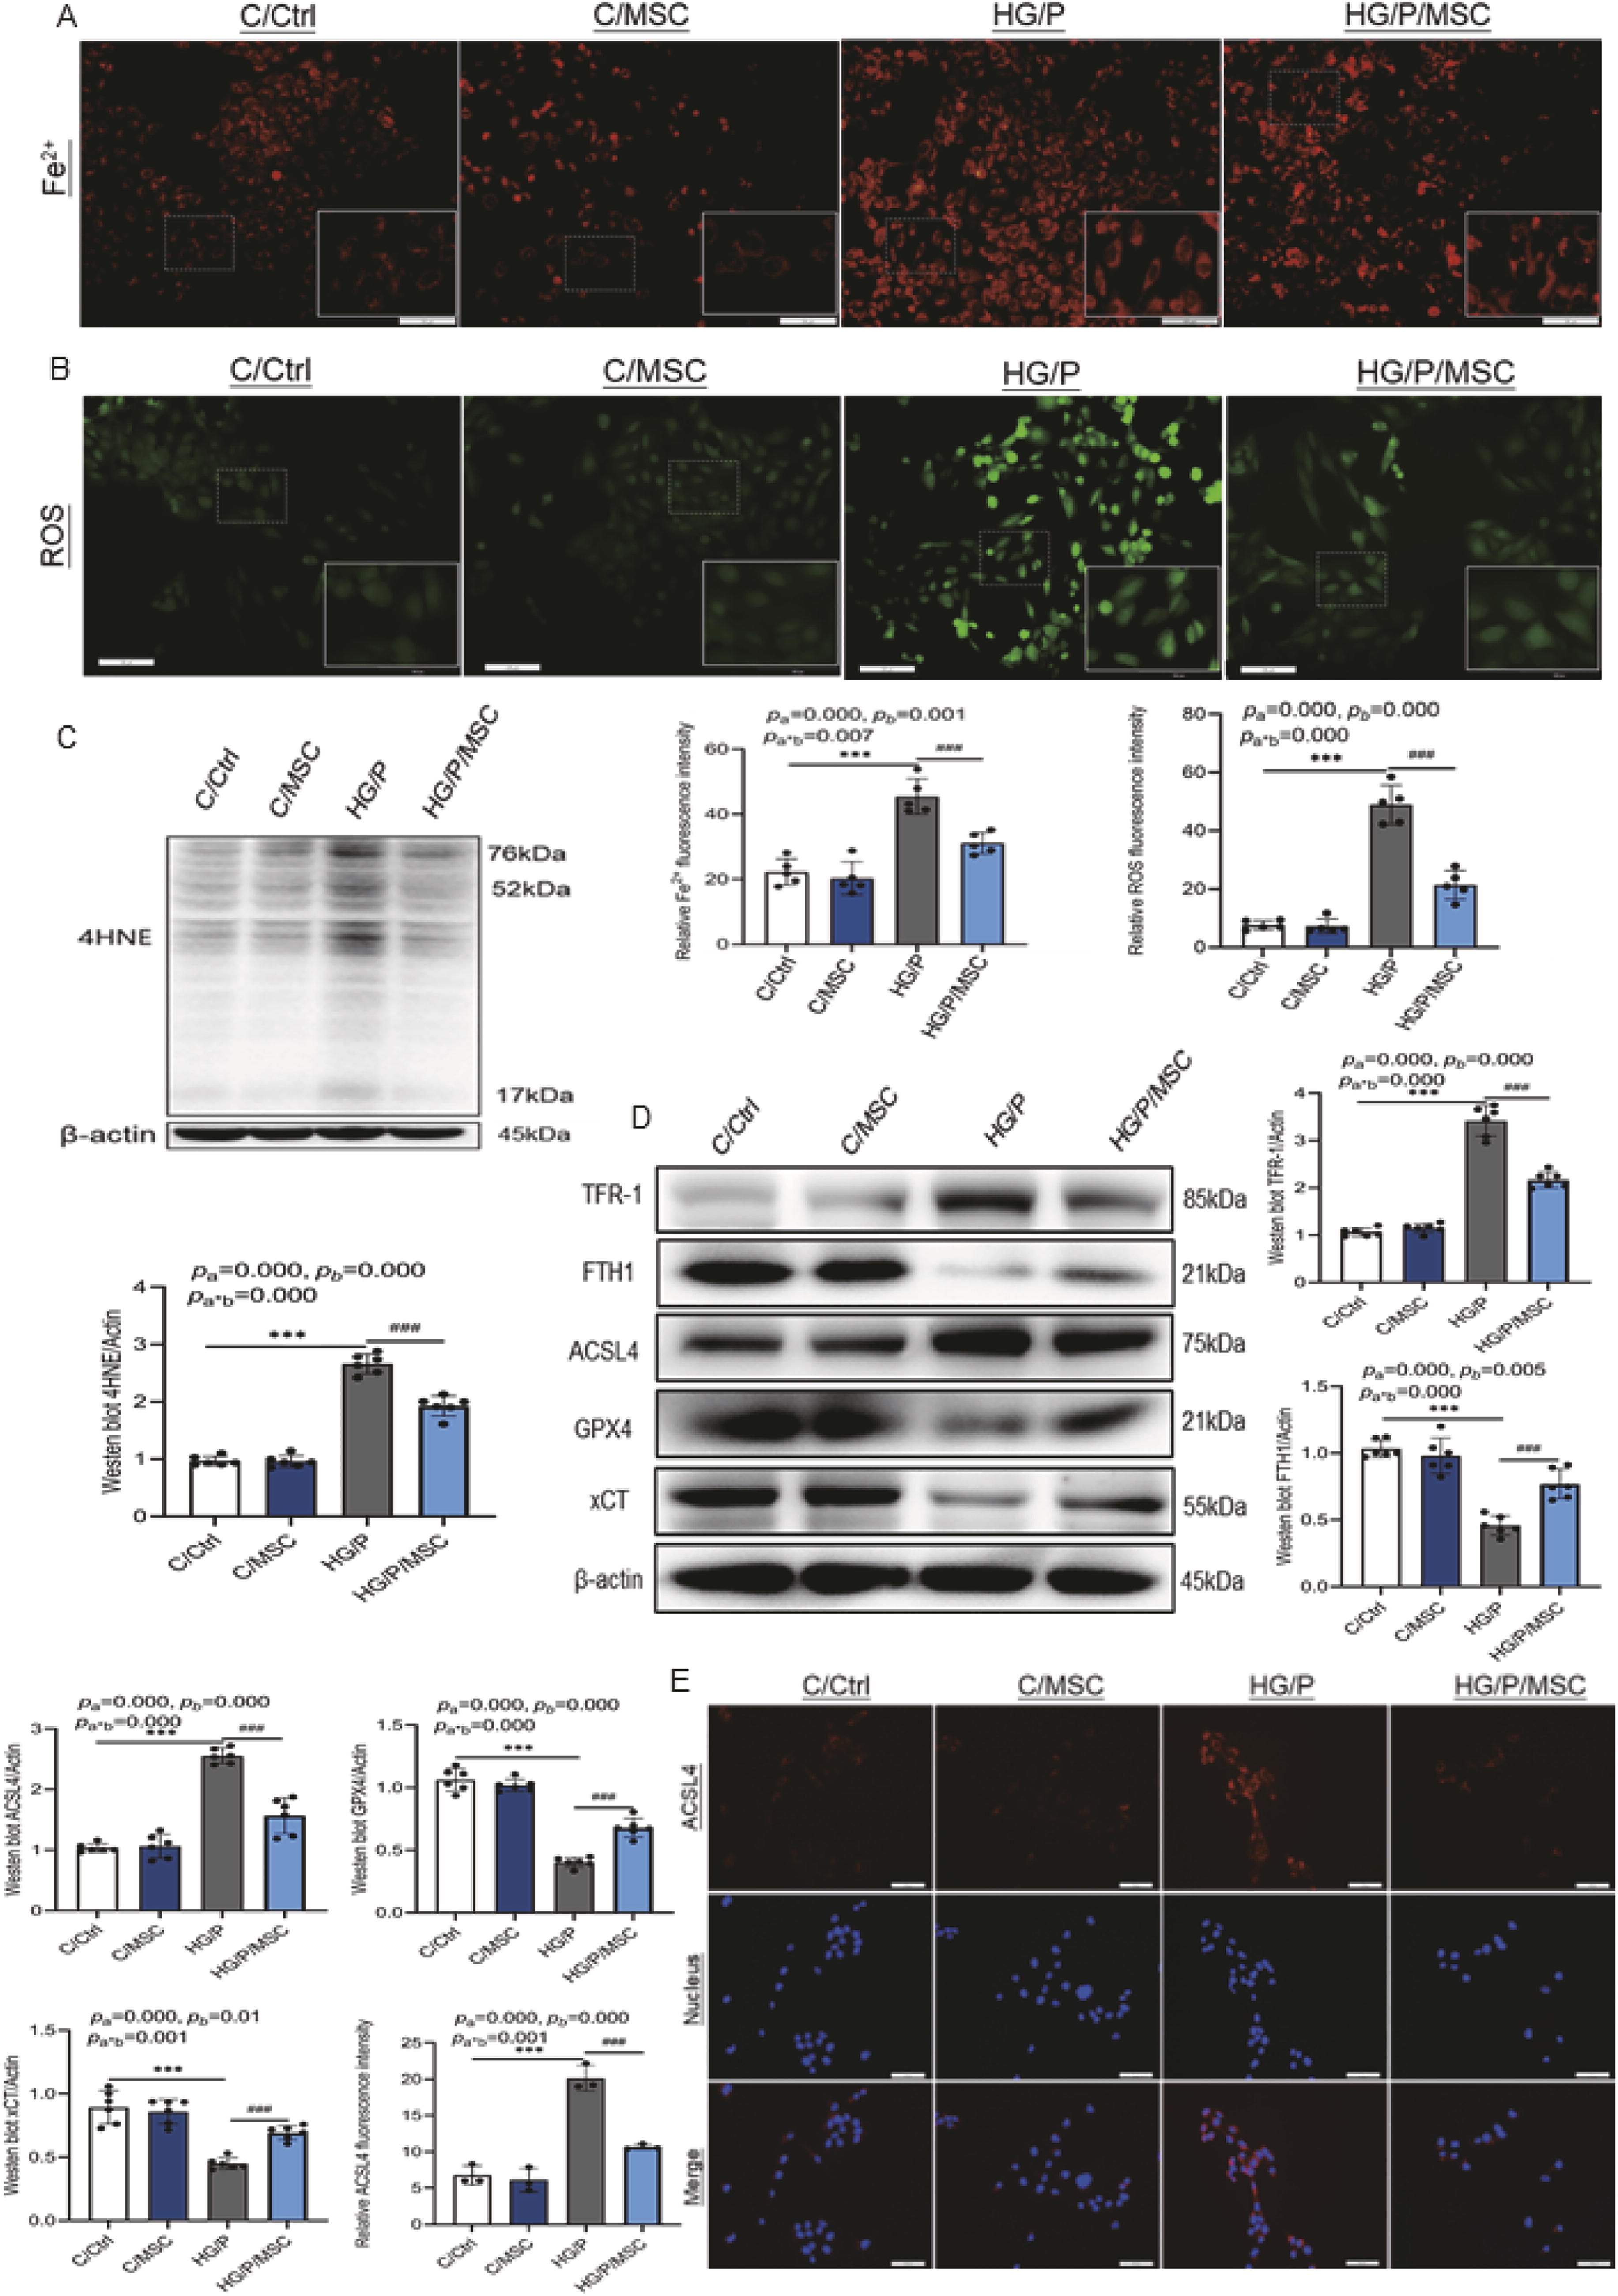
Therefore, HK-11 cells were employed for ex vivo studies to verify the effects of hUCMSCs on ferroptosis. When stimulated by high glucose and palmitate (HG/P), the mitochondria of HK-11 cells exhibited significant atrophy, increased mitochondrial membrane density, and outer mitochondrial membrane rupture (Fig. 3E). However, mitochondrial morphology improved after hUCMSC treatment. The intracellular divalent iron (Fe2+) content was upregulated (Fig. 4A) in the HG/P group compared with normal HK-11 cells (C/Ctrl, p < 0.001). However, hUCMSC treatment decreased Fe2+ levels (p < 0.001). Excessive intracellular Fe2+ can result in elevated ROS levels via the Fenton reaction, leading to lipid peroxidation (Ayala et al., 2014). The ROS and 4HNE levels in the HG/P group were significantly higher than in the C/Ctrl group (p < 0.001, Fig. 4B and C). However, the ROS and 4HNE levels were significantly reduced after hUCMSC treatment. Consistent with the in vivo findings, western blot analysis of different cell specimens (Fig. 4D) and fluorescence densitometry of ACSL4 protein (Fig. 4E) verified that the expression of ferroptosis-related proteins could be modulated via hUCMSC treatment, confirming that hUCMSCs inhibit renal tubular cell ferroptosis.
hUCMSCs enhance the expression of NRF2 and its downstream factors in DN
NRF2 regulates GSH homeostasis, iron metabolism, and lipid metabolism, which may be involved in regulating ferroptosis (La Rosa et al., 2021). Therefore, total NRF2 (tNRF2) and its downstream factor proteins were investigated. The abundance of tNRF2 (p < 0.01), heme oxygenase 1 (HO1; p < 0.001), and NAD(P)H quinone dehydrogenase 1 (NQO1; p < 0.001) were significantly decreased in the DM group compared with the Ctrl group. However, the tNRF2, NQO1, and HO1 levels were significantly higher in the DM/MSC group than in the DM group (all p < 0.001, Fig. 5A). The in vitro studies yielded similar results (Fig. 5B), suggesting that hUCMSCs can activate NRF2 and its downstream factors in DN.

To clarify the specific mechanisms by which hUCMSCs regulate NRF2, the nuclear and cytoplasmic expression of NRF2 protein was assessed in renal tissues and HK-11 cells. The renal tissue’s nuclear NRF2 protein content was significantly higher in the DM/MSC group than in the DM group (p < 0.001, Fig. 5C). However, the renal tissue’s cytoplasmic NRF2 protein expression did not differ significantly between the DM/MSC and DM groups (p > 0.05, Fig. 5C). In vitro results supported these findings (Fig. 5D). Moreover, in the HG/P group, NRF2 protein was predominantly cytoplasmic (Fig. 5E). Conversely, cells in the HG/P/MSC group exhibited higher NRF2 protein levels than the HG/P group (p < 0.001), with NRF2 primarily localized in nuclei (Fig. 5D and E). Therefore, hUCMSCs increased the expression of NRF2 protein and facilitated its translocation to the nucleus.
NRF2 deficiency impairs the inhibitory effect of hUCMSCs on ferroptosis
To further demonstrate the key role of NRF2 in hUCMSC-induced ferroptosis inhibition, HK-11 cells were pretreated with NRF2 siRNA to knock down NRF2. After transfection with NRF2 siRNA, NRF2 was markedly downregulated, indicating successful transfection (Fig. 6A and B). After knocking down NRF2, the expressions of downstream proteins HO1 and NQO1 were significantly suppressed, while hUCMSC treatment failed to upregulate their expression (Fig. 6A, C, and D). The ACSL4 and FTH1 protein levels were higher and lower, respectively, in the s-HG/P group than in the s-C/Ctrl group (all p < 0.001, Fig. 6A, E, and F). In contrast, the GPX4 protein levels were significantly lower after NRF2 siRNA transfection, independent of HG/P status (Fig. 6A and G), indicating that GPX4 is a downstream factor of NRF2. Furthermore, the expressions of ACSL4, FTH1, and GPX4 proteins in the s-HG/P/MSC group did not differ significantly from the s-HG/P group (all p > 0.05), suggesting that hUCMSCs inhibited ferroptosis by activating the NRF2 pathway.

hUCMSCs regulate the JNK/KEAP1/NRF2 signaling pathway
KEAP1 is a key negative regulator of NRF2, while JNK may induce KEAP1 expression (Zhang et al., 2018). In vivo and in vitro studies on JNK and KEAP1 revealed a significant increase in KEAP1 and JNK phosphorylation (pJNK) in DN. However, this effect was inhibited by hUCMSC treatment (Fig. 7A and B). The expressions of KEAP1, pJNK, and JNK in renal tissue were further confirmed via IHC staining (Fig. 7C), confirming that hUCMSCs decrease pJNK and KEAP1 protein levels in the setting of DN.

To elucidate the mechanism by which hUCMSCs regulate NRF2 through inhibiting JNK activation, HK-11 cells were pretreated with the JNK inhibitor SP600125 or JNK agonist anisomycin (Fig. 8A and B). A 48-h SP600125 (10 µM) treatment inhibited pJNK protein expression, whereas anisomycin (0.2 µM) pretreatment increased pJNK protein expression. In the HG/P group, pJNK and KEAP1 expression was increased, accompanied by downregulation of the NRF2 signaling pathway and ferroptosis marker protein GPX4 (Fig. 8A). However, these protein expressions were reversed after intervention with SP600125 (HG/P/SP600125 group) or hUCMSCs (HG/P/MSC group). Following anisomycin treatment (HG/P/anisomycin group), pJNK (p < 0.01) and KEAP1 (p < 0.001) protein levels were further increased, while NRF2 (p < 0.05), HO1 (p < 0.05), NQO1 (p < 0.05), and GPX4 (p < 0.01) protein levels were decreased compared with the HG/P group. Conversely, intervention with hUCMSCs after anisomycin pretreatment (HG/P/anisomycin/MSC group) decreased pJNK (p < 0. 01) and KEAP1 expression (p < 0. 001) and increased NRF2, HO1, NQO1, and GPX4 levels (all p < 0.01) compared with the HG/P/anisomycin group. Hence, modulating the JNK/KEAP1/NRF2 signaling pathway may be the mechanism by which hUCMSCs alleviate ferroptosis.

Discussion
In the current study, hUCMSCs had a potential therapeutic effect on DN. Ferroptosis was found to be involved in the pathogenesis of renal tubular injuries, while hUCMSCs inhibited ferroptosis. With in-depth exploration, hUCMSCs upregulated the expression of NRF2 and its downstream factors, the JNK/KEAP1/NRF2 signaling pathway was identified as a mechanism by which hUCMSCs regulate ferroptosis.
With the recent rapid development of regenerative medicine, several studies have suggested that MSC-based therapy may be an effective strategy for treating DN (Abdel Aziz et al., 2014; Liu et al., 2024; Ni et al., 2015). Most researchers believe that intravenous transplantation of MSCs can improve hyperglycemia in animals with diabetes (Wang et al., 2021; Yin et al., 2022). However, others have reported that the hypoglycemic effect of MSCs is insignificant (Bai et al., 2019; Lang and Dai, 2016). In the current study, the blood glucose levels of diabetic mice decreased significantly after hUCMSC transplantation. This glucose-lowering ability may be associated with the time of MSC transplantation. Transplanting MSCs in the early stage of diabetes may repair damage to pancreatic islet cells, improving the glycemic index. However, in late-stage diabetes, when the pancreatic islet function is destroyed, the MSCs may be unable to repair these cells. Prolonged renal exposure to hyperglycemia can alter kidney morphology and function, leading to renal impairment (Tervaert et al., 2010). In the current study, after hyperglycemic stimulation, diabetic mice exhibited abnormal renal function, including elevated uACR, SCr, and BUN levels. Renal histology suggested glomerular and tubular injury and elevated expression of renal tubular injury proteins, including KIM-1 and NGAL. However, hUCMSC treatment improved these indicators (excluding BUN) and kidney structure damage, indicating a beneficial effect on DN.
Iron overload is detected in the proximal renal tubular lysosomes of patients and mice with diabetes (Li et al., 2020); a low-iron diet or the administration of iron-chelating agents delays DN progression in rats (Matsumoto et al., 2013). However, the previse mechanism(s) by which excess iron accelerates DN progression remains unclear. In 2012, ferroptosis was proposed to provide a new perspective for exploring the pathogenesis and therapeutic strategies of DN (Dixon et al., 2012). Circulating iron enters cells via TFR-1 and localizes in the nuclear endosome. Subsequently, Fe3+ is reduced to Fe2+, which is stored in unstable iron pools and ferritin (Chen et al., 2024). Increased iron and TFR-1 content and decreased FTH1 levels lead to excessive accumulation of Fe2+, promoting the production of large amounts of ROS via the Fenton reaction (Torti and Torti, 2002). Overproduction of ROS induces lipid peroxidation in phospholipid-containing cell membranes. Activated ACSL4 esterifies free polyunsaturated fatty acids that are beneficial to the organism and are transferred to membrane phospholipids through lysophosphatidylcholine acyltransferase 3. The ACSL4 is then oxidized to toxic lipid peroxides (Chen et al., 2023). Cells typically synthesize the antioxidant GSH by exchanging glutamate and cystine via xCT; GPX4 then reduces lipid hydroperoxides to nontoxic lipid hydroxyl derivatives in a GSH-dependent manner. This blocks harmful lipid peroxide-triggered ferroptosis (Conrad and Friedmann Angeli, 2015). However, during ferroptosis, xCT is functionally disrupted, depleting GSH to prevent GPX4 from exerting its normal antioxidant capacity (Wang et al., 2020). Abundant evidence has demonstrated that ferroptosis participates in diabetic kidney injury (Li et al., 2024; Mu et al., 2024; Wu and Huang, 2024). In the current study, the expressions of ferroptosis-related positive genes were elevated in patients with DN. These genes were predominantly expressed in renal tubular cells, as evidenced by genomics and single-cell sequencing analyses of normal controls and patients with early-stage DN (Fig. 3C and D). Based on these findings, the inhibitory effects of hUCMSCs on ferroptosis were investigated in a mouse model of type 2 diabetes and HG/P-stimulated HK-11 cells. The in vivo and ex vivo studies revealed decreased FTH1 levels, increased TFR-1 abundance and iron and ROS levels, and accumulated lipid peroxides (ACSL4, MDA, and 4HNE). In contrast, GSH, GPX4, and xCT, which have antioxidant effects, were decreased. These results suggest that ferroptosis is involved in DN progression. However, after hUCMSC treatment, the iron and TFR-1 levels decreased, FTH1 levels increased, and MDA, 4HNE, and ACSL4 levels decreased. In contrast, the expressions of GSH, xCT, and GPX4 proteins increased, suggesting that hUCMSCs inhibited ferroptosis.
However, the molecular mechanism underlying the inhibition of ferroptosis by hUCMSCs was unknown. Previous studies have reported that ferroptosis is inseparable from oxidative stress, whereas NRF2 can regulate several antioxidant genes (Baird and Yamamoto, 2020). Under physiological conditions, NRF2 can bind to and complex with KEAP1 in the cytoplasm. Subsequently, KEAP1 targets NRF2 for ubiquitination and proteasomal degradation, maintaining low NRF2 signaling levels. However, stimulated by oxidative stress, NRF2 is weakly bonded to KEAP1, reducing the ubiquitination of NRF2 and increasing its protein abundance. NRF2 is further translocated to the nucleus, where it interacts with antioxidant-responsive elements to promote the transcription of their downstream genes (Yamamoto et al., 2018). Several target genes of NRF2 mediate the regulation of ferroptosis initiation, including iron/metal, intermediate, and GSH synthesis/metabolism (Vomhof-Dekrey and Picklo, 2012; Kasai et al., 2018). Therefore, NRF2 activation may be an essential molecular mechanism for regulating ferroptosis by hUCMSCs. The results of the current study suggest that hUCMSCs upregulate NRF2, promote its translocation to the nucleus, and increase the expression of its downstream factors, HO1 and NQO1. Further knockdown of NRF2 confirmed the critical role of NRF2 in regulating ferroptosis by hUCMSCs.
JNK—a member of the mitogen-activated protein kinase family—is involved in regulating the NRF2 signaling pathway (Wang et al., 2024; Wu et al., 2023). JNK may be an upstream regulator of the NRF2-binding protein, KEAP1, as 36 c-Jun-binding sites have been identified in the promoter region of the mouse Keap1 gene (Jaspar Database). JNK inhibits NRF2 through the induction of KEAP1 (Zhang et al., 2018). Therefore, the expressions of JNK and KEAP1 were measured in DN, and the associated effects of hUCMSCs were investigated. JNK was activated, and KEAP1 protein expression was elevated in the contex of DN, whereas hUCMSCs decreased pJNK and KEAP1 levels (Fig. 7). To further elucidate whether hUCMSCs exert their effects by regulating the JNK/KEAP1/NRF2 signaling pathway, HK-11 cells were treated with the JNK inhibitor SP600125 or JNK agonist anisomycin. SP600125 inhibited the activation of the KEAP1 protein and induced the upregulation of the NRF2 signaling pathway in HK-11 cells stimulated with HG/P. In contrast, anisomycin further upregulated the expression of KEAP1 and inhibited the NRF2 signaling pathway in HK-11 cells in the HG/P state. These results suggest that JNK can induce KEAP1 expression and inhibit NRF2 signaling. However, compared with the HG/P/anisomycin group, HG/P/anisomycin combined with hUCMSC treatment reduced the expression of pJNK and KEAP1 and activated the NRF2 signaling pathway (Fig. 8). Hence, hUCMSCs regulate the JNK/KEAP1/NRF2 pathway. Overall, these findings support the potential therapeutic role of hUCMSCs for preventing DN and renal tubular cell ferroptosis. The JNK/KEAP1/NRF2 signaling pathway was identified as the molecular mechanism of the effects of hUCMSCs.
However, this study has certain limitations. First, we did not perform an in vivo dose comparison of a single injection of hUCMSCs, failing to indicate whether hUCMSC treatment exerts a dose-dependent and long-term effect. Second, this study used hUCMSCs as a system for transplantation to illustrate the beneficial effects of MSCs without further exploring the main components of their effects. Finally, including certain glucose-lowering drugs as controls would have demonstrated the dual protective glucose-lowering and renal protective effects of hUCMSCs.
Materials and Methods
An electronic laboratory notebook was not used.
Isolation, culture, and characterization of hUCMSCs
Clinical-grade hUCMSCs were supplied by Jilin Tuohua Biological Co., Ltd. (Siping, China, Institutional Review Board number 2020001). Umbilical cord tissue was obtained from fetuses delivered via cesarean section. Umbilical cords were ground into a suspension, inoculated into 75-cm2 culture flasks, inverted, and incubated at 5% CO2. The following day, 5 mL of serum-free stem cell culture medium (NC0103, YOCON, Beijing, China) was added to the umbilical cord fragments, and the culture media was changed every 72 h thereafter. When cells began to protrude from the edge of the tissue block, and the rate of cell fusion exceeded 80%, 0.25% trypsin was added to achieve digestion, and the cells were passaged at a ratio of 1:3. The cells’ growth status and confluence were good (Supplementary Fig. S2A).
After 21 days of stimulation with lipid-inducing fluid, Oil red O staining was performed, and lipid droplet formation was visible (Supplementary Fig. S2B). The cells were cultured with osteogenic-inducing fluid for three weeks; Alizarin red staining revealed calcified nodules (Supplementary Fig. S2C), suggesting that the hUCMSCs could differentiate into osteoblasts. Alcian blue staining was performed after 21 days of induction with a chondrogenic-inducing fluid, and chondrocytes were observed (Supplementary Fig. S2D).
Flow cytometry revealed cellular expression of CD73, CD90, and CD105; however, CD14, CD19, CD34, CD45, CD31, and HLA-DR expressions were not observed (Supplementary Fig. S2E), meeting the international identification standards for hUCMSCs (Dominici et al., 2006). HUCMSCs have been certified by the National Institute of Food and Drug Administration (Report Nos. SH201301098, SH201301175, SH201301317, SH201500350, SH201500351, SH201500477, SH201701982, and SH201701983).
Animal studies
The animal experiments reported in this study were approved by the Ethics Committee of Jilin University (Project title: Mechanism of activation of NRF2 by hUCMSCs to ameliorate oxidative damage in DN. Approval number: SYXK2018-0001. Date of approval: January 15, 2022).
Seven-week-old male C57BL/6J mice were purchased from the Yise Laboratory Animal Technology Limited Liability Company (Jilin, China). The mice were housed in the Animal Center of Jilin University at 22°C on a 12-h light–dark cycle, with free access to food and water. Mice in the diabetic group were fed a high-fat diet (HFD, 60% energy from fat, 20% energy from protein, Cat. D12492, Jiangsu Xietong Pharmaceutical Bio-engineering Co., Ltd., Jiangsu, China) to establish the mouse model of type 2 diabetes. Mice in the control group were fed a normal diet (ND, 10% energy from fat, 20% energy from protein, Cat. D12450J, Jiangsu Xietong Pharmaceutical Bio-engineering Co.). After 3 months, mice in the diabetic group were administered streptozotocin (S0130, Sigma-Aldrich, St. Louis, MO; dissolved in sodium citrate buffer at pH 4.5; 50 mg/kg/daily intraperitoneal injection for 5 days). The control group mice received an equal amount of sodium citrate buffer (Tang et al., 2021). Thereafter, the mice’s blood glucose levels were measured once daily for 3 consecutive days. A blood glucose level ≥250 mg/dL was used to define diabetes (Wang et al., 2020). After 12 weeks, the urine protein levels were >20 mg/24 h. Mice in the ND group were randomly divided into control mice (Ctrl) and control mice injected with hUCMSCs (MSC), while mice in the HFD group were randomly divided into mice with diabetes (DM) and mice with diabetes injected with hUCMSCs (DM/MSC). Mice in the MSC and DM/MSC groups were treated with fifth-passage saline-suspended hUCMSCs (1 × 10⁶ cells, 0.5 mL; intravenous tail vein injection) every 7 days for up to three injections (Song et al., 2023). The Ctrl and DM groups were injected with equal doses of cell-free saline. All mice were anesthetized with pentobarbital (30 mg/kg) and sacrificed 7 days after the last treatment to harvest the kidney tissue, urine specimens, and blood (via the orbital vein). The technicians in this study were blinded to group assignment and outcome assessment.
Biochemical analyses
The blood glucose levels were measured using Accu Chek test strips (07124155, Roche, Basel, Switzerland). The SCr and BUN levels were measured using commercially available kits (C011-2-1 and C013-2-1, respectively, Nanjing Jiancheng Bioengineering Institute, Nanjing, China). At the end of the study period, urine samples were obtained and centrifuged at 4°C for 15 min. Then, the supernatant was collected, and a fully automatic biochemical machine (015062, DIRUI HC-900, Jilin, China) was used to measure the urinary microalbumin and creatinine levels to determine the uACR (mg/mmol).
Renal histological evaluation
Kidney tissues were fixed in 10% formalin solution for 24 h, paraffin-embedded, and cut into 4-μm-thick sections. PAS and Masson stains were performed to observe the damage to glomeruli and tubules under a light microscope (BX51, Olympus, Tokyo, Japan). Then, the images were scanned, and profile areas were traced using Image J. software (version 1.52a, National Institutes of Health, New York State, USA). The glomerular area was estimated using the average area of ten glomeruli in each group. The tubulointerstitial injury index was determined by assessing the extent and severity of tubular dilation, atrophy, loss of tubular cells, and interstitial fibrosis. Six images of kidney section in every group were scored as follows: 1 for no injury, 2 for <25%, 3 for 25%–50%, and 4 for > 50% (Tervaert et al., 2010). To prepare ultrathin sections, 1 mm3 of renal tissue was fixed in 2.5% glutaraldehyde (pH 7.4) at 4°C for 24 h. Next, the tissue was fixed with 1% osmium tetroxide for 2–3 h, dehydrated with acetone and ethanol, and embedded in epoxy resin. Slices were prepared using an ultrathin slicing machine at a thickness of 50 nm and stained with 3% uranium acetate and lead citrate. The sections were observed under TEM (JEM-1400 Plus, Tokyo, Japan).
Renal tissue iron assays
Sodium sulfite can reduce Fe3+ to produce Fe2+, which is chromogenic with 2,2′-bipyridine; the product has a characteristic absorption peak at 520 nm. The absorbance value change can be used to quantitatively detect the tissue’s iron content. Thus, the ferrous iron levels in the kidney tissues were detected using an Iron Assay Kit (AKIC001M, Boxbio Science & Technology Co., Ltd., Beijing, China) according to the manufacturer’s instructions. The harvested kidney samples were washed with phosphate-buffered saline (PBS). Next, 50 mg of the tissue was treated with 500 μL of tissue extract, homogenized, and centrifuged at 8000 ×g and 4°C for 10 min. The supernatant (200 μL) was collected and transferred to a 96-well plate; the absorbance at 520 nm was determined by the Microplate Photometer (MultiSkan FC, Thermo Fisher Scientific K.K., Tokyo, Japan). The tissue iron content (μmol/g) was calculated according to the standard curve and formula.
Renal tissue GSH assays
The relative GSH concentrations in renal tissue were determined using a GSH assay kit (AKPR008M, Boxbio Science & Technology Co., Ltd.) according to the manufacturer’s instructions. The reaction between GSH and 5,5′-dithiobis-2-nitrobenoic acid produces yellow 2-nitro-5-mercaptobenzoic acid and GSH disulfide; 2-nitro-5-mercaptobenzoic acid has a characteristic absorption peak at 412 nm. Briefly, 0.05 g of renal tissue was added to 500 μL of tissue extract, rapidly homogenized in an ice bath, and centrifuged at 8000×g and 4°C for 10 min; the supernatant was placed on ice. The absorbance values of the supernatants were measured by the Microplate Photometer (MultiSkan FC, Thermo Fisher Scientific K.K). The GSH content (µg/g) was quantified using the standard curve and formula.
Renal tissue MDA assays
The MDA concentrations were determined using an MDA assay kit (AKFA013M, Boxbio Science & Technology Co., Ltd.) according to the manufacturer’s instructions. In brief, 0.05 g of kidney tissue was added to 500 μL of extraction solution, homogenized in an ice bath, and centrifuged at 8000×g and 4°C for 10 min; the supernatant was placed on ice. Given that MDA can react with thiobarbituric acid to produce brownish-red 3,5,5-trimethyloxazole-2,4-dione under acidic and high-temperature conditions, colorimetry at 532 nm can be used to estimate the lipid peroxide content. However, to exclude interference by soluble sugar, the absorbance of 200 μL of the supernatant was measured simultaneously at 600 nm, 532 nm, and 450 nm by the Microplate Photometer (MultiSkan FC, Thermo Fisher Scientific K.K). The MDA content (nmol/g) was measured based on the difference in absorbance values at 532 nm, 450 nm, and 600 nm.
Prussian blue staining
The prepared kidney tissue sections were deparaffinized, hydrated, and stained with Perls staining working solution, washed with distilled water, and stained with nuclear fixative for cell nuclei, according to the manufacturer’s instructions (BP-DL 122-50, Sen Bei Jia Biotechnology Co., Nanjing, China). The sealed sections were viewed under a light microscope (BX51, Olympus), and images were captured.
Detection of ROS in renal tissue
Optimal cutting temperature compound-embedded kidney tissues were cut into 3-μm sections. ROS was measured using dihydroethidium (DHE) staining in fresh frozen sections as diluted DHE solution was added to the tissues. The tissue was incubated in a thermostat at 37°C for 30 min. The sections were washed thrice using PBS (5 min per wash). Then, 4′-6-diamidino-2-phenylindole (DAPI) staining solution was added, and the sections were incubated for 10 min at room temperature and then washed three times with PBS (5 min per wash). The sections were dried and sealed with an antifluorescence quencher prior to their observation with a fluorescence microscope.
IHC staining
Paraffin-embedded kidney tissue sections were deparaffinized, rehydrated, and incubated overnight at 4°C with primary antibodies against NGAL (1:50 dilution; ab125075, Abcam, Cambridge, United Kingdom), ACSL4 (1:100 dilution; sc-271800, Santa Cruz Biotechnology, Dallas, TX, USA), GPX4 (1:50 dilution; sc-166437, Santa Cruz Biotechnology), xCT (1:50 dilution; ab307601, Abcam), KEAP1 (1:50 dilution; TA5266, Abmart, Shanghai, China), and JNK and pJNK (1:50 dilution; 9252 and 4668, respectively, Cell Signaling Technology, Boston, MA, USA). The following day, sections were washed with PBS containing 0.1% Triton (PBS-T) before the dropwise addition of 100 µL of ultrasensitive enzyme-labeled goat anti-mouse/rabbit IgG polymer (SP-9000, ZSBIO, Beijing, China). The sections were then incubated for 20 min at 37°C. After rinsing with PBS-T, the sections were stained with diaminobenzidine and viewed under a light microscope (BX51, Olympus), photographs were obtained, and the relative positive area was assessed using Image J.
Cell culture and treatment
HK-11 cells, a gift from the Laboratory of Nephrology, University of Louisville, were cultured in Dulbecco’s modified Eagle’s medium/F-12 medium supplemented with 8% fetal bovine serum (A5669701, Gibco, Thermo Fisher Scientific, Waltham, MA, USA), 100 μg/mL penicillin, and 100 μg/mL streptomycin. To simulate type 2 diabetes, HK-11 cells were cultured in media containing 30 mM D-glucose for 24 h. Palmitate (300 µM) was added for the last 6 h of culture (Li et al., 2014; Wang et al., 2020). The HK-11 cells were divided into several groups: control (C/Ctrl); control and hUCMSC (C/MSC); high-glucose and palmitate (HG/P); and high-glucose, palmitate, and hUCMSC (HG/P/MSC). A co-culture system of hUCMSCs and HK-11 cells was established in a transwell chamber. The hUCMSCs were placed in the upper layer of the transwell chamber at a density of 2 × 10⁵ cells/mL, and the HK-11 cells were seeded in the lower layer of the transwell chamber.
Cell immunofluorescence staining
HK-11 cells were cultured and treated as described in the previous section. Thereafter, the cells were fixed with paraformaldehyde for 15 min, permeabilized with 0.2% Triton X-100 for 10 min, blocked with sheep serum for 30 min, and incubated with anti-NRF2 (1:200 dilution; ab137550, Abcam) and ACSL4 antibody (1:200 dilution; sc-271800, Santa Cruz Biotechnology) for 16–18 h at 4°C. The cells were then incubated with an Alexa Fluor 488-labeled goat anti-rabbit/mouse IgG (H + L) antibody (A0423 and A0412, respectively, Beyotime Biotechnology, Shanghai, China) and counterstained with DAPI. The fluorescent staining of the cells was visualized by a fluorescence microscope (DP72, Olympus).
Detection of ROS and iron levels in cells
Cellular ROS was detected using a fluorescent probe dichlorofluorescein diacetate (DCFH-DA) kit (S0033S, Beyotime Biotechnology), and the intracellular Fe2+ levels were evaluated using a FerroOrange fluorescent probe (F374, Dojindo, Mashiki, Japan). The HK-11 cells were cultured and treated as described in the previous section. The original culture medium was removed and diluted. DCFH-DA and FerroOrange working solutions were added according to the manufacturer’s instructions. The cells were then incubated for 20 min before washing the cells with serum-free culture medium. Finally, the ROS and Fe2+ levels were observed under a fluorescence microscope (DP72, Olympus).
Isolation of nuclear and cytoplasmic proteins from samples
Nuclear and cytoplasmic proteins from kidney or HK-11cell samples were extracted using a nuclear protein extraction kit (DE201-01, TransGen Biotech, Beijing, China) based on the manufacturer’s instructions. First, 50 mg of renal tissue or 2 × 10⁷ cells were washed with PBS and centrifuged at 1000 ×g for 3 min at 4°C. The supernatants were removed, and 1 mL of cytoplasmic polyadenylation element-binding protein (CPEB) I and 55 μL of CPEB II were added sequentially before centrifugation at 16,000 ×g for 15 min. The supernatant was then collected as the cytoplasmic extract. Next, 500 μL of CPEB I was added to the precipitate, which was resuspended and centrifuged at 16,000 ×g for 15 min. The supernatant was removed, and 500 μL of nuclear CPEB was added to resuspend the precipitate. The samples were centrifuged at 16,000 ×g and 4°C for 10 min, and the supernatant was collected as nucleoprotein.
NRF2 siRNA transfection
The HK-11 cells were transfected with human NRF2 antisense siRNA (A10005, NFE2L2-homo-1845; NM_006164.5, GenePharma, Shanghai, China) and control siRNA (Si-Ctrl; A10005, GenePharma) using Lipofectamine™ 2000 (11668019, Invitrogen, Carlsbad, CA, USA) transfection reagent for 24 h. The high-glucose, palmitate, and hUCMSC interventions were then performed as described above. The sequence of the sense NRF2 siRNA was 5′-GCCUGUAAGUCCUGGUCAUTT-3′ and that of the antisense siRNA was 5′-AUGACCAGGACUUACAGGCTT-3′. The sense sequence of Si-Ctrl was 5′-UUCUCCGAACGUGUCACGUTT-3′ and that of the antisense siRNA was 5′- ACGUGACACGUUCGGAGAATT-3′.
Inhibitor and agonist treatment
The HK-11 cells were cultured in the presence or absence of 0.2 µM anisomycin (a JNK agonist) and 10 µM SP600125 (a JNK inhibitor) for 48 h (Zhang et al., 2020) (B6674 and A4604, respectively, APExBIO, Houston, TX, USA). Then, they were co-cultured with high glucose and palmitate stimulation and hUCMSCs, as described above. The proteins were extracted from each group of samples. The pJNK, JNK, KEAP1, NRF2, HO1, NQO1, and GPX4 protein levels were determined via western blotting.
Western blotting analysis
Kidney tissues and HK-11 cells were lysed in radioimmunoprecipitation assay buffer containing protease inhibitors. The homogenates were centrifuged at 20,000 ×g and 4°C for 15 min, and the supernatant was collected. Following extraction, the absorbance of the samples was measured at 562 nm using a Bicinchoninic Acid protein assay kit (P0009, Beyotime Biotechnology), and the protein concentration was calculated using a standard curve. After quantification, 40 µg of total protein was separated on 10%–15% sodium dodecyl sulfate-polyacrylamide gel electrophoresis gels and transferred onto 0.45-μm polyvinylidene difluoride membranes (IPVH85R, Millipore, Billerica, MA, USA). After blocking with 5% milk, the membranes were incubated with primary antibodies against KIM-1 (1:1000 dilution; MA8164, Abmart), 4HNE (1:1000 dilution; ad46545, Abcam), FTH1 (1:1000 dilution; 3998, Cell Signaling Technology), TFR-1 (1:1000 dilution; ab214039, Abcam), xCT (1:1000 dilution; ab307601, Abcam), GPX4 (1:500 dilution; sc-166437, Santa Cruz Biotechnology), ACSL4 (1:500 dilution; sc-271800, Santa Cruz Biotechnology), NRF2 (1:1000 dilution; ab137550, Abcam), KEAP1 (1:1000 dilution; TA5266, Abmart), JNK and pJNK (1:1000 dilution; 9252 and 4668, respectively, Cell Signaling Technology), NQO1 (1:8000 dilution; ab80588, Abcam), HO1 (1:1000 dilution; ab189491, Abcam), β-actin (1:3000 dilution; 4967, Cell Signaling Technology), and LaminB1 (1:800 dilution; 12987-1-AP, Proteintech, Chicago, IL, USA). The membranes were subsequently incubated in diluted horseradish peroxidase-conjugated goat anti-rabbit IgG (1:2000 dilution; AS014, ABclonal, Boston, MA, USA) or antimouse IgG (1:4000 dilution; AS003, ABclonal) for 1 h at 25°C. Subsequently, the protein bands were detected using electrochemiluminescence. Image J software was used to analyze the protein band intensities.
scRNA-seq and data processing
The snRNA-seq dataset used in this study included data from three control patients and three patients with early DN, from which 23,980 single-nucleus transcriptomes were generated (GSE131882) (Wilson et al., 2019). All datasets were downloaded from the GEO database (http://www.ncbi.nlm.nih.gov/geo/). The snRNA-seq data were processed using the R package “Seurat” (Hao et al., 2021). Genes expressed in more than three nuclei and nuclei with at least 200 genes were obtained, with mitochondrial and ribosomal genes controlled at <20%. The three control and three DN samples were then harmonized, and the data were standardized using the NormalizeData function. A principal component analysis was conducted using FindNeighbors, FindClusters, and RunTSNE to obtain clusters and t-distributed stochastic neighbor embedding values. The major cell types were annotated using the canonical marker genes reported in previous studies (Lake et al., 2019).
Statistical analysis
All data were analyzed and graphed using SPSS software (version 26.0, SPSS Inc., IBM, Chicago, IL, USA) and GraphPad Prism (version 9, GraphPad Software, San Diego, CA, USA). Quantitative data are expressed as mean ± standard deviation. A two-way or multiway analysis of variance was used to compare the results of the multiple treatment groups and analyze the influence of two or more independent variables on the outcome. The Bonferroni method was used for post hoc analysis if the differences were statistically relevant. Statistical significance was set at p < 0.05.
Footnotes
Acknowledgment
The authors would like to extend their gratitude to Tuohua Biotechnology Co., Ltd. for providing hUCMSCs and technical support, as well as the reviewers.
Authors’ Contributions
Z.Y.X. researched the data and wrote the original draft. G.Y.C. conducted the animal experiments. N.P. and D.C.C. performed the cellular experiments and single-nucleus RNA sequencing analyses. X.Z.H. provided statistical analysis and collected the literature. L.Y. prepared pathological sections. T.N. provided the hUCMSCs and technical support. L.M.Y. offered financial support and reviewed the article. L.P. designed the study and edited the article. All authors read and approved the final article.
Availability of Data and Materials
The datasets and resources generated and analyzed during the current study are available from the corresponding author upon reasonable request. Western blot raw images relevant to this study are included in the Supplementary Materials.
Author Disclosure Statement
The authors declare no competing interests.
Funding Information
This work was funded by the Jilin Science and Technology Program (20200201564JC and YDZJ202401258ZYTS) and the Education Department of Jilin Province (JJKH20221089KJ, JJKH20190003KJ, and JJKH20231218KJ).
Supplementary Material
Supplementary Figure S1
Supplementary Figure S2
Abbreviations Used
References
Supplementary Material
Please find the following supplemental material available below.
For Open Access articles published under a Creative Commons License, all supplemental material carries the same license as the article it is associated with.
For non-Open Access articles published, all supplemental material carries a non-exclusive license, and permission requests for re-use of supplemental material or any part of supplemental material shall be sent directly to the copyright owner as specified in the copyright notice associated with the article.
