
Abstract
The study is designed to determine the effect of zero end expiratory pressure (ZEEP) and 5 mmHg positive end expiratory pressure (5PEEP) on cerebral oxymeter (CO) levels in morbidly obese (MO) patients. Study was performed on 60 morbidly obese patients between 18–60 years old, American Society of Anesthesiology 2–3 status, scheduled to undergo laparoscopic sleeve gastrectomy under general anesthesia. The patients were divided into two groups: those ventilated with no PEEP (group ZEEP, n = 30) and those ventilated with 5 cmH2O PEEP levels (group 5PEEP, n = 28). rSO2 values were measured. Data were recorded as basal, after the induction (A ind) of anesthesia, 5 min before insufflation (BI), 5 min after insufflation (AI), 15, 30, 45, and 60 min after induction, 5 min before desufflation, and 5 min after desufflation (AD). Invasive arterial pressures, CO values, peripheral oxygen saturation, end tidal carbondioxide, and intraabdominal pressure (IAP) were recorded in these time periods in all groups. Arterial blood samples were analyzed in terms of the 5BI, 5AI, and 5AD periods. There was a negative correlation between IAP and left CO on pneumoperitoneum time in group 5PEEP. Correlation was observed between bilateral CO values and ideal body weight (IBW), lean body weight (LBW), body surface area BSA, in group ZEEP. Correlation was observed between IBW, LBW, and right CO values in group 5PEEP. PEEP application may have a protective effect on cerebral oxygenation.
Introduction
M
Materials and Methods
After obtaining ethical approval from Bezmialem Vakif University Clinical Ethics Committee (No.: 2014/56) and patient consent, 60 morbidly obese patients who were scheduled for sleeve gastrectomy procedures under general anesthesia [American Society of Anesthesiology Status (ASA) 2–3] were included in this study (ClinicalTrials.gov Identifier: NCT02920138). Patients were divided into two groups: those who were ventilated with no positive end expiratory pressure (group ZEEP n = 30) and those who were ventilated with 5 cmH2O positive end expiratory pressure (group 5PEEP n = 30). Two patients in group 5PEEP were excluded because of hemodynamic instability during the procedure. All the patients were right hand dominant.
Inclusion criteria: obese (body mass index [BMI] >30 kg/m2), ASA 1–3 status, between 18 and 65 years old, patients who were scheduled for LSG procedures under general anesthesia.
Exclusion criteria: documented coronary or peripheral arterial disease, congestive heart failure (above class II in the New York Heart Association classification), unregulated diabetes mellitus, preexisting lung parenchyma disease, chronic obstructive pulmonary disease, moderate-to-severe asthma, obstructive sleep apnea already treated with continuous positive airway pressure, estimated pulmonary artery pressure greater than, or equal to, 35 mmHg, history of smoking, symptoms of bowel or urinary bladder obstruction, preoperative systolic pressure >170 mmHg, diastolic arterial pressure >90 mmHg, pregnancy, anemia (hematocrit levels (Htc) <30%), and symptoms of increased intracranial pressure, significant stenosis of the carotid arteries, and neurological disorders. In all, anesthetized patients were continuously monitored in terms of three leads electrocardiography, pulse oxymetry (sPO2), invasive blood pressure, end-tidal carbondioxide (EtCO2), IAP levels with intravesical urinary catheters, peak inspiratory pressure, laparoscopic pressure (LP), and regional cerebral oxygen saturation (rSO2).The rSO2 values were measured with NIRS techniques and by cerebral oxymeter (CO) (INVOS 4100, Somanetics, Covidien). Measurements were recorded as basal values; after induction (Aind); 5 min before insufflation (Bins5); 5 min after insufflation (Ains5); 15 min after induction (Aind15); 30 (Aind30), 45 (Aind45), 60 (Aind60) min after induction; 5 min before desufflation (Bdes5); and 5 min after desufflation (Ades5). Arterial blood samples were collected 5 min before insufflation (Bins 5); 5 min after insufflation (Ains5); and 5 min after desufflation (Ades5). Partial oxygen pressure (PaO2), partial carbondioxide pressure (PaCO2), peripheric oxygen saturation (SaO2), bicarbonate (HCO3), acid–base status (pH), Htc, and hemoglobin (Hb) levels were recorded and evaluated in the three time periods as already explained. CO probe was placed on the forehead of the patients after cleaning with a special skin-prep pad. The skin sensors were applied on the right and left sides of the forehead. The medial margin of the sensor was at the midline of the forehead, and the lateral margin 2 cm above the eyebrows. After the induction of anesthesia, a 20 gauge intraarterial cannula was placed into the left radial artery and recordings were made at 5-min periods. All patients received midazolam 2 mg intravenously (IV) about 5 min before induction. Anesthesia was induced with fentanyl (1–3 mcg/kg), propofol (2–3 mg/kg), and rocuronium (0.6 mg/kg). After intubation, anesthesia was maintained with sevoflorane 2–3% volume (to improve MAC 1 levels for sevoflorane). Remifentanyl was given continuously during surgery at a rate of 0.05–2 mcg/(kg·min)) (IV). Rocuronium was administered at 30 min time intervals during anesthesia. Sugammadex was administered at the end of surgery to reverse neuromuscular blockages. Tramadol 1 mg/kg, 40 mg meperidine, and paracetamol 1 g were administered for postoperative analgesia after trochars were removed. The concentration of volatile anesthetic was monitored using a GE anesthesia machine. Patients were ventilated with a 6 L/min gas flow (50% oxygen with 50% air mixture). Then, 6–8 mL/kg tidal volume and an inspiration/expiration rate of 1/2 were maintained. The respiratory rate was 8–12 breaths. EtCO2 was kept within the 35–45 mmHg range. Then, 5 mmHg PEEP was administered in group 5PEEP and 0 cmH2O PEEP was administered in group ZEEP. Fluid balance and blood replacement were maintained with 0.09% NaCl and ringer or colloid (Voluven Fresenius Kabi, Graz, Austria) solution IV. Body temperature was maintained normothermically by the use of upper body forced air and warming pads. LP was maintained at <14 mmHg throughout the operation. IAP was measured in mililiters of mercury through a Foley bladder catheter with three stopcocks connected to an infusion set and pressure transducer. It was connected to the electronic monitor of the anesthesia machine (Datex -Ohmeda S/5 Compact, GE Healthcare, Finland). After clamping the tube, 100 mL saline was injected into the bladder. The transducer was replaced and zeroed to the urinary bladder level whenever the position changed throughout the procedure. An oscillation test was performed before starting the IAP measurements. This measurement was performed in two positions: basal, after induction, before insufflation, after insufflation, before desufflation, and after desufflation, values were measured in the supine position; 30, 45, and 60 min after induction measurements in 40 degree reverse trendelenburg position. Intraabdominal hypertension was defined as an IAP of 12 mmHg or higher, according to the consensus definations of the World Society for The Abdominal Compartment Syndrome. 13 At the end of the operation, all the anesthetic agents were stopped and 4 mg/kg sugammadex was injected IV.
Surgical procedures
The LSG procedure involves the surgical removal of the left side of the stomach. Laparoscopic procedures include some stages such as trochars insertion, insufflation of CO2 gas into the abdomen (pneumoperitoneum) to lift the stomach wall away from the other organs in a supine position, and 40° reverse trendelenburg positioning while the surgeon examines the abdominal cavity using a laparoscope, which is a specialized video camera. A sizing device called bougie is then placed into the pyloric channel. The thick antrum or cavity of the stomach is divided by cutting transversely around the bougie to create a gastric tube. The last stage is the removal of the trochars from the abdomen, desuflating the gas from the abdomen, and sewing the skin incissions. In this study, our observation periods were created in such a way as to consider this stage. 12
Sample size calculation was based on our previous study of 18 patients. 13 The primary outcome variable was the value of rSO2 after insufflations of CO2. When a mean intergroup difference and SD of the rSO2 values between 5 and 10 mmHg PEEP groups rSO2 were taken to be 6.05% and 6.54%,respectively, as was determined based on a the preliminary study of 18 patients, 32 subjects were required for an (alpha) value of 0.05 and a power of 90%. Thus, 60 subjects were included to cope with an expected loss of 10%. 13
Statistical analysis was performed using SPSS 22.0 (SPSS, Inc., Chicago, IL). The Kolmogorov–Smirnov test and the Shapiro Wilk test were used to assess the normality of the data distribution. Independent samples t test and Mann–Whitney U test were used to compare groups. For the analysis of changes in variables, repeated measures ANOVA [post hoc Tukey's Honestly Significant Difference (HSD) test] was performed between the different time points. The Pearson correlation test was used to examine the relationships between the quantitative variables. Statistical significance was accepted for p values <0.05.
Results
Demographic data are shown in Table 1. There is no statistical difference in terms of age, lean body weight (LBW), BMI, Hb, and Htc mean values between groups (Table 1).
ASA, American Society of Anesthesiology; ZEEP, zero end expiratory pressure; PEEP, positive end expiratory pressure.
There was no difference in surgical time between groups (p = 0.554).
The differences between the IAP values were also different in both groups (p = 0.027). The differences between the IAP induction valuesmeasured in group “5 mmHgPEEP” and the IAP insuflation (p < 0.001), IAP 15th min (p < 0.001), IAP 30th min (p < 0.001), IAP BD (p < 0.001), and IAP AD (p = 0.025) values were significant. This group has shown statistical significant difference between IAP BI and after insufflation periods (p < 0.001). Similarly there was a significant differance between IAP BD and IAP AD periods in group “5 mmHgPEEP” (p = 0.020).
There is no statistical difference in terms of LP (p = 0.474) and tidal volume measurements between groups (p = 0.603).
It was observed that the difference between the groups did not change according to the CO values measured at different periods or the differences between CO left values were similar in both groups (p = 0.483). (Fig. 1) It was observed that the difference between the groups did not change according to the right CO values measured at different periods or the differences between the CO right values were similar in both groups (p = 0.201). (Fig. 1)
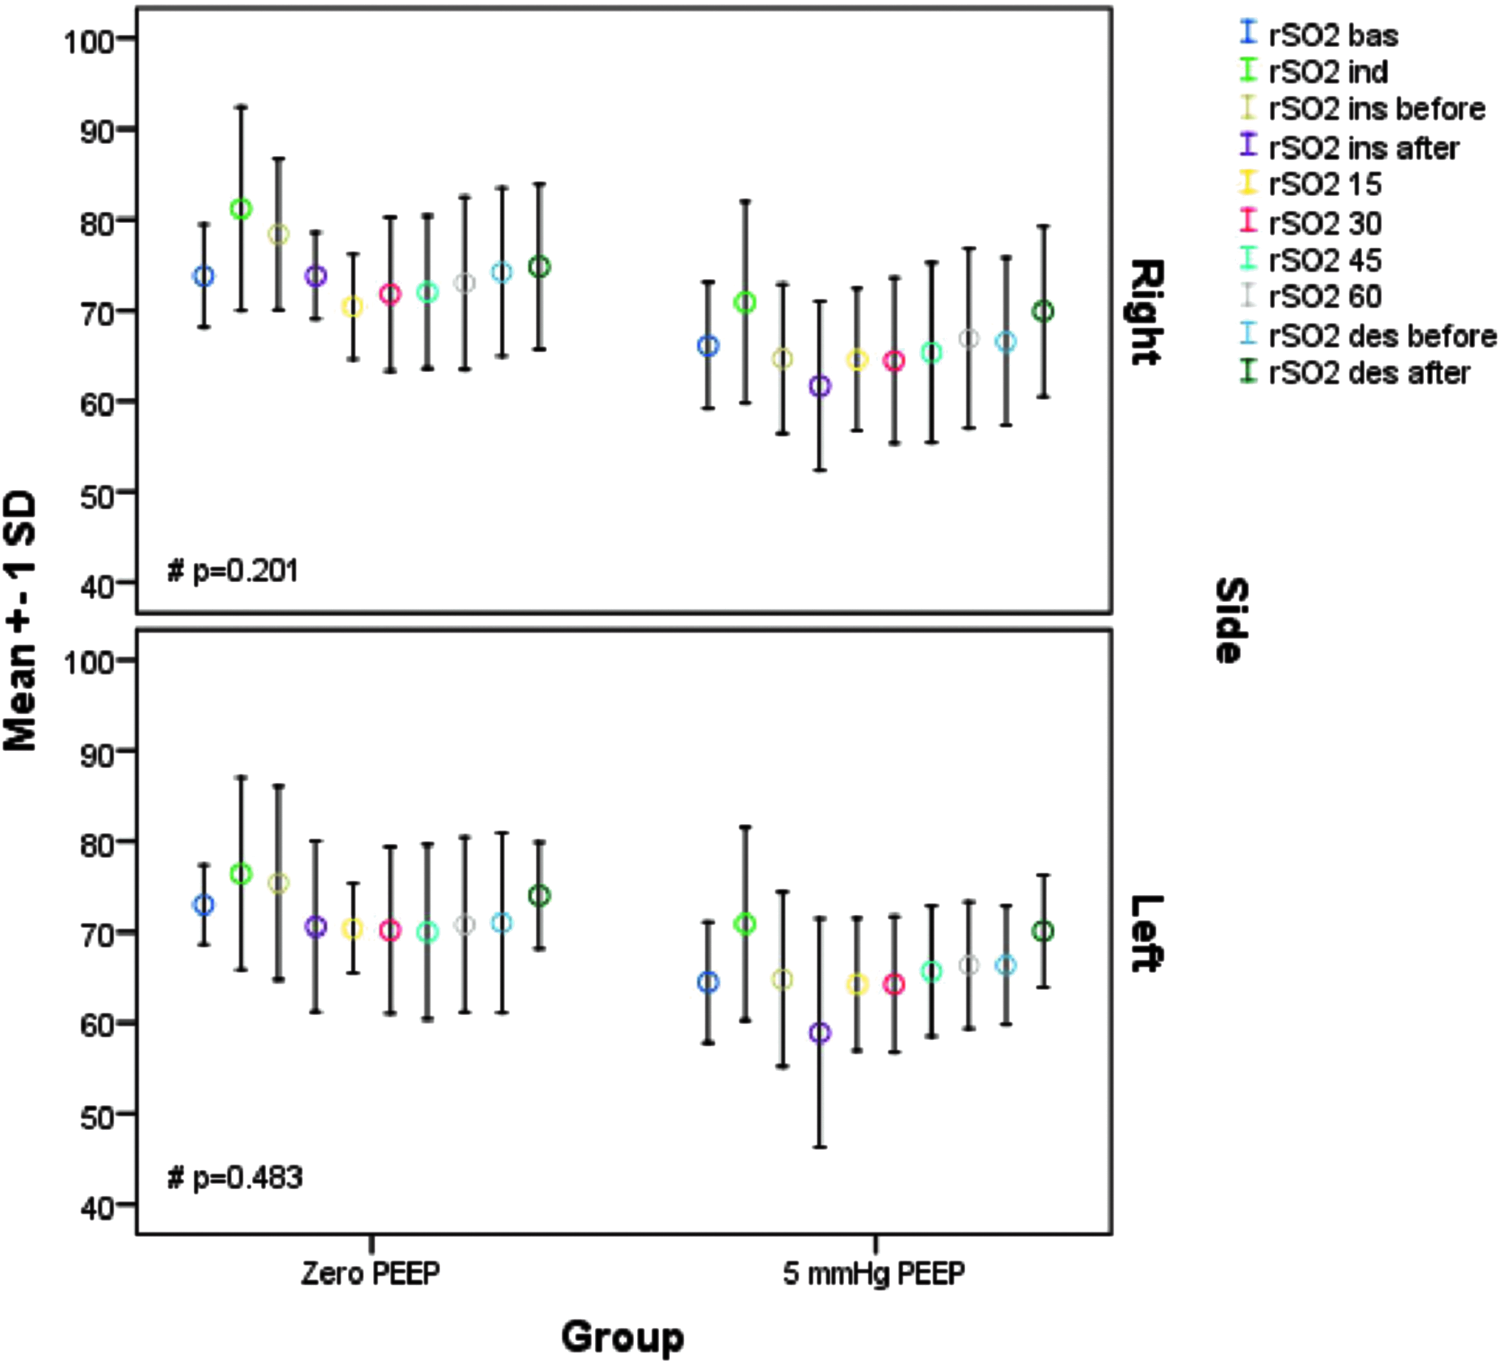
Cerebral oxymeter value changes of the right and left side of the brain. IAP ind, intraabdominal pressure induction; IAP ins before, intraabdominal pressure before insufflation; IAP ins after, intraabdominal pressure after insufflation; IAP 15, intraabdominal pressure 15th min after induction; IAP 30, intraabdominal pressure 30th min after induction; IAP 45, intraabdominal pressure 45th min after induction; IAP 60, intraabdominal pressure 60th min after induction; IAP des before, intraabdominal pressure before desufflation; IAP des after, intraabdominal pressure after desufflation; #p-value of interaction effect.
Correlations: We detected a positive correlation between body surface area, LBW, and right CO values (nondominant hemisphere) in group ZEEP. Also there was a positive correlation between left hemisphere CO values and LBW in group 5PEEP.
There were positive correlation between ideal body weight (IBW), LBW, and right CO values BI, after insufflation, BD, and AD (Table 1).
There was no linear correlation between measurements of the left CO values at the induction period and IAP in group ZEEP (p = 0.758) (Figs. 1–2).
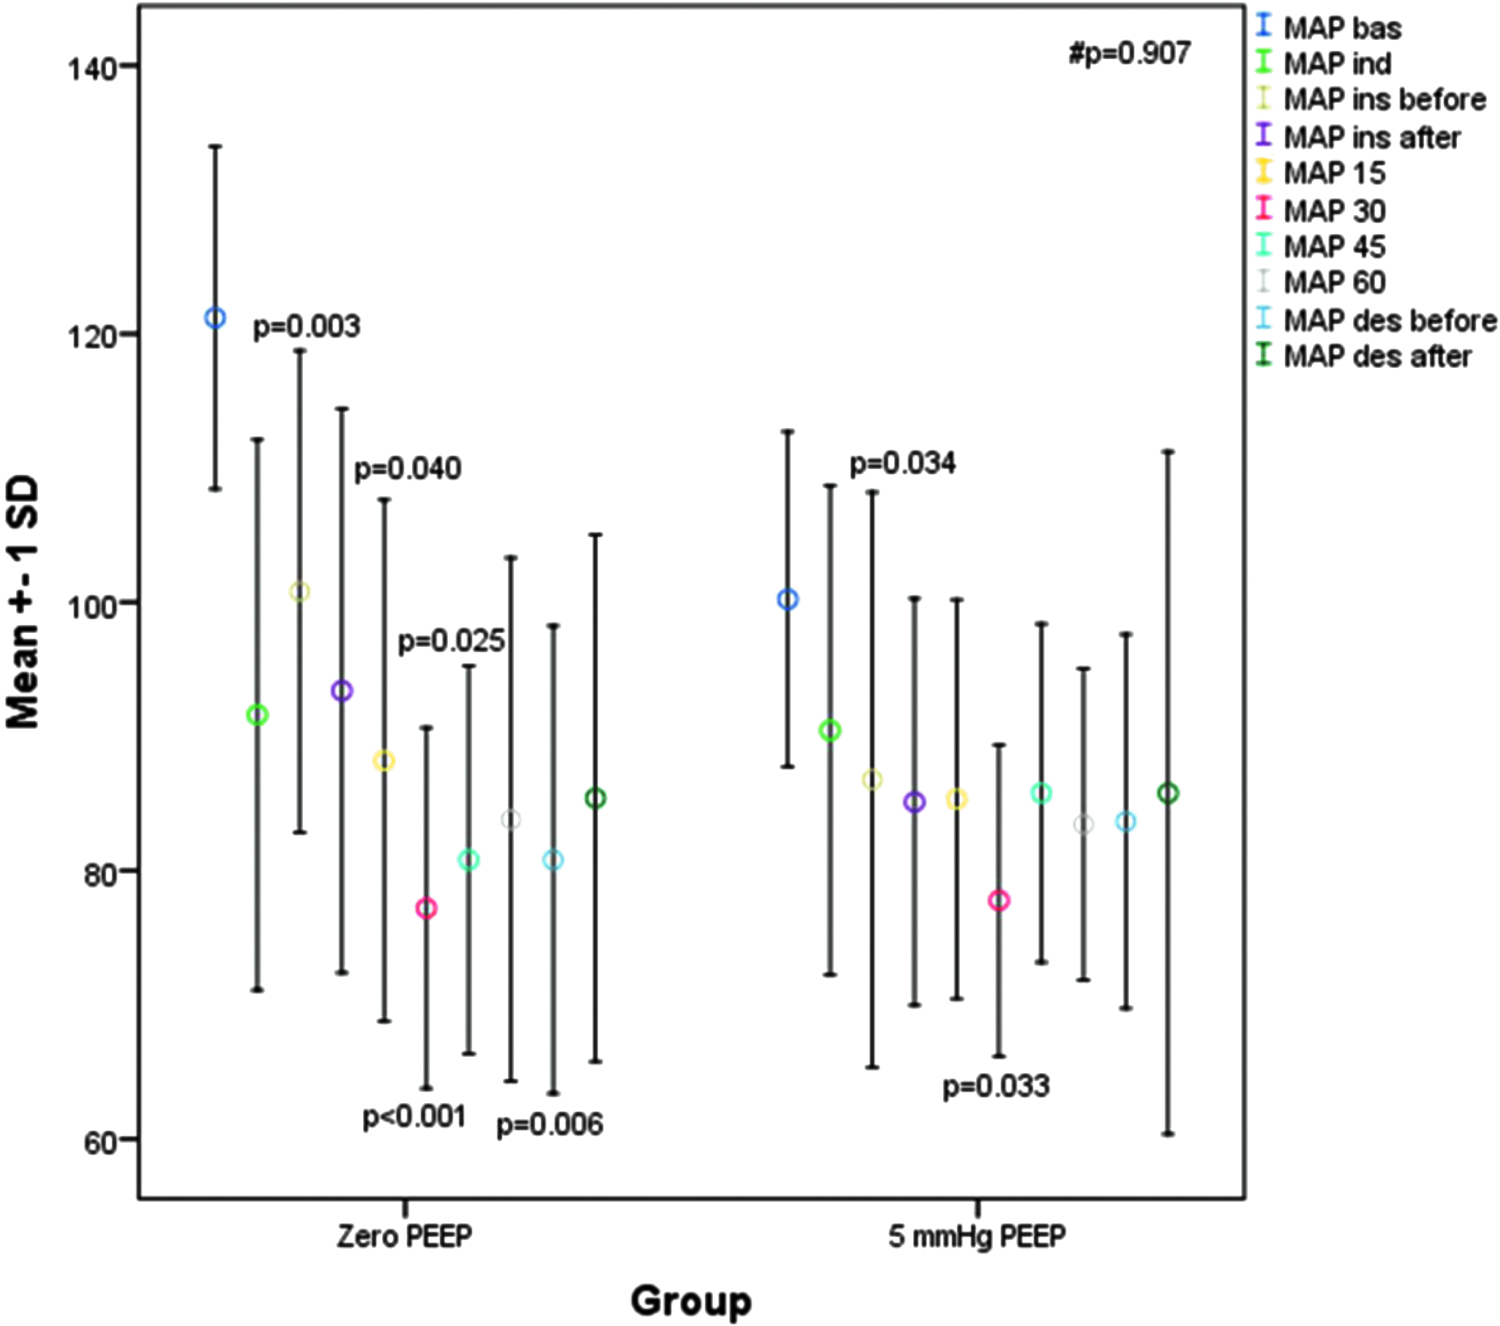
Mean arterial blood pressure changes of the patients IAP ind, intraabdominal pressure induction; IAP ins before, intraabdominal pressure before insufflation; IAP ins after, intraabdominal pressure after insufflation; IAP 15, intraabdominal pressure 15th min after induction; IAP 30, intraabdominal pressure 30th min after induction; IAP 45, intraabdominal pressure 45th min after induction; IAP 60, intraabdominal pressure 60th min after induction; IAP des before, intraabdominal pressure before desufflation; IAP des after, intraabdominal pressure after desufflation; p-value for comparison of IAP ind versus each time period; #p-value of interaction effect.
We observed that when LBW was increased, both nondominant and dominant hemisphere CO values increased statistically in all groups (p < 0.05). This clue was prominent with regard to the nondominant hemisphere in group ZEEP (p < 0.01). There was no statistical difference observed for mean arterial pressure measurements in the different periods (Fig. 2). In addition, the basal mean arterial pressure measurements were higher than other periods for both the groups (p < 0.05) (Fig. 2). In group ZEEP, the mean arterial pressure basal levels were observed to be higher than BI, and at 15, 30, and 45 min, BD periods (p = 0.00; p = 0.04; p < 0.001; p = 0.025; p = 0.006). With regard to group 5PEEP, the basal mean arterial pressures were higher BI and at 30 min (p = 0.034; p = 0.033). There was no statistical difference seen for heart rate measurements in the different periods. In addition, the basal heart rate measurements were higher than for other periods for each of the two groups (p < 0.05).
EtCO2 measurement differences were similar in groups (p = 0.300). The basal EtCO2 values were lower than EtCO2 15 (p = 0.032), EtCO2 30 (p < 0.001), EtCO2 45 (p = 0.005), EtCO2 before desufflation (p < 0.001) and EtCO2 after desufflation (p < 0.001) periods in group ZEEP. The basal EtCO2 values were lower than EtCO2 15 (p = 0.032), EtCO2 30 (p < 0.001), EtCO2 45 (p = 0.005), EtCO2 before desufflation (p < 0.001), and EtCO2 after desufflation (p < 0.001) periods in group PEEP.
There was no statistical difference found between SpO2 levels in the different periods (p = 0.503). The difference of the lactate levels of the different periods was similar statistically (p = 0.299). However, in group ZEEP, the lactate levels after insufflation were statistically less than the lactate levels AD (p = 0.049) (Table 2).
Group ZEEP PaO2 pressures after insufflation were lesser than PaO2 pressures after desufflation statistically (p = 0.019).
Group ZEEP lactate levels after insufflation were lesser than lactate levels after desufflation statistically (p = 0.049).
Discussion
Pulmonary gas exchange and respiratory mechanics can be negatively affected during laparoscopic surgery and during paralysis. One of the most important factors that cause this is the formation of atelectatic areas in the basal parts of the lungs in laparoscopic procedures, especially when the IAP increases with the elevation of the diaphragm.
There are some changes that occur in brain blood flow and brain oxygenation according to pulmonary gas exchange.
Our study we investigated whether the 5 cmH2O PEEP values applied with IAP increase is an oxygenation improving effect on CO values detected in patients who underwent obesity surgery.
It has been shown that the 10 cmH2O PEEP values applied in the studies performed are associated with lower postoperative pulmonary complications and lower atelectasis scores than ZEEP and 5PEEP groups. It has also been demonstrated that the applied 10 cmH2O PEEP values provide better oxygenation with vital capacity maneuver alveolar recruitment. 14 Our main hypothesis is that a better alveolar ventilation will lead to better oxygenation and that CO values will increase accordingly.
For this purpose, our work focused on ZEEP and 5PEEP values. No recruitment maneuver was applied in our study. Our goal here is to observe only changes between these two PEEP levels. Recruitment maneuvers and combined studies of ZEEP and 5PEEP levels reported that there was no significant change in oxygenation and PaO2/FiO2 ratio in the recruitment maneuvers and + ZEEP group. 15
There are also publications that argue that optimum PEEP level is the 10 cmH2O PEEP level in patients with pneumoperitoneum. 16
There are studies to improve regional cerebral oxygen saturation in young infants with 8 cmH2O PEEP levels as laparoscopic surgery. 17
Limitation of our study is that 8 and 10 cmH2O PEEP levels were not included. Our goal is due to the concern that 10 cmH2O PEEP values to be applied with high IAP levels may induce hemodynamic changes, especially during the reverse trendelenburg position. Increased PEEP levels may cause overstress of the pulmonary units and decrease or redistribution in the cardiac output and may create ventilation/perfusion incompatibility. 16
There was no statistically significant difference in PaO2 and SpO2 values between the two groups in our study. However, in the ZEEP group, it was noticed that the PaO2 values after insufflation when compared between the periods within themselves decrease significantly compared with the values AD (p = 0.019). This may be explained by the IAP changes leading to less oxygen transport to the intravascular area due to the effects on the pulmonary component.
However, again in group ZEEP, statistically lower levels (p ≤ 0.05) of lactate were found BI than after disinflation, suggesting that increases in IAP may be due mainly to decreased perfusion, especially in intraabdominal organs.
There was no difference between the two groups in terms of arterial blood gas parameters except lactate levels. However, the higher group in the insufflation period in the ZEEP suggested that a protective role of the 5 cmH2O PEEP levels might be present.
There is a significant decrease in the intraabdominal perfusion pressure with 30–45° lift of the head of the patient bed. 18 Supine position at 30, 45, and 60 min in our study, at the 30th, 45th, and 60th min, reverse trendelenburg was applied at 30°. Especially in the 5PEEP group, the highest value was reached at 60th min, and after desufflation, it was observed to be higher than the basal levels (Fig. 3). In studies involving laparoscopic operations, it was emphasized that the cardiac index decreased 30% after 30 min compared with baseline levels. Again, researchers have shown that the oxyhemoglobin levels fall in the top position and this lowness lasts for 30 min. However, the concentration of cytochrome aa3 was unchanged.19,20 In the measurements made with the NIRS technique used in cerebral oximeters, it is thought that the ratio of the main component to the oxy/deoxy hemoglobin is considered to be the ratio of the cerebral oximeter to the 30° reverse trendelenburg position with increasing IAP, but we did not observe a statistically significant decrease in our CO values.
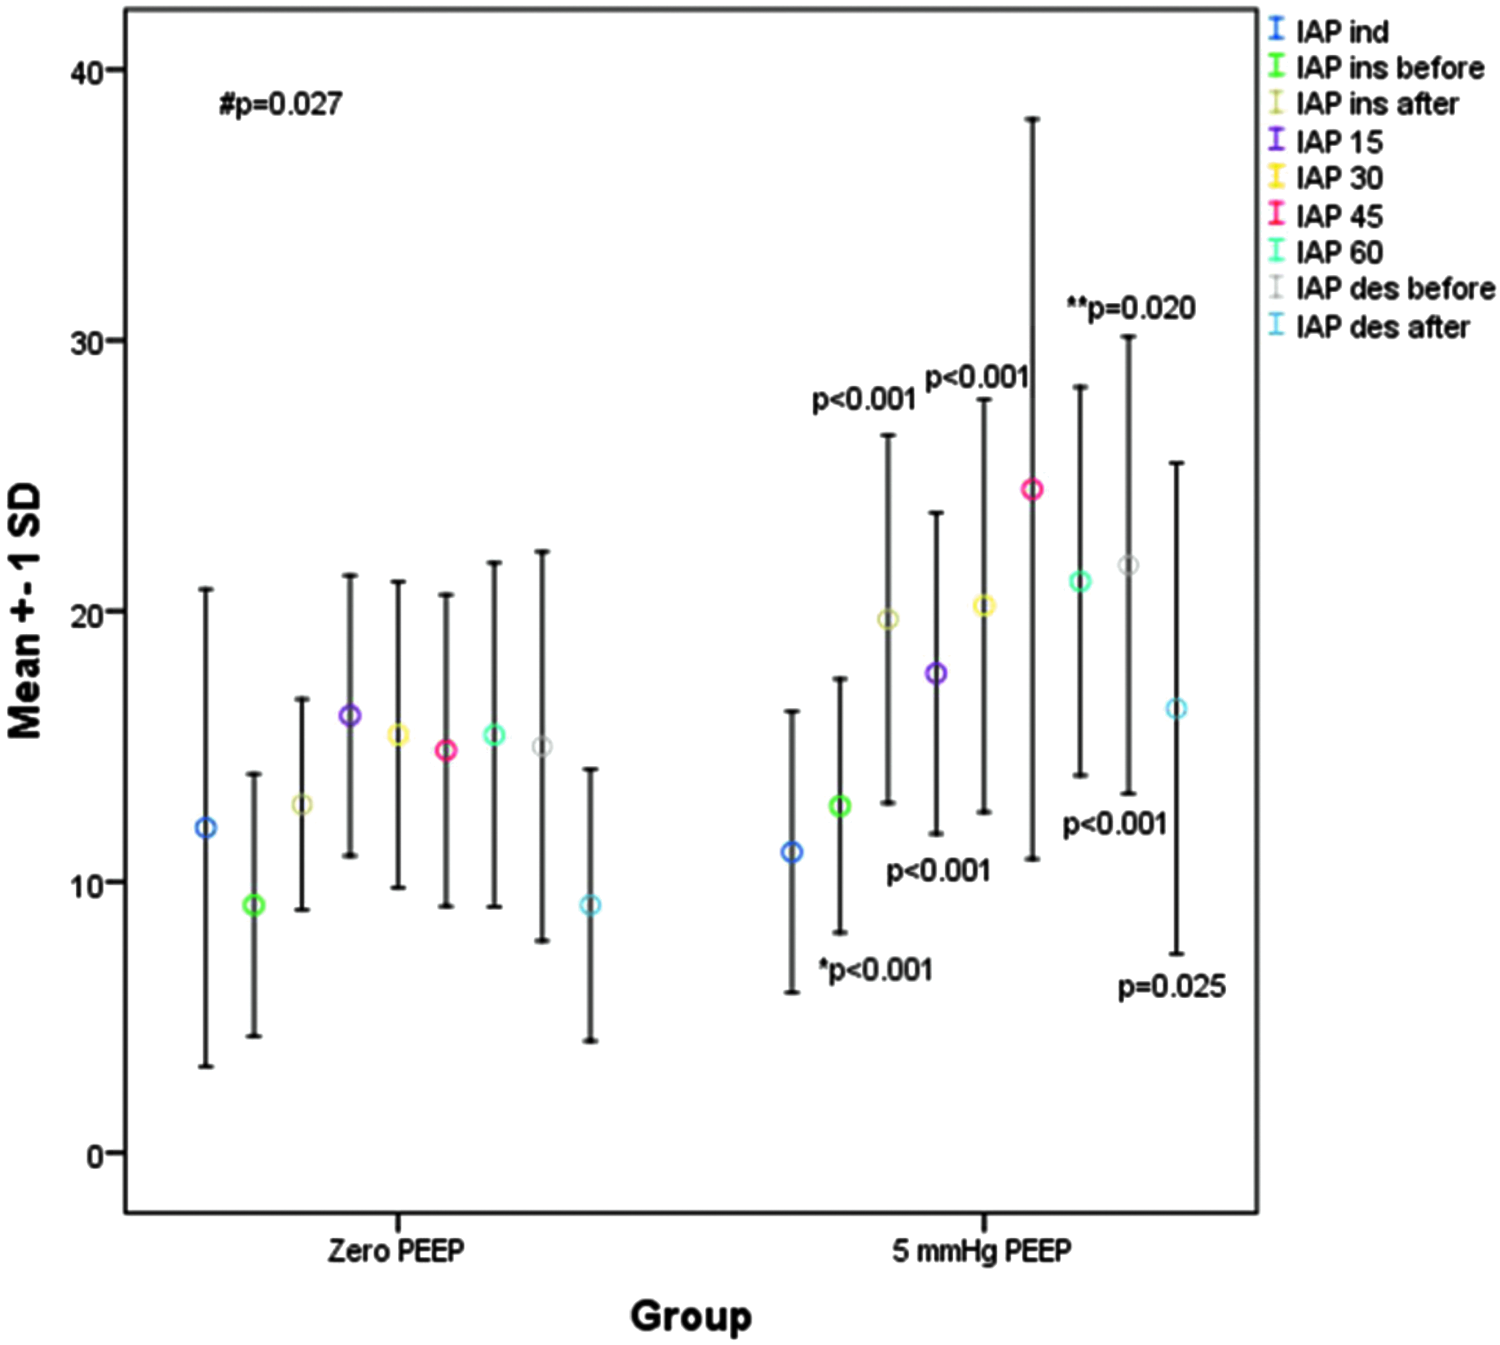
Intraabdominal pressure changes of the groups. IAP ind, intraabdominal pressure induction; IAP ins before, intraabdominal pressure before insufflation; IAP ins after, intraabdominal pressure after insufflation; IAP 15, intraabdominal pressure 15th min after induction; IAP 30, intraabdominal pressure 30th min after induction; IAP 45, intraabdominal pressure 45th min after induction; IAP 60, intraabdominal pressure 60th min after induction; IAP des before, intraabdominal pressure before desufflation; IAP des after, intraabdominal pressure after desufflation. p-value for comparison of IAP ind versus each time period; #p-value of interaction effect; *p-value for comparison of IAP ins before versus IAP ins after; **p-value for comparison of IAP des before versus IAP des after.
We observed a more significant decrease in mean arterial pressure in group ZEEP and reached the lowest level of this decrease in 60 min.We believe that prolonged pneumoperitoneum may reduce venous return and result in decreased cardiac index and mean arterial pressure. Surprisingly, we observed that although the IAP was still high, the reduction in CO values approximated the baseline values at 60 min. We think that an adaptive mechanism that develops within minutes may cause this in an obese group of patients, and that this phenomenon can be investigated with further studies to be done in comparison with nonobese patients.Studies conducted on different levels of PEEP applied in laparoscopic operations and their effects on rSO2 pressures show quite different results.Some studies have shown that 10 cmH2O PEEP levels keep rSO2 levels within normal limits despite the decrease in cerebral perfusion pressure, whereas another study emphasizes that the application of 5PEEP, ZEEP, and 10 cmH2O PEEP levels did not lead to differences in rSO2 levels.13,19,20
In our study, it was observed that there was no significant difference in rSO2 values between the groups at the levels of ZEEP and 5PEEP in obese patients (Fig. 1).
Conclusions
In the LSG operations, ZEEP and 5PEEP levels applied with intraoperative abdominal pressure changes were observed to have no apparent effect on cerebral oxygenation.
Footnotes
Author Disclosure Statement
No competing financial interests exist.