
Abstract
Introduction:
Breastfeeding myths are culturally ingrained misconceptions related to breastfeeding and adversely affect the breastfeeding process. The objective of this study is to develop the Breastfeeding Myths Scale.
Methods:
This methodological study was conducted with a total of 413 participants. In the first phase, exploratory factor analysis was employed, followed by confirmatory factor analysis in the second phase. Furthermore, a test–retest was conducted to assess the reliability of the scale scores.
Results:
As a result of psychometric analyses, the single-dimensional 30-item Breastfeeding Myths Scale was deemed a valid and reliable instrument. The Cronbach's alpha value of the scale was established at 0.91, and the test–retest reliability at 0.90. According to the results of the receiver operating characteristic analysis, the optimal cutoff point was determined to be 119.50, with a sensitivity of 86% and a specificity of 53%.
Conclusions:
Breastfeeding Myths Scale was deemed significant for identifying the prevalence of breastfeeding myths. Utilization of the Breastfeeding Myths Scale is recommended for future research endeavors and individual clinical assessments.
Introduction
Breast milk is considered the most crucial and fundamental source of nutrition for newborns, and breastfeeding is the optimal feeding method. The World Health Organization and numerous international organizations recommend exclusive breastfeeding for the first 6 months of life, followed by the introduction of complementary foods starting from the 7th month, and continuation of breastfeeding up to the age of 2 years.1,2
Behaviors of initiation, continuation, and exclusive breastfeeding during the first 6 months are known to be influenced by various factors. Studies have shown that factors such as cesarean section delivery, early return to work, health issues, negative attitudes toward breastfeeding, and breastfeeding myths have a negative impact on the breastfeeding process.3–5 Myths are false, distorted, incomplete information, thoughts, and beliefs that have no scientific basis. Breastfeeding myths are culturally ingrained misconceptions about breastfeeding, and it is known that different cultures have different breastfeeding myths.
Across various cultures worldwide, various misunderstandings and myths related to breastfeeding are reported.3,6 Khasawneh et al. 7 and Al-Sagarat et al. 8 identified negative myths regarding exclusive breastfeeding for newborns, whereas Isytiaroh 9 found that 56.9% of participants who were unsuccessful with exclusive breastfeeding believed in breastfeeding myths. Acheampong et al. 10 identified breastfeeding myths as a contributing factor to young mothers discontinuing breastfeeding. In the study by Gölbaşı et al., 11 it was determined that myths about breastfeeding and breast milk were prevalent among postpartum women.
Breastfeeding myths hinder every stage of the breastfeeding process and constitute a significant public health issue that requires resolution.12,13 In developing strategies to address this issue, objectively evaluating the breastfeeding myths prevalent in society is of paramount importance. However, a comprehensive scale for assessing breastfeeding myths in the literature has not been identified. Hence, the objective of this study has been defined as developing a Breastfeeding Myths Scale within its scope.
Methods
Design
The research was conducted methodologically to develop a measurement tool to identify myths related to breastfeeding. In the first phase, exploratory factor analysis (EFA) was employed, followed by confirmatory factor analysis (CFA) in the second phase.
Population and sample of the study
The data for the study were collected online through Google Forms between December 2022 and May 2023. Invitations to participate in the study were shared through social media platforms (Twitter, Facebook, and Instagram). The target population for the pilot test and psychometric evaluation stages comprised all women and men over the age of 18 years. Individuals who were over the age of 18 years, and possessing Turkish reading and comprehension skills, were included in the study. In the literature, it is recommended to have a sample size of 5–10 individuals per scale item during scale development. 14
In this context, a total of 378 participants were reached, including 170 participants for EFA of the Breastfeeding Myths Scale and 208 participants for CFA. In addition, a test–retest was conducted with 35 participants at a 3- to 4-week interval to determine the reliability of the scale scores. The study was concluded with a total of 413 participants.
Research questions
Is the Breastfeeding Myths Scale a valid tool for identifying myths related to breastfeeding?
Is the Breastfeeding Myths Scale a reliable tool for identifying myths related to breastfeeding?
The scale development process
The study followed the stages proposed by De Vellis 15 for scale development. Accordingly, there are four stages in the scale development process. These are the generation of an item pool, estimation of content validity, preliminary survey, and testing of validity and reliability.
Step 1: Generation of an item pool
A comprehensive literature review was conducted to develop the draft form of the Breastfeeding Myths Scale. The aim of the literature review was to identify prevalent breastfeeding myths, utilizing key search terms such as “breastfeeding” and “breastfeeding myths.” As a result of the examination, the statements related to breastfeeding myths identified transformed into scale items and development of the draft form of the scale.3,11,13,16–18 The breastfeeding myths scale draft form consisted of 36 items. Based on the literature, a draft scale consisting of 36 items was generated. The draft scale was designed using a 5-point Likert-type scale (1 – strongly agree, 5 – strongly disagree). Since all items in the draft scale were negatively worded, they needed to be reverse coded.
Step 2: Estimation of content validity
To assess the comprehensibility of the scale items in terms of expression and language and to determine whether they covered the intended topic, expert opinions were received. With respect to receiving expert opinions, the draft form was presented to 14 experts (2 public health specialists, 4 pediatricians, 7 obstetrics and gynecology nurses, and 1 literature specialist). The experts were asked to evaluate the clarity of the statements in the item pool, the presence of similar statements among items, and whether the items were suitable for the objective of the research.
Davis' technique 19 was used for content validity based on expert opinions. Each expert was asked to rate the appropriateness of each item on a scale from 1 (not appropriate) to 4 (highly appropriate). The Content Validity Index (CVI) value was determined for each item in the scale. The CVI scores for the draft form ranged between 0.64 and 1.00. Six items with a CVI value <0.80 were removed from the scale. After completing the content validity of the scale, the draft scale with 30 items was finalized.
Step 3: Pilot test
After content validity, a pilot study was conducted with 25 participants (10 males, 15 females) to assess the clarity and applicability of the scale. The pilot study revealed that no changes were needed in the draft form. The participants from the pilot study were not included in the main sample.
Step 4: Psychometric evaluation of the Breastfeeding Myths Scale
The data of the study were analyzed using SPSS version 22 and LISREL (version 8.80) software packages. EFA was performed to test the construct validity of the Breastfeeding Myths Scale. EFA was conducted using principal component analysis. After determining the structure of the developed scale, CFA was performed to confirm the identified structure on a different sample. Before conducting CFA, the multivariate normality distribution of variables was examined using the Mardia test. The result of the Mardia test indicated that the assumption of multivariate normal distribution was not met, as it exceeded 3.
Therefore, robust maximum likelihood estimation based on the correlation matrix was used for CFA. The reliability of scale scores was assessed using the Cronbach's alpha coefficient. In addition, test–retest reliability of scale scores was calculated by administering the scale twice to 35 participants with a 3- to 4-week interval. Test–retest reliability was calculated using the intraclass correlation (ICC) coefficient. Moreover, a receiver operating characteristic (ROC) analysis was conducted, in consideration of the participants' level of knowledge about breastfeeding, to determine the cutoff point of the Breastfeeding Myths Scale.
Ethical aspect of the research
To conduct the research, approval was obtained from the Ankara University Ethics Committee (Date: December 12, 2022, Reference No.: 19/177). Online informed consent was obtained from all participants. After clicking on the link, participants were directed to the informed consent page. The informed consent form informed them that participation was voluntary and they had the right to refuse participation or withdraw from the study at any time. The form also provided information about the use of anonymous surveys and the confidentiality of survey information.
At the end of the informed consent process, participants were asked to either accept or decline participation. Participants who declined to participate were directed to a thank-you page, whereas those who accepted were directed to the survey forms. Participants who agreed to participate were asked whether they would like to participate in the retest at the end of the data collection forms. Those who answered “Yes” were asked to provide a pseudonym and e-mail address.
Results
Participant characteristics for EFA and CFA are presented in Table 1. The mean age of participants in the EFA was 38.88 ± 8.46 years, and the mean age of those in the CFA was 36.62 ± 10.48 years.
Participants Characteristics
Max, maximum; Min, minimum; SD, standard deviation.
Exploratory factor analysis
The Breastfeeding Myths Scale consists of 30 items, and all of the items are negatively worded, thus requiring reverse coding. Before conducting EFA, the Kaiser–Meyer–Olkin (KMO) and Bartlett's test of sphericity (KMO = 0.862; Bartlett's statistic = 2,015.442/standard deviation (SD) = 435/p < 0.001) values were examined, indicating that the sample size was suitable for factorization. Upon examining the eigenvalues and the explained variance ratios obtained from EFA, it was observed that there were eight factors with eigenvalues exceeding 1.
However, it was found that the ratio of the variance explained by the first factor to the variance explained by the second factor (29.429/7.024
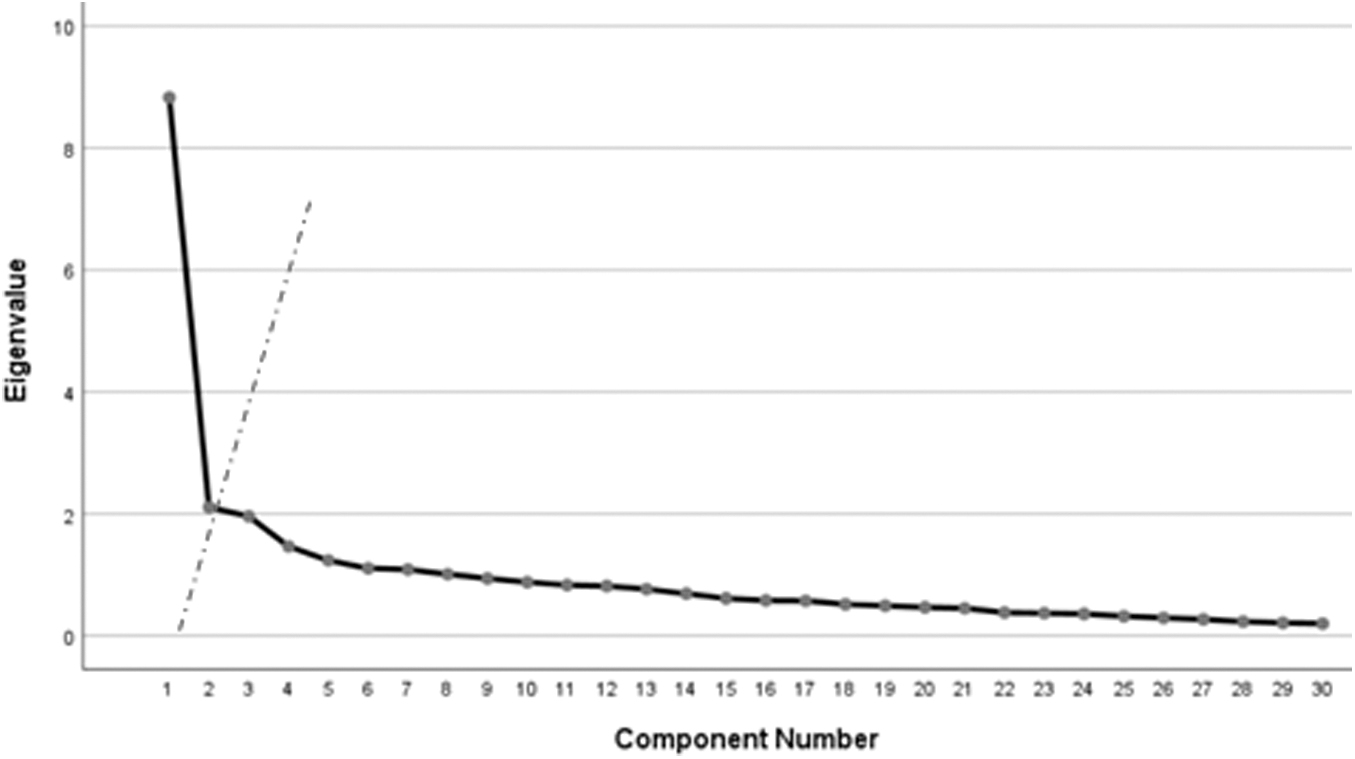
Scree plot for the Breastfeeding Myths Scale.
The factor loadings of the items in the Breastfeeding Myths Scale are presented in Table 2. Upon inspection of the table, it is evident that the factor loadings of the items in the scale ranged between 0.30 and 0.67.
Factor Loadings of the Breastfeeding Myths Scale Items
The CFA
After the EFA conducted on the Breastfeeding Myths Scale, developed during research, it was determined that it exhibited a one-dimensional structure. To validate this one-dimensional structure, the scale was applied to a group of 208 individuals, and CFA was conducted using the obtained data set. During CFA, model fit was evaluated based on fit indices, factor loadings, and error variances. The fit indices, factor loadings (maximum–minimum), and error variances (maximum–minimum) are presented in Table 3. In addition, the measurement model obtained from the analysis is shown in Figure 2.

Measurement model of the Breastfeeding Myths Scale. BMS.
Confirmatory Factor Analysis Results of the Breastfeeding Myths Scale
CFI, comparative fit index; NFI, normed fit index; NNFI, non-normed fit index; RMSEA, root mean square error of approximation.
Reliability
Scale reliability was determined by calculating Cronbach's alpha and test–retest reliability. The calculated Cronbach's alpha value for the Breastfeeding Myths Scale scores was determined as 0.91, and the test–retest reliability (ICC) was 0.90.
ROC curves and sensitivity–specificity analysis
The ROC curve obtained based on individuals with breastfeeding knowledge is shown in Figure 3. As a result of the ROC analysis, the area under the curve (AUC) was determined to be 0.71. According to the results of the ROC analysis, the optimal cutoff point was determined to be 119.50, with a sensitivity of 86% and a specificity of 53%.
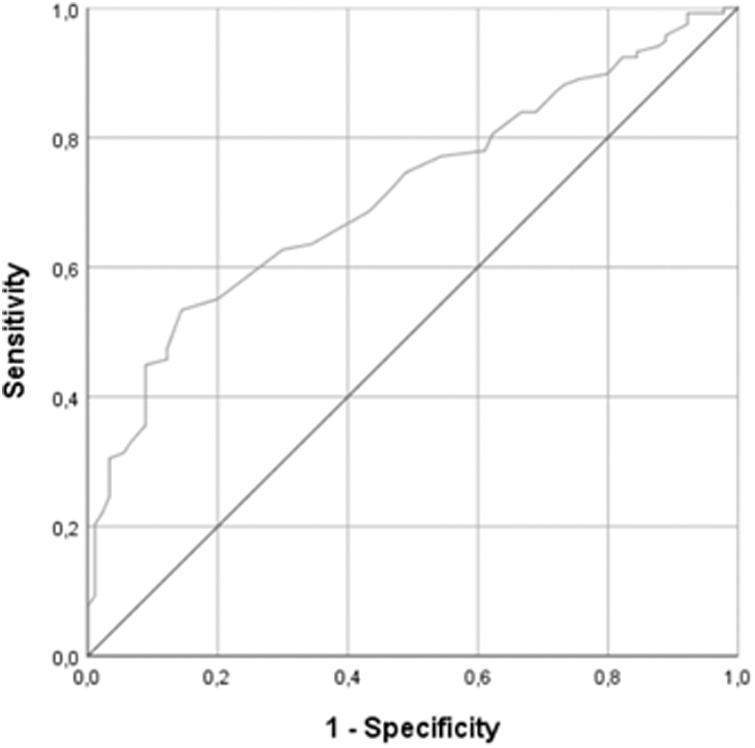
Receiver operating characteristic curve for the Breastfeeding Myths Scale.
Discussion
When the eigenvalues and explained variance percentages for the Breastfeeding Myths Scale were examined, it was observed that there were eight factors with eigenvalues >1. However, it became evident that the ratio of the variance explained by the first factor to the variance explained by the second factor (29.429/7.024
In consideration of this, the scale was accepted to have a one-dimensional structure. In addition, when examining the scree plot shown in Figure 1, it is observed that the graph begins to level off after the first factor, which supports this result. Based on these results, it was determined that the Breastfeeding Myths Scale exhibited a single-factor structure. The total variance explained by the structure of the Breastfeeding Myths Scale was found to be 29.43%. In single-factor scales, it is considered sufficient for the explained variance to be ∼30%. 22 Given that the explained variance in the scale is very close to this value and considering that it is the first scale related to the subject, it may be mentioned to have an acceptable level of variance.
It has been observed that the factor loading values of the items in the Breastfeeding Myths Scale range between 0.30 and 0.67. Although item factor loading value is generally desired to be 0.45 or greater, items with a factor loading value of 0.30 can also be kept on the scale. 23 Since the factor loading value for each item was 0.30 and above, it can be said that the items serve their purpose in the dimension they are in.
The χ 2 /SD value is 2.06, which is <3, indicating that the model fits the data well. 24 The comparative fit index, normed fit index, and non-normed fit index values being >0.90 indicate that the model fits the data very well. 25 Root mean square error of approximation index since is <0.080, it may be mentioned that the model fits the data well. 26 When evaluated as a whole, the fit indices indicate that the one-dimensional model fits the data well.
The calculated Cronbach's alpha value for the Breastfeeding Myths Scale scores was 0.91, and the ICC was determined to be 0.90. A Cronbach's alpha coefficient close to 1 is preferred, and values between 0.80 and 1.00 are considered highly reliable. 27 ICC values between 0.76 and 0.90 indicate good reliability. 28 Based on this information, the reliability of the scale is found to be significantly high.
As a result of the ROC analysis, the AUC was determined to be 0.71. According to Hosmer et al., 29 a value of 0.7 ≤ AUC <0.8 is interpreted as having an “acceptable” separability. Therefore, the ROC analysis results for the Breastfeeding Myths Scale are considered to have acceptable separability. According to the results of the ROC analysis, the optimal cutoff point was determined to be 119.50, with a sensitivity of 86% and a specificity of 53%. Accordingly, individuals scoring <119.50 on the Breastfeeding Myths Scale are considered to have a low level of breastfeeding myths, whereas those scoring >119.50 are considered to have a high level of breastfeeding myths.
The breastfeeding myths held by women and the society they live in can be significant factors affecting breastfeeding behavior. Therefore, it is recommended to use the Breastfeeding Myths Scale in both research and individual clinical assessments. Addressing breastfeeding myths in the clinical evaluation of breastfeeding will contribute to the prevention and resolution of breastfeeding problems. Especially, the objective assessment of breastfeeding myths in breastfeeding counseling will serve as a guiding tool in the planning of the counseling process.
Based on the evaluation, it is recommended to provide education and counseling on existing myths, especially for individuals who score above the cutoff point. In addition, it is important to evaluate breastfeeding myths as a potential factor that could contribute to the existing issue in all individuals experiencing breastfeeding problems.
The scale developed in the research can be used in studies conducted with the aim of determining the prevalence of breastfeeding myths in the community and identifying the factors influencing the presence of breastfeeding myths. Developing the necessary strategies to determine the status of society's breastfeeding myths and eliminate such myths will positively influence breastfeeding behaviors. Furthermore, it is important to use the scale to determine the impact of breastfeeding myths on breastfeeding rates and practices.
This way, the limited existing literature that reports the influence of breastfeeding myths on breastfeeding behavior can be more effectively assessed and improved using an objective measurement tool. In addition, for the assessment of breastfeeding myths in different cultures and languages, it is recommended to conduct validity studies of this scale in various sample groups. The Breastfeeding Myths Scale, when utilized in both clinical and research settings, will serve as a valuable tool for identifying and resolving breastfeeding problems rooted in myths.
Conclusion
In this study, the Breastfeeding Myths Scale, which aims to evaluate myths about breastfeeding, has been accepted as a valid and reliable tool with its 30-item and single-factor structure. The scale can be applied to all individuals including men and women aged 18 years and over. All items in the scale are reverse coded. The minimum score that can be obtained from the scale is 30, and the maximum score is 150. As the total score obtained from the scale increases, the level of having breastfeeding myths increases, and as the total score obtained from the Breastfeeding Myths Scale decreases, the level of having breastfeeding myths decreases.
In addition, a cutoff point of 119.50 has been determined for the scale. Accordingly, individuals scoring <119.50 on the Breastfeeding Myths Scale are considered to have a low level of breastfeeding myths, whereas those scoring >119.50 are considered to have a high level of breastfeeding myths.
Footnotes
Authors' Contributions
N.Y.S., M.N.A., İ.M.G., and Ş.T. conceptualized and designed the study and carried out the clinical data collection. N.Y.S. and İ.M.G. performed data analysis. N.Y.S., İ.M.G., and Ş.T. wrote the first draft of the article. N.Y.S. and M.N.A. reviewed and revised the article. All authors read and approved the final article.
Ethical Approval
Permission to conduct this study was obtained from the ethical committee of Ankara University (Date: December 12, 2022, Reference No.: 19/177).
Disclosure Statement
We wish to confirm that there are no known conflicts of interest associated with this publication.
Funding Information
We wish to confirm that there has been no significant financial support for this study that could have influenced its outcome.