
Abstract
Background:
Lactoferrin (LF) is a multifunctional glycoprotein found in human milk and body fluids, which has been shown to play a vital role in regulating the immunity and supporting the intestinal health of infants.
Aim:
This study evaluated the association between maternal/parturient factors and LF concentration in the breast milk of Chinese mothers.
Methods:
207 breast milk samples were collected from healthy mothers with in the first year of lactation. Maternal and parturient information was collected for these participants through questionnaires. The content of lactoferrin in breast milk was detected by liquid chromatography, and macronutrient concentration in breast milk was measured by human milk analyzer in only 109 samples.
Results:
Our findings demonstrated that the LF content was much higher within the first month of lactation than it was after that period (p < 0.05). When compared with normal and lean mothers, the LF content of obese mothers was considerably higher (p < 0.05). The parity and LF content showed a favorable correlation. The proportion of LF to total protein tended to decrease as lactation progressed. Protein, fat, dry matter, and energy content were significantly positively correlated with LF content (p < 0.001).
Conclusion:
Early breast milk tends to have a higher level of LF, and the change of LF concentration in breast milk is associated with the parity and body mass index of the mother.
Introduction
Proper nutrition is critical for the growth and development in infancy, and is considered necessary for optimal health later in life. 1 As the ideal and preferred source of nutrition for infant, breast milk can provide a complete nutrition package for the normal growth and development of immune system, nervous system, digestive system, and beyond. 2 These benefits were traditionally attributed to a large number of biologically active nutrients in the breast milk, including human milk oligosaccharides, lactoferrin (LF), immunoglobulin, osteopontin, and lysozyme.3,4
LF, an 80 kD a binding glycoprotein, is the second-most abundant functional protein in human whey and has strong proteolytic resistance. 5 LF is less hydrolyzed or digested in the infant's stomach and is believed to retain its biological activity in the gut. 6 Intact LF moves to the gut and plays a role in regulating the gut health by improving the integrity of the gut barrier and reducing the abundance of harmful bacteria such as Escherichia coli and Salmonella spp.7,8 LF prevents the growth of pathogenic microorganisms by chelating their iron. 9 LF also binds nonspecifically to biomolecules, such as lipopolysaccharides found in the cell walls of gram-negative bacteria, exerting a powerful bactericidal effect.10,11 LF is anti-inflammatory, regulating the level of immune factors by activating immune cells and other pathways.11–14
There is also evidence that LF can significantly reduce the incidence of necrotizing enterocolitis (stage II or above) in premature infants and treat allergic rhinitis.15–17 In addition, LF may also boost brain development by improving cognitive abilities such as learning, memory, and stress.18,19
The content of LF in breast milk may vary by individual ethnicity, environment, diet, stage of lactation, and so on. 20 A systematic review based on global data reported that LF content was high in early milk(<28 days), averaging at 4.91 g/L, while in mature milk (≥28 days), the content decreased and levels off to 2.10 g/L. 5 Interestingly, the LF content increases significantly in mature milk after 1 year to more than 4.90 g/L. 5 The concentration of LF also varies significantly across different regions and ethnic groups in China. For example, the LF concentration in Guangdong Province (1.91 g/L) was significantly higher than that in the Heilongjiang (1.44 g/L) and Gansu Provinces (1.43 g/L), and the difference in LF concentration between Dai ethnic group (1.80 g/L) and Han ethnic group (1.62 g/L) was significantly higher than that of the Tibetan ethnic group (0.99 g/L). 21
It has also been suggested that having a female fetus leads to a higher level of LF in colostrum. 22 Ella et al. also showed that young mothers (<20 years old) had higher levels of LF in colostrum, transitional milk, and mature milk than older mothers. 23 Throughout lactation, there are significant changes to LF and other components of breast milk. The content of immune factors such as LF, immunoglobulin A (IgA), and immunoglobulin M (IgM) decreased with the increase of lactation period. 24 The concentration of LF is also found to negatively correlate with the concentration of carbohydrates and positively correlate with the concentration of fat, protein, true protein, dry mass, and energy. 25 Based on that, this study analyzed the change of LF content in human milk associated with maternal age, maternal body mass index (BMI), parities, preterm birth, infant sex, and delivery mode.
Materials and Methods
Study design
This study was based on the breast milk study by the Junlebao Dairy Group Co. Ltd., which recruited mothers with in the first year of lactation in Hebei, China. Mothers who agreed to participate were enrolled and filled out questionnaires used to collect maternal information (age, height, and weight) as well as delivery information (type of delivery, parity, and infant gender). The current study was approved by the Medical Ethics Committee of Hebei Medical University (No. 2021111, December 27, 2021), and all participants signed the informed consent. The contents of LF in 207 breast milk samples from all the participants were determined, and the contents of macronutrients in 109 breast milk samples were measured.
Sample collection
Breast milk samples were collected between 9 a.m. and 11 a.m., through a breast pump and put into a milk storage bag. One session of milk expression should not deprive the infant of their nutritionally required volume. After collection, the samples were frozen and stored at −80°C before analysis. A total of 207 breast milk samples were collected in this study, including 9 colostrum (1–7 days), 18 transition milk (8–14 days), and 180 mature milk (15–365 days).
Determination of LF in breast milk
Add 1 mL of breast milk sample to phosphate buffer (30.083 g/L Na2HPO4·12H2O and 2.496 g/L NaH2PO4·2H2O) and volume to 50 mL, mixed well and centrifuged (15 minutes, 9,000 rpm, 4°C). The middle layer liquid was absorbed into another centrifugal tube, centrifuged again, and the supernatant was absorbed, and purification of active LF by heparin affinity column.
The heparin affinity columns were placed on the spe, and the preservation solution in the column was drained. The affinity columns were first balanced with 5 mL of phosphate buffer. When the liquid level approached the sieve plate, 10 mL of sample solution was added. Then 10 mL of wash (15.04 g/L Na2HPO4·12H2O, 1.248 g/L NaH2PO4·2H2O, and 5.84 g/L NaCl) was added to wash the impurities of the affinity column. Finally, 4.0 mL of elution (15.04 g/L Na2HPO4·12H2O, 1.248 g/L NaH2PO4·2H2O, and 58.4 g/L NaCl) was added into the affinity column, and flow-through was collected at a constant volume of 4.5 mL. Then mixed by vortex, the samples were filtered through a 0.22 μm microporous membrane and detected by high performance liquid chromatography (HPLC).
The LF contents were determined by HPLC (1260; Agilent, CA, USA) and Variable Wavelength Ultraviolet Detector (G7114A; Agilent). The chromatographic column was Agilent AdvanceBio RP-mAb C4 (4.6 × 150 mm, 3.5 μm). An aqueous solution containing 0.1% trifluoroacetic acid (A) and an acetonitrile solution containing 0.1% trifluoroacetic acid (B) were used as mobile phases. The following gradient elution processes are used for HPLC separation: 0–2 minutes, 5% B, 2–5 minutes, 5–80% B, 5–8 minutes, 80% B, 8–9 minutes, 80–5% B, 9–13 minutes, back to 5% B. All samples were analyzed within 24 hours after sample preparation.
Measurement of the main components in breast milk
Each sample and working solution were initially heated in a water bath at 40°C and homogenized at 1.5 s/mL using a sonicator (Sonicator®; MIRIS, Uppsala, Sweden), to separate the lipid phase and avoid protein aggregation. Breast milk macronutrient concentration was measured using a human milk analyzer (HMA) (MIRIS) according to methods used in previous studies. 26 After analyzing the sample 10 times, clean the instrument through the cleaner working liquid. The HMA is based on midinfrared spectroscopy, enabling the assessment of fat, protein, lactose, energy, and total solid content.
Protein is the protein content based on the total amount of nitrogen in a sample. This means that nonprotein nitrogen compounds are also included in this value. True protein is corrected for this and represents only the content of actual protein. The obtained results are expressed in g/100 mL.
Statistical analysis
All continuous variables were tested for normality. Data that do not conform to normality were presented as the median with 25th–75th percentiles. Quantitative variables, such as maternal age and maternal BMI, were categorized using standard cut-off points. Comparisons between analyzed groups were performed using the Kruskal–Wallis test. To determine whether any relationships existed among the concentrations of LF and analyzed factors, the correlations were evaluated according to Spearman's coefficient. A multivariable linear regression model was used to determine the relationship between LF levels and macronutrients in breast milk. Draw a correlation heat map to analyze the correlation between multiple variables. A p-value lower than 0.05 was considered significant. All analyses were conducted using SPSS Statistics Version 26 (IBM Corp., Armonk, NY, USA).
Results
This study recruited 111 lactating Chinese women and collected 207 breast milk samples. General information of subjects is listed in Table 1. Median maternal age of all subjects was 30 years, and median BMI of all mothers was 23.73 kg/m2. Cesarean section rate was 40.54%, primiparous rate was 61.26%, and parity was mainly 1 or 2. Boys made up 53.15% of the infants in the study. Milk samples could be divided into nine groups according to lactation time: 1–7 days (colostrum, n = 9), 8–14 days (transitional milk, n = 18), 15–30 days (n = 14), 31–60 days (n = 21), 61–120 days (n = 52), 121–180 days (n = 39), 181–240 days (n = 27), 241–300 days (n = 17), and 301–365 days (n = 10).
Characteristics of Study Subjects
BMI, body mass index; SD, standard deviation.
LF concentration during lactation
Median LF concentration in milk obtained from Chinese mothers was 3.03, 2.07, and 0.83 g/L for colostrum, transitional milk, and mature milk, respectively.
The LF content was much higher within the first month of lactation than it was after that period (p < 0.0001). With the progression of lactation, the concentration of LF gradually decreased and stabilized (Fig. 1a).
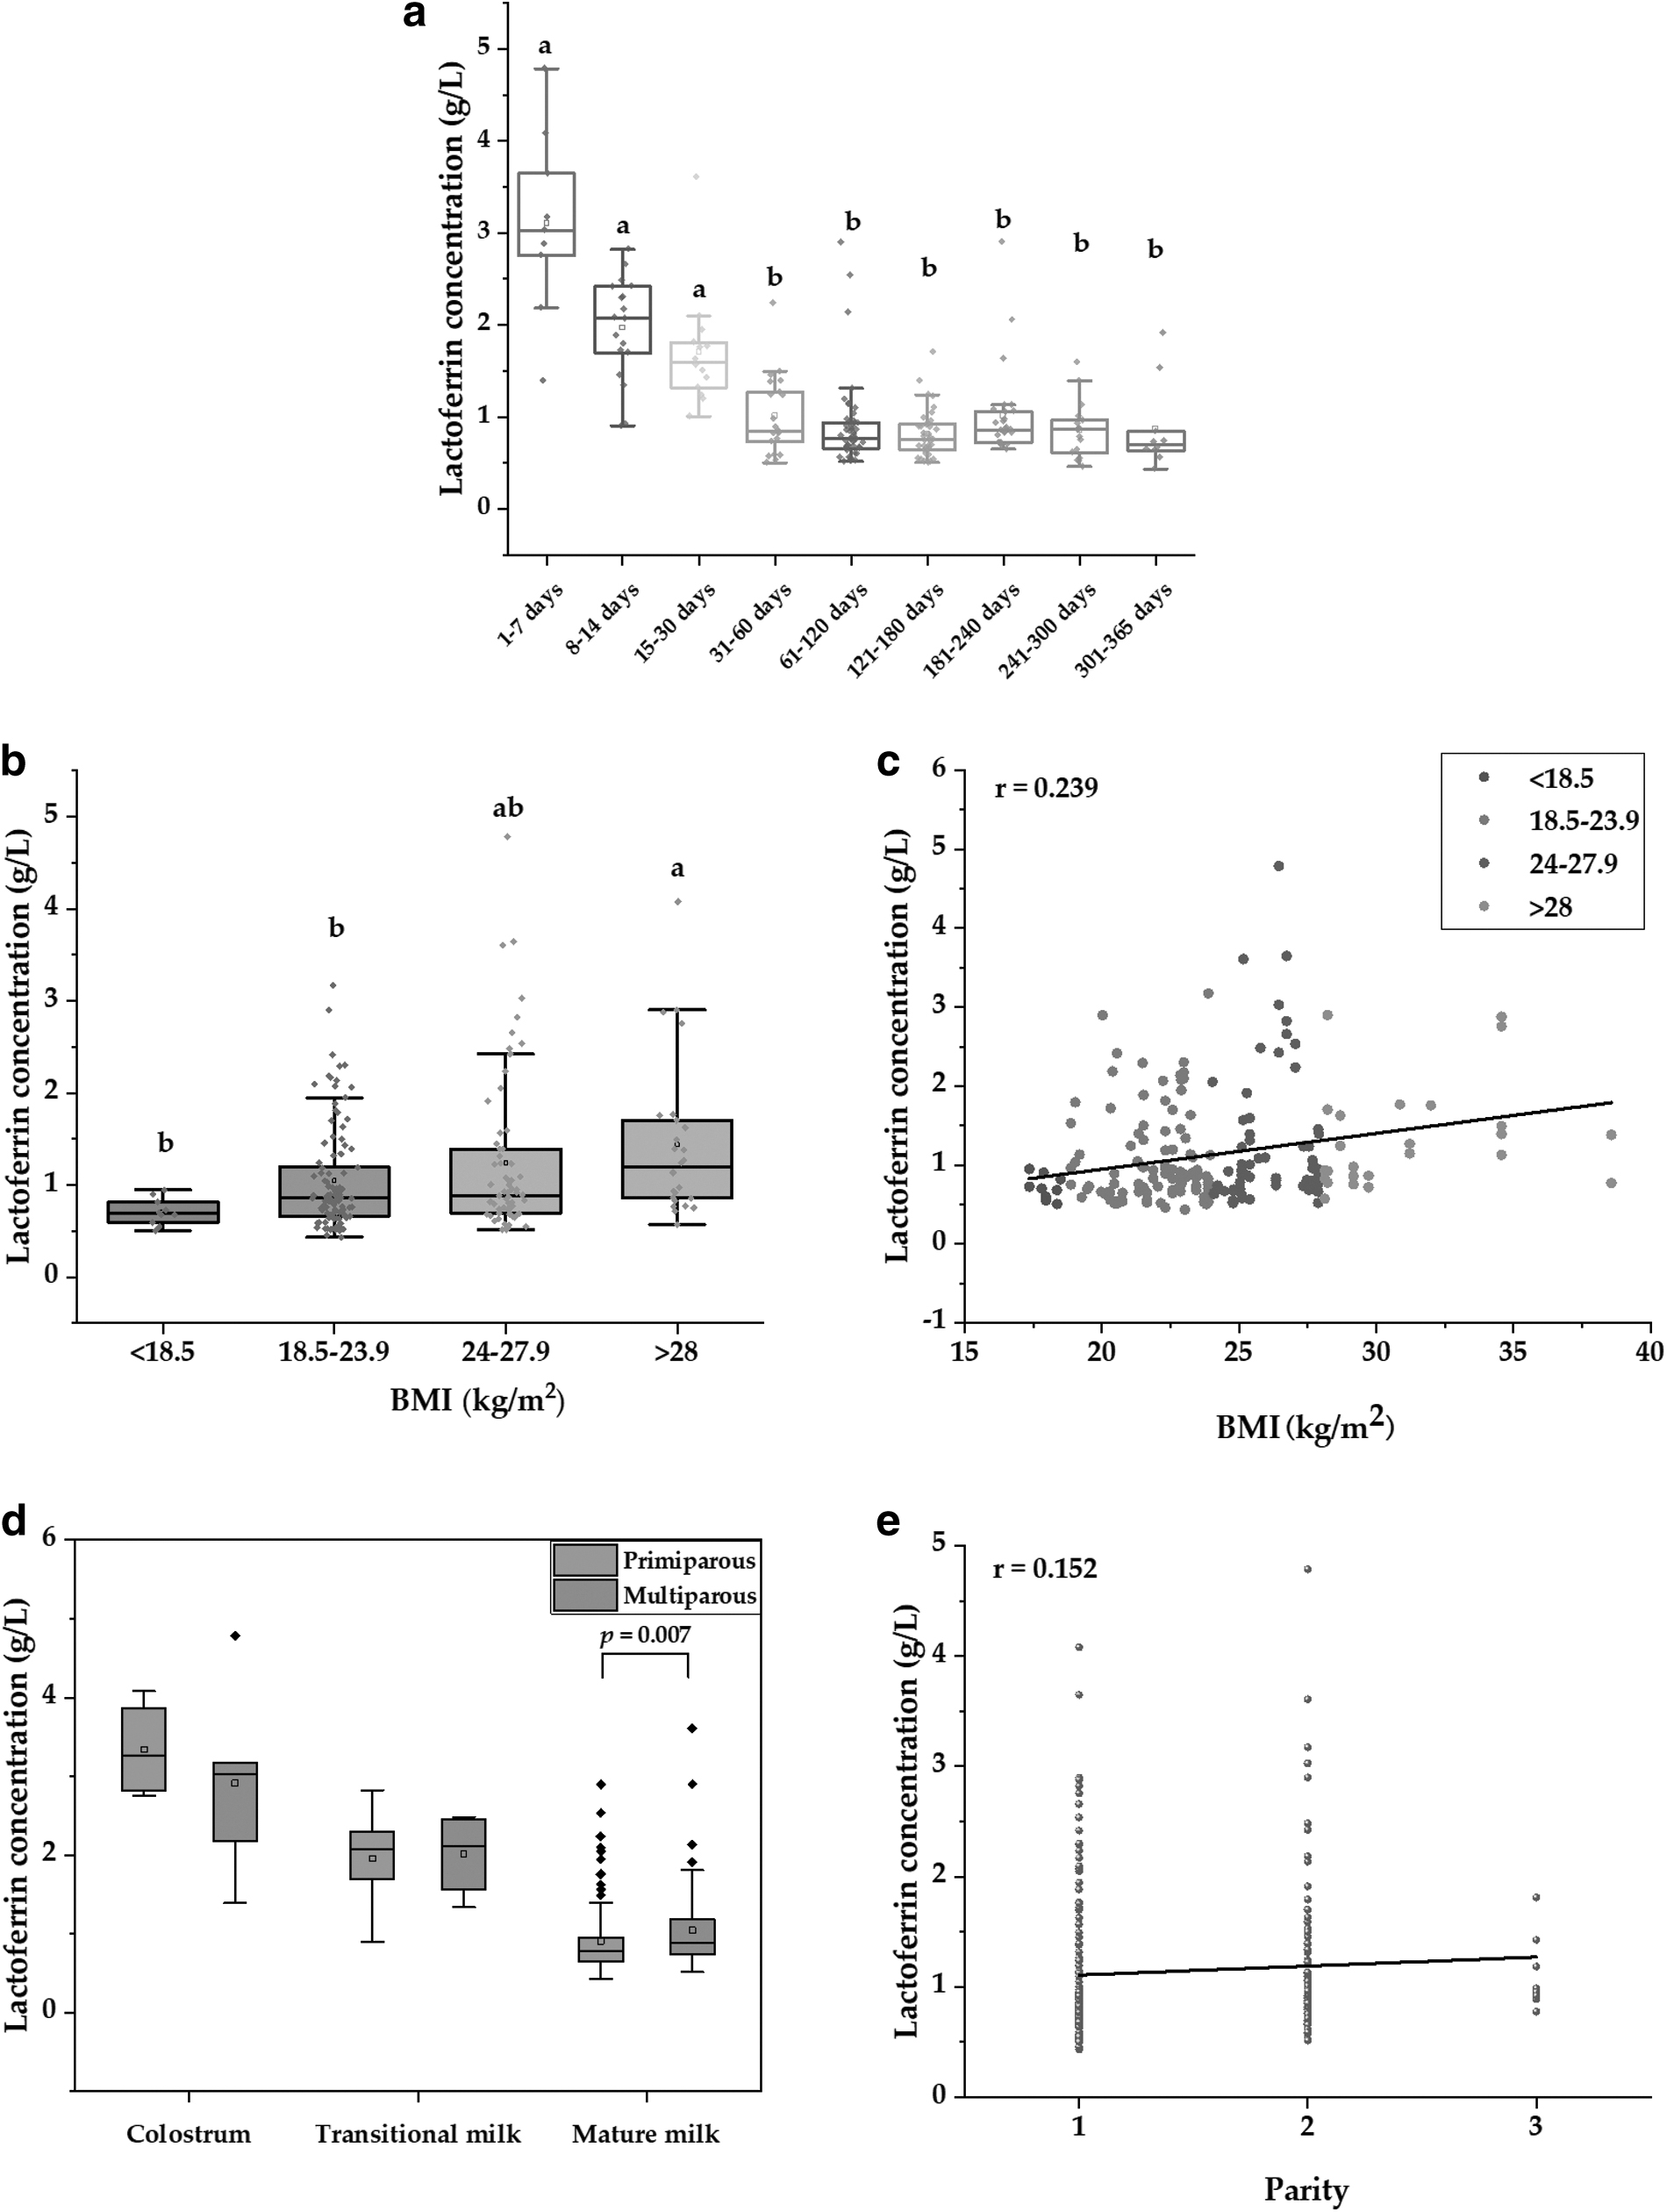
The changes of LF in lactation, maternal factors, and parturient factors.
LF levels in relation to maternal factors
In this study, there was no significant correlation between maternal age and LF concentration in breast milk (p > 0.05) (Table 2).
Lactoferrin Levels in Breast Milk by Maternal Factors and Parturient Factors
Data are presented as the medians (interquartile ranges). The Kruskal–Wallis test was used for statistical calculations, and a p1 value lower than 0.05 was considered significant. The Spearman correlation test was used for the correlation between maternal and parturient factors and lactoferrin concentration, the r value represents the Spearman's correlation coefficient, and a p2 value lower than 0.05 was considered significant.
LF, lactoferrin.
According to China's adult nutrition guidelines, the nutritional status of Chinese women can be divided into the following four categories: wasting (BMI <18.5 kg/m2), normal weight (BMI: 18.5–23.9 kg/m2), overweight (BMI: 24–27.9 kg/m2), and obese (BMI ≥28 kg/m2). Our study found that LF concentration in obese mothers was significantly higher than that in normal and wasting mothers (BMI <18.5 kg/m2, 0.69 g/L LF; BMI: 18.5–23.9 kg/m2, 0.86 g/L LF; BMI >28 kg/m2, 1.19 g/L LF; p = 0.002) (Fig. 1b). There was also a significant positive correlation between maternal BMI and LF concentration in breast milk, although the correlation was not strong (p = 0.001, r = 0.239) (Table 2 and Fig. 1c).
LF levels in relation to parturient factors
The concentration of LF in breast milk was not significantly affected by different delivery modes, such as vaginal and C-sections (p = 0.579) (Table 2). Due to fewer people in China having more than three children, we analyzed LF levels in primiparas and multiparas by the Kruskal–Wallis test. The results showed that LF concentration was significantly higher in multiparous mothers than in primiparous mothers (p = 0.037) (Table 2). When analyzed according to the number of pregnancies, a significant positive correlation was also found between parity and LF content in breast milk (p = 0.029) (Fig. 1e). In mature milk, the LF concentration of multiparas was significantly higher than that of primiparas (p = 0.007) (Fig. 1d). Between infant sexes, there was no significant difference in the LF content in breast milk (p > 0.05) (Table 2).
Relationship between LF and macronutrient concentrations in breast milk
With the progression of lactation, the ratio of LF to total protein showed a decreasing trend in 109 breast milk samples, and the ratio of LF to total protein in colostrum was significantly higher than that in mature milk (p = 0.021) (Fig. 2a). The median ratio of LF to total protein in colostrum, transition milk, and mature milk was 19.1%, 13.4%, and 12.2%, respectively.

Correlation between LF and macronutrients in breast milk.
A statistically significant positive correlation was found between LF concentration and total protein (r = 0.452, p < 0.001), true protein (r = 0.454, p < 0.001), fat (r = 0.406, p < 0.001), dry matter (r = 0.348, p < 0.001), and energy (r = 0.398, p < 0.001). No correlation was found between LF content and carbohydrate (r = −0.125, p = 0.195) (Table 3).
Correlation Result Between the Lactoferrin Level and Macronutrient Level During Lactation
The Spearman correlation test was used for the correlation between lactoferrin and macronutrient levels, the r value represents the Spearman's correlation coefficient, and p < 0.05 is considered significant.
To demonstrate the connection between LF content and true protein, fat, and energy in breast milk, we constructed a multivariable linear regression model. As shown in Table 4, the effect of true protein content on LF was statistically significant (b = 0.197, t = 10.822, p < 0.001). Fat (b = 0.104, t = 5.907, p < 0.001) and energy (b = −0.010, t = −5.768, p < 0.001) also had significant effects on LF content.
Multivariable Linear Regression Model of Lactoferrin and Macronutrient Levels in Breast Milk
In the multivariable linear regression model, b value represents the partial regression coefficient, and beta is the standardized b value, that is, the standardized regression coefficient. t-Value is a linear regression test statistic. p < 0.05 indicates that the regression relationship between independent variable and dependent variable is established, and dependent variable is correlated with independent variable.
Correlation between factors influencing LF content in breast milk
Correlation heat maps were used to visualize potential influencing factors for the LF level in 109 breast milk samples (Fig. 2b). LF content was negatively correlated with lactation (r = −0.42) and positively correlated with maternal BMI (r = 0.39). LF content was also positively correlated with true protein (r = 0.45), fat (r = 0.41), dry mass (r = 0.35), and energy (r = 0.40) in breast milk.
Discussion
We studied the changes of LF content in breast milk within 1 year after delivery, and reported that with the progression of lactation stage, the LF content decreased in the first month and then stabilized. This result is consistent with other studies.5,27 Within China, Yang et al. monitored the LF contents of 824 mothers from 11 regions, and the concentration of LF in milk of full-term mothers was 3.16 g/L in colostrum, 1.73 g/L in transitional milk, and 0.90 g/L in mature milk, respectively. 21 Cai et al. examined 248 lactating mothers from 8 different regions in China and found that LF content in breast milk was 3.85 g/L during 1–7 days, 1.58 g/L during 8–16 days, and 1.15 g/L during 31–90 days. 28 These results align with the measured data in this study.
This study measured previously uninvestigated breast milk data of mothers in Hebei Province, bridging the gap in China's rich geological resource data. Breast milk from Chinese mothers has lower levels of LF compared with other countries. This is most likely due to differences in genetic variations, geography, and diet, as Deshanie et al. reported that LF content varies greatly between continents and countries. 5
The LF content of breast milk is also related to maternal and parturient factors. Our study showed that the median LF content in obese mother's breast milk is significantly higher than that of normal and wasting mothers, and that maternal BMI was positively correlated with the level of LF in breast milk. Cai et al. also found that an increasing trend of the median of the LF content in breast milk is observed in Chinese mothers with increasing BMI. 28 The colostrum of mothers who were more than 90% weight for height, an older surrogate measure for obesity (i.e., a BMI >30 kg/m2), had a considerably higher LF concentration. 29 One possible explanation for this could be because obesity alters the immunological composition of breast milk, which in turn raises the concentration of immune components, including LF, IgA, IgM, and interleukin-10, in breast milk. 30
In addition, it suggests that an inadequate nutritional status of the mother may lead to insufficient nourishment and immune protection for the infants. Estrogen plays a role in the expression of LF. 31 Thus, an additional hypothesis is that a rise in maternal BMI could influence the production of hormones, thereby increasing the amount of LF in breast milk. 32
In this study, it was found that another significant influencing factor of LF content in breast milk was parity. There was a significant difference in LF content in breast milk between primiparous and multiparous mothers, and the content of LF showed an increasing trend with the increase of parity. Marquis et al. found that after controlling for maternal age, the more parity, the higher the level of LF. 33 In mothers who were less than 15 days postpartum, it was also discovered that the concentration of LF in breast milk increased with increasing parity. 29 However, Shashiraj et al. found that LF content was not related to parity. 34 Therefore, it is speculated that the relationship between parity and LF may be affected by other factors, and this mechanism needs to be further studied and explored.
We have found no effect of infant sex on LF in breast milk, which is supported by some studies.28,35 However, Liu et al. believe that mothers of girls have higher concentrations of LF than those of boys. 22 The effect of infant sex on breast milk LF content is still under debate. Ella et al. found that the content of lactoferrin in the breast milk of mothers with healthy babies at age 20 and below was greater than that of mothers aged 31–40 years. 23 In a study of 47 healthy mothers in the United Kingdom, Lewis-Jones et al. found the highest mean concentration of LF in mothers aged 17–21 years. 36 However, the age range of the participants in this study was 25–40 years old, which may be the reason why age has not been found to have an impact on LF content. Elective cesarean sections are a growing trend among women around the world, and Chinese women have a high proportion of C-section deliveries.
Therefore, we looked into how Chinese mothers' delivery methods affected the concentration of LF in their breast milk. According to our research, the LF level of breast milk was not significantly affected by the delivery method. Yang et al., who argued that there was little research demonstrating any impact of delivery mode on LF content in breast milk, backed up this opinion. 21
An examination of the correlations between the LF content and macronutrient content in 109 breast milk samples revealed that the proportion of LF to total protein in colostrum was significantly higher than that in mature milk. Liu et al. also found that as infants grew, the proportion of LF to total protein decreased, while the proportion of β-casein and α-lactalbumin to protein increased in breast milk. 22 It is speculated that LF acts as a major immune regulator and thus was produced more in the early stages of the newborn.21,37 As infants grow up, their immune system gradually develops and needs more nutritional support, so other proteins increase. 38 We found a significant positive correlation between LF and the contents of total protein, true protein, fat, dry matter, and energy in breast milk, but no correlation between LF and carbohydrates.
The results of Czosnykowska-Lukacka et al. are in good agreement with our study. 25 In later lactation, the mother produces more milk to meet the baby's growth needs. Therefore, lower concentrations of these nutrients in milk from a later stage of lactation do not necessarily lead to a decreased amount of protein consumed by infants. A multivariable linear regression model was formed by the contents of true protein, fat, and energy. This suggests that LF content is related to protein and other macronutrient levels in breast milk.
Our study evaluated the influence of various factors on LF in breast milk and reported promising results. The physiological mechanisms behind these findings warrant further investigation.
Conclusions
Compared with other countries, the content of LF in Chinese mother's breast milk is relatively lower, which may be influenced by genetic variations, geography, and diet. The content of LF in the first month of lactation was significantly higher than that after the first month. The proportion of LF to protein decreased gradually with the increase of lactation period. These changes may be related to the physiological and nutritional needs of the baby. Maternal BMI and parity were positively correlated with LF content in breast milk, and LF was related to the content of nutrients in breast milk. These results indicated that LF in breast milk was regulated by lactation period and maternal characteristics, and the specific mechanism needs to be further studied.
Footnotes
Acknowledgments
We would like to thank the staff of Junlebao for supporting and promoting the breast milk research program. We appreciate all the mothers who expressed breast milk for the study.
Authors' Contributions
M.W.: Conceptualization (equal); formal analysis (lead); investigation (lead); methodology (lead); resources (equal); validation (lead); visualization (lead); and writing—original draft (lead). Y.P.X.: Conceptualization (equal); investigation (supporting); resources (equal); and supervision (equal). H.D.: Investigation (supporting) and resources (equal). S.H.: Investigation (supporting). H.H.: Writing—original draft (supporting). Y.L.X.: Funding acquisition (equal) and project administration (lead). J.Z.: Writing—original draft (supporting). W.Y. and Q.Y.: Supervision (equal). S.W.: Funding acquisition (equal) and supervision (equal). Y.N.: Conceptualization (equal); supervision (equal); and writing—original draft (supporting).
Disclosure Statement
No competing financial interests exist.
Funding Information
This work was supported by the Natural Science Foundation of Hebei Province (C2022106017), Hebei Province full-time introduction of high-end talent research projects (2020HBQZYO21), and Key R&D plan of Hebei Province (21327110D).