
Abstract
Abstract
Significant research challenges must be addressed in the cleaning, transformation, integration, modeling, and analytics of Big Data sources for finance. This article surveys the progress made so far in this direction and obstacles yet to be overcome. These are issues that are of interest to data-driven financial institutions in both corporate finance and consumer finance. These challenges are also of interest to the legal profession as well as to regulators. The discussion is relevant to technology firms that support the growing field of FinTech.
Introduction
In many fields of endeavor today, data provide the basis for informed decision making. This is particularly true of macro-prudential analysis: Determination of financial stability requires cleaning, integration, and analysis of multiple, disparate, large, and complex sources of data in a timely way. In fact, the use of Big Data requires technical advances in multiple stages of the Big Data pipeline, as discussed by Jagadish et al. 1 These needs for data cleaning, integration, and analytics are universal, they span many domains, and there is considerable excellent research expanding the frontiers of what we are capable of doing in this regard. This article will provide an overview of some of the successes we have had, and the challenges that lie ahead.
Nevertheless, many solutions are, of necessity, situational, and we may invest more in tools and algorithms specifically for financial data. Indeed, the macro-prudential supervisor today too often suffers from a lack of actionable data, rather than a surfeit. Recent work by public and private agencies, such as the Financial Stability Report of the Office of Financial Research, 2 and that of the Banque de France, 3 focus on managing these data issues. The difference between the large volumes of source data and the shortage of actionable data is precisely the means to transform, clean, integrate, model, and analyze. This is an area of intellectual inquiry that crucially deserves attention.
The essential problem for individual financial firms is that data on individual transactions are collected in many separate data systems. Typically, those systems were created at different times, with different goals. They are designed and maintained by the individual business silos that they serve. Firm-wide consistency is hard to enforce, and it was not high priority for many institutions.
To get a picture of a financial firm as a whole, data from those disparate systems have to be aggregated. The process of aggregation is hampered by inconsistencies in the way that financial transactions are recorded. Such inconsistencies are an obstacle to automation. They make aggregation less flexible and more expensive.
These same issues apply with an even greater force at the system level. Different firms report data differently. It is a challenge for supervisors to integrate, aggregate, and analyze these data. 4
Modeling in finance must drive the specific implementation of data extraction and integration. Stein 5 argues that, in the realm of systemic risk analysis, models and data need to be aligned. The systemic risks associated with the subprime lending market and the crash of the housing market in 2007 could have been modeled through a comprehensive integration and analysis of available public datasets. For example, the datasets relevant to the home mortgage supply chain include the following: (1) regulatory documents made available by MBS issuers, publicly traded financial institutions, and mutual funds; (2) subscription-based third-party datasets on underlying mortgages; (3) individual home transaction data such as sales, foreclosure, and tax records; (4) local economic data such as employment and income levels; and (5) financial news articles. Integration of these datasets may have provided financial analysts, regulators, and academic researchers with comprehensive models to enable risk assessment.
This has, in fact, been tackled in many ways since the crisis. Dhar 6 highlights the trade-off between predictability and cost per error, very much in the vein of the quality control theory. But in general, the ability to create predictions at the system level is helpful, and it requires resolving large data problems. Progress is being made in this direction by researchers focusing on the mortgage space: See the discussion on using public data such as the Case-Shiller indexes, FHFA index, the NCREIF NPI, and NAREIT time series to improve system-wide predictions for the mortgage market. 7 The Real Estate and Financial Markets laboratory * at Berkeley is aimed at building a big data environment in which the real-estate markets may be monitored, and it will be an important test case for the various technical issues regarding the use of financial big data for market prediction. For an objective measure of systemic risk over time for the broad financial system, to identify and predict financial institutions that contribute most to this risk, see the recent work by Lo and Stein 8 ; Das et al., 9 which uses public information to create a systemic risk index and to identify risky firms. Getmansky and Stein 10 edit a volume of papers on systemic risk, and is a good reference.
Economists have been the leaders in creating longitudinal panel datasets and have had a successful history of using national datasets from the Census Bureau, the Department of Labor, etc., and global datasets from the United Nations, World Bank, etc. In this study, too, there has been much less activity in modeling that integrates multiple heterogeneous datasets. Although fusing information from multiple datasets may pose technical, policy, and privacy challenges, the potential benefits are immense. For example, social media data often contain features that could enhance macroeconomic statistics derived from traditional survey-driven datasets. Enriching longitudinal panel datasets with social media could explore hypotheses with a different focus or level of granularity; for example, one could study the decision making of individuals whose social media profiles would reflect their beliefs, intent, interests, sentiments, opinions, and states of mind.
To address these pressing needs, work is required in at least three areas that we consider in turn in the following sections: Data Integration, Data Quality, and Data Analytics. The ensuing ideas will benefit financial institutions in both corporate and consumer finance, legal practitioners and regulators, and also technology companies that provide tools for FinTech.
These areas are represented in the schematic flow diagram in Figure 1. Raw data arrive in multiple forms, in high volume, and at high speed. These notions of variety, volume, and velocity are well known as the three Vs of big data. First, multifaceted data require integration into standardized formats or schemas, and modern tools use machine learning and fuzzy matching to develop integrated and standardized data. At this point, there is no guarantee that the data are of high quality; however, they are likely to be de-duplicated and redundancies are removed. The next step involves data quality management. Removal of errors arising from mistakes in recording, in extraction, errors in entity matching, etc., all lead to better data accuracy, consistency, and integrity. Quality assurance also involves making sure data are complete through handling of missing values, and they are easy to use. Finally, once data quality has been assured, the business of adding value through analytics begins. We also note that there is feedback in this data pipeline. Quality management might throw up issues of integration, which feed into improvements earlier in the data pipeline. Likewise, data analytics often catches errors in the data, which then require further data quality improvements before further analysis may be undertaken. The bottom line is that handling big data in finance is a highly iterative process.
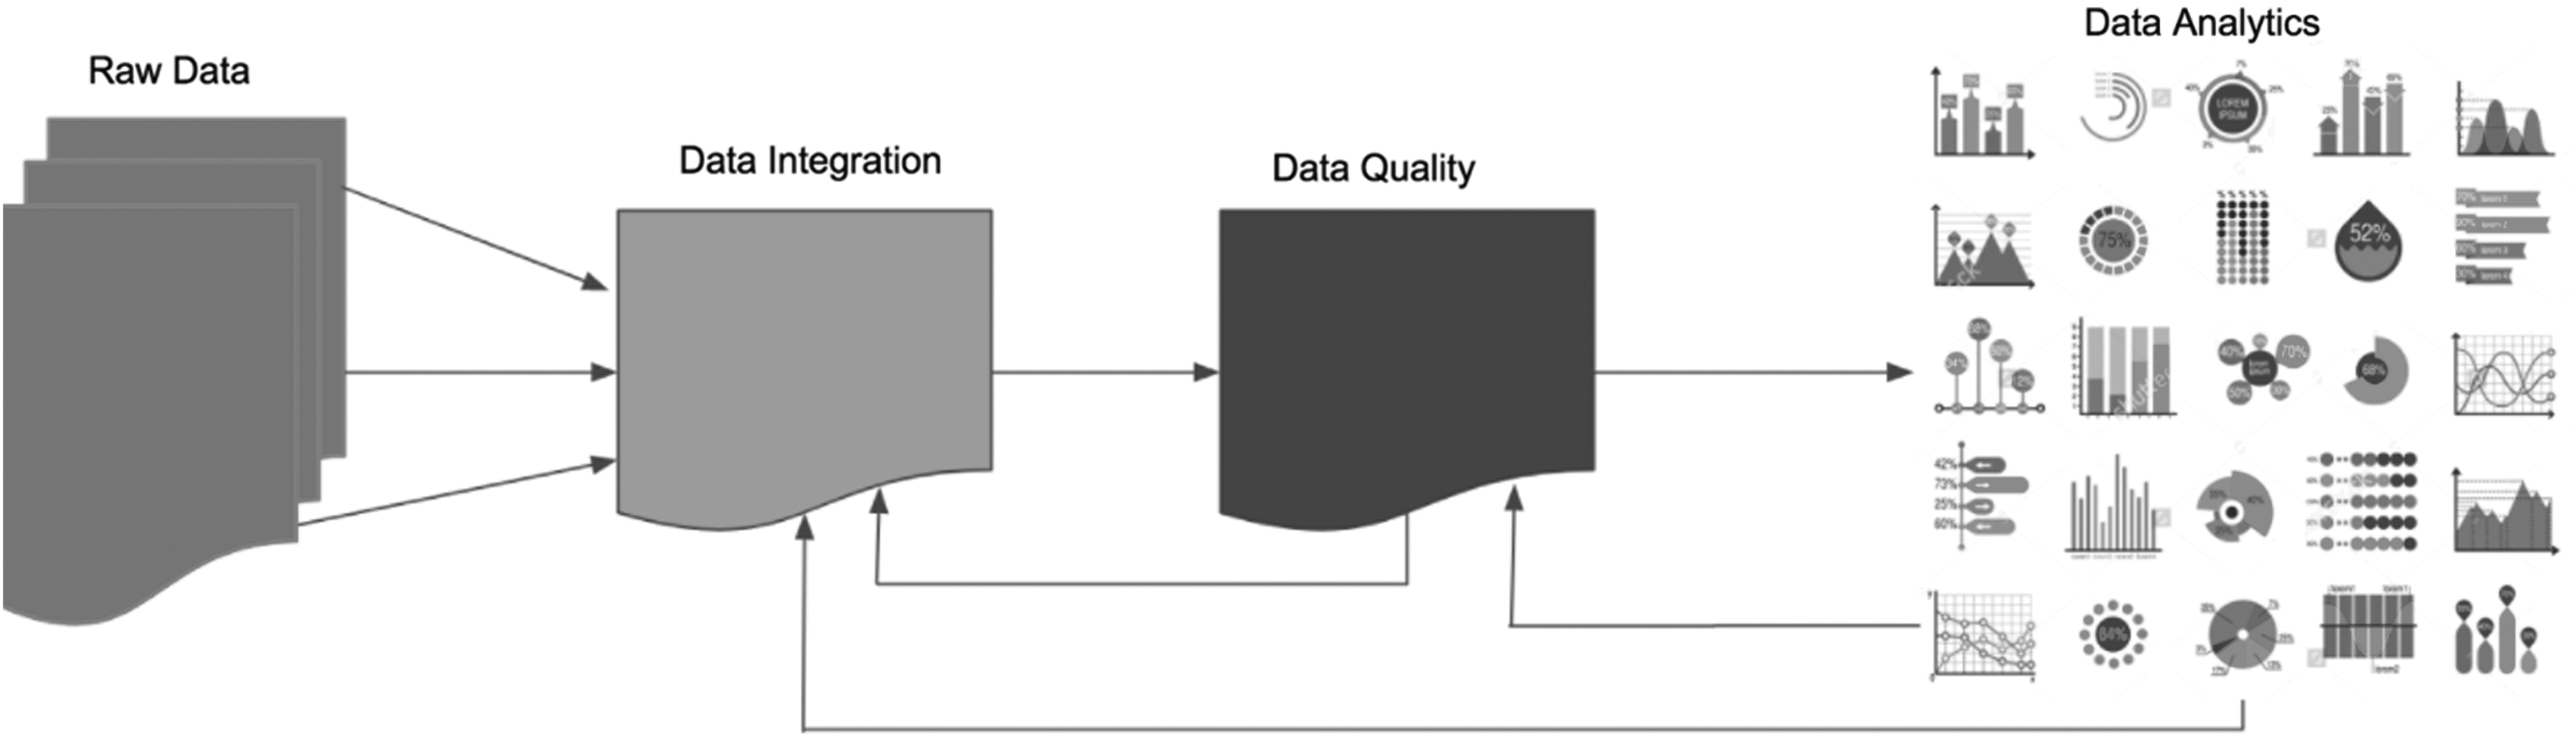
Schematic flow diagram of the three main concepts of the article with regards to data: integration, quality, and analytics.
Data Integration
It is hard to do data integration well, particularly at scale. The issue is not merely one of format conversion. Rather, each independently created data source makes its own data representation and modeling choices, with regard to schema, vocabulary, and even semantics. 11 The solution to this problem, in broad strokes, is to standardize wherever agreement can be achieved, and to work toward addressing the variety where standards are not possible. Since integrated data may not be uniformly reliable or relevant, their origins or provenance12,13 can help assess their reliability 14 and even be used to improve the quality of the integration. 15 Although there are many technical solutions that can assist in managing the lack of standards, the ultimate solutions in any context are usually a combination of application-specific tools with some common building blocks. In the following paragraphs, we detail some of the progress made in integrating big data in finance.
In this section, we highlight five methodological areas of data integration that are promising in their use of big data in finance: legal entity identifiers (LEIs), data aggregation, Entity Resolution (ER), text mining, and the use of artificial intelligence and deep learning.
Consider, for example, the standardization of the legal entity identification schemes across a range of independently managed datasets. 16 The recent agreement on a globally standardized LEI system is a huge step toward better financial data integration. 17 But the LEI alone is far from the end of the integration story. Inroads are being made to augment the identification of the first-generation LEI to include complex ownership relationships, 2 (p.70) and to map the LEI to other common identification schemes. 18 More advanced techniques would resolve colloquial mentions of names of financial institutions in news and social media and reconcile them with the formal identifiers. Xu et al. 19 perform ER of names from residential mortgage-backed securities prospectuses with institution names from a vendor list of asset-backed securities.
For macroprudential monitoring, a public Financial Entity Identification and Information Integration (FEIII) Challenge has been developed by the Office of Financial Research and National Institute of Standards and Technology (NIST) to research technologies for financial datasets (including text) using automated identifier alignment and ER. 18 This effort will create a reference knowledge base with prototype tools, connecting collections of heterogeneous entity identifiers from multiple sources to facilitate information integration, using structured data (e.g., regulatory filings) and unstructured data (e.g., news articles, blogs, and social media). In general, many records align trivially, but there are a number of factors that make certain cases complicated.
• The different regulators keep different data in each organization. For one, an address might be a single field; whereas for another, the address might be broken into three columns; and in another, it might only have a zip code.
• There are often inconsistencies in how entity names and addresses are entered, in addition to outright errors and typos.
• There is implicit semantic knowledge included in a name; for example, a name may contain “National Association” or “State Bank of” in its name. This complicates matching based on a similarity score that is obtained by using some edit distance metric.
A successful first-round challenge culminated in presentations at the Data Science for Macro Modeling (DSMM) workshop held in San Francisco in June 2016. A second FEIII challenge is now in process, further advancing the creation of a community that is interested in financial data integration.
Another difficulty in entity identification arises because firms tend to use varied nomenclature for the same line items in their financials. Or, the blending of line items tends to be different even when names are similar. This is a hard problem for which standardized solutions are not easy to find. There are varied approaches to tackling this problem, some of which are top-down in the sense that regulation forces firms to comply with defined formats, such as eXtensible Business Reporting Language. These efforts culminate in regulation such as that for Call Report generation promulgated by the Federal Financial Institution Examination Council (FFIEC) through Uniform Bank Performance Reports (UBPRs). The other approach is bottom-up where machine learning is used to detect similar lines of business despite different nomenclature. Startups such as Strattica Labs (http://www.stratticalabs.com) are focused on the latter approach.
High-quality data integration supports data aggregation. As an example, consider the variety of data needed for an evaluation of systemic risk. This task requires integration of data from multiple sources to obtain information about the financial system as a whole, and enough of its multiple aspects to permit meaningful analysis. The data needed here have high variety as we need information about exposures between banks for multiple asset classes, to construct a network to model interconnectedness, an attribute at the heart of systemic risk. Further, the quality of each bank is also important, and, therefore, credit information for banks is also needed. Banks tend to report data in myriad ways, though some standardization is evidenced in Call Reports. All these data are then aggregated by using mathematical models to arrive at scores for the entire financial system. Measuring systemic risk is, therefore, a classic case where data analytics is only possible if the data integration problem is properly solved.
An essential part of data integration is Entity Resolution. ER is the data-wrangling process of identifying, grouping, and linking disparate data about real-world objects or concepts. This process often entails de-duplication canonicalization, linking records, and cross-referencing. The Unstructured Entity Integration Team at IBM's Almaden Labs has created Midas, a system for data extraction and integration for use with disparate financial data. They have undertaken extensive work in high-level ER and integration over non-traditional data (this resulted in their high-level language, or HIL). Nine published papers emanated from the team related to HIL. This research has resulted in four filed patents.
There are several attractive features of HIL that make a significant scientific contribution, in addition to its practical value in applications. First, it combines extract-transform-load operations with ER. Second, it does so at a large scale in big data environments such as Hadoop/Spark (handling volume). Third, it easily combines data from various sources, providing an effective means of handling variety through efficient data integration. Fourth, the accuracy of the approach is extremely high, lending veracity to the process; both precision and recall were more than 90% in an exercise on FFIEC, Securities and Exchange Commission (SEC), and LEI data (this was done successfully for the NIST data challenge 18 ). Finally, the research is now embedded in products such as BigInsights and BigMatch (Patents: ARC820130036, ARC820130148, ARC820120144, and YOR820121699).20–28
Text mining has greatly expanded the range of analyses that rely only on numerical data. A growing number of financial institutions are interested in applying text mining tools to their management of portfolios, and for risk management. For a broad survey of tools and academic and practitioner applications. 29 HIL is a front-end tool that can make this possible. The general applicability of HIL speaks to its scientific appeal and potential, at least in the field of finance. In Burdick et al., 21 HIL was used to extract and integrate data from various types of public financial filings. Many of these filings are lengthy documents of unstructured text, including several numbers and tables. There is a fair bit of complex ER undertaken, where, for example, names of people are often confused names of financial firms (we have a large number of firms named after people, such as Goldman, Morgan, etc.). One would imagine that financial firms would report their data as required by regulation in standardized formats, but sadly, this is not the case, and as a result, careful engineering is needed to generate clean and useful data for further analysis. HIL has proved to be extremely helpful in this endeavor, and the article shows how to extract data to create a network map of the linkages between banks in the U.S. financial system, so as to analyze system-wide risk. This is the sort of big data application that has the potential to make a huge impact on regulators and the financial system. One may take this research further and propose more refined models for measuring systemic risk while assuming that systems such as HIL will generate the data to construct interbank networks. 30 There are many financial institutions, academics, and regulators in finance who are definitely interested in using HIL.
There are new tools now available for data integration that are extremely facile, and they have evolved from the domain of AI and machine learning. A good example of this is the software developed by Tamr, an MIT startup that now has a mature product (see http://www.tamr.com/). This state-of-the-art tool for data integration reduces days of data integration work down to a few hours. Enterprises can merge data from varied sources with intelligent interaction of a trained user. It is now being used by consumer marketing firms to integrate customer databases, by financial firms, and in applications on medical data.
Data Quality Management
Data often have errors, arising due to a variety of reasons. 31 These reasons include errors in data recording, both intentional and unintentional, errors in data extraction, such as from text document analysis, errors in entity matching, errors in interpreting under-documented values, and so on. Maintaining data quality is not easy, particularly for high-volume granular data, as discussed in the context of bank stress tests by Hunter. 32 The Basel Committee on Banking Supervision (BCBS) found that half the 30 systemically important banks that they studied are materially non-compliant with Principle 3 (data accuracy and integrity) in their implementation of the BCBS 33 principles on risk data aggregation. It appears that it will be difficult for many firms to be fully compliant with the Principles. 34 (p.3)
Data quality is a critical practical issue as bad data can result in costly erroneous decisions. 35 The magnitude of the data cleaning and preparation burden is growing rapidly, 36 and this has resulted in the launch of tools for automated data cleaning, 37 quality assessment, 38 and data integration. 39 Adapting these tools for use with financial data is far from trivial, as pointed out by Burdick et al.27,28; however, substantial progress has been made, as the forensics in IBM's Midas system picks up data errors seamlessly and IBM reported these back to the SEC as well. Commercial tools such as those developed by Paxata (https://www.paxata.com/) and Tamr (https://www.tamr.com/) are very useful in filtering, cleaning, and data preparation.
Data quality in financial reporting may be particularly prone to subversion because it benefits the recording agent to do so, as is the case with the well-known practice of window dressing, 40 or more complex schemes. It is also believed to be commonplace to place one-sided trades and then cancel them before settlement. † Any aggregates computed during the time window before cancellation can thus be manipulated.
One way to find data quality problems is to compare reports from two or more independent sources. For example, most contracts and trades have two parties, each of which may have some reporting requirements. Reconciling these reports can identify problems with the data, possible under-reporting by some party, and more. 24 But any such reconciliation first requires a step of data integration, which could be challenging in itself as already discussed. Similarly, when extracting data from social media, we know that the extraction results will be less than perfect, but techniques to do better are evolving. ‡ ,41 Corroboration with other sources can reduce error rates.
Data quality has also been the focus of recent legislation. The Basel committee released a consultative paper on data quality. 33 This paper (BCBS239), developed by the Task Force on SIB Supervision of the Standard Implementation Group of the BIS, enunciated 14 principles in 4 categories: data governance, risk data aggregation, risk reporting, and supervisory review. Data quality centers around some important attributes such as completeness (minimize missing values), validity (accuracy and consistency), and accessibility and ease of use. Informatica § developed a multiple criteria approach for assessing data quality that applies to the finance setting, broken down into data exploration (column profiling, relationship, redundancy), and data quality (completeness, conformity, consistency, accuracy, duplication, integrity, range). Many services firms such as SAS are engaged in the implementation of BCBS239. We are experiencing growing agreement on the definition of data quality, as well as increasing tools and services for implementation of data quality standards.
An aspect of data quality is timeliness. “Nowcasting” is a novel application of analytics in economics. The latency of economic indicators renders them ineffectual for policy making. 42 There is usually a delay of at least a quarter in the production of economic data on gross domestic product (GDP), inflation, etc., with the result that data analytics practitioners are now attempting to produce predictors of these statistics by using higher frequency data in the economy, both quantitative and textual, as well as poll data. Examples of work in this area are Evans, 43 Giannone et al., 44 and Babura et al. 45 Nowcasting is a perfect example of drawing data from various sources and integrating them for predictive analytics.
Data quality also includes issues related to biases in data. Big data help eliminate bias from small data, as argued in Choudhry et al., 46 where stereotyping substitutes for a good model, as loan officers often make decisions based on small data. We are all aware of the embedded biases in the long history of redlining loans in home mortgages. ** ,47 We may now eliminate such biases by using data that do not rely on “protected characteristics” such as race and gender. However, big data in consumer finance also have the potential to result in models that attribute erroneous causality, leading to victimization of underprivileged groups in our society. Such ills are outlined in detail in O'Neill. 48
Data Analytics
Several areas of finance have had at least some limited success in obtaining value from big data. In the next few paragraphs, we delineate some of these areas, and we explore some of the issues and challenges.
FinTech is a potentially disruptive paradigm related to big data in finance. Financial services remain expensive, because of either inefficiencies or the monopoly position of major financial institutions. Thus, technology-driven solutions are posing a threat to the traditional models of banking, insurance, and consumer finance. Philippon49,50 finds that the unit cost of financial intermediation has been around 2% for the past 130 years! (His measure is obtained as the ratio of the income of the finance industry to the quantity of intermediated assets. As another data point, the share of finance income to GDP has increased from 2% in 1940 to about 8% today.) This is similar across countries, and it is not a typically U.S. phenomenon. 51 Central FinTech innovations are cryptocurrencies and blockchains, digital advisory (robo) systems, automated trading, use of artificial intelligence and machine learning, peer-to-peer lending, equity crowdfunding, and payment systems, especially in the mobile space. All these new paradigms are based on big data and also generate data of a wide-ranging variety and size. See, for example, Khandani et al., 52 where they undertake credit risk modeling by using machine learning models on big data.
Model selection is a huge challenge with big data. Feature selection on an unstructured dataset can generate an arbitrary number of potential independent variables. This is also true of structured data. Sala-i-Martin, 53 working with a traditional growth equation, generated two million separate specifications from just 62 possible explanatory variables. Donoho and Stodden 54 point out that the number of variables can sometimes exceed the number of data points. Many big data sources, such as news archives, are novel to financial econometrics, and there are as yet few theoretical constraints to curtail the specification space. In the case of policy questions, an analyst is incentivized to get the “right” answer; thus, false discovery rates are a serious problem.55,56 Dhar 57 suggests using out-of-sample predictive power as a model-selection criterion to ameliorate some of these problems. The key point is that big data necessitate new approaches, not just faster hardware. Fan et al. 55 offer an overview of the challenges. Another challenge arises from the fact that rampant data mining results in false published research, 58 and the advent of big data will exacerbate this problem. More recently, this challenge has been highlighted in finance by Harvey et al., 59 and p-hacking in the literature has been thoroughly investigated in Hou et al. 60
Within the field of machine learning, methods of online learning with expert advice (e.g., Littlestone and Warmuth, 61 Herbster and Warmuth 62 ; see Cesa-Bianchi and Lugosi, 63 for a survey) may prove promising for applications to financial stability and monitoring. In this study, the learner has access to an ensemble of “experts,” where each expert is simply a time-series; it need not be a skillful predictor. For example, algorithm variants that specialize in learning from non-stationary data have advanced the state-of-the art in various problems in climate science.64–67 Recent advances68,69 in learning from time-series panel data that can vary over both time and the dimensions of the panel can address problems such as financial monitoring over multiple markets. 70 A recent work by McQuade and Monteleoni addresses data with multiresolution interactions in time, by providing an online multi-task learning approach, treating predictions at different time lags as the “tasks.”71,72 This approach showed promise in a recent application to financial volatility prediction. 72 The challenge here is to manage high-velocity data in conjunction with human interaction, so as to get maximal predictive ability.
Text Analytics is a field at the new frontier of financial analytics. Many hedge funds incorporate a text analytics layer in their strategies. †† The data show that hedge funds that use machine learning are outperforming those that do not ‡‡ ; see Figure 2. Commercial vendors abound in providing text-based macro signals (such as Ravenpack), or in providing stock signal information (e.g., StockTwits, iSentium). There is a vast plethora of text mining tools in finance, and for a detailed review.29,73,74 Text analytics is moving from simple and somewhat ad hoc word-mining to formal econometric approaches, both frequentist and Bayesian. A case in point is the widespread use of topic analysis in financial applications, using the methodology from the seminal work by Blei et al. 75 ; the paper develops Latent Dirichlet Allocation, a technique that may be seen to be analogous to the principal components analysis of text, though undertaken in a Bayesian framework. The principal challenge in text analytics is that it has not proved to be effective so far in a general way. Although a few applications have become successful, such as contract checking in the legal department of a large institution, there has been small impact in the main lines of business. Nor have textual data been merged effectively with quantitative data to provide a better use of the mass of information that has been collected by financial institutions. The first areas in which this is happening are retail lending, where social media textual information is now being used to improve credit models. 76

Hedge funds do well with machine learning. Color images available online at www.liebertpub.com/big
It is interesting to ask whether the increasing effectiveness of highly nonlinear methods such as deep learning neural nets also applies to financial data. Perlich et al. 77 undertook a detailed analysis to compare a linear approach such as logistic regression with a popular inductive, nonlinear method such as decision trees (the C4.5 entropy-based classifier). Their analysis of learning curves showed that for small datasets, logistic regression was more accurate than trees, but this is reversed when moving to large datasets. These results contrast with the findings in Lim et al., 78 where logistic regression was found to be better. Perlich et al. found that bagging was effective in improving the results of decision trees so that they performed much better on large datasets. These studies used about 30 different datasets, but these were not in the finance domain. Therefore, whether the results transfer over to financial data is an interesting question that is beginning to be addressed. We are aware of one instance that confirms the findings of Perlich et al., 77 in a paper on credit card default prediction, by Butaru et al., 79 where decision trees outperform logistic regression on a very large dataset from major credit card firms. The main challenge here revolves around explaining the effectiveness or otherwise the results. Unlike standard regression models that are derived from a theoretical framework, machine learning and deep learning are data-driven approaches, and theoretical or economic justification is not always available. However, tools are being developed to better explain the unreasonable effectiveness of these models that contains thousands of parameters.
A major area for data analysis in finance is the analysis of systemic risk. This becomes partly a big data problem because one can only understand the behavior of a system when one has all its data. Sampling runs the risk of capturing a part of the system that does not represent the whole. Modeling a subsystem, especially when examining dynamics, may lead to spurious outcomes that do not come close to being faithful to what may occur for the entire system (for some discussion on biological systems, see Dantzig et al. 80 ). However, one may find data such as stock prices that are summary variables for much of the dynamic behavior in a complex system, and exploit these data to some extent. How successful are such approaches is still an open empirical matter. Systemic risk measurement has seen recent advances, described in papers by Das, 30 Espinosa-Vega, 81 Espinosa-Vega and Sola, 82 Billio et al., 83 and Mertonet al. 84 The major challenge in this literature has been finding a good measure of systemic risk that provides early enough warning about upcoming systemic events. The primary source of data connecting institutions has tended to be correlations from stock market data. However, correlations tend to rise sharply when the systemic event occurs, not before; hence, they do not provide enough early warning. A possible solution to this challenge is to use data from several sources, as there is likely a highly nonlinear relationship between varied sources of economic data and systemic events. These initiatives are being developed by firms such as Kensho (see https://www.kensho.com/).
Consumer finance is a large area in which big data have come to play a role. Financial firms are adopting techniques from consumer marketing to improve their relationship with their customers, and also their profitability. Credit scoring with social data is now widely in vogue and the models are pretty sophisticated; see Wei et al. 76 for an application using social media interactions. Lin et al. 85 exploit friendship networks to model lending choice in peer-lending. Many firms are using big data to improve targeting of their consumer finance offerings. CapitalOne is a good example. It “ … formulated its digital strategy on three key pillars—the use of analytics, investment in digital talent and restructuring the company's IT workforce to enable rapid development and deployment of new innovative services.” §§ The company uses analytics to target customers and also for customer retention. Targeting helps in finding good customers who would otherwise be screened out under older, coarse metrics. Merrill Lynch is using big data to improve underwriting of loans and better collections. Companies such as ZestFinance also access varied sources of data to improve loan decisions. *** A huge area of focus is fraud detection, especially in credit cards with losses of $31BN a year. 86 The big challenge in this area is anomaly detection, a rapidly growing area of interest among computer scientists. For a survey, see Chandola et al. 87 However, the use of big data in consumer finance is not without its critics, as the credit history data may be contaminated. 88
High-frequency trading (HFT) algorithms are based on high-volume data, mostly streaming sources. These algorithms absorb huge quantities of data from many sources, which are then parsed and fed to sophisticated algorithms that execute trades quickly and efficiently, either in open markets or in dark pools. Data handling in this domain needs to be highly efficient, and in many cases performance requires that the algorithms be embedded in hardware, using special purpose chips, rather than in software. Firms such as TradeWorx (http://www.tradeworx.com/) and Automated Trading Desk (bought by Citibank for $680M in 2007) were pioneers in the field. Algorithmic trading results in about 50% of executed trades in the equity markets. This is down from around 2/3 of stock trades in the late 2000s, mostly because the profits from algorithmic trading are under competitive pressure and regulatory oversight. The data challenge for HFT traders revolves around risk management across many different parallel strategies. Backtesting is another challenge that has been getting more attention recently with tools such as those offered by firms such as Quantopian (https://www.quantopian.com/), Collective2 (https://trade.collective2.com/), and Numerai (https://numer.ai/).
Blockchain and cryptocurrencies are widely heard of, but they are much less understood. They, of course, are at the frontier of new payment systems, but are envisaged to have a huge role also in financial contracting. As such, this technology is not a big data application, but it does involve big computation. Indeed, much of financial innovation centers around big data and/or high-performance computing. A blockchain is just a shared file. By definition, it is a decentralized record, with copies of the blockchain being maintained by several entities, with (hopefully) comprehensive security and consensus updates. The features are summarized in the acronym DIST (standing for a file system that is Distributed, Immutable, Secure, and Trusted). 89 Various banks are experimenting with blockchains for automated settlement, and they have formed consortiums such as R3 (https://r3cev.com/). Other similar efforts are Utility Settlement Coin from UBS and three other major banks, as well as SETLcoin from Goldman Sachs. Because blockchains will potentially permeate much of the financial landscape, any assessment of big data in finance requires consideration of this fast-growing technology.
Finally, cybersecurity is largely a big data issue in finance. Financial firms are being increasingly hacked, 90 and they are required to protect personally identifiable information much more than before. ††† Also, how these data are used for business purposes raises interesting ethical issues of data provenance and privacy. Adherence to the Critical Security Controls ‡‡‡ is a key part of a large bank's security process. The SANS Institute and the Center for Internet Security require implementation of protocols that are essentially algorithms running on big data, and are more than mere log analysis. Cybersecurity is a multifaceted challenge and, therefore, required implementation of multiple defenses. Encryption has to be improved, using larger numbers of bits (at least 256), and it also helps to use two-factor authentication for all online activity. Encryption of all documents, emails, etc., may be necessary for sensitive materials, and also encryption of hard drives, and devices such as phones used for financial transactions. User behavior is an important dimension, with enforcing better password choices, requiring backups, warnings when downloading files, and better security products. Cybersecurity and privacy are also tightly connected, and the new notion of differential privacy is potentially going to make the use of big data vastly safer. Differential privacy 91 is a way of randomizing the data to minimize the ability to identify someone in a database by cross-referencing with other data, while maintaining a high level of querying ability for data analysis. See also Flood et al. 3 and Howell 92 for specific issues related to privacy in financial markets with big data.
There are huge challenges in this area. The most common forms of cyber attack are phishing, distributed denial of service attacks, and ransomware, all of which are on an uptrend. All these forms of attack are mingled into the normal data traffic internal and external to an institution, and detection of these among high-volume data is a very difficult challenge. We are slowly seeing a migration from rule-based approaches to cybersecurity to the development of machine-learning-based approaches, which are well positioned to exploit the vast data that have been collected on normal and anomalous data traffic.
Conclusion
Financial analysis can greatly benefit from big data. Effective macroprudential supervision that uses low-dimensional datasets83,93 may be well enhanced with big data. However, barriers remain with respect to performing the cleaning, integration, modeling, and analytics required to derive actionable data from a diversity of data sources. An active research agenda is underway to develop the tools and algorithms to address these needs, as indicated by the extensive bibliography in this article. This article surveys many of these opportunities and initiatives in areas of data integration, data quality, and analytics. Table 1 presents a summary of the progress that has been made so far, broken down by domain and issue. The issues exist in a hierarchy. At the bottom level, we encounter the issues at a single unit at the firm level only. Modeling requires integrating big data, even for a single function such as credit analysis. At the next level, data issues arise when attempting firm-level analysis, for example, in enterprise-wide financial risk assessment. Aggregating these to the system level is very difficult. Although we have achieved reasonable success at the first two levels, the third level has seen nascent progress. And finally, quality assurance around data is a hard problem and permeates all levels. We expect many of these research challenges to be addressed in the coming few years.
Codes: ◯ represents nascent solutions; □ represents work underway, not fully developed; and empty cells represent that decent progress has been made.
Footnotes
Acknowledgments
This article was prepared for the OFR/U. Michigan conference: Big Data in Finance, Ann Arbor, October 27–28, 2016. The authors are grateful to the participants at the conference and M. D. Flood and S. McQuade for helpful input. They thank the referee, and the editor, Vasant Dhar, for many constructive comments. Roger Stein made several constructive suggestions.
Author Disclosure Statement
No competing financial interests exist.