
Abstract
Abstract
Computational propaganda deploys social or political bots to try to shape, steer, and manipulate online public discussions and influence decisions. Collective behavior of populations of social bots has not been yet widely studied, although understanding of collective patterns arising from interactions between bots would aid social bot detection. In this study, we show that there are significant differences in collective behavior between population of bots and population of humans as detected from their Twitter activity. Using a large dataset of tweets we have collected during the UK-EU referendum campaign, we separated users into population of bots and population of humans based on the length of sequences of their high-frequency tweeting activity. We show that, while pairwise correlations between users are weak, they co-exist with collective correlated states; however the statistics of correlations and co-spiking probability differ in both populations. Our results demonstrate that populations of social bots and human users in social media exhibit collective properties similar to the ones found in social and biological systems placed near a critical point.
Introduction
Social bots are automated user accounts in online social networks owned and used by computers.1–3 Social media, such as Twitter or Facebook, which support high spreadability and convergence of content,4–6 particularly during influential political events,7–10 are particularly susceptible environments for such entities. Social bots have been successfully deployed in political context in social media despite their current low level of sophistication, but applying advances in artificial intelligence 11 and/or hybridization with human users into cyborgs12,13 can soon dramatically increase their human-like properties, coordination, and interaction potential, making them extremely difficult to detect and classify into strictly binary bot/human class.
Bots in the sense of software agents are not specific to online social media; they are present in many forms on the Internet, both with benevolent or malevolent intent.14,15 Although they are classified using different taxonomies with different categories,13,15–17 bots are essentially autonomous agents as defined by Franklin and Graesser 16 :
“An autonomous agent is a system situated within and a part of an environment that senses that environment and acts on it, over time, in pursuit of its own agenda and so as to effect what it senses in the future.”
To characterize a bot following this definition, one must describe its 16
environment,
sensing,
possible actions,
drives, and
decision-making.
Applying this description to, for example, a social bot on Twitter, we identify the environment in which such an entity exists as microblogging platform, where bots sense the content (tweets) and other users' data, and can act with posts, retweets, and by following actions. The preferences of social bots are encoded intents that result in specific response and behavior of bots through a decision-making process. Starting from a general definition of bots as autonomous computational agents and using their characteristics as dimensions, various classification schemes and taxonomies for bots,14–16,18 and specifically for social bots, were derived and proposed.13,17,19,20 Stieglitz et al. 17 introduced a two-dimensional categorization scheme with intent (drive) and imitation of human behavior (possible actions and decision-making) as variables. Gorwa and Giulbeault 20 instead of using categorical typology suggest a framework of three considerations for understanding bots: structure (combining environment and sensing), function (action), and use (drive and decision-making process).
Computational propaganda uses of politicized social bots in different roles, of malicious or of more mild nature, 21 have been discovered in dissimilar political systems. 22 Their effect on public opinion8,23–25 makes them important political actors and their analyses should be included in political communication study. 26 Social bots can manipulate, influence, and steer communication in social media or can also find themselves manipulated by human users.27,28 They were found to help spreading fake news,29,30 influence stock indicators, 31 and serve as fake followers in promoting social media profiles. 32 Grimme et al. 13 proposed that the amplitude of influence of users in social media depends on two variables: orchestration and automation of users, suggesting that network of hybrid bots, agents that mimic temporal human behavioral patterns, while content is produced by humans, has the highest potential to influence social media.
An important computational task is the recognition, classification, and early detection of social bots using features extracted from user network, data, and metadata,12,19,33–36 a task that is getting more difficult as bots are getting better at mimicking human online activity and behavior, becoming more sophisticated utilizing artificial intelligence 11 and hybridization. 13 Artificial intelligence methods such as deep neural networks are on the other hand employed to detect social bots. 37 One of the most sophisticated systems for detection and recognition of social bots on Twitter is BotOrNot 33 that uses more than 1000 features to classify a user as a human like or bot like. These features are grouped into six classes 33 : network (statistical network features computed from retweet, mention, and hashtag co-occurrences), user (account metadata), friends (statistics of social contacts), content (language features), sentiment, and temporal (tweet rate and intertweet time distributions).
Time-like features such as relationships between events, 38 combination of interarrival times and volume of events, 39 correlations,40,41 and time interval entropy 42 were used to study temporal characteristics of individual users. In this study, we also focus solely on the temporal properties of Twitter users' activities, however, not to use them primarily as individual filter for bot/human classification, but to try to link the temporal features of activity to social aspects of bots and their collective behavior. Recently, the behavioral dynamics of bots and humans during activity in Twitter session was studied 43 to detect differences in bot and human behavior. We are not looking for individual differences between bots and humans, instead we are interested in population of heterogeneous social bots gathered around specific topic or event and their group dynamics, making a first step toward detecting and quantifying collective behavior of bots.
In this study, we show, using and analyzing Twitter data collected during the campaign around UK-EU referendum, that groups of social bots can be detected by specific temporal traces they leave in their tweeting activity. Although collective behavior in populations of bots and humans statistically differs, both groups have weak pairwise correlations co-existing with strongly coordinated states. We demonstrate that a simple Ising spin-glass model with random interactions and fields captures main features of the collective patterns such as scaling of average activity of users when they are represented as interacting spins with temporal activities binarized into spike trains. We discuss the possibility of adaptive behavior of population of social bots and their control of criticality.
Materials and Methods
Between March and September 2016, we used Twitter public API to track and collect tweets containing the word “brexit.” We collected timestamps, user IDs, tweets texts, hashtags, and URLs mentioned for each tweet that matched the search term and stored the tweets in the database for later analysis. We wrote custom software in Java for collecting and storing the tweets and set up Apache Cassandra database to store the tweets. For all the analyses and computations presented in this study, we developed custom Python scripts.
Altogether we collected 33,145,488 tweets published by 4,658,780 unique users. We found that the distribution of user activity (number of tweets published by particular user, n) is heavy tailed and it can be approximately described by a power law probability distribution
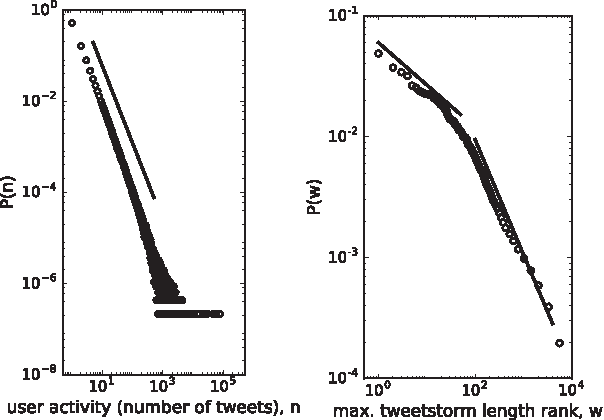
Left panel—probability distribution of user activity (complete data). Scaling relationship is approximately described by P(n) \sim n^{-a} with a = 1.7 (solid line). Right panel—rank distribution of tweetstorm lengths of top 10,000 most active users. In this study, the exponents of power plots (full lines) are 0.35 in the upper part and 0.95 in the tail.
This shape of the distribution of user activity indicates that the majority of the collected tweets originate from a relative small subpopulation of users, while the large majority of users published only small number of tweets in the observed time period. For our analyses, we looked for a population of users in which each user has tweeted at least twice per day. This criterion led to population of the top 104 most active users (0.2% of all users) who published 25% of all tweets. An average user in this sample published approximately five tweets per day.
Within this sample, we looked for users that we could classify as bots or humans based on their tweeting activity. To this end, we defined a tweetstorm—a quantity describing a tweet sequence where time difference between consecutive tweets is less than 10 epoch timestamps (we converted timestamps given by Twitter API to epoch timestamps). We computed all tweetstorms for all users in the sample. When plotted as a rank distribution, the tweetstorm lengths, w, follow a power-law shape with scaling law
We sorted the users according to number of tweetstorms and length of tweetstorms in descending order. The users found in the top 5% of the intersection of both sorted lists were considered candidates for bot population, while the candidates for human population came from the bottom 5% of the intersection of both sorted lists. The final populations of 125 bots and 218 humans consisted of users which user ID we could identify through BotOrNot API (accessed in January and February 2017) and for which BotOrNot score we could obtain.*
To assay the collective behavior of bot and human populations, we chose to represent bot and human tweeting activity with spin variables
In this study, we were interested in three quantities that characterize collective state of spin populations: spin-spin correlations, co-spiking probability, and the average state of spins.
Spin-spin correlation coefficient is defined as follows:
where <> denote time averages. Average state of the system of N spins is the sum over all spin states:
Existence of weak correlations between spins found in each population and co-spiking probability distributions greatly differing from independent model (in detail displayed and discussed in the Results section) led us to use spin glass model to try to describe and understand these results. A spin glass is a collection of interacting spins where the interaction between spins is a random quantity.
44
In this model, we have N spins with
where the probability p depends on the effective field hi that the i-th spin sees the following:
This effective field has two contributions: one from the spin interacting with all other spins with interaction strength
The interaction strength
If we put simply
where the fluctuations
Results
For each user in bot (N = 125) and human (N = 218) populations, we obtained BotOrNot score through the BotOrNot API. The total score, a number between 0 and 1, is an estimate of a bot-like behavior of a user. The higher the score, the more likely it is that a user is a social bot. In the left panel of Figure 2, we show the statistics of bot scores for bot and human populations. The scores are indeed significantly different between the two groups with scores for the bots higher than the ones for the humans. In parallel, we also show the statistics of the user activity (the number of published tweets in observed time period) for both populations (right panel in Fig. 2). In this study, we also find significant differences between bots and humans, bots being typically more active, but we also find highly prolific users in the human population.
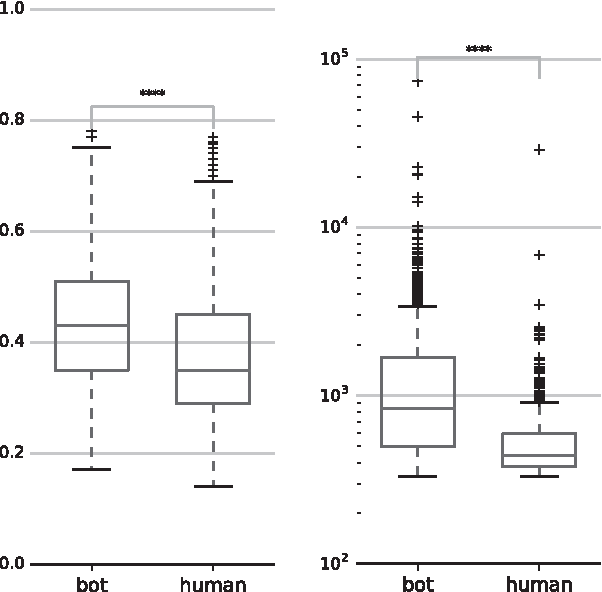
Left panel—comparison of bot and human BotOrNot score statistics; right panel—comparison of bot and human populations statistics of user activity.
We have binarized the timelines of activity of the top 10,000 most active users with 30 minutes bin width, so the activity of each user was represented with a spin variable (

Left panel—raster plot of binarized activity of bots; right panel—raster plot of binarized activity of humans.
We have calculated pairwise correlation coefficients (Eq. 1) for the bots and humans, and for the whole 10,000 group of users. Figure 4 shows the distribution of the pairwise correlation coefficients for bots (left panel) and humans (right panel). We also show normal distributions with mean and standard deviation calculated from the data (blue line). Both populations show weakly correlated behavior, although the correlations between human users are more Gaussian-like distributed when compared with bots.
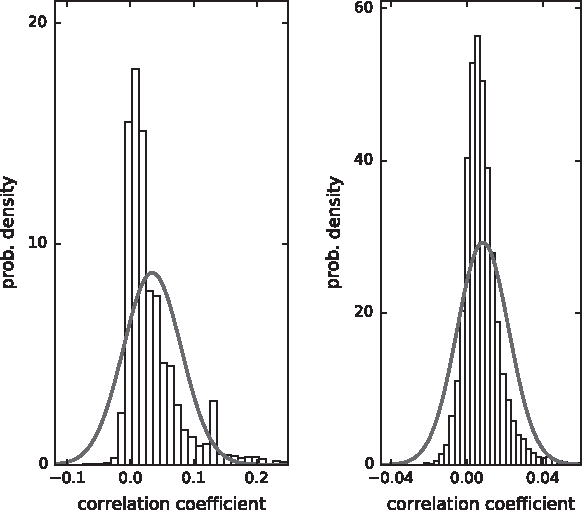
Spin pairwise correlation distributions: population of bots (left panel), human population (right panel). Blue lines are Gaussian distribution with mean and standard deviation calculated from data.
To quantify the difference between correlations in groups of bots and humans, we compared probability distribution of correlation coefficients of 150 randomly sampled users from group of all spins (10,000) with correlation coefficient distributions of bots and humans. We computed Jensen-Shannon divergences (JSD) 46 between distributions for many samplings of random users from all spins. In Figure 5, we plotted the distributions of JSD between bots and random users, and humans and random users. Both distributions are clearly separated with the mean of human-random JSD equal to 0.029 and the mean of bots-random JSD equal to 0.129. The mean of the distribution of JSD between randomly picked groups is equal to 0.005 (not shown in Fig. 5). These results show that the population of humans (or their correlated temporal behavior) is significantly more similar to randomly picked group of users than the population of bots. Or, in other words, it would be hard to detect bots by just looking at correlations between randomly picked users, but using cross-correlations or partial correlations between population of bots and randomly chosen users could lead to bot detection based on collective properties.

Distributions of JSD between human population and random sampling from all spins (10k) (left distribution in figure), and bot population and random sampling from all spins (10k). Full lines are Gaussian distributions with mean and standard deviations: 0.029 and 0.011 for human population, 0.129 and 0.018 for bot population. One hundred fifty random samples from 10,000 group were used in all cases, mean and standard deviation of these samplings were 0.005 and 0.004 (not shown in figure). JSD, Jensen-Shannon divergence.
Besides the pairwise correlations, we looked at the collective states of bots and humans quantified with the probability of co-spiking behavior of K spins out of group of N. In each population (bots and humans), we repeatedly randomly sampled N = 20 users and computed the probability distribution P(K) of K co-spiking users. Left panel in Figure 6 shows the obtained distributions along with the P(K) for randomly shuffled spike trains. By randomly shuffling spike trains, we destroy all existing correlations in the population and P(K) should be described with the independent spiking model. Indeed, as shown by the dashed line in Figure 6, the P(K) of randomly shuffled spike trains (denoted by pluses) follow the Poisson distribution. However, P(K) from the actual data, for both bots (circles) and humans (squares), is orders of magnitude larger than the independent model prediction, showing the existence of collective states in weakly correlated bot and human populations. P(K) distributions for bots and humans are well described using beta-binomial distribution 47 (full lines).

Left panel—distribution of co-spiking activity in population P(k). All random samplings were done with N = 20, bots (circles), humans (squares), independent model—reshuffled spikes (pluses). Fits: dashed—Poisson distribution, full line—beta-binomial distribution. Right panel—plot of returns of average spin, humans (squares), bots (dots); fits with J = 1.5 (humans), J = 1.75 (bots), and h = 0.03 (both populations); dashed power laws with exponents 4.1 and 3.8.
The average spin
To connect the observed data and the spin-glass model of the bot and human populations, we looked at the time evolution of the variance of average spin, connected to susceptibility in interacting spin systems:

Time evolution of susceptibility for human (lower trace) and bot (upper trace) populations. Red lines are results from the Ising spin-glass model with J = 1.5 (humans), J = 1.75(bots), and h = 0.03 (both populations).
To check for predictive properties of tweetstorms as bot signature, we applied a logistic regression binary classifier 50 to a population of bots and humans, labeling bots with 1 and humans with 0. We divided the whole dataset into training (60%) and test (40%) and computed receiver operating characteristic (ROC) curve (Fig. 8). We repeated the experiment on shuffled data (each time series was randomly shuffled). The area under ROC curve was AUC = 0.76 for original data, and AUC = 0.57 for shuffled data. These results point to the conclusion that we can successfully classify users into bot-like or human-like class based on their tweeting activity, using supervised learning methods even though we use biased sample (high frequent activity) of accounts.
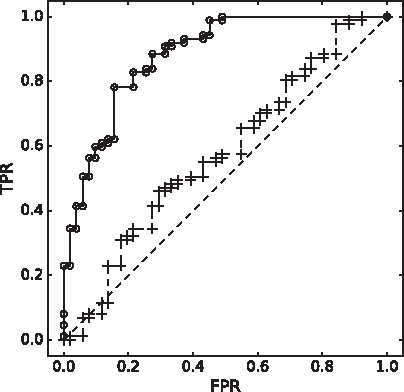
ROC curve for predictions with logistic regression binary classifier. We performed supervised learning experiments on original and randomly shuffled datasets. Open dots and full line show the ROC curve for original and pluses and dashed line for shuffled data. Straight dashed line is the random guess line. FPR, false positive rate; TPR, true positive rate; ROC, receiver operating characteristic.
Discussion
Our results show that we can find users with social bot-like and human-like tweeting behavior within a large group of Twitter users by measuring the lengths and the number of high frequency tweeting sequences—tweetstorms—in their timelines. We used tweet frequency of one tweet every 10 seconds as an individual-level filter, similar to tweeting frequency that was found in other deployments of political bots. 51 The key here is, however, not that our chosen temporal feature can discriminate between bot-like and human-like users (as classified by BotOrNot score) in a selected highly active group of users, but that we find differences in user behavior on group level between bot and human collectives. We found that the group of weakly correlated bots diverges more from the randomly sampled group of users than a group of humans. This suggests that the activity of randomly picked users will likely resemble human-like correlated activity, or that bots stay well hidden in overall population. We should also note that our chosen tweetstorm metric does not discriminate between bots and humans based solely on their activity (total number of tweets) since we find highly active users in both groups. Our sampling procedure therefore yields heterogeneous groups of users with respect to overall user activity, so the discovered differences in collective behavior of bots and humans are free from artifacts in selection process. Our approach is limited with some minimum threshold of user activity below which the probability of finding even weak pairwise correlations distinct from random processes is very low. Another challenge is that the user group dynamics is possibly time and context dependent, leading to time-dependent intergroup relationships. One approach to tackle this is to follow the approach developed by Pozzana and Ferrara 43 and divide the complete tweets timelines into appropriate activity sessions, and then study collective behavior dynamics across the ensemble of such parts of timelines.
After obtaining populations of bots and humans using an individual-level filter (tweetstorm), we used collective properties like bot-bot, human-human correlations or bot-human cross-correlations to identify bots that can otherwise not be separated well from both populations based on individual-level filter. As an example to demonstrate this approach, we looked at the published list of 2752 Twitter user accounts (IDs and screen names) released by Twitter † in response to U.S. Congress investigation of influence of Russian trolls on 2016 U.S. presidential elections. The list contains details on accounts for which Twitter believed were run by a troll farm identified as a Russian company tweeting on election. We cross-referenced the IDs from this list with the list of all users in our Brexit database and found 284 accounts (the order of magnitude consistent with what other researchers have found in their own databases), 52 but only two (b#1, b#2) accounts between the top 10,000 most active users. To estimate whether b#1 and b#2 are more likely to be bots or humans, we computed their average pairwise correlation between population of bots and population of humans. We found that average correlations of b#1 (b#2) with the population of bots are 0.04 (0.027), while their correlations with population of humans are 0.019 (0.014). In case of these two accounts, we found them to be more likely bots than humans.
We observed that weak pairwise correlations between bots and between humans co-exist with collective, co-spiking, states in both populations. However, could the analysis of correlations between pairs of users lead to any insight into collective behavior in such social groups with complicated interactions between their members? Surprisingly, it does. Collective phenomena in biological and social systems as diverse as population of neurons, 53 insulin-secreting beta cells, 54 flock of birds, 55 or U.S. Supreme Court 56 have been captured by simple, maximum entropy models with minimal structure using pairwise correlations. The key point is that even when correlations are weak, but spread extensively through the system, their effects cannot be treated perturbatively. 57
We showed that we can describe observations from the data of tweeting behavior of bots and humans by Ising model with random interactions and fields. This suggests that there might be other similarities between collective behaviors of users in social media and those found in other social or biological systems. One exciting possibility to explore is whether a population of interacting social bots can adapt its collective activity so that it is placed near a critical point in the parameter space; such critical behavior was found in many biological54,58 and small-scale social systems. 59 We see hints of criticality in Zipf-like rank distribution of tweetstorms (right panel in Fig. 1) and in scaling relationships of the distribution of return of average spin (right panel in Fig. 6). Zipf's law can emerge naturally without any fine tuning when a system is affected by fluctuating hidden variables. 60 In case of Twitter or other social media, such unobserved stimuli might be the social or political events around a topic that drive users' activities. Power laws that we found in distribution of return of average spin point to intermittent and bubbling underlying dynamics were similar to the one discovered in financial markets.
Why would being positioned near a critical point be beneficial to a population of social bots? A system at a critical point is highly susceptible to small changes and lacks robustness, information in the system spreads fast. A sophisticated population of social bots poised at critical point would therefore be able to quickly adapt to changes in the uncertain environment and thus become harder to detect and identify. A human population of users, on the other hand, would have to adopt an opposite strategy that would increase robustness to prevent social contagion and infiltration by bots. At the level of individual (human) user, the decisions on whether to follow, retweet, or mention another user of course depend on the contents of tweets and the current state of user's Twitter network (links to other users). What we observe on population level is the collective state of these network interactions, so increased robustness would be reflected in the change of the network topology. However, increased robustness would lower the ability to quickly spread information in the system, so the optimal strategy would be to adaptively control the distance to criticality in accordance with the changes in the environment.
Conclusions
We have shown that bot-like and human-like behavior of highly active Twitter users can be detected using the peculiarities encoded in the timelines of their tweeting activity, but our key finding is that populations of bots and humans differ in their collective behavior expressed as collective states founds in otherwise weakly correlated populations. We quantified these differences by computing distributions of pairwise correlations, co-spiking activity, and average states of each population. We found that some of the scaling properties of tweeting activities of bots and humans binarized into spike trains can be described with a simple Ising spin-glass model. We are intrigued by scaling relationships found in analyzed Twitter data that might hint to criticality and adaptive behavior in fluctuating environment 61 of social bots similar to the one found in biological and small-scale social systems.
Even almost 2 years after the start of the UK-EU Brexit referendum campaigns on Twitter, there are reports on bot influence on referendum outcome, 62 and ongoing analyses of datasets of Brexit tweets63,64 providing new insights into the life of social bots and their networks. In our further efforts, we will work toward the creation of an algorithm that would seek for social bots in large social networks using properties of their collective behavior rather than using individual-level filter. We propose combining our method of quantifying collective bot behavior presented in this study with the exploration of bot network. Instead of using bot followers 36 to build bot network, we suggest building a functional network from pairwise correlations between bots. New bot candidates can then be sought by link prediction methods 65 based on evolving network topology and the bot network expands with newly discovered bots.
We hope our work will stimulate further research of analogies and similarities between online social and biological collective phenomena, leading to new findings about the structure of communication and interaction in social media.
Footnotes
Acknowledgments
The authors acknowledge the financial support from the Slovenian Research Agency (research core funding No. P3-0396). We are grateful to Dr. Onur Varol, Center for Complex Network Research, Northeastern University, for helpful discussions.
Author Disclosure Statement
No competing financial interests exist.