
Abstract
In this article, the proposed method develops a big data classification model with the aid of intelligent techniques. Here, the Parallel Pool Map reduce Framework is used for handling big data. The model involves three main phases, namely (1) feature extraction, (2) optimal feature selection, and (3) classification. For feature extraction, the well-known feature extraction techniques such as principle component analysis, linear discriminate analysis, and linear square regression are used. Since the length of feature vector tends to be high, the choice of the optimal features is complex task. Hence, the proposed model utilizes the optimal feature selection technology referred as Lion-based Firefly (L-FF) algorithm to select the optimal features. The main objective of this article is projected on minimizing the correlation between the selected features. It results in providing diverse information regarding the different classes of data. Once, the optimal features are selected, the classification algorithm called neural network (NN) is adopted, which effectively classify the data in an effective manner with the selected features. Furthermore, the proposed L-FF+NN model is compared with the traditional methods and proves the effectiveness over other methods. Experimental analysis shows that the proposed L-FF+NN model is 92%, 28%, 87%, 82%, and 78% superior to the state-of-art models such as GA+NN, FF+NN, PSO+NN, ABC+NN, and LA+NN, respectively.
Introduction
A novel technology known as “Big Data” is utilized in the field of technology to override the challenges of explosion data volume. Presently, the modern decision support systems consider the big data as a core component to store a huge volume of data.1,2 It is complex to read all these data sources by a decision-maker, such that the classification of the collected data is made under certain conditions. The big data is usually classified by “3V”: volume, velocity, and variety.3,4 The classification of data automatically or semiautomatically is the aspiration of big data users. Furthermore, big data is also utilized in forecasting approaches. Thus, it had to deal with the structured, unstructured, and semi-structured data.5–7 This kind of classification is not possible with the traditional classifiers. Thus, it paved the way for feature extraction-based classification of data. From the original data set,8,9 the most relevant information is obtained, and this information is recorded in a lower dimensionality space. When a massive of data are fed as input to an algorithm, then the data become redundant. So that the large volume of input data will be converted into a reduced representation set of features referred as the feature vectors.10–12 A selected input will be modeled correctly as one of the possible output classes, and the pattern recognition makes this task. The pattern recognition scheme is divided into two main stages, namely Feature selection and Classification.13,14
The feature selection is essential in the feature extraction phase since the classifier is not able to recognize from poorly selected features. Before selecting a feature, it is essential to distinguish between classes based on specific criteria, and this is done to get rid of insensitive or irrelevant information.15,16 The correlation plays a significant role in the data feature classification between different data features. If the correlation between the data features is low, then the selection of the features becomes accurate. During data classification, the data are grouped under predefined classes.17,18 The classification process generally arises due to the nonfeasible integration of vast volume of data in a reasonable running time.19,20 This suggests that the classification of data in the context of big data is a critical task. The supervised classification with the intention of classifying the future input patterns gathers knowledge from the data set. Fuzzy Rule-Based Classification System is one of the most renewed machines learning techniques.21,22 These tools were utilized in varying types of applications such as bioinformatics, medical problems, anomaly intrusion detection, financial applications, and image processing.23,24 However, in the reasonable time, the standard learning techniques are not able to cope up with the classification problems in the distributed environment.25,26 Therefore, there is a necessity for these kinds of techniques to be adapted or redesigned with the aspiration of applying it to the distributed environment. The article classifies the big data through optimal feature selection after handling big data by Parallel Pool Map reduce Framework.
The contributions of this article are summarized as follows:
The first contribution deals with the extraction of the features with the aid of feature extraction techniques such as principle component analysis (PCA), linear discriminate analysis (LDA), and linear square regression (LSR). In the second contribution, the Firefly (FF) algorithm is interlinked with the Lion Algorithm (LA) to form a novel algorithm termed as Lion-based Firefly (L-FF) algorithm, and this hybridized algorithm helps in selecting the optimal features. The optimal features are selected in such a way that the correlation between the selected features is minimal. The third contribution focused on classifying the selected features. Neural network (NN) is utilized for the classification of the selected features of data in an effective manner. The performance of the proposed method L-FF+NN is compared over the existing models such as Genetic algorithm-based Neural Network (GA+NN), Firefly-based neural network (FF+NN), Artificial Bee Colony-based Neural Network (ABC+NN), in terms of accuracy, sensitivity, specificity, precision, false-positive rate (FPR), false-negative rate (FNR), negative predictive value (NPV), false discovery rate (FDR), F1 score, and Matthews correlation coefficient (MCC).
The rest of the article is organized as follows: The Literature Review section revaluated the literature on various works carried out in the field of big data feature extraction. The Architectural Representation of L-FF+NN
Literature Review
Related works
In 2016, Lei et al. 1 proffered a novel unsupervised two-layer NN and a softmax regression classifier, especially for the intelligent fault diagnosis of machines. The main intension is to find nonlinear information from the input samples by optimizing the cost function, thus providing good generalization ability. The outcomes of both the proposed method proved that there was higher accuracy in feature extraction, and the proposed model had accomplished an intelligent fault diagnosis on the big data.
In 2018, Ramírez-Gallego et al. 2 proposed a distributed implementation of a generic feature selection framework to have a standard feature selection in the big data platforms. This method included the renewed information theory-based methods with the aim of boosting the performance and accuracy. The outcomes of the proposed model verified that it had the capacity of dealing with the ultrahigh-dimensional data sets and a huge number of samples.
In 2018, Ke et al. 3 proposed a feature learning algorithm for the big data in parallel computing by utilizing Adaptive Independent Subspaces Analysis (AISA). The aim of the proposed model was to demonstrate the effectiveness over complete AISA features in the classification task. The partial independent signal bases and partial independent factorial representation were utilized with the intention of demonstrating the effectiveness of the overcomplete AISA. The result obtained from AISA features was collated with the independent component analysis (ICA)-related features, and the outcomes verified that AISA had higher classification accuracy.
In 2017, Attigeri et al. 5 presented the support vector machine (SVM) and logistic regression, machine learning algorithms, to analyze the feature selection and extraction algorithm for loan data. The objective of this article was to extract algorithm to large volume of financial data as well as the dimensionality reduction considering feature selection. The quality of the data set is enhanced with the help of parallel distributed preprocessing, and this process is carried out in the IBM Bluemix cloud platform with spark notebook. The outcome shows that reduction of features has significantly improved execution time without compromising the accuracy.
In 2018, Zhao et al. 6 presented a distributed subtractive clustering algorithm for efficient economic Big Data analysis. The main aims of the proposed approach were twofold: to select important attributes and to identify representative ones based on parallel clustering. The hidden patterns related to the economic development were revealed via the coupled economic feature selection and econometric model construction. The result of validation of the proposed model proved that there was superiority in the performance of the proposed model when compared with other enormous economic data models.
In 2017, Xin et al. 7 proffered a novel evolutionary algorithm called the Improved Crossover Operation (ICO) for enhancing the precision of redundant data in feature extraction. This method helps in achieving the objective function of improving the local exploration as well as the convergence precision of the algorithm in terms of magnitude. The result of the proposed model verified that the overfitting was diminished and the robustness of the proposed model was high.
In 2016, Vinod and Vasudevan 8 proposed a Highly Correlated Feature Set Selection (HCFS) algorithm to categorize the data in an efficient and an effective way. The aim of the proposed method was to offer quality features to hierarchical learning algorithm for better classification performance. The proposed model had combined the hierarchical learning approach to enhance the performance of feature extraction from a vast database of patient records. The outcome shows that filter-based feature approach with hierarchical learning algorithm for big data classification achieves better performance.
In 2018, Sisiaridis and Markowitch 9 proposed machine learning algorithms based on artificial intelligence techniques. To enhance the accuracy of feature extraction and to diminish the security noise of the extracted feature, further four novel methods, namely, Feature selection in case of having a relative small number of categories, Leave-out single-value attributes, Namespace correlation, and Data correlation using the actual values were utilized. The proposed learning algorithms help in handling the feature extraction, and feature selection for the heterogeneous data that were got from varying sources. The outcome of the proposed model verified that it had low computational time and had reduced the data complexity while collated with other traditional models.
Review
The literature has come out with several techniques for the big data classification, which is shown in Table 1. They require more improvements because of lack of several features in the precious classification and extraction of data. In two-stage learning method-based unsupervised learning features, 1 the diagnostic accuracy was high and consumed less computational time to classify the images based on certain features. Beyond these advantages, it suffered from the drawback of low convergence, and this method classified only the labeled data, and the unlabeled data were not classified. The labeled data were only utilized for training. Then, distributed implementation of a generic feature selection (FS) framework 2 was applicable to real-world data sets, and it had the capability of dealing with ultrahigh-dimensional data sets. It suffered from the serious drawbacks of imbalance in the class distribution, and it was not able to select the features automatically, such that it required the human intervention. In feature learning algorithm-based AISA, 3 the advantages are high accuracy, and it required only low number of training samples. The disadvantage of this method was that it is highly complex, and robustness in classification was low. Furthermore, in SVM, 5 time complexity of classification task is reduced, and it had the drawback as the dimension increases the computational cost associated also increases exponentially. Furthermore, in distributed subtractive clustering algorithm, 6 the pros were that highly dimensional data were analyzed and detected the relevant features and discarding the irrelevant features. The cons of this method are the collected huge volume data containing incomplete, incorrect, and nonstandard items, which are difficult for processing.
Features and challenges on diverse feature selection models in big data classification
AI, artificial intelligence; FS, feature selection; HCFS, Highly Correlated Feature Set Selection; ICO, Improved Crossover Operation; SVM, support vector machine.
In ICO algorithm, 7 the local exploration is sharply enhanced, and the convergence precision was enhanced by an order of magnitude. It had the disadvantages such as it was insufficient in calculating the gradient or derivative. In HCFS algorithm, 8 the advantages are better classification accuracy, and it was highly inefficient in choosing the subset of features from original features. In SVM classifier, 9 the computational time is low, data complexity, and it provided solutions to interoperability issues. It had the disadvantages such as low scalability is low, focused only on IP flow aggregation and not consider any other network service. These drawbacks play a major role in having the great motivation for developing new feature selection models.
Architectural Representation of L-FF+NN-Based Big Data Classification Model
Proposed methodology
The selection of an optimal feature subset from the high-dimensional feature set is a critical task in the big data mining as it involves the collection and processing of vast amounts of data. The classical and advanced data mining and machine learning tools that are available in the present trend are not sufficient to extract the features in an optimal way. Hence, in this article, a novel big data classification model is developed with the assistance got from the intelligent methods. Here, Parallel Pool Map reduce Framework is used for handling big data. The data set is collected from University of California Irvine (UCI) repository, in which the four data sets such as Absenteeism at work, Dermatology, Contraceptive method choice, and Immunotherapy data set are used. The block diagram for proposed optimal feature selection-data classification model is illustrated in Figure 1. The proposed data classification model involves three main phases: (1) feature extraction, (2) optimal feature selection, and (3) classification. Feature extraction is a process of dimensionality reduction by which an initial arrangement of data is diminished to increasingly sensible groups for processing. Its phase includes the feature extraction techniques such as PCA, LDA, and LSR. Since the length of the features are found to be large, there is a necessity for an optimal feature selection technology. This is accomplished by the proposed hybrid model with the combination of FF and LA called L+FF that helps in selecting the most relevant features. Moreover, feature classification is a decisional approach in which the features of the data are grouped under a certain class that is specified in priori. Once, the optimal feature is selected, the classification algorithm called NN is adopted, which can classify the data in an effective manner with the selected features. With the combination of all above-mentioned techniques, the proposed model is termed as L-FF+NN.
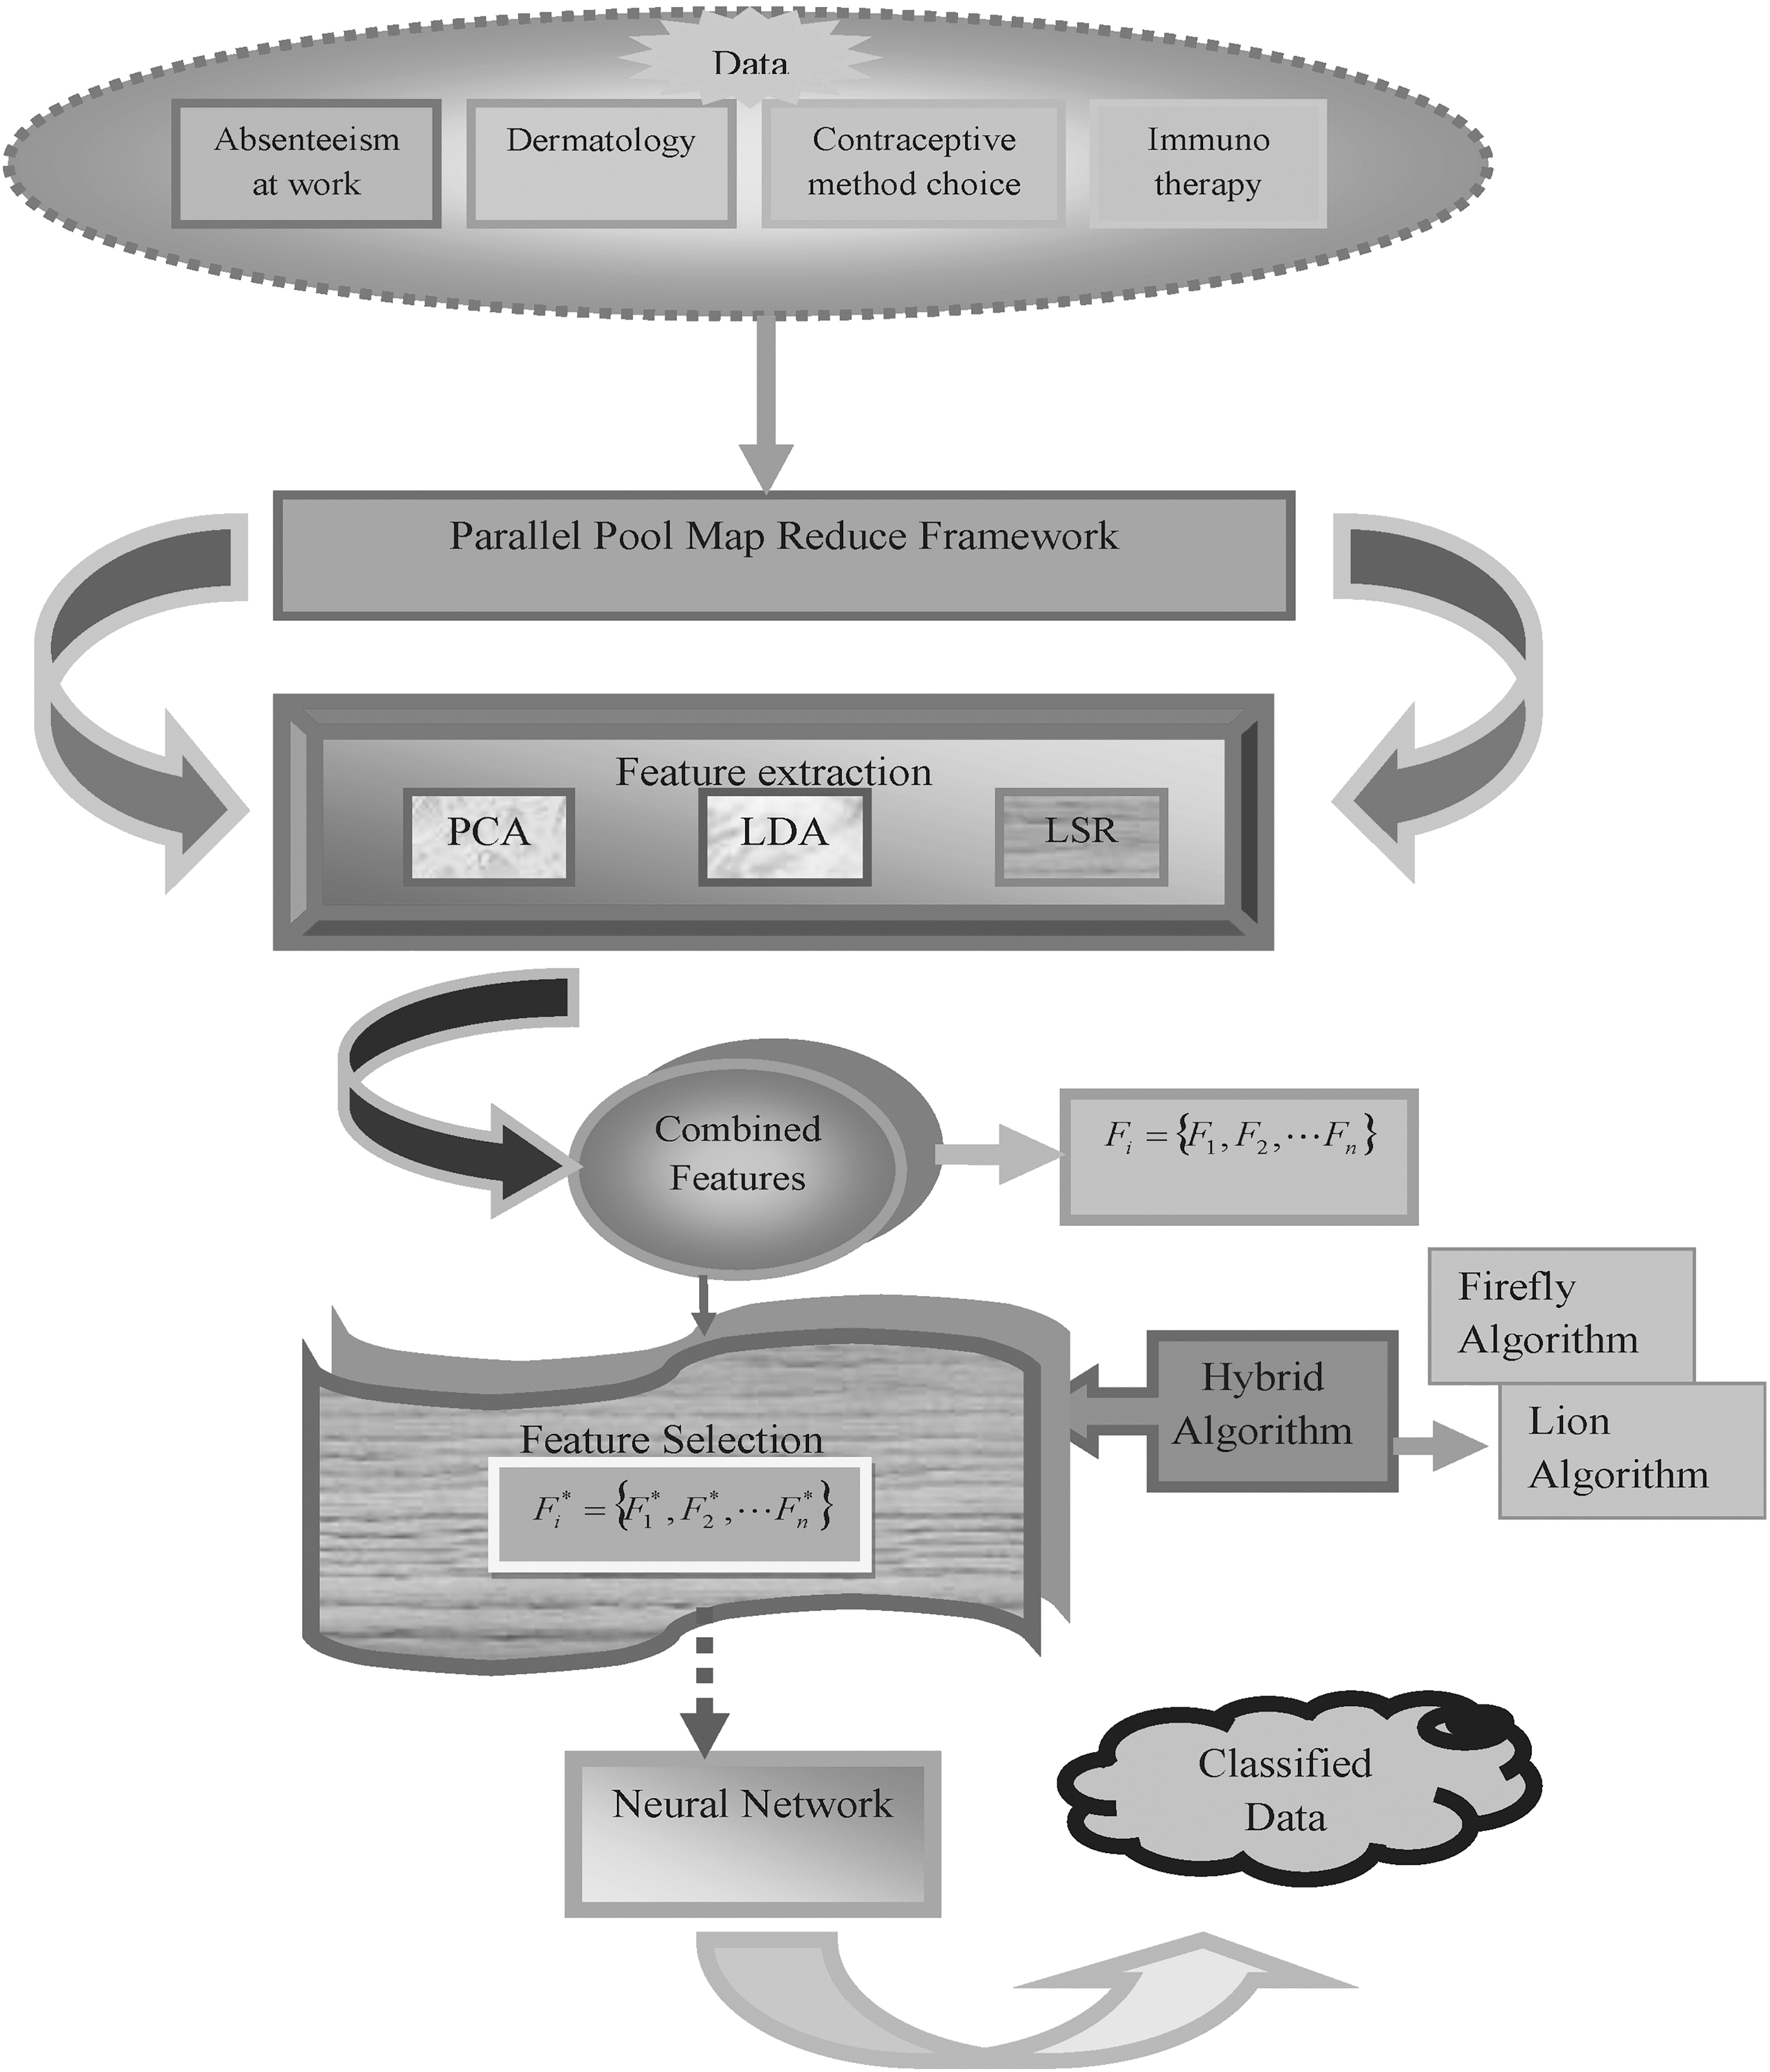
Block diagram of proposed optimal feature selection-based data classification model.
Feature extraction
Before data classification, the feature extraction of data is accomplished using three feature extraction techniques, namely PCA, LDA, and LSR. In general, the feature extraction is carried out with a desire of diminishing the quantity of the resources that are needed to describe a vast quantity of the data set. Moreover, the differentiation between the images is carried out using the extracted features.
Principle component analysis
It is an unsupervised learning method that is utilized for the dimensionality reduction of the data set without altering the original variability of the data. 27 PCA makes use of the orthogonal transformation to obtain the linearly uncorrelated variables, and these variables are referred as principle components from the correlated variables. The count of the principal components is found to be equal or less than the original variables. In PCA, the statistical analyses such as mean, standard deviation (SD), covariance, and eigen values and eigen vectors of a matrix are evaluated.
a. Mean: It is the average of the values of the variables throughout the distribution. This measure is also referred to as central tendency. The mean value for the random variable is represented in Equation (1), in which
b. Standard deviation: It is used to determine the degree of scatter. To calculate the spread out of the data, the average distance between the mean and the point at which the data set is available is evaluated by squaring them. The mathematical equation for SD is represented in Equation (2) in which the mean is denoted as
c. Covariance: It is measured between two dimensions. This measurement predicts the quantity of the variations in dimension from the mean. The covariance is calculated using Equation (3), where
d. Eigen values and eigen vectors of a matrix: The rectangular array of numbers, symbols, or expressions is termed as a matrix, and each and every individual item belonging to the matrix is called as elements. The term B is a
The extracted features obtained from the PCA model are specified as
Linear discriminate analysis
It is a renewed feature extraction and dimension reduction that has been utilized in the field of speech recognition, face recognition, multimedia information retrieval, and so on.
28
The main intention of LDA is to predict the optimal transformation from the high-dimensional data, which were grouped into classes. The within-class scatter matrix and between-class scatter matrix are predicted to solve the issues related to the optimal discrimination projection matrix. The mathematical equation to find optimal discrimination projection matrix
Furthermore,
Linear square regression
LSR is a renewed supervised dimensionality reduction procedure. Most of the time, the LSR is implied to extract the information from the data.
30
The optimization problem of LSR is expressed in Equation (11) in which the corresponding label of the data is represented as Le and the class indicator matrix is
The extracted features obtained from the LSR model are shown in Equation (13) in which the count of the LSR feature is represented as NS.
Furthermore, the extracted features obtained from all the three models (PCA, LDP, and LSR) are represented in Equation (14). The combined form of the extracted features Fi is modified as per Equation (15).
The combined feature Fi is subjected to hybrid algorithm L-FF, which further provides the optimal features
Optimal Feature Selection: A Hybrid Optimization Algorithm
Objective function
The foremost objective of this article is to diminish the correlation that exists between the data features during selecting the optimal features. The mathematical equation of the objective function is shown in Equation (16). Then, the correlation between two data features F1 and F2 is expressed in Equation (17) in which n indicates the number of data features.
Feature encoding
The combined features after combining the PCA, LDA, and LSR, which results in attaining Equation (15), are given as solution to proposed L-FF algorithm for selecting the optimal features. Accordingly, the extracted data features Fi where
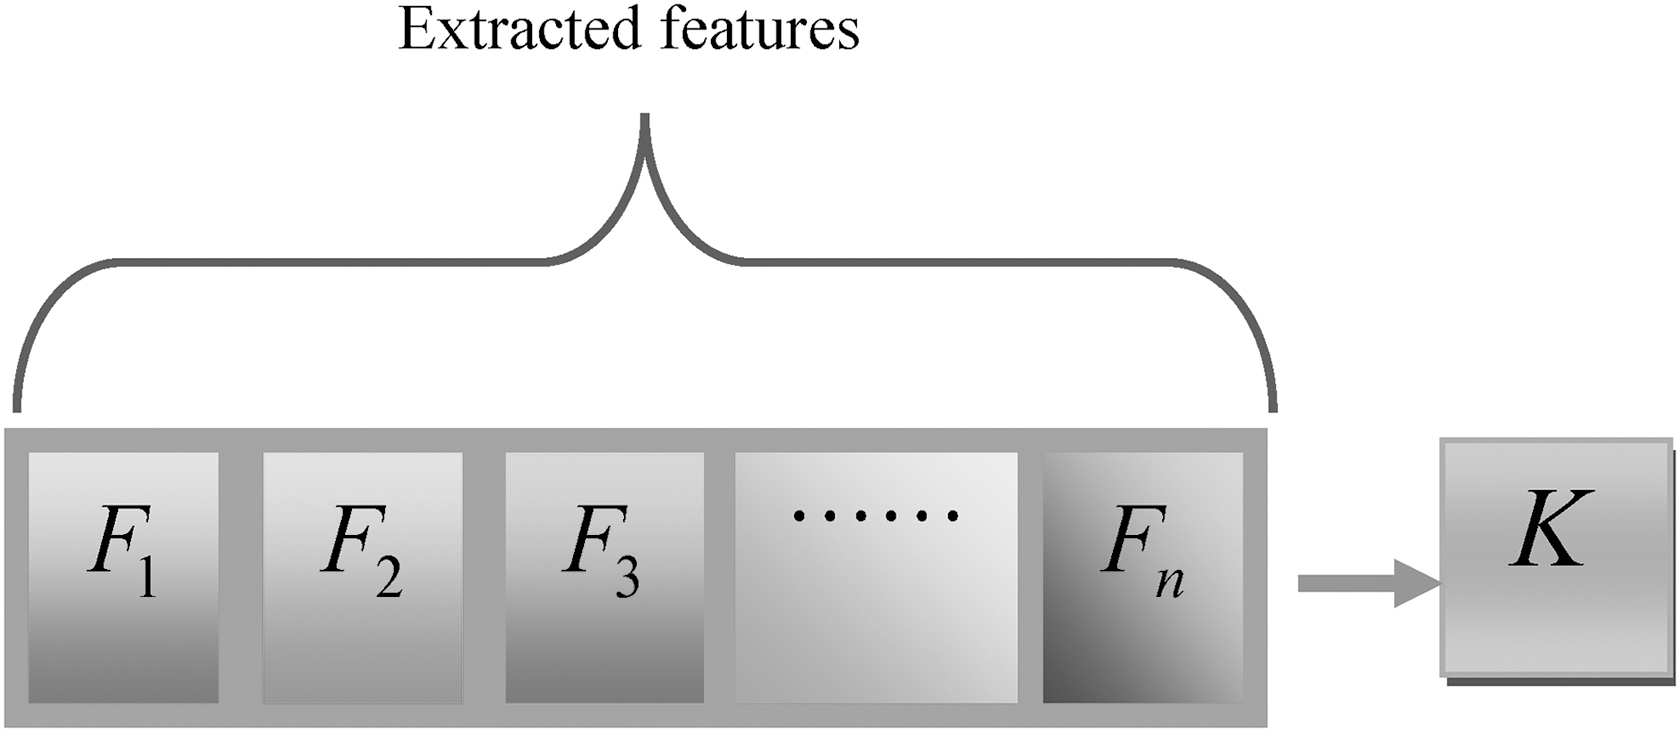
Feature encoding.
Firefly algorithm
FF algorithm
31
was developed by Xin-She Yang in the year 2008 by the inspiration got from the fireflies. Three main assumptions were made here; they are (1) all FF are unisex; (2) attractiveness is directly proportional to brightness and attractiveness is inversely proportionally to distance; (3) the objective function defines the brightness of FF. Each FF has its attractiveness, which is represented as
The current position of FF is denoted by the first term, and the attractiveness of FF is denoted by the second term. The random movement of FF is described by the last term. The initial position of FF is denoted as per Equation (21). The pseudocode for conventional FF is shown in Algorithm 1.
Lion Optimization algorithm
LA 32 was developed on the basis of the raw inspiration obtained from the unique social behavior of the lions by Rajakumar in the year 2012. The optimal solution for the problem is found by the LA on the basis of two unique lion behaviors: they are terrestrial defense and territorial takeover. In between the resident males and nomadic males, the terrestrial defense takes place, whereas in between the old territorial male and new territorial male, the territorial takeover occurs. 32
Search procedure
The aim of search procedure is to obtain the optimal solution on the basis of the objective function.
Pride generation: The initial pride encloses
Fertility evaluation:
Mating: By performing the process of crossover and mutation, newly generated
Lion operation: This process removes the existing contemporary solution and replaces it with the new solution when the new solution is a better one.
25
When the age of the cub is greater than or equal to the maturity age, the terrestrial takeover takes place. The
Termination:
The LA 32 and FF 29 are reported to have promising exploitation phases [Eq. (21) of FF and Eq. (24) of LA]. However, to exploit the advantages of both the algorithms, the proposed algorithm makes a perfect recombination strategy. It combines the updating principle based on the recombination rate, which is defined by the user based on the characteristics of the problem and the algorithm. The proposed L-FF algorithm has been explained in the subsequent section.
Proposed L-FF algorithm
In general, the FF has the capacity of dealing complex nonlinear, multimodal optimization problem in an efficient way. Moreover, it does not require a good solution to begin the iteration process. Beyond this, the FF suffers from the drawbacks such as the parameters of FF algorithm are set as fixed and they do not get altered with respect to time. The FF does not have the capacity of remembering the history of better situation of every other FF, hence there is a chance for missing of the best solution. The FF has no capacity of migrating in a random behavior. The FF could move to a certain direction alone where the brightness has been enhanced. So, due to this complex nature, FF has been linked with LA algorithm. The interlinked algorithm improved the quality of the optimal solution. Initially, in the proposed L-FF algorithm, a random number is selected. If the random value is found to be greater than 0.5, the solution is updated with the FF. This renewal of the solution is accomplished with respect to Equation (21). In case, if the random value is found be higher than 0.5, then the solution is updated by the LA and the renewal of the best solution is accomplished with respect to Equation (24). The pseudocode for L-FF algorithm is represented in Algorithm 2.
Hence, the optimally generated features are represented as
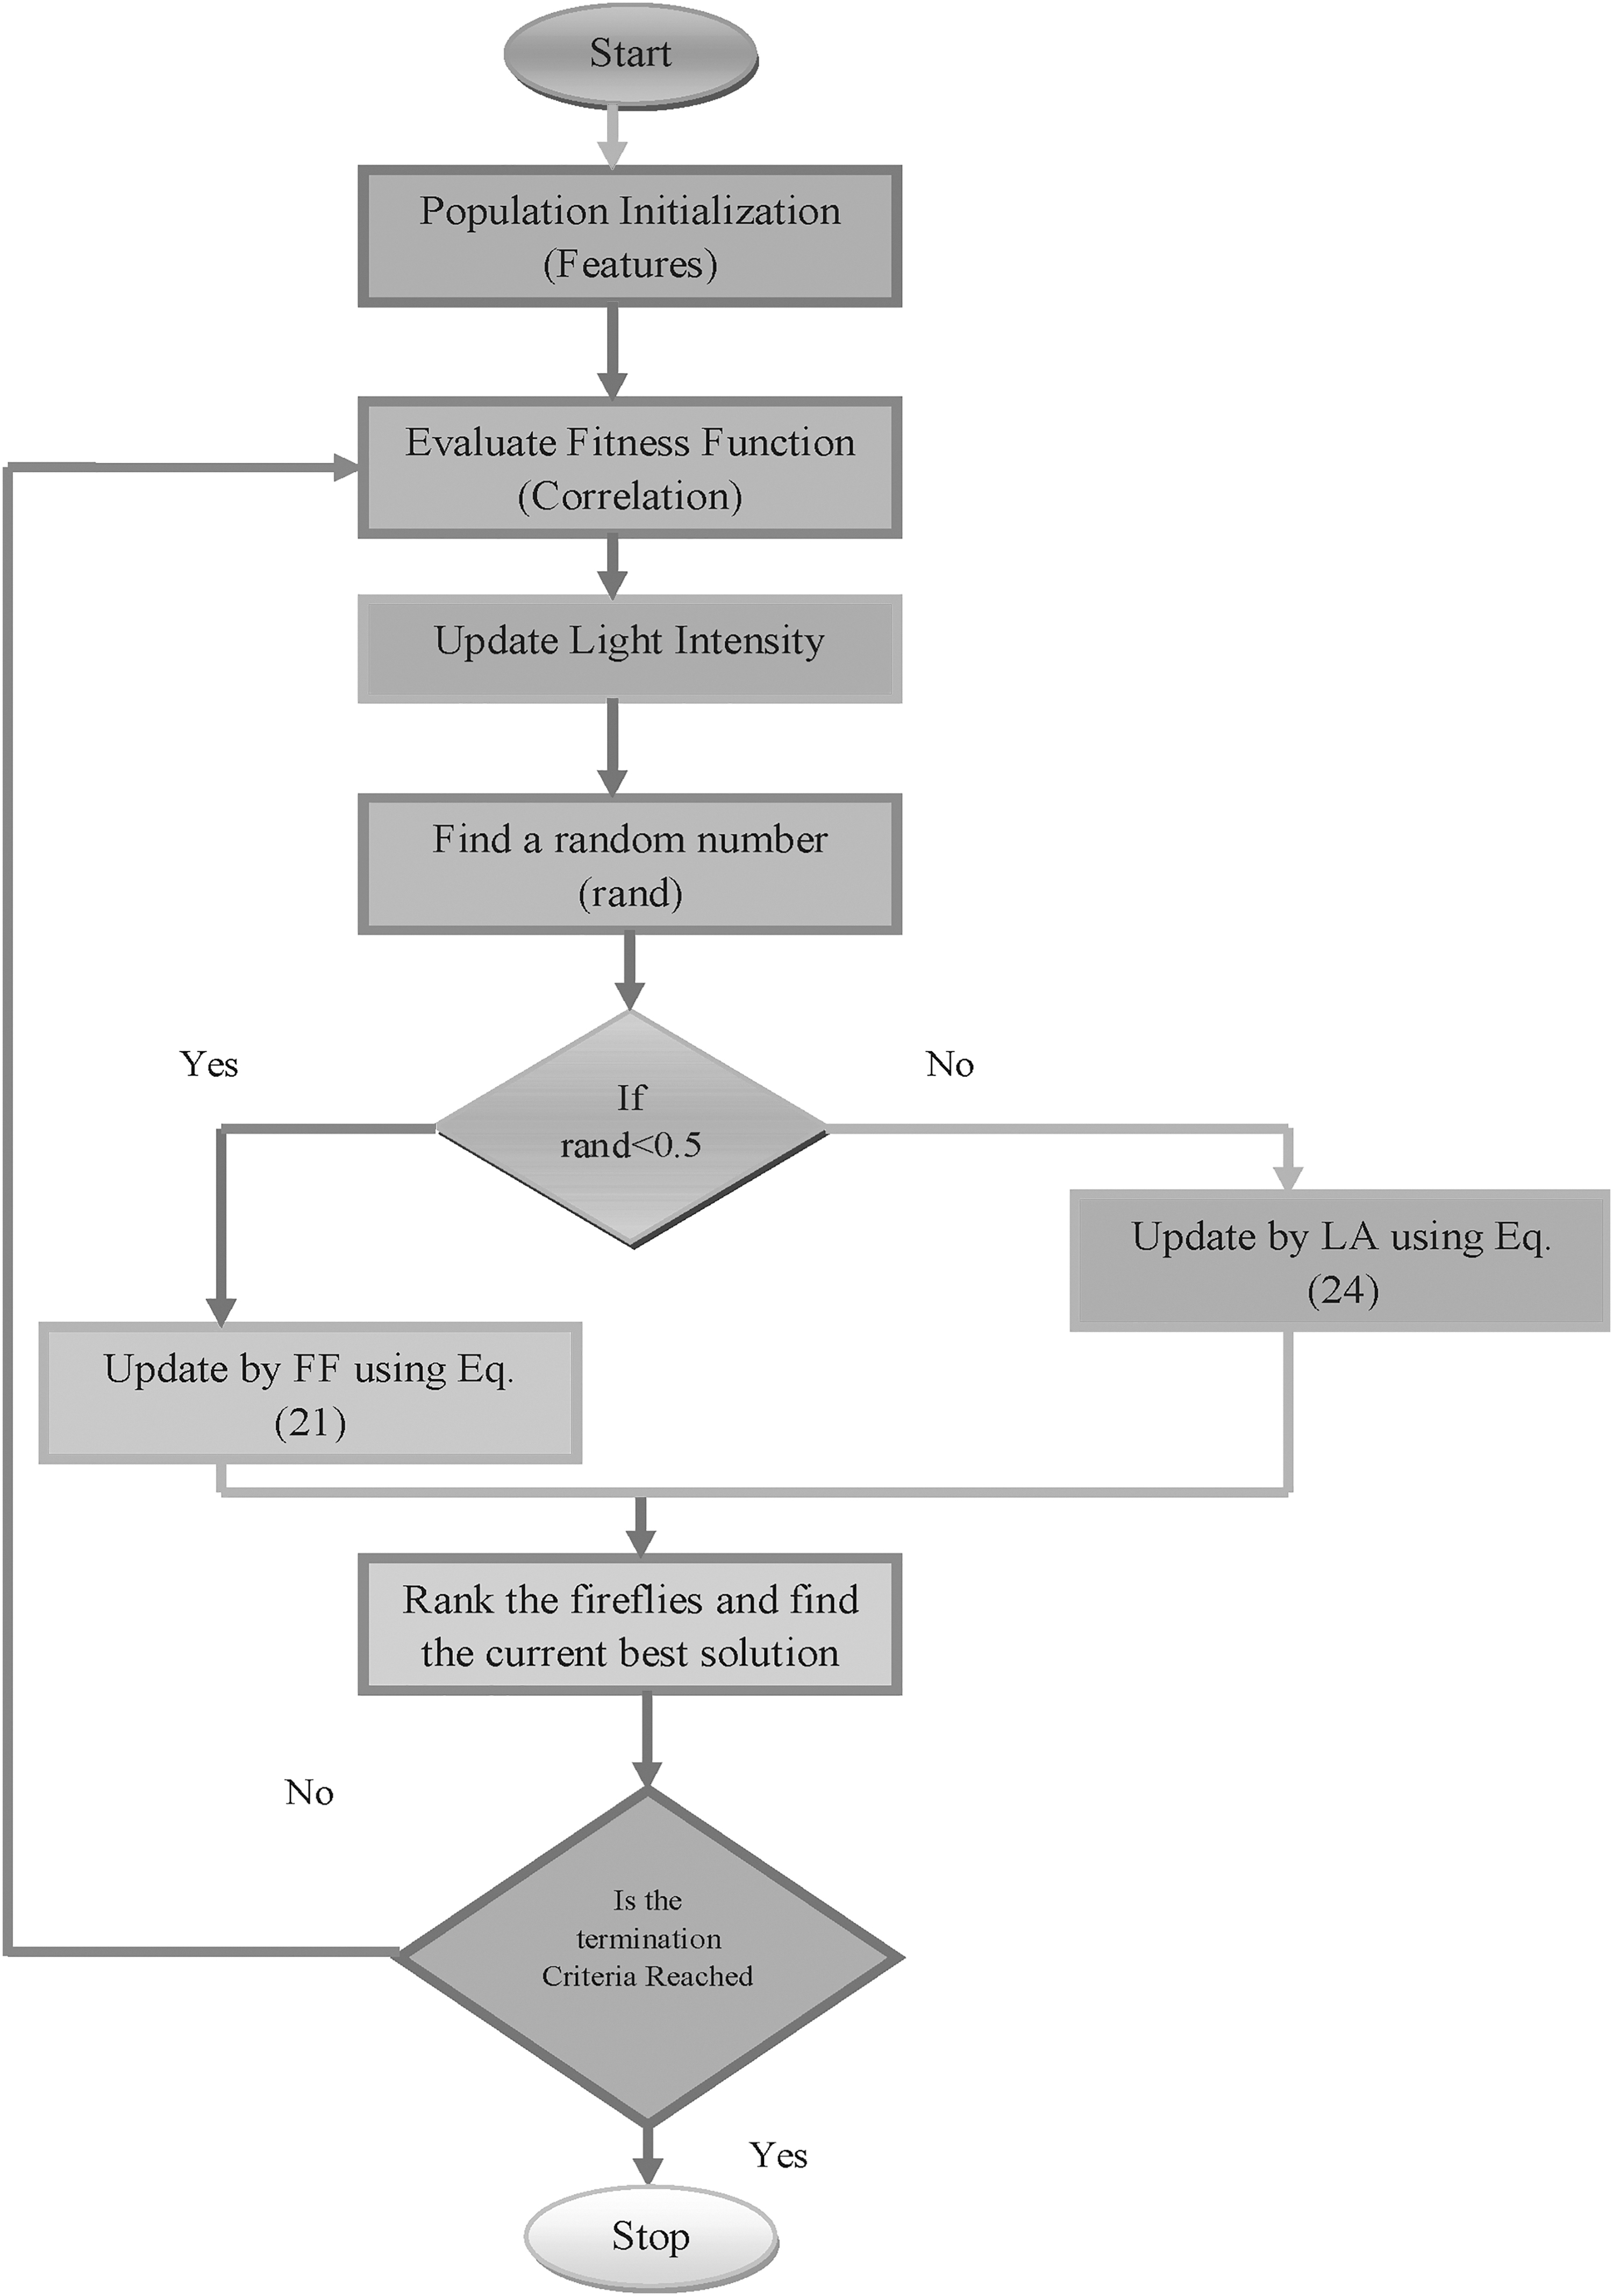
Flowchart of the proposed L-FF+NN algorithm.
Classification of Features: NN Model
NN-based classification
The optimally extracted features are fed as input to the NN classifier to have an optimal classification of the data. NN 31 is in built with a noteworthy ability of taking lots of data as input from the big data and processing those data by means of inferring the hidden, complex, and nonliner relationship that takes place between the data. Once the features are extracted, they are fed as input to NN. NN is more flexible and hence it is utilized in numerous applications.
Furthermore, Equations (30) and (31) represent the network model of the NN in which the hidden neuron is represented as a. For the hidden neurons a, the bias weight is represented as
Hence, for our data sets such as Absenteeism at work, Dermatology, Contraceptive method choice, and Immunotherapy, the classification is performed using NN with optimally selected features by the L-FF algorithm.
Results and Discussion
Experimental setup
The proposed optimal feature selection-based big data classification model was carried out in MATLAB, and the results related to the corresponding simulation were observed. The evaluation is carried out by varying the population size between 20, 40, 60, and 80, and performance standards such as accuracy, specificity, precision, and F1 score are analyzed.
Accuracy
Accuracy is the measurement of nearness to a definite value. The formula for accuracy is:
where TP refers to true positive, TN signifies true negative, FN indicates false negative, and FP is false positive.
Specificity
The specificity also called the true negative rate (TNR), which is the measure of actual negatives that are accurately assessed.
Precision
The precision is the closeness of two or more measurements to each other.
F score
The F score is otherwise known as F1 score or F measure. It is the measure of a test's precision. The F score is defined as the weighted harmonic mean of the test precision and sensitivity. This score is determined by the precision and recall of a test considered.
In the current research work, the data sets such as Absenteeism at work, Dermatology, Contraceptive method choice, and Immunotherapy data set are utilized.
Absenteeism at work database
It is gathered from https://archive.ics.uci.edu/ml/datasets/Absenteeism±at±work# (last accessed December 5, 2018). On the basis of the purpose of the research, the data set allows for several new combinations of attributes and attribute exclusions, or the modification of the attribute type (categorical, integer, or real).
Dermatology data
It is collected from https://archive.ics.uci.edu/ml/datasets/dermatology (last accessed December 5, 2018). This database is the inclusion of 4 attributes, 33 of which are linear valued and 1 of them is nominal. In the data set constructed for this domain, the family history feature has the value 1 if any of these diseases have been observed in the family, and 0 otherwise.
Contraceptive method choice database
It is collected from https://archive.ics.uci.edu/ml/datasets/Contraceptive±Method±Choice (last accessed December 5, 2018). The samples are married women who were either not pregnant or do not know if they were at the time of interview. The problem is to predict the current contraceptive method choice (no use, long-term methods, or short-term methods).
Immunotherapy data set
It is gathered from https://archive.ics.uci.edu/ml/datasets/Immunotherapy±Dataset (last accessed December 5, 2018).
To the next of L-FF+NN-based data classification model, the performance of the developed model is compared over the conventional models such as GA+NN, FF+NN, PSO+NN, ABC+NN, LA+NN, and L-FF+NN algorithms by analyzing the measures such as accuracy, specificity, precision, FPR, FNR, NPV, FDR, F1-score, and MCC. The entire performance analysis outperforms the proposed of L-FF+NN model over other existing models.
Analysis on feature selection using Absenteeism at work data set
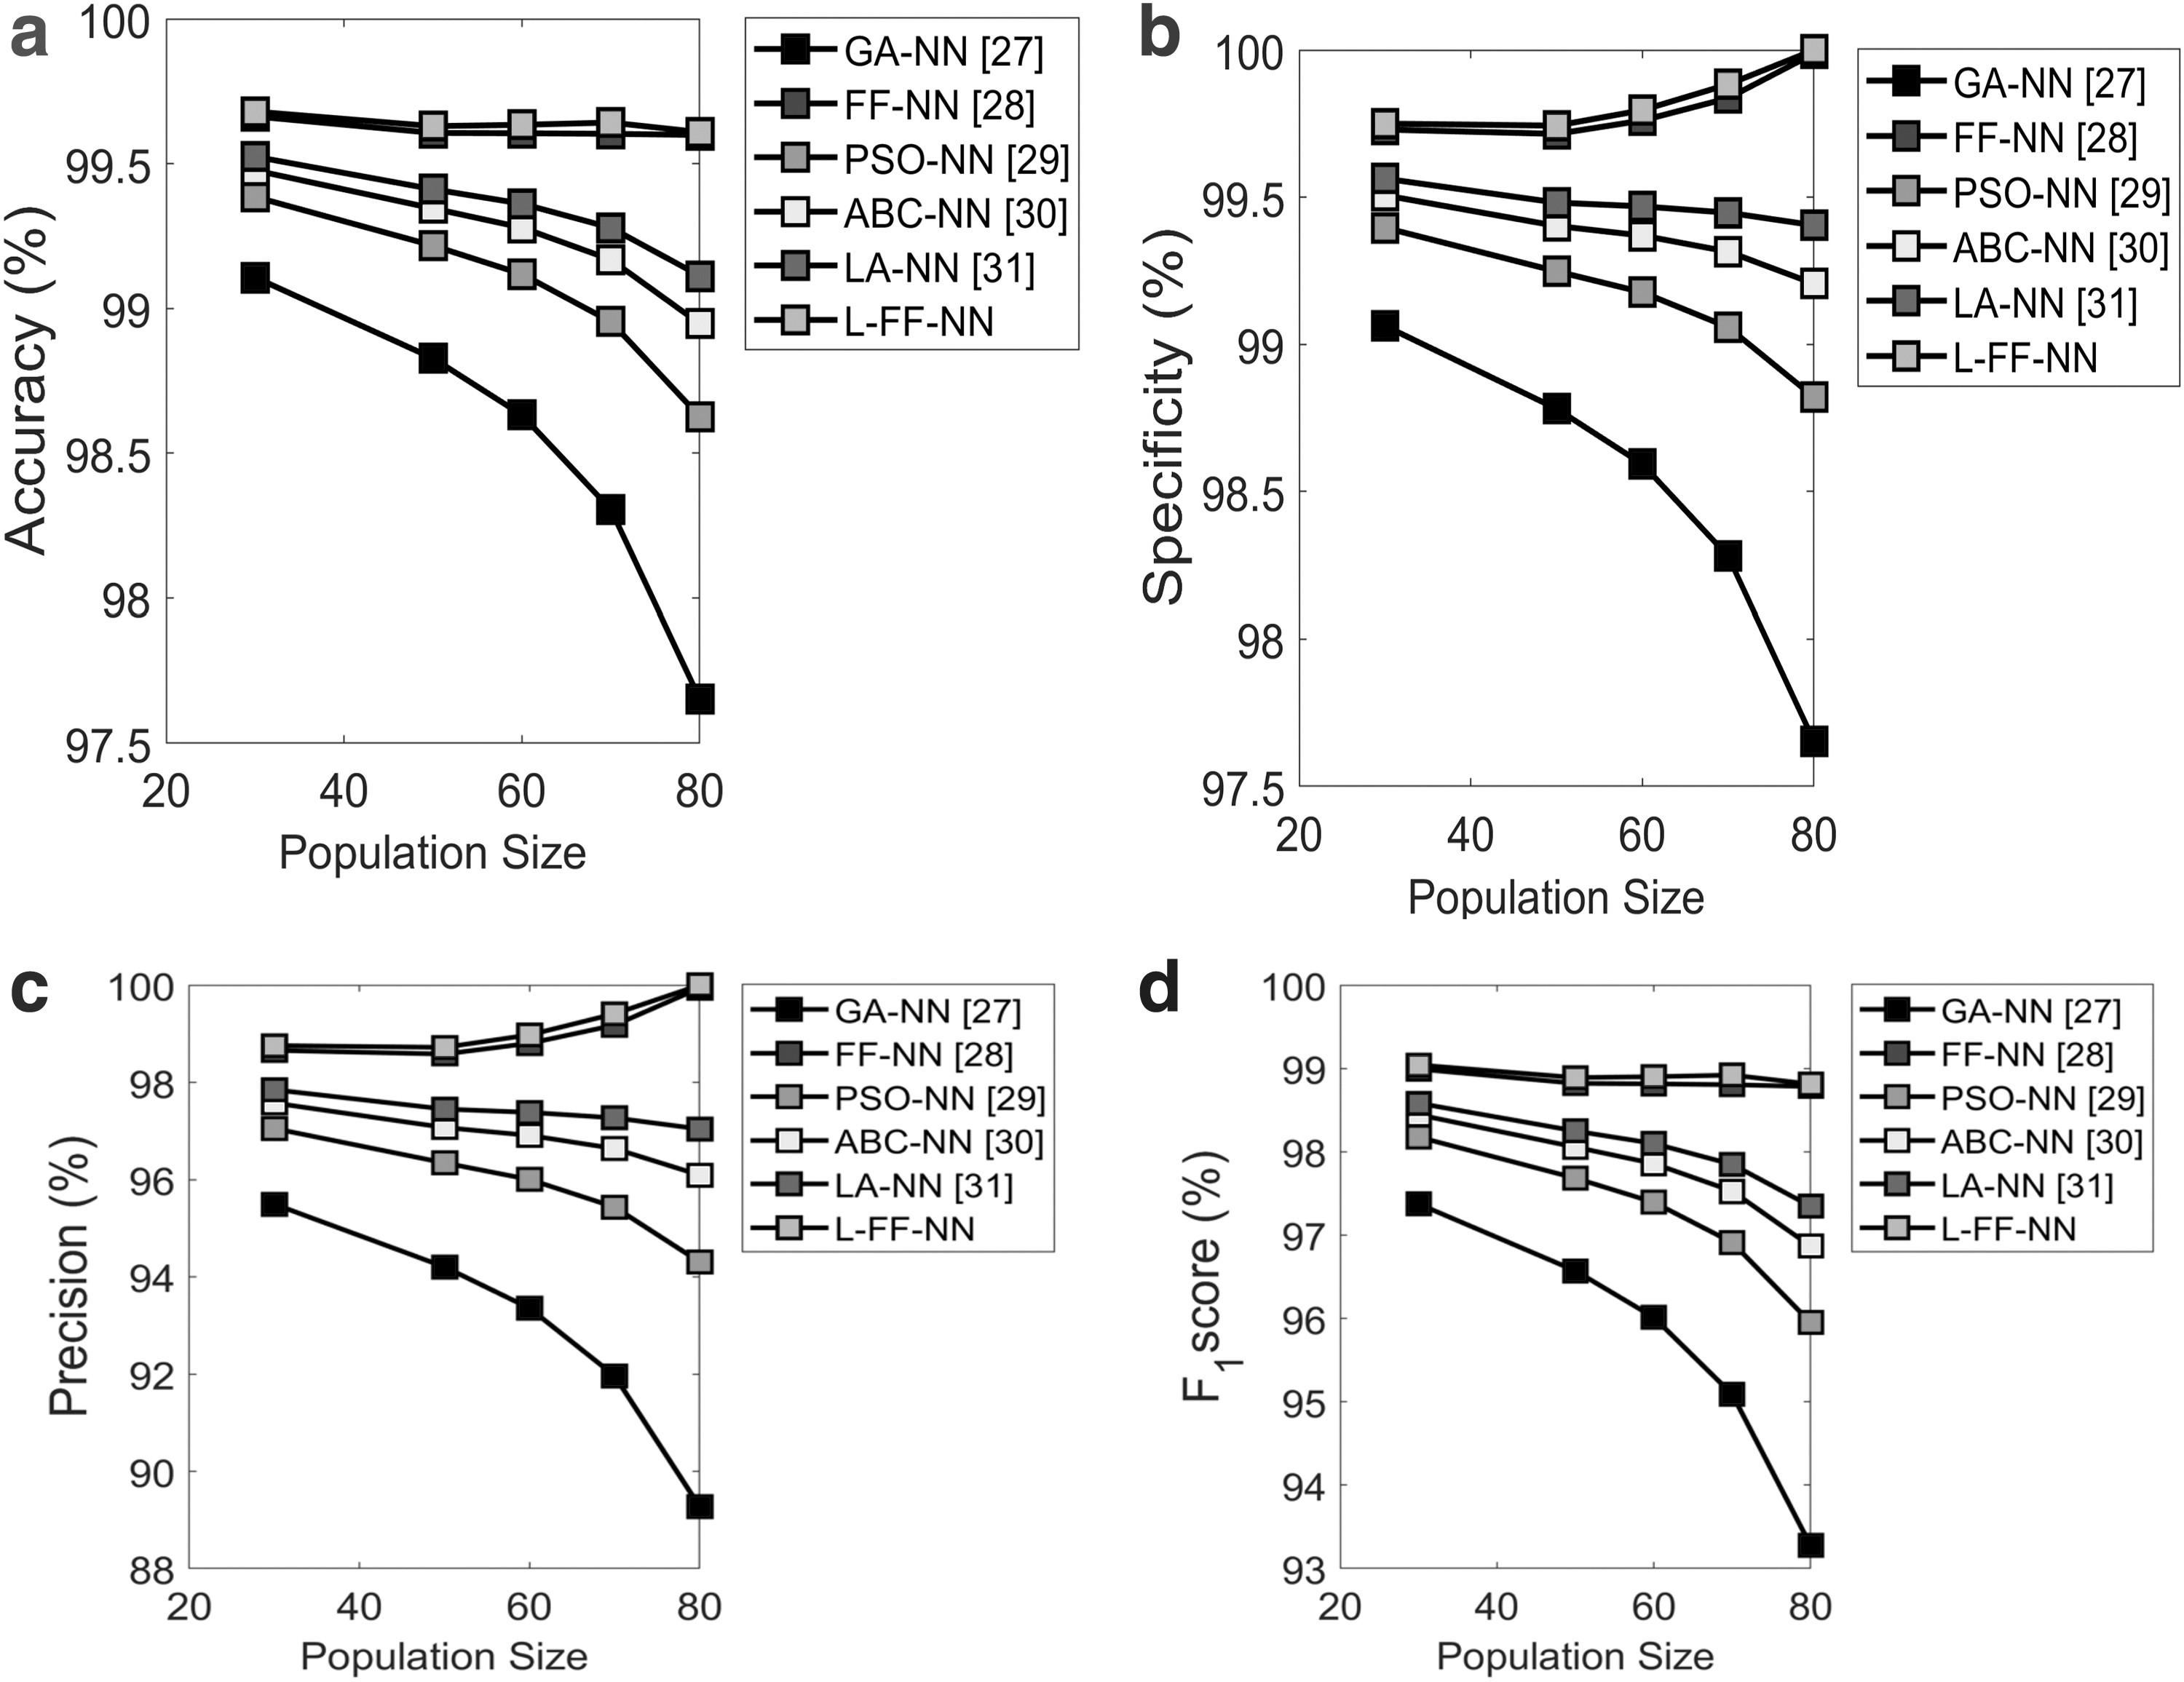
The data collected from the Absenteeism at work are used for the L-FF+NN-based data classification, which is manifested in Figure 4. The evaluation is carried out by varying the population size between 20, 40, 60, and 80, and performance standards such as accuracy, specificity, precision, and F1 score are analyzed. From Figure 4a, the accuracy at the population size of 65 for the L-FF+NN model is 1.2% better than the existing GA+NN, and it is 0.5% and 4.1% better than FF+NN and PSO+NN, respectively, and it is 3% and 2.2% better than ABC+NN and LA+NN, respectively. Moreover, as shown in Figure 4b, the specificity of L-FF+NN for the population size of 60 is 3% better than GA+NN, 2%, superior to FA-NN, 1.5%, better than FF+NN, 1.2% and 8%, superior to the traditional methods such as ABC+NN and LA+NN, correspondingly. From Figure 4c, the precision of the L-FF+NN model is 1.3%, 0.1%, 6%, 4%, and 3% better than the traditional models such as GA+NN, FF+NN, PSO+NN, ABC+NN, and LA+NN, respectively. Then, F1 score for the L-FF+NN model is analyzed, and it is found to be 1.0% and 0.96% better than GA+NN and FF+NN, respectively, and also it is 0.9%, 0.85%, and 0.53% better than conventional models such as PSO+NN, ABC+NN and LA+NN, respectively. Table 2 represents the overall performance analysis of the proposed L-FF+NN model for the Absenteeism at work data sets. From the analysis, the accuracy of L-FF+NN model is 9.1%, 6.8%, 13%, 16.7%, and 14.3% better than the conventional models such as GA+NN, FF+NN, PSO+NN, ABC+NN, and LA+NN, respectively. Then, the sensitivity of L-FF+NN model is 23.2% better than GA+NN, and 27% better than FF+NN and 23%, 27.5%, and 17.8% better than PSO+NN, ABC+NN, and LA+NN, respectively. Then, L-FF+NN is found to be 15.7%, 14.1%, and 15% better than GA+NN, FF+NN, and PSO+NN, respectively, and also 12% and 8% better than conventional ABC+NN and PSO+NN model, respectively, in terms of specificity.
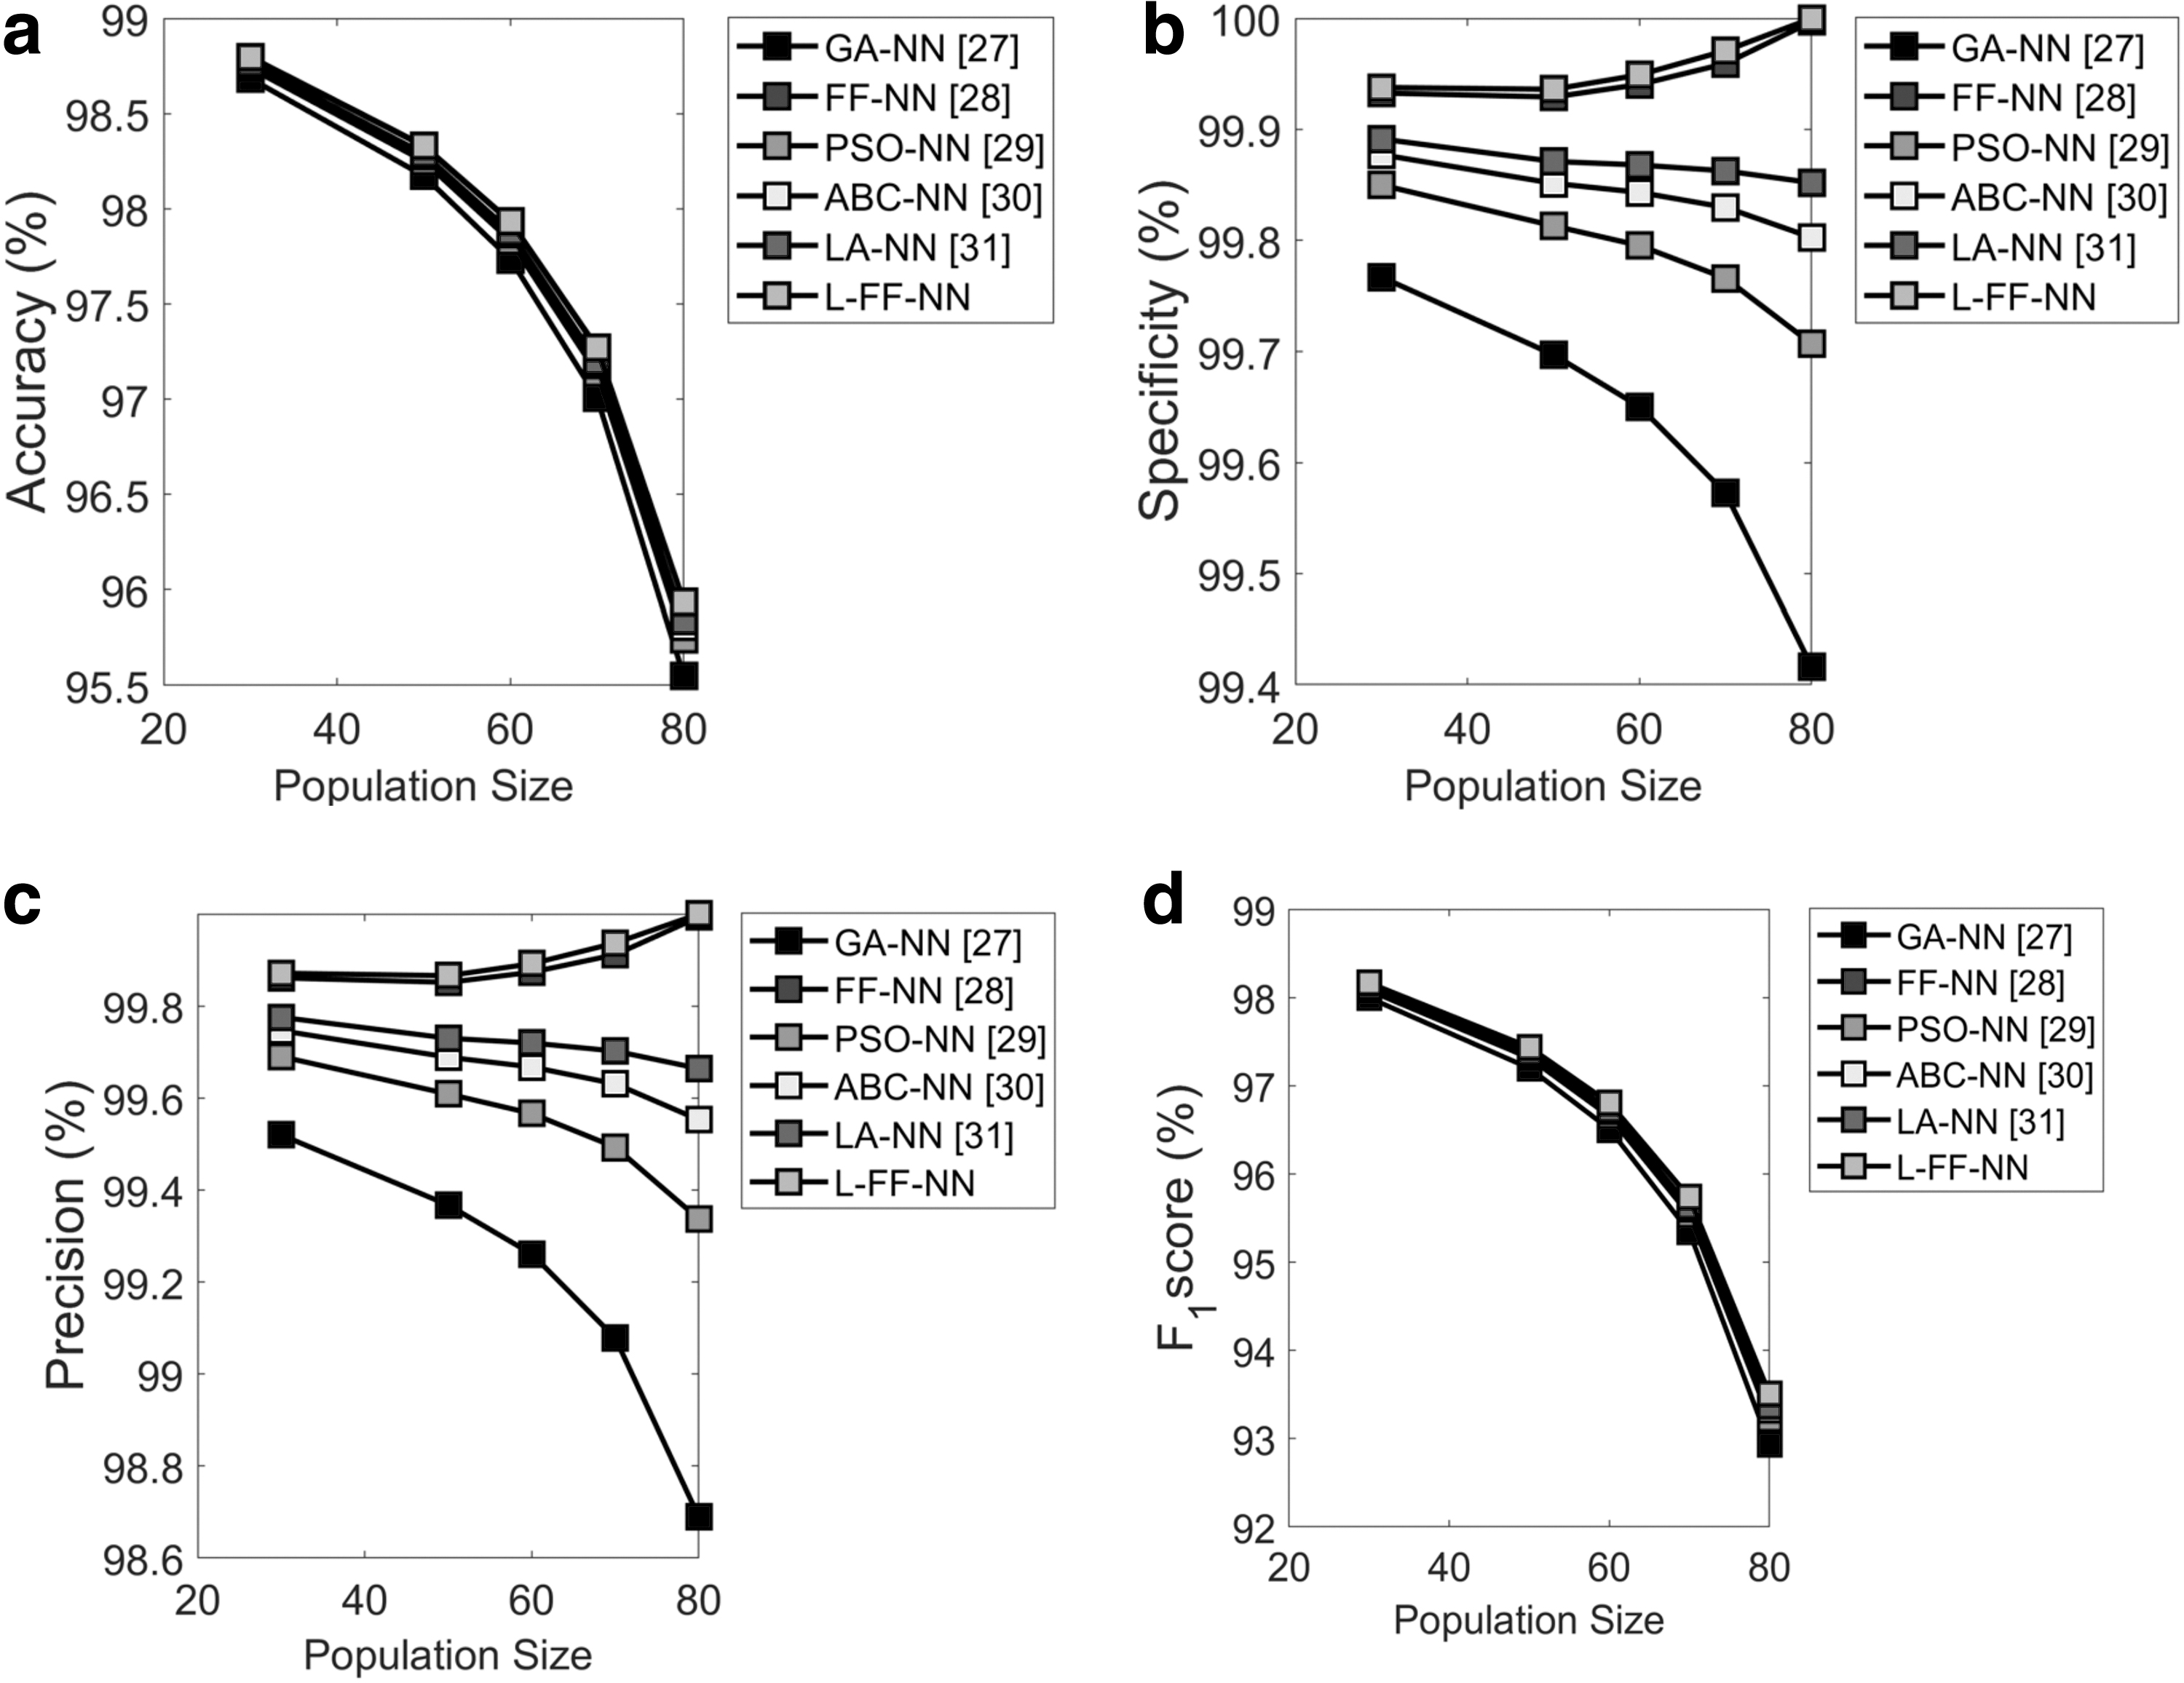
Analysis on the feature selection using Absenteeism at work data set focusing on:
Overall performance analysis of the proposed feature selection over the conventional models using Absenteeism at work data set
FPR, false-positive rate; FNR, false-negative rate; NPV, negative predictive value; FDR, false discovery rate; MCC, Matthews correlation coefficient.
Analysis on feature selection using Dermatology data set
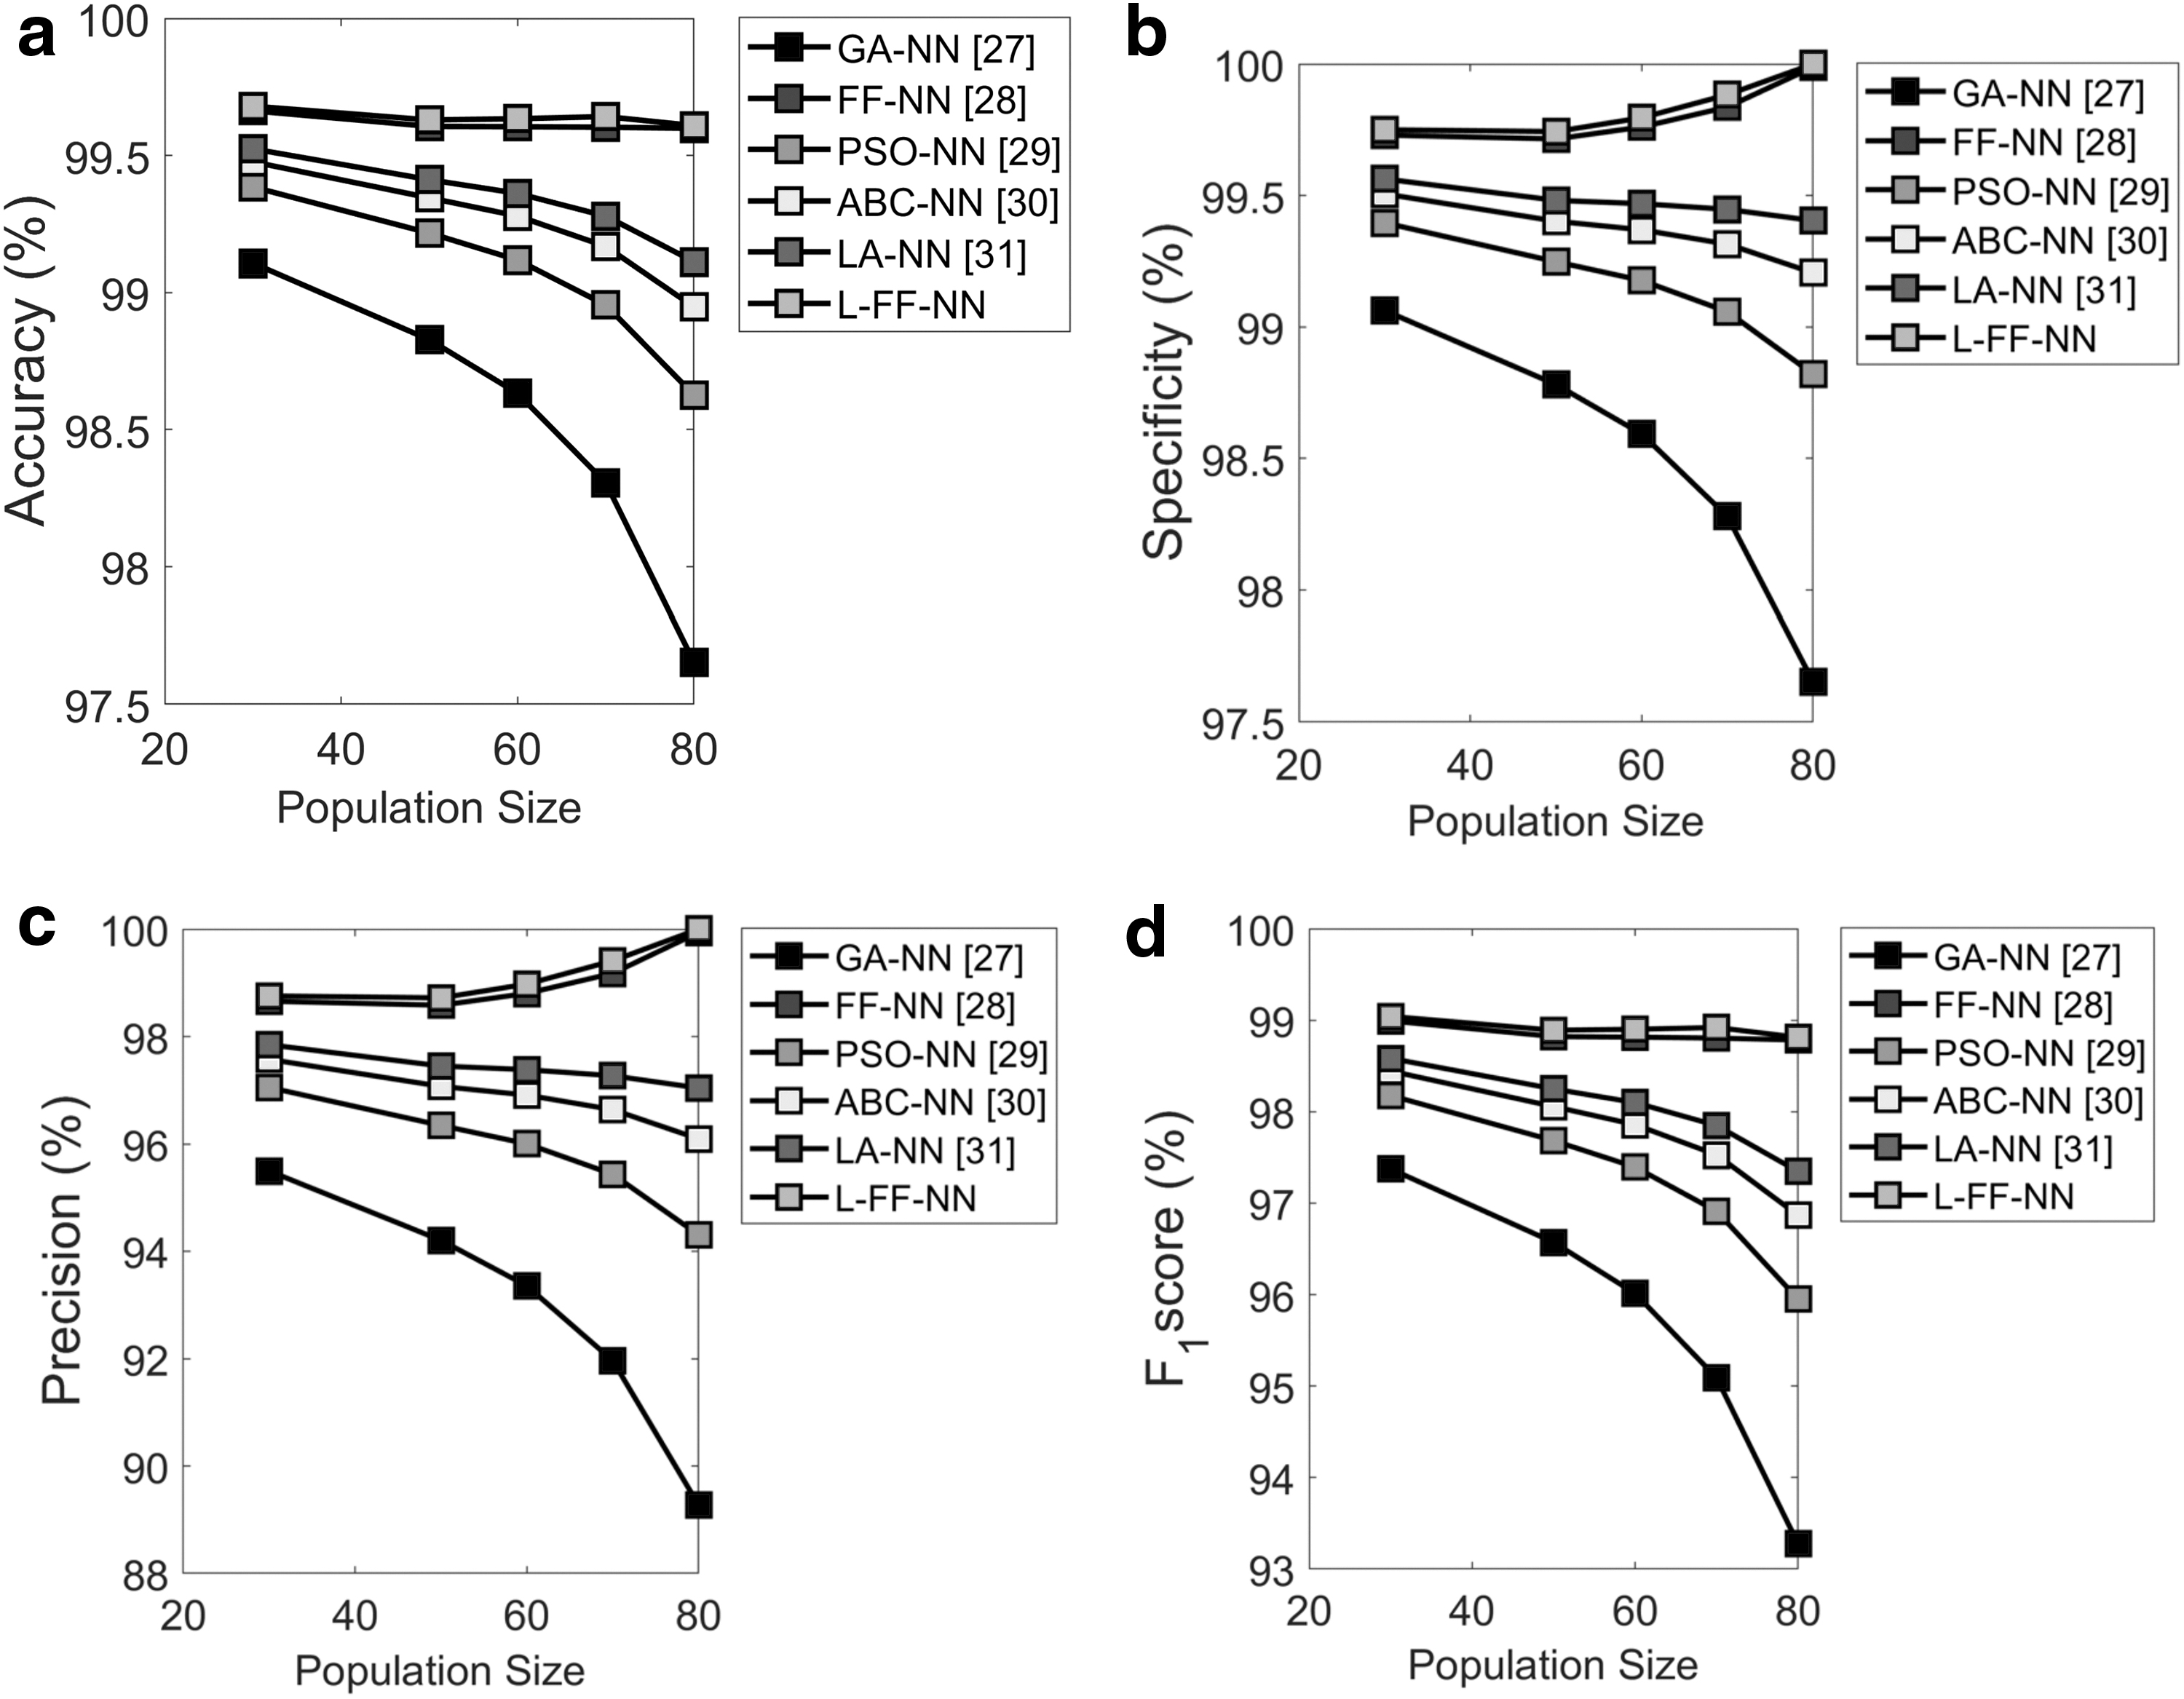
The proposed L-FF+NN model is compared over the several existing models in terms of feature selection analysis in terms of accuracy, specificity, precision, and F1 score for Dermatology data, which is given in Figure 5. From Figure 5a, the accuracy of the proposed L-FF+NN model is evaluated with the population size of 65, which is found to be 1.2%, 0.1%, and 0.4% better than GA+NN, FF+NN, and PSO+NN, respectively, and it is 0.3% and 0.2% better than ABC+NN and LA+NN, respectively. The specificity values are calculated, where the proposed L-FF+NN model is 2.4%, 0.1%, 1%, 0.6%, and 0.5% superior to the conventional models such as GA+NN, FF+NN, PSO+NN, ABC+NN, and LA+NN, respectively, when the evaluation is done at the population size of 80, as shown in Figure 5b. Furthermore, the evaluation of the proposed L-FF+NN model is compared with the existing methods in terms of precision for population size as 80, and the evaluation proves that the proposed L-FF+NN model is 1.4%, 0.1%, 0.3%, 0.6%, and 0.8% superior to the traditional models such as GA+NN, FF+NN, PSO+NN, ABC+NN, and LA+NN, respectively, based on Figure 5c. Moreover, the population size is set as 65, and the F1 score by the proposed L-FF+NN model is found to be 4%, 0.1%, and 3.2% better than the conventional models such as GA+NN, FF+NN, and PSO+NN, and it is 2.1% and 1.3% better than ABC+NN and LA+NN, respectively, and it is observed from Figure 5d. The overall performance analysis of the feature selection analysis using Dermatology data set is portrayed in Table 3. Here, the accuracy of L-FF+NN model is 1.3%, 0.9%, 1.7%, 1.2%, and 0.9% better than the conventional models such as GA+NN, FF+NN, PSO+NN, ABC+NN, and LA+NN, respectively. Similarly, the specificity of the proposed L-FF+NN model is 7% better than GA+NN and 0.1% and 3.4% better than FF+NN and PSO+NN and also 1.8% and 2.3% better than ABC+NN and LA+NN, respectively. Furthermore, the NPV analysis of the proposed L-FF+NN model is 7%, 0.1%, 3.4%, 1.8%, and 2.3% better than the conventional models such as GA+NN, FF+NN, PSO+NN, ABC+NN, and LA+NN, respectively. Moreover, in terms of FDR, the proposed L-FF+NN model is 92%, 28%, 87%, 82%, and 78% superior to the state-of-art models such as GA+NN, FF+NN, PSO+NN, ABC+NN, and LA+NN, respectively. Furthermore, the F1 score of the proposed L-FF+NN model is 3.3%, 0.9%, and 1.7% better than traditional models such as GA+NN, FF+NN, and PSO+NN, respectively, and it is 1.1% and 0.9% better than ABC+NN and LA+NN, respectively.
Analysis on the feature selection using Dermatology data set focusing on:
Overall performance analysis of the proposed feature selection over the conventional models using Dermatology data set
Analysis on feature selection using Contraceptive method choice data set
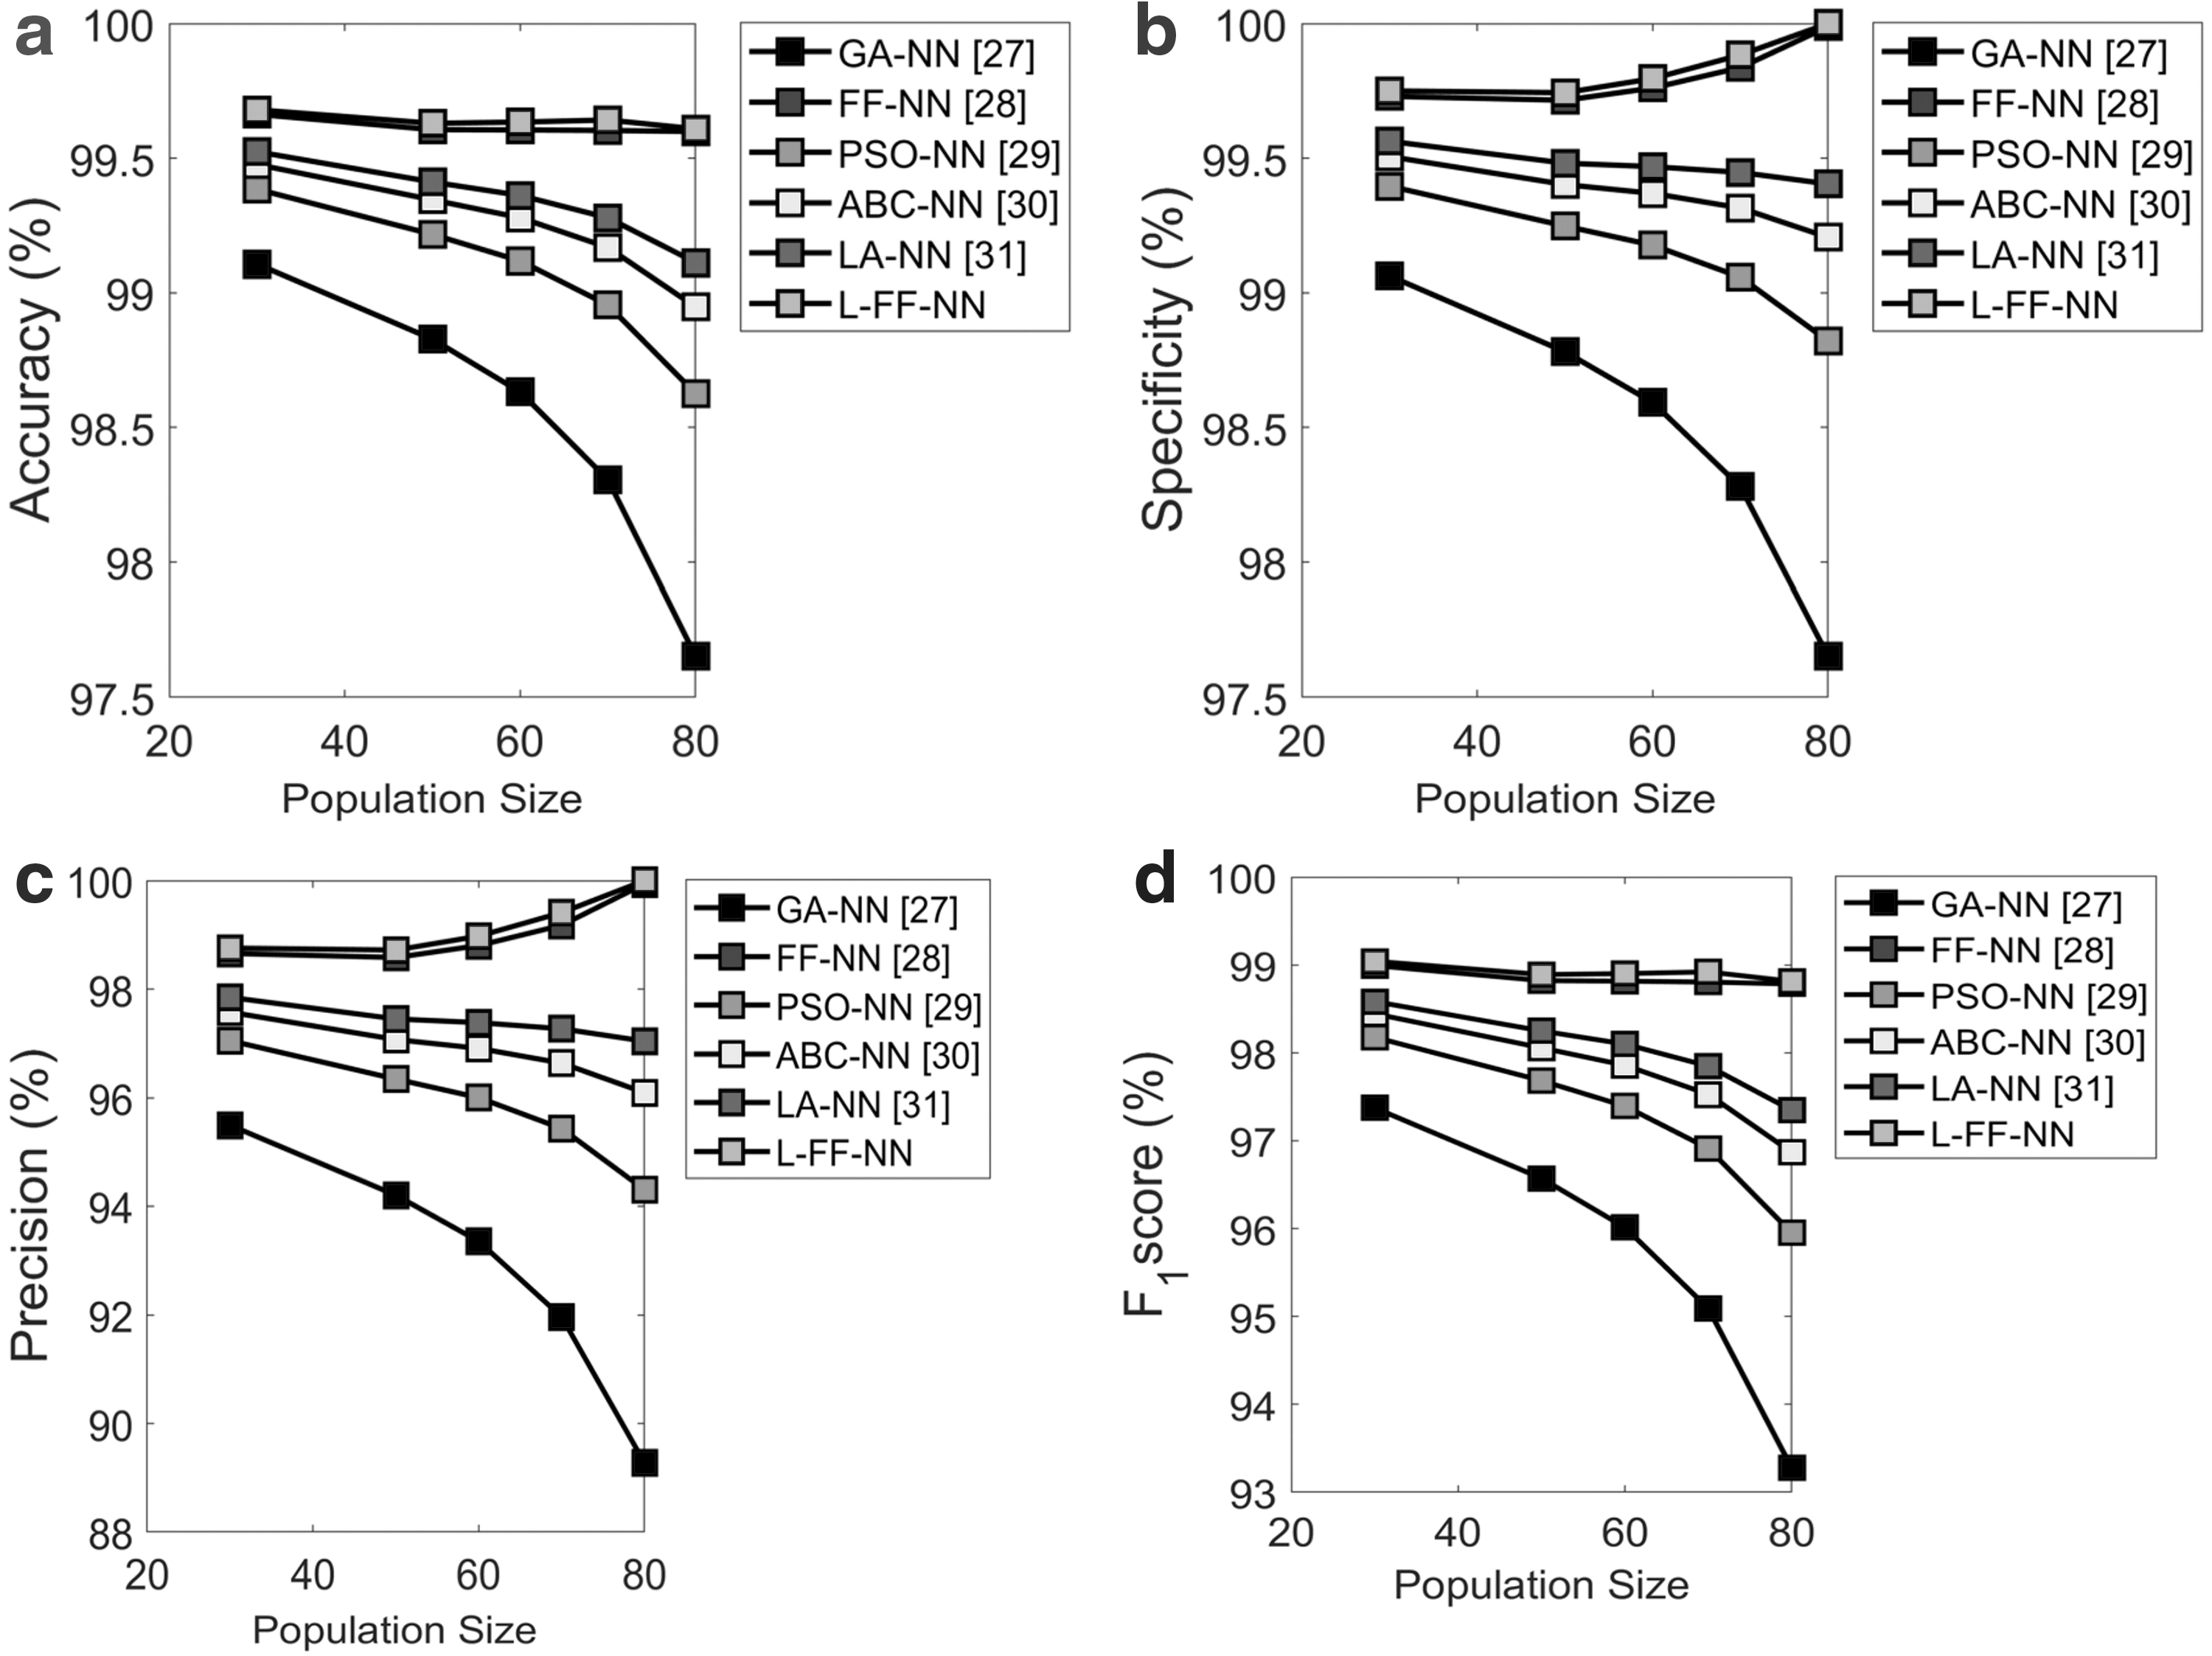
The data collected from the Contraceptive method choice database were analyzed. The evaluation of the feature selection analysis was carried out in terms of certain performance measures by varying the population size. Figure 6 portrays the performance analysis on Contraceptive method choice database. The modeled feature selection analysis on proposed L-FF+NN model is compared with conventional models such as GA+NN, FF+NN, PSO+NN, ABC+NN, and LA+NN in terms of accuracy, and the securitized values for the population size of 80 are found to be 2.1% and 0.1% better the GA+NN and FF+NN and also 0.9%, 0.3%, and 0.2% better than the conventional models such as PSO+NN, ABC+NN, and LA+NN, respectively, in Figure 6a. For the population size of 65, in Figure 6b, the specificity of the proposed L-FF+NN model is found to be 1.3%, 0.1%, 0.6%, 0.2%, and 0.3% better than the traditional models such as GA+NN, FF+NN, PSO+NN, ABC+NN, and LA+NN, respectively. From Figure 6c, the precision of the proposed L-FF+NN model is 7.6%, 0.1%, 4%, 3.2%, and 1.8% superior to the conventional models such as GA+NN, FF+NN, PSO+NN, ABC+NN, and LA+NN, respectively, while setting the population size to 65. Moreover, in terms of precision, the population size is set as 65 as per Figure 6d, and the model is evaluated with the conventional models for F1 score, and it is found that the proposed L-FF+NN model is 7%, 0.1%, 4.1%, 2.2%, and 2.8% better than the conventional models such as GA+NN, FF+NN, PSO+NN, ABC+NN, and LA+NN, respectively. The overall performance analysis in terms of feature selection of proposed L-FF+NN on the Contraceptive method choice database is portrayed in Table 4. Here, the accuracy of the proposed L-FF+NN model is 1.8%, 0.39%, 0.6%, 0.4%, and 0.3% better than the traditional models such as GA+NN, FF+NN, PSO+NN, ABC+NN, and LA+NN, respectively. Similarly, the MCC value of the proposed L-FF+NN model is 4.8%, 0.14%, and 2.5% better than the conventional models such as GA+NN, FF+NN, and PSO+NN, respectively, and it is 1.7% and 1.3% better than ABC+NN and LA+NN, respectively. The F1 score by the proposed L-FF+NN model is 9.4%, 0.1%, and 2% better than the traditional models such as GA+NN, FF+NN, and PSO+NN, respectively, and it is 1.4% better than ABC+NN and 10% better than LA+NN. Furthermore, in terms of FDR of the proposed L-FF+NN model, the evaluation proves that it is 92%, 28%, 87%, 82%, and 78% superior to the conventional models such as GA+NN, FF+NN, PSO+NN, ABC+NN, and LA+NN, respectively. Then, there is 1.6%, 0.4%, 0.8%, 0.5%, and 0.4% improvement in the proposed L-FF+NN model over the conventional models such as GA+NN, FF+NN, PSO+NN, ABC+NN, and LA+NN, respectively, in terms of NPV analysis. Moreover, in terms of FPR, the proposed L-FF+NN model is found to 93%, 28% better than GA+NN and FF+NN, and it is 87%, 82%, and 78% better than PSO+NN ABC+NN, and LA+NN, respectively.
Analysis on the feature selection using Contraceptive method choice data set focusing on:
Overall performance analysis of the proposed feature selection over the conventional models using Contraceptive method choice data set focusing
Analysis on feature selection using Immunotherapy data set
Figure 7 shows the Immunotherapy data set of the proposed L-FF+NN model over the existing methods. On setting the population size to 45, the accuracy of the proposed L-FF+NN model is 1%, 0.1%, 0.5%, 0.4%, and 0.3% better the traditional models such as GA+NN, FF+NN, PSO+NN, ABC+NN, and LA+NN, respectively, as per Figure 7a. Moreover, in terms of specificity, from Figure 7b, the proposed L-FF+NN model is 2.1%, 0.1%, 0.5%, and 0.7% better than the traditional models such as GA+NN, FF+NN, PSO+NN, and ABC+NN, respectively, and it is 1.2% better than LA+NN in the population size 60. Furthermore, the evaluation of the proposed L-FF+NN model is compared with the existing methods in terms of precision and by using the population size as 80 and the evaluation proves that the proposed L-FF+NN model is 5%, 0.1%, 1%, 0.8%, and 0.5% superior to the traditional models such as GA+NN, FF+NN, PSO+NN, ABC+NN, and LA+NN, respectively, as shown in Figure 7c. With the population size of 65, the proposed L-FF+NN model is found to be 4%, 0.1%, and 2.5% better than the state-of-art models such as GA+NN, FF+NN, and PSO+NN, respectively, and it is 1.8% better than ABC+NN, 0.7% better than LA+NN as manifested in Figure 7d.
Analysis on the feature selection using Immunotherapy data set focusing on:
Table 5 demonstrates the performance of proposed L-FF+NN over conventional models for feature selection in Immunotherapy data set. The proposed L-FF+NN model in terms of accuracy is 0.2%, 0.1%, 0.14%, 0.9%, and 0.7% better than the traditional models such as GA+NN, FF+NN, PSO+NN, ABC+NN, and LA+NN, respectively. The specificity of the proposed L-FF+NN model is found to be 0.3%, 0.012%, 0.2%, 0.14%, and 0.18% better than the traditional models such as GA+NN, FF+NN, PSO+NN, ABC+NN, and LA+NN, respectively. The proposed L-FF+NN model is analyzed in terms of precision and it is found to be 0.89%, 0.02%, and 0.4% better than the state-of-art models such as GA+NN, FF+NN, and PSO+NN, respectively, and it is 0.3% and 0.2% better than ABC+NN and LA+NN, respectively. The proposed L-FF+NN model is evaluated over the conventional model in terms of FPR, and the outcomes were found to be 93%, 28%, 87%, 82%, and 78% better than the conventional models such as GA+NN, FF+NN, PSO+NN, ABC+NN, and LA+NN, respectively.
Overall performance analysis of the proposed feature selection over the conventional models using Immunotherapy data set focusing
Analysis on classification using Absenteeism at work data set
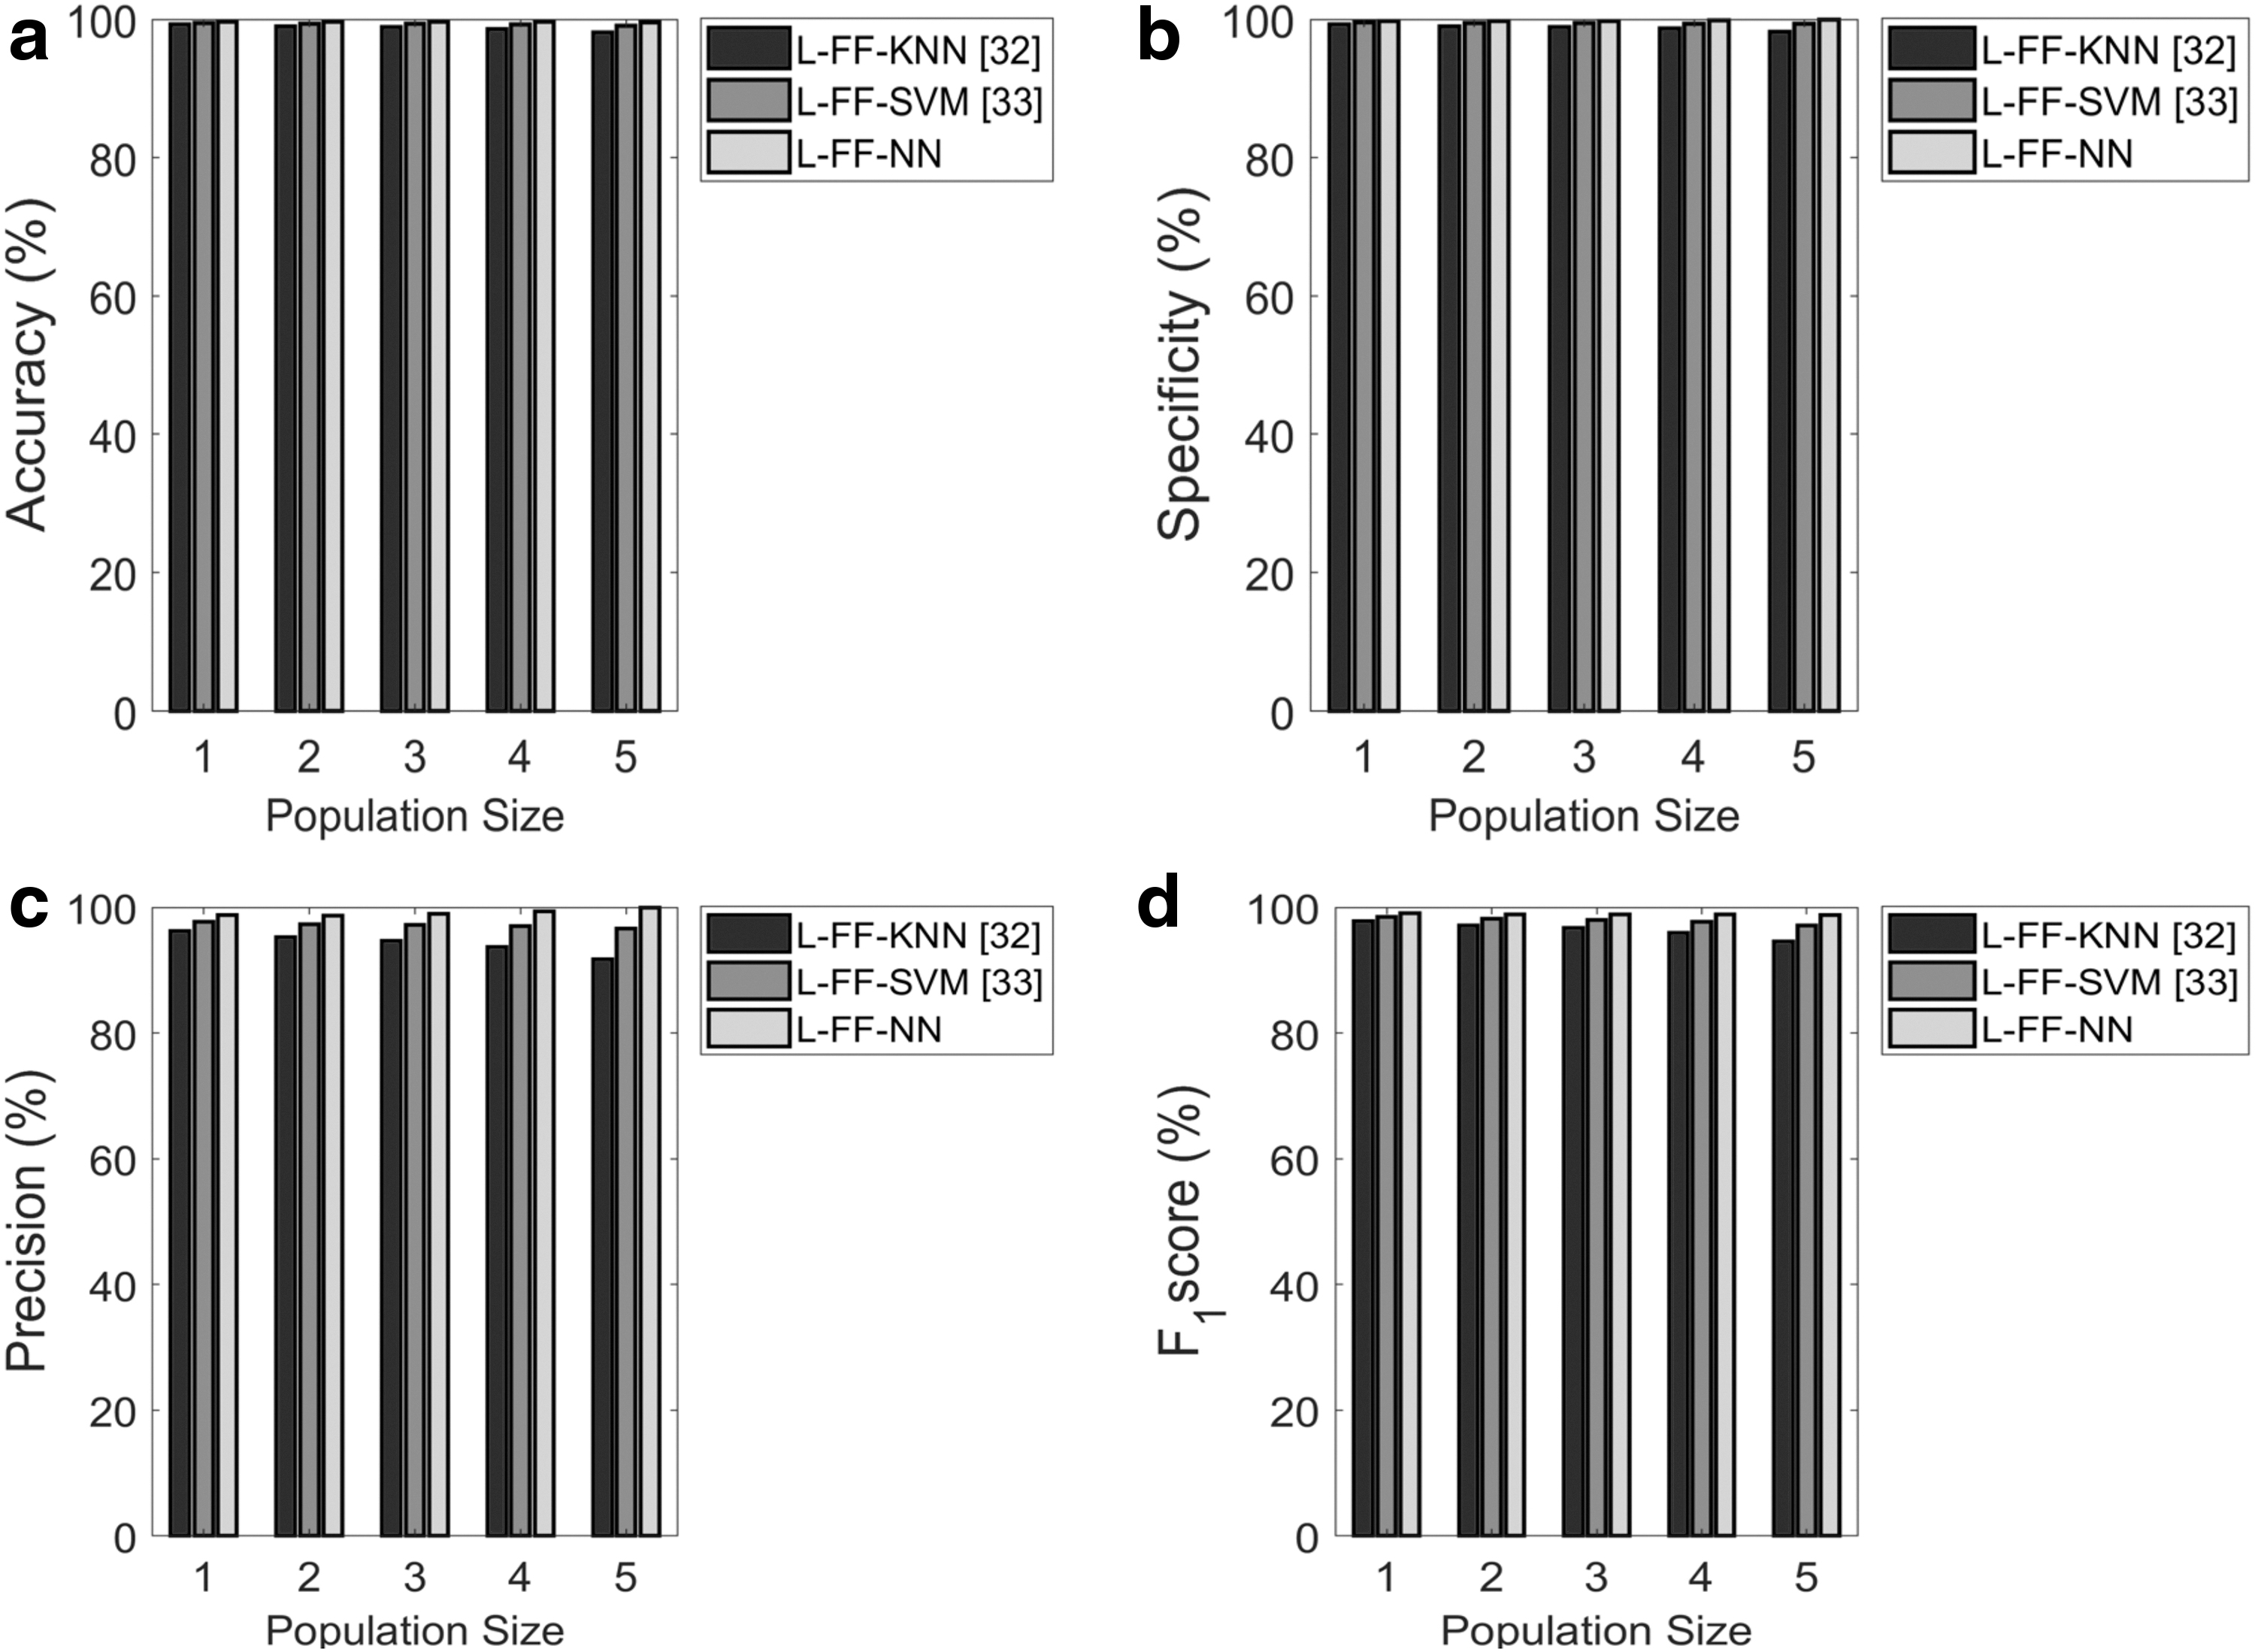
Figure 8 shows the classification analysis on the Absenteeism at work data set, and the performance of the proposed model is evaluated over the conventional model by means of varying the population size. The population size is set as 5, and the proposed model is found to be 4.2% and 2% better than the conventional models such as L-FF+KNN and L-FF+SVM, respectively, as per Figure 8a. Then, the proposed L-FF+NN model is evaluated over the conventional model in terms of specification as shown in Figure 8b, and it is found to be 0.2% and 0.12% better than conventional models such as L-FF+KNN and L-FF+SVM, respectively, while fixing population as 3. Then, the precision of the proposed L-FF+NN model is 5.2% better than L-FF+KNN and 0.1% better than L-FF+SVM while setting the population size to 5 as per Figure 8c. From Figure 8d, the proposed L-FF+NN model is 11%, 1.1% better than the traditional models such as L-FF+KNN and L-FF+SVM for F1 score analysis with population size as 5. Table 6 demonstrates the classification analysis on Absenteeism at work data set, and the accuracy of the proposed L-FF+NN model is 3.5% better than both L-FF+KNN and L-FF+SVM. The sensitivity of the proposed L-FF+NN is 17% superior to both the conventional models such as L-FF+KNN and L-FF+SVM. Then, the specificity of the proposed model is 1.9% better than both the conventional models such as L-FF+KNN and L-FF+SVM. Furthermore, the precision of the proposed L-FF+NN model is 17% better than both the traditional models such as L-FF+KNN and L-FF+SVM. The FPR of the proposed L-FF+NN model is evaluated as 19% enhanced over both the existing models such as L-FF+KNN and L-FF+SVM. Then, in terms of FNR, there is 19% of improvement in the proposed L-FF+NN model while compared with the state-of-art models such as L-FF+KNN and L-FF+SVM. The proposed L-FF+NN is found to be 1.9% better than both the traditional models such as L-FF+KNN and L-FF+SVM in terms of NPV. Then, FDR of the proposed L-FF+NN is evaluated to be 19% better than both the traditional models such as L-FF+KNN and L-FF+SVM. The proposed L-FF+NN model has the enhancement in the MCC value as 24% over both the existing models such as L-FF+KNN and L-FF+SVM.

Analysis on the classification using Absenteeism at work data set focusing on:
Overall performance analysis of the proposed classification over the conventional models using Absenteeism at work data set
Analysis on classification using Dermatology data set
The proposed L-FF+NN model is compared over the several existing models such as L-FF+NN and L-FF+SVM by measures such as accuracy, specificity, sensitivity, and F1-score in Figure 9. The population size is set at 4, and the accuracy of the proposed L-FF+NN model is 0.3% and 0.2% better than L-FF+KNN and L-FF+SVM, respectively, as per Figure 9a. Then, from Figure 9b, the specificity of the proposed L-FF+NN model is 0.25% and 0.10% better than the traditional models such as L-FF+KNN and L-FF+SVM, respectively, at the population size of 5. The sensitivity of the proposed L-FF+NN model is 10% and 5% superior to the conventional models such as L-FF+KNN and L-FF+SVM, respectively, while setting the population size to 3 as per Figure 9c. Furthermore, from Figure 9d, the population size is 2 and the proposed L-FF+NN model is found to be 4.2% and 2.55 better than L-FF+KNN and L-FF+SVM, respectively. Table 7 describes the database on the classification analysis of Dermatology database. The performance of proposed L-FF+NN over conventional models for feature selection in Dermatology model of the proposed L-FF+NN model is 33% and 1% better than the conventional models such as L-FF+KNN and L-FF+SVM, respectively, in terms of accuracy. The sensitivity of the proposed L-FF+NN model is 30% better than KNN+NN. Then, the proposed L-FF+NN model is found to be 3.6% and 0.2% better than the conventional model in terms of specificity.
Analysis on the classification using Dermatology data set focusing on:
Overall performance analysis of the proposed classification over the conventional models using Dermatology data set
Analysis on classification using Contraceptive method choice data set
Figure 10 shows the classification analysis on the Contraceptive method choice. From Figure 10a, the accuracy of the proposed L-FF+NN model is 0.2% and 0.1% superior over the conventional models such as L-FF+KNN and L-FF+SVM at the population size of 5. Then, the population size is fixed at 5, and the specificity of the proposed L-FF+NN model is 0.2% and 0.1% better than the conventional models such as L-FF+KNN and L-FF+SVM. Then, from Figure 10c, the sensitivity of the proposed L-FF+NN model is 8% and 4% better than the traditional models such as L-FF+KNN and L-FF+SVM. Then, from Figure 10d, the population size is 3, and the F1-score of the proposed L-FF+NN model is 5.3% and 2% better than L-FF+KNN and L-FF+SVM. The overall performance analysis of the data classification is shown in Table 8, and it is 1% and 0.04% better than the traditional models in terms of accuracy. The F1-score of the proposed L-FF+NN model is 3%, 1.2% better than the conventional models such as L-FF+KNN and L-FF+SVM. Then, the proposed L-FF+NN model is 90% better than L-FF+KNN and 80% better than L-FF+SVM in terms of FDR analysis. Then, the NPV of the proposed L-FF+NN model is 1.2% and 0.2% better than the traditional models such as4 L-FF+KNN and L-FF+SVM. The proposed L-FF+NN model is found to be 91% and 80% better than the conventional model in terms of FPR.
Analysis on the classification using Contraceptive method choice data set focusing on:
Overall performance analysis of the proposed classification over the conventional models using Contraceptive method choice data set
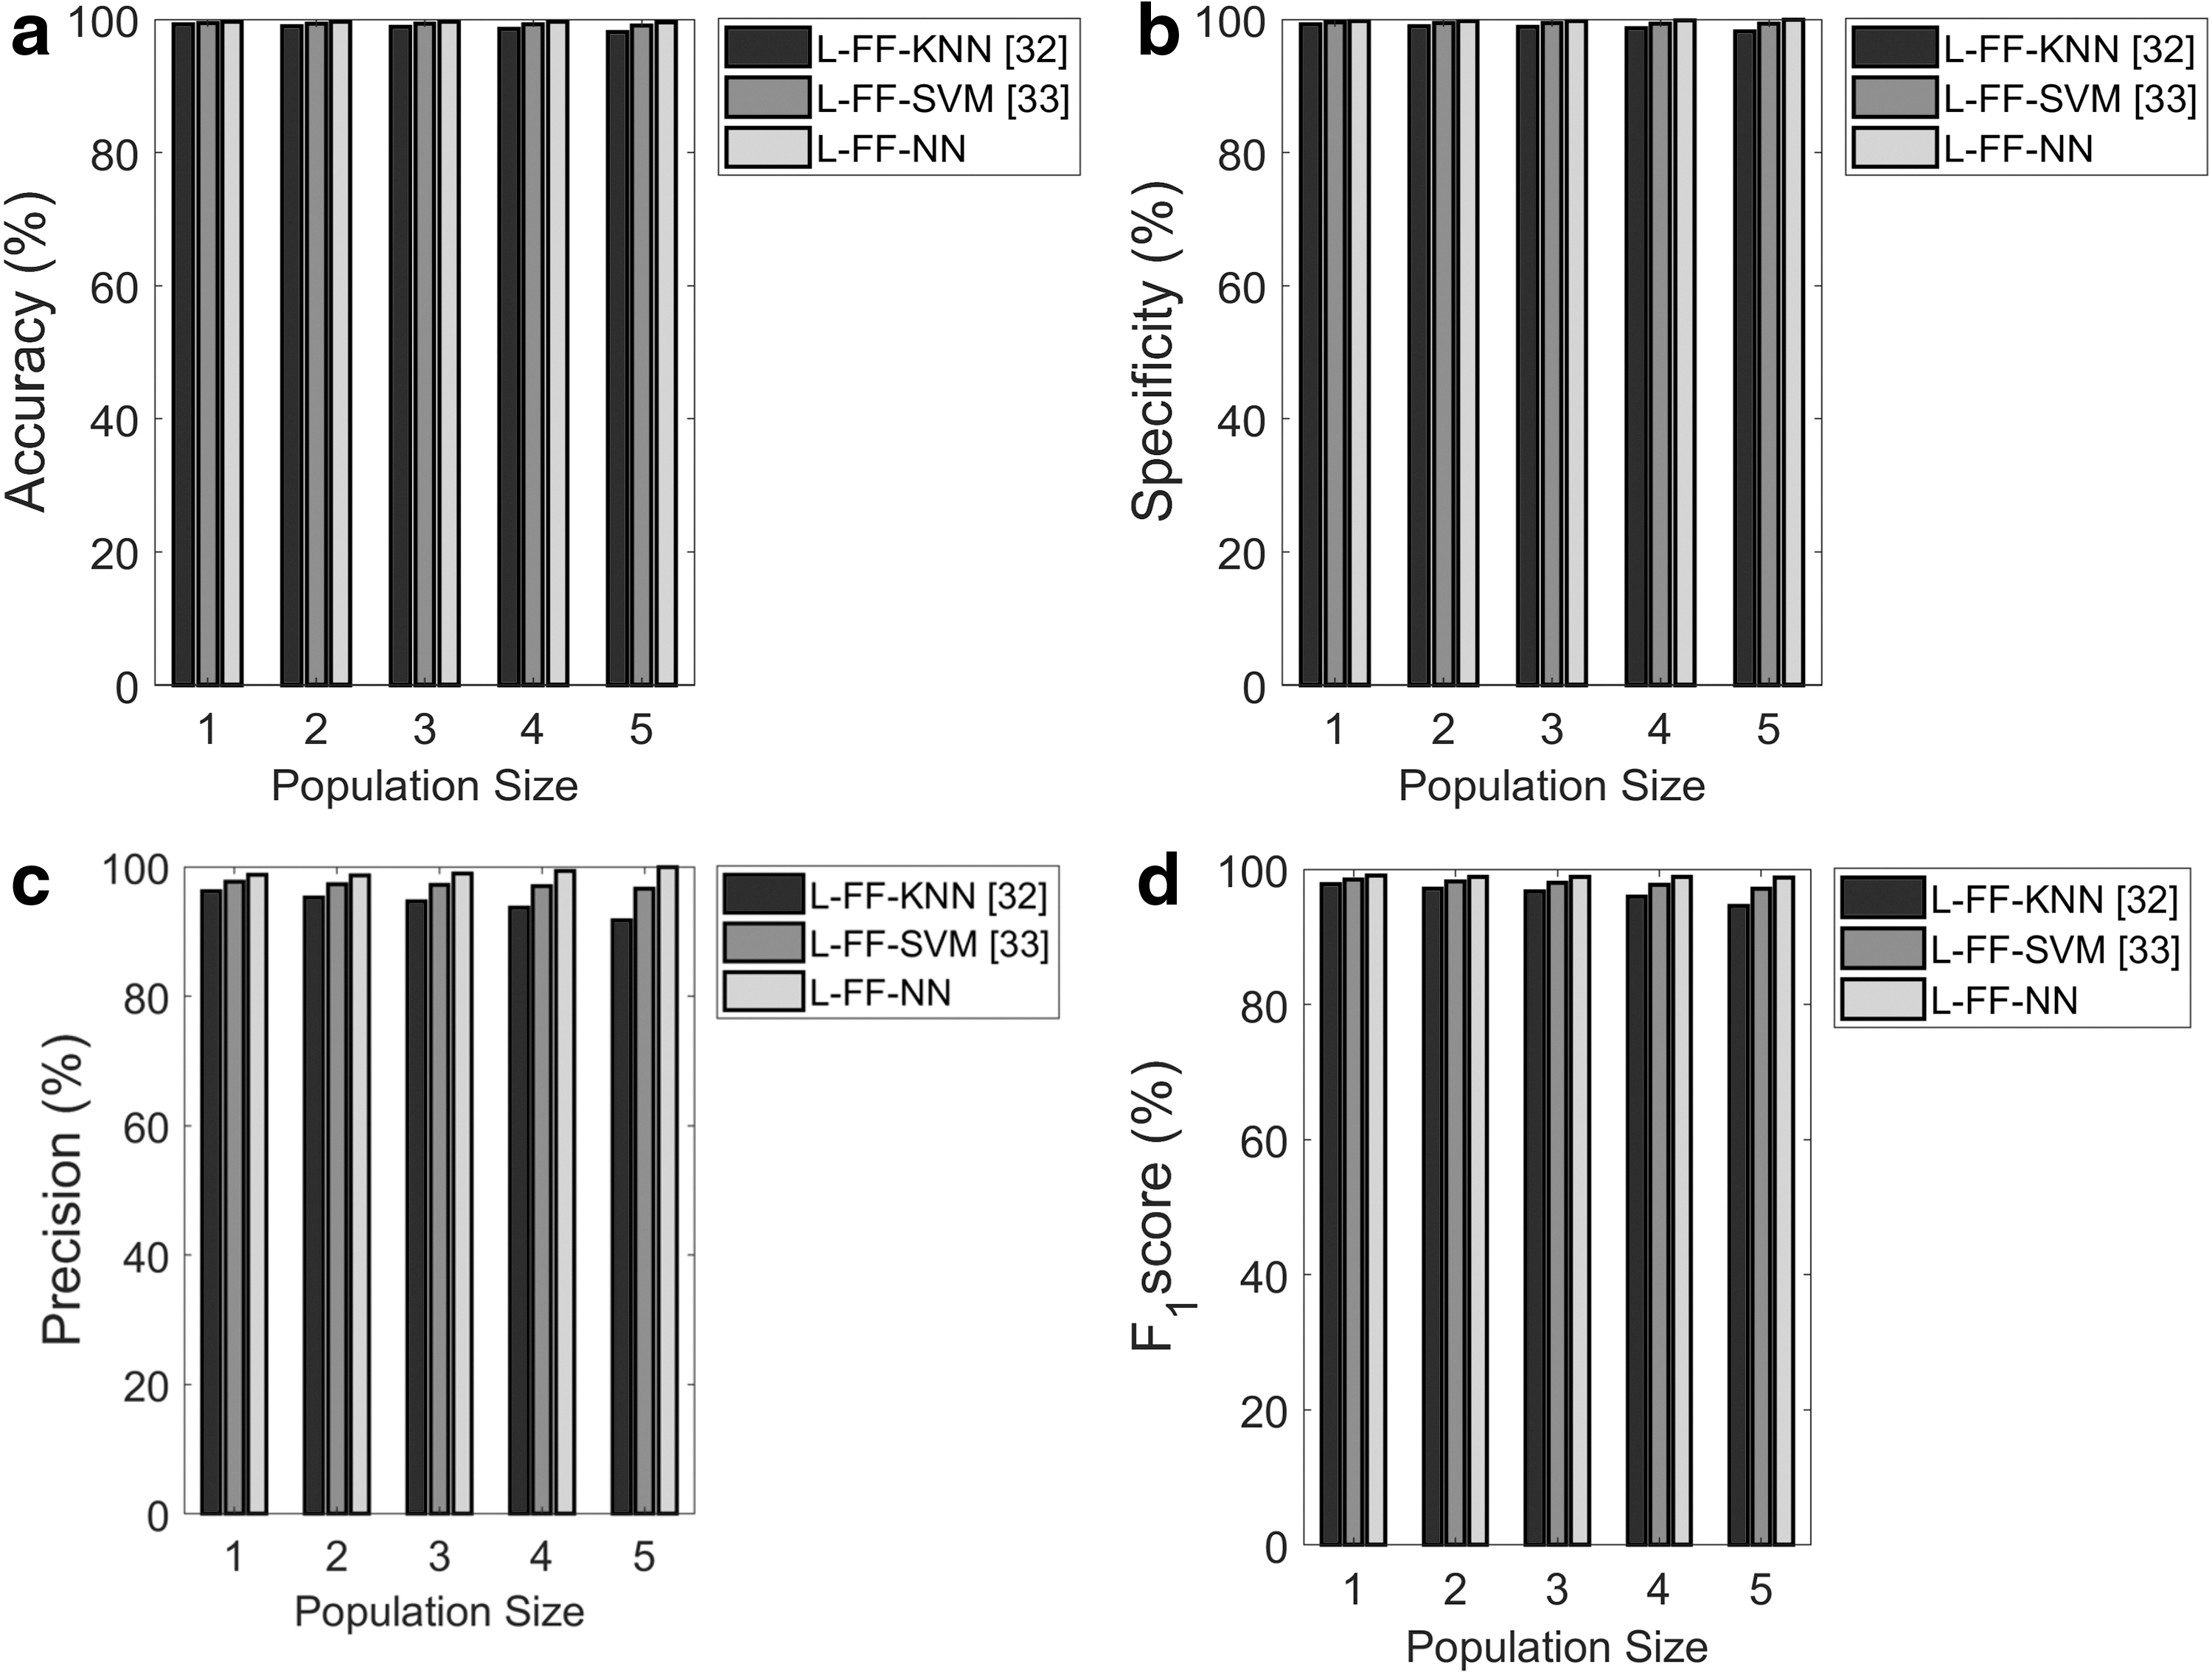
Analysis on classification using Immunotherapy data set
Figure 11 represents the feature classification analysis on the Immunotherapy data set. From Figure 11a, the accuracy of the proposed L-FF+NN model is 0.2% and 0.1% better than the classifiers such as L-FF+KNN and L-FF+SVM, while setting the population size at 5. Then, the population size is fixed at 4, and the specificity of the proposed L-FF+NN model is 0.2% and 0.1% better than the conventional models such as L-FF+KNN and L-FF+SVM, respectively, as shown in Figure 11b. The sensitivity of the proposed L-FF+NN model is 11% and 5% superior to the conventional models such as L-FF+KNN and L-FF+SVM, respectively, at the population size of 4 as per Figure 11c. Then, the proposed L-FF+NN model is found to be 4.5% and 3% better than the conventional model while fixing the population size at 3 in terms of F1-score as per Figure 11d. Table 9 demonstrates overall performance analysis of the proposed L-FF+NN model over conventional models for Immunotherapy data set. The accuracy is found to be 1.6% and 0.08% better than the conventional models such as L-FF+KNN and L-FF+SVM. Then, the sensitivity of the proposed L-FF+NN model is 2% better than KNN+NN. The proposed L-FF+NN model has the precision as 2% and 0.2% better than the conventional models such as L-FF+KNN and L-FF+SVM.

Analysis on the classification using Immunotherapy data set focusing on:
Overall performance analysis of the proposed classification over the conventional models using Immunotherapy data set
Conclusion
In this article, the big data classification model was developed with the assistance got from the intelligent methods. Three main phases were used in this article: they are (1) feature extraction, (2) optimal feature selection, and (3) classification. Before starting the feature selection and classification processes, the Parallel Pool Map reduce Framework is used for handling big data. The first phase, that is, feature extraction made use of the well-known extraction techniques such as PCA, LDA, and LSR. The dimensions of the data were high, and hence, the selection of the optimal features was a complex task so that the proposed model used the optimal feature selection technology referred as L-FF to select the optimal features. The research was focused on the objective of diminishing the correlation between the selected features, as they were related to the generation of diverse information that was related to different classes of data. Furthermore, the classification of the feature was carried out after the selection of the optimal features. The classification of the selected features was carried out with NN, which had the ability to classify the data in an effective manner with the selected features. To know about the enhancement in the performance of the proposed model, the proposed model L-FF+NN is compared over the traditional models for the data sets such as Absenteeism at work, Dermatology, Contraceptive method choice, and Immunotherapy data set in terms of accuracy, sensitivity, specificity, precision, FPR, FNR, NPV, FDR, F1-score, and MCC. In the dermatology database-based feature extraction, FDR of the proposed L-FF+NN model is 92%, 28%, 87%, 82%, and 78% superior to the state-of-art models such as GA+NN, FF+NN, PSO+NN, ABC+NN, and LA+NN, respectively. The performance of proposed L-FF+NN over conventional models for feature selection in Dermatology model of the proposed L-FF+NN model is 33% and 1% better than the conventional models such as L-FF+KNN and L-FF+SVM in terms of accuracy. Thus, the entire experimental analysis confirms the effective performance of proposed classification over conventional methods. The interconnected proposed algorithm (L-FF) aids in enhancing the optimal solution.
In the future, we will add the noisy to the original signals and improve the proposed algorithm, in case of the noisy signals pictures with the partial occlusion, illumination changes, and so on. In addition to this, the future research will focus on the moderate deployment of real big data classification for further better performance, such as business enterprise and commercial.
Footnotes
Author Disclosure Statement
No competing financial interests exist.
Funding Information
No funding was received for this article.