
Abstract
In insurance business, product sales can be realized over a variety of channels such as independent agencies, or bank branches. In 2017, 55% of premium production was generated over insurance agencies in Turkey making independent agency evaluation prominent in the domain. Unfortunately lacking attention from the scientific community, agency evaluation problem is usually tackled in the industry by utilizing internal business dynamics data. To incorporate the external facts to the agency evaluation process, we propose a computational approach to model behavior traits reflecting insurance agency channel dynamics based on not only premium sales big data but also external facts. We demonstrate how we translate these behavior traits into useful features, namely, utilization, response, and governance, so that each agency can be positioned in a space whose dimensions are determined by these features allowing easy visual detection of segments. Utilization model suggests that each agency has a potential based on its location, determined by several local socioeconomic factors, and it explains the capability of converting potential to profit. To compute utilization scores, we adapt point-of-interest data as a parameter to the segmentation model, a novel approach not only in the insurance business but also in the literature. The response model suggests that a responsive agency must follow overall profit trends of the company. Finally, the governance model explains agency/company cooperation in terms of premium production. All together, we propose a segmentation-based agency evaluation model providing understanding of insurance agency behavior that could be explained and formulated along these three dimensions. Based on the findings from a year-long case study and a proceeding implementation period of our models on an actual analytic system of the insurance company donating the data, we reflect on the performance and usability of our behavioral models that were fit on premium sales big data comprising 127 million transactions. Our results suggest that (1) our approach is quite efficient in extracting features from production logs, (2) behavioral models are quite intuitive resulting in straightforward application steps, and (3) the adoption of behavior models in agency segmentation and evaluation processes is an improvement over commonplace approaches in which premium production is used as the sole metric.
Introduction
Insurance industry has given rise to an ever-growing market comprising a wide spectrum of products. 1 According to a report of the Insurance Information Institute, 2 the total premium sales of insurance companies in the United States exceeded $500B comprising 2.7% of the gross domestic product in 2016. A considerable portion of the total premium production is typically realized through insurance agencies acting as an intermediary role between the company and the customer. For instance, around 55% of total premium sales in Turkey 3 were acquired through agencies during 2017, whereas the rest of the sales were realized through bank (38%) and company channels (7%). Due to this reason, management of policies defining the relationship and cooperation with the agencies could be considered a vital effort directly affecting the financial well-being of insurance companies.
Insurance companies may prefer conducting business over agency channels due to various reasons. In principle, the reason for cooperating with agencies arises from the employer's need for support of another person to accomplish work on behalf of himself or herself. 4 This scheme can place the company to a safer spot in the case of undesired situations such as customer dissatisfaction unlike when the insurance sale is performed directly by the company. Furthermore, a wide network of agencies spread out in the vicinity of customers can facilitate better insurance service delivery tailored according to the needs of the customers. 5 Such motivation for cooperation with agencies has led the focus of research to agency/company relationships as early as 1947. 6 Many aspects of working with agencies such as their commitment, 7 adaptability to the developing technology, 8 factors that drive their customer orientation, 9 and ethics 10 have been of interest.
Nevertheless, advantages of cooperating with agencies are also accompanied with a set of problems, which is considered to be a situation broadly summarized as the “agency dilemma,” 11 briefly put, the adoption of agencies is as profitable as the extent they can be controlled. As the primary interface between the company and the customers, agencies practice an essential intermediary role for clarifying otherwise quite formal language of insurance statutes. In this respect, agencies become even more powerful and can act independently complicating the case from the company's perspective. The problem with this business model is that it bears challenges to the company in the regulation of business decisions, 12 and causes companies to make suboptimal decisions. Agencies can act independently in a way that they execute their own decisions with respect to customer ownership and service models, leading to situations such as misselling as in the case of selling a product that does not match customer needs. Moreover, agencies can illegally or unethically manipulate the customer portfolio causing misinterpretation of the sales and customer data on the company side. Misleading customer portfolio information may lead insurance companies to devise incomplete solutions in supporting their agencies such as expert personnel assignment and training planning. The uncertainties and inaccuracies in the agency operations data complicate the assessment of the agency's profitability, and as a result, agency contract management strategies become less data-driven.
Much research has been done to investigate the applicable data-driven strategies for production maximization. As a former approach, Barone and Bella 13 demonstrate how customer segmentation based on price elasticity could be utilized as a decision support mechanism for price change management. However, Bolton and Myers 14 argue that as a customized application of price-based market segmentation methodology, price elasticity-based approach may not be practically applied to real-world cases due to the unreliability of customer response data, which could potentially be manipulated by the agencies. Common to these approaches is that they are based on insurance sector's intrinsic attributes such as premium production. Moreover, they evaluate agencies based on a single model despite the fact that insurance agencies could be differentiated on the basis of many perspectives.
We propose a novel segmentation-based agency evaluation methodology describing agencies with respect to three models, namely, utilization, response, and governance. The utilization model evaluates agencies based on the assumption that each insurance agency has a potential due to its location. The socioeconomic features of the location can facilitate the determination of a baseline or expected performance for a given agency. To our knowledge, the utilization model introduced in this study is novel in both the insurance industry and the literature. Second, the response model evaluates agencies based on the extent to which they are in sync with the company in terms of monthly customer premium production trend. The response of an agency could be considered an indicator of how well they are in line with the strategies of the company. And finally, the governance model measures the correlation of a given agency's monthly premium production to that of the insurance company. Our proposed agency segmentation methodology consolidates these three models, and assigns each agency to a category that can readily be utilized in an agency management decision support system.
We assert that understanding independent agency network dynamics is crucial to the success of asset management of insurance companies. As a promising way of achieving this goal, we suggest a segmentation solution based on behavioral attributes of agencies calculated based on these three models. In other words, our research question is whether the assessment of independent insurance agencies with respect to utilization, response, and governance dimension will support evaluation and decision-making of contract management. Groupings of agencies in the behavioral attribute space can and will lead to development of actions (e.g., cancel/renew contract, deepen the relationship) tailored according to what part of the space agencies are positioned.
The validation of our proposed models' effectiveness comprises a two-phase analytic study based on a rich data set provided by a nationwide insurance company. In the first step, we evaluate effectiveness of behavior models in the segmentation process. In the second phase, we report a year-long case study conducted with the insurance company providing the data followed by a period of actual implementation of our model in the production environment of the company. We report how they adapted our approach in their business management models, and the success they achieved during the course of the study. We further demonstrate an example application of our proposed model as a decision support mechanism via a prototype software, namely AgenSeg, that we implemented for validation purposes. AgenSeg visualizes all agencies and their performance indicators on a map along with a tool set enabling exploratory analysis by viewing agency segments with respect to various data filters.
Despite the fact that independent insurance agency evaluation is acknowledged as a prominent analytic problem by the insurance industry, efforts reported in the literature are rather dedicated to direct company/customer relationship ignoring the existence of agencies that play an important intermediary role. From this vantage point, our study stands out as an example of a rare piece of research tackling the challenging agency segmentation problem in the insurance industry. What we observe in most of the existing studies is that they generally assume that companies have direct and reliable access to their customers' data while, unfortunately, neglecting that a significant part of the business is run through the agencies making the validity of the data questionable. In our work, we demonstrate that agencies could be evaluated with respect to their production potential and the extent they realize it (utilization), cooperative skills (responsiveness), and willingness to follow the company's strategies (governance). In doing so, agencies are evaluated based on the signals acquired through the integration of internal and external data resources that cannot be speculated or manipulated by agencies.
Background
Independent insurance agencies play an intermediary role in the customer/company relationship. This role could be so significant that agencies can independently devise and manage their own sale strategies and methodologies leading to high variations in the customer/company interaction at the individual level. 15 This situation brings a layer of abstraction and convenience to the insurance product sale from the company's perspective, however, at the expense of agency recruitment efforts and the challenge of the agency performance evaluation. Early agency performance evaluation and prediction approaches involved heuristics such as supervisory ratings, 16 commissions earned by the agency, 17 and lapse of policies and operating expenses. 18 Some of the performance prediction efforts even involved psychological studies revealing relationships between temperament characteristics of agencies and their efficiencies. 19
Most of the efforts for predicting agency evaluation seem to investigate attributes that are either intrinsic to business domain or basic features that could be derived from demographics. Schlechter et al. identify important demographic features that predict customer turnover occurring in an insurance company. 20 In addition, demographic attributes supported with internal business data are shown to be good predictors of customers' late payment behavior, 21 and customer retention in the life insurance sector. 22 Nevertheless, we argue that such approaches may lack reliability as they are mainly based on internal factors, which is contrary to the fact that tasks such as turnover prediction or performance evaluation also relate to external parameters, including macroeconomics, geographical opportunities or challenges, and sociocultural diversity. Kasturi 23 classifies nonfinancial performance indicators as internal (e.g., speed, morale, training) and external (e.g., number of policies, branches), however, from our standpoint, indicators in both classes should be considered internal parameters as they can be affected by and derived from the company's own business operations. We prefer to explain performance as the ratio of what has been produced to what could have been achieved. The former could be extracted from processed transactions, while the latter requires a completely independent and impartial assessment.
Part of the literature focusing on the analytical part of insurance processes commonly investigates the customer behavior rather than the agency actions.24–26 Yet a significant part of the insurance product sales and related services are retailed over independent agencies. As one of the rare examples, Cho and Ngai 27 predict the length of stay and the production performance of agencies based on their demographics and past production performance records. They introduce a practical integration of data mining techniques with the then-preferred Online Analytical Processing technology, and explain how this technical solution served as a decision support mechanism to senior managers. As a novel solution technique with less emphasis on the segmentation problem itself, we consider that their approach could be better suited to the task of making decision on the acceptance of new agencies. On the contrary, we propose an approach that could also be applied on the agencies that are still under contract so that actions can be taken for promotion or contract termination depending on the segment that they reside in. Furthermore, our layered segmentation approach can assist the decision makers in reasoning about why an agency has performed poorly.
Materials and Methods
Our segmentation methodology is a two-stage assessment of the agencies according to the process workflow and data resources as demonstrated in Figure 1. The first stage involves calculation of model scores and initial customer segmentation based on the calculated scores. At this stage, the evaluation model's features are calculated based on the internal production and external location- and city-based data followed by a clustering operation applied on each feature separately to generate subsegments. In the second stage, subsegments are consolidated into a combined agency evaluation model with which agencies could be described in terms of utilization, response, and governance model scores.

Methodology overview. Our methodology involves calculation of model scores with external (city-based macro, location-based POI) and internal (production) data. Model scores are then fed into a clustering operation to determine subsegments (e.g., low, medium, high) for each feature, which are then consolidated into a single segmentation model for agency evaluation. POI, point-of-interest.
Our feature calculation process benefits from external and internal data sets, where the former signals the possible capacity of a given agency based on independent external factors, while the latter is the production data produced during the various retailing processes. We further elaborate on the data sets and our segmentation methodology in the following subsections.
Data
A major insurance company in a The Organization for Economic Co-operation and Development (OECD) country donated internal production data [D1] pertaining to 2044 agencies covering the years 2015 and 2016. Comprising 127 million records, the data included agency profiles, insurance product information merchandised by agencies, and sales production logs, as detailed in Table 1. The data were delivered such that the addresses of the insurance agencies were geocoded and the insurer data were anonymized. Due to this reason, we consider that our study imposes minimal risk and prefer not to provide an IRB approval.
Production data [D1] comprising premium amounts, product details, offers, and customer and agency details
In addition to the production data obtained from the insurance company, we also utilized additional information from external sources to evaluate the effectiveness of agencies with respect to independent contributing factors, namely city-based macrodata [D2] and location-based, point-of-interest (POI) data [D3].
City-based macrodata comprised imports, exports, mortgaged residential sales, nonmortgage residential sales obtained from the Turkish Statistical Institute, 28 and summarized deposit balances and loan data acquired from the Banks Association of Turkey covering the years 2014–2016, 29 as explained in Table 2.
City-based macrodata [D2] description
The location-based external data include points of social and economic interest obtained from a commercial data provider. We organized the POI data into 12 categories, as shown in Table 3. For each agency, we calculate 12 distinct scores corresponding to 12 POI categories by determining the number of POIs located within 1 km radius of the location of the agency (Fig. 2).

Surrounding POI information as input to the agency evaluation process. POI count from each of the 12 categories inside 1 km radius of a given agency is converted into a score.
Point-of-interest categories [D3]
POIs are categorized into 12 groups.
POI, point-of-interest.
Agency model scores
We introduce an agency evaluation methodology where we determine and aggregate subsegments of agencies based on agency model scores. Model scores can explain the dynamics of agency behavior from three perspectives, namely, utilization, response, and governance. Each agency is assessed based on these metrics at the product-type level, and then, the product-level scores are aggregated into three final scores. Generic to all metric types, this aggregation is a weighted average calculation based on each product's share in the overall production of the company.
Utilization
Utilization measures the capability of an agency to convert its location-based potential to insurance premium acquisition. For example, an insurance agency located in a neighborhood in which companies with high turnover are located could be expected to acquire more production. Utilization score for a given agency is evaluated by comparing the actual and estimated premiums or policy counts calculated with respect to a regression model trained with the data of all agencies. Given an agency i, the input variables (xij) to this regression model comprise city-level external data (15 input variables) [D2], and agency-based POI category data (12 input variables) [D3], summing up to 27 input variables. The output variables (yik) of the regression model comprise total premium production, total commission, and total number of policies for each of the 15 product categories, resulting in 45 output variables.
For each output variable yik where

Agency utilization score (Ui) calculation model. For each of the dependent variable, a decision tree regression model is trained with all of the independent variables resulting in 45 regression models. Potential product-wise measures for a given agent (
The utilization score of agency i for product type k (uik) is calculated as the ratio of the realization of the output variable to the calculated potential.
The utilization score of an agency (ui) is calculated by taking the weighted average of product-based utilization scores,
where wk corresponds to the ratio of product k's premium production to the total premium production of the insurance company.
The decision tree regression model has been implemented by using the Scikit-learn library. 31 Mean squared error was used as the split criterion, and no pruning was performed at any level (i.e., all nodes were expanded until all leaves were pure).
Response
The response score measures how closely an agency follows the company in terms of the product-wise premium production trend calculated over the data horizon. For each agency i and for each product group k, we calculate a signal vector sik whose values represent the trend change in premium production on a monthly basis. For instance, for a given insurance product and a 36-month period, we have generated a 1 × 35 vector of values −1, 0, and +1 indicating decreasing, unchanging, and increasing premium production, respectively (Table 4). Likewise, we calculate a signal vector tk for each product group of the insurance company.
Response signals indicating trend change in the premium production on a monthly basis
The response score rik of agency i for product group k is the Pearson correlation coefficients between the signal vectors sik and tk. The response score of agency i (ri) is the weighted average of product-based response scores,
where wk corresponds to the ratio of product k's premium production to total premium production of the company. Please refer to Figure 4 for exemplary response signal vectors of two hypothetical insurance agencies whose premium production trends are compared to that of the company.

Premium production trends and response score. Example premium production trends of two agencies A and B are illustrated. Response score is high for agencies whose trends are highly correlated with that of the company.
Governance
The governance score explains how closely an agency follows the company in terms of monthly premium production. Let pik be the vector of monthly premium production of agency i for product group k, and qk be the monthly premium production vector of company for product group k. Then the governance score gik of agency i for product group k is the Pearson correlation coefficient of vectors pik and qk. Then the governance score gi of agency i is
where wk is the ratio of product group k's premium production to total premium production of the company.
We argue that these three behavioral features could be reliable indicators of the value of agency from the company's perspective. Apart from being mere calculations, they imply the extent to which the agencies follow the strategies of the company. For example, response and governance scores explain the relationship between cooperation and intentions of a given agency and those of the company. Similarity (or dissimilarity) of product-wise sale distributions and trends can be perceived as an indicator of cooperative tendencies. On the contrary, utilization score could be considered the realized potential of an agency grounded on the external facts.
Segmentation process
In the first stage of our evaluation methodology, we apply segmentation operations on the model scores. Since model scores form one-dimensional data vectors, we applied the maximum absolute distance approach to locate the local minima of the densities of the scores and split the distribution into three intervals (i.e., clusters). For the sake of simplicity, we name these subsegments low, medium, and high for the utilization model, and negative, weak positive (weak+), and strong positive (strong+) for the response and governance models. Based on the comparison of model scores and interval border values, each agency is evaluated to be in a subsegment for each of the three models. For instance, an agency could be in the low and weak+ segments of utilization and response score distributions, respectively (Fig. 1).
The second stage of our evaluation methodology involves more heuristic efforts rather than statistical approaches. Based on the subsegments generated in the first stage, we form an evaluation cube in which each agency could be positioned. After such positioning, subject matter experts could evaluate regions of interest in this cube and provide decision support. Instead of a heuristic approach, categorical value clustering operations such as hierarchical agglomerative clustering could also be considered at this segmentation stage, however, in this study, our aim is to demonstrate the effectiveness of behavioral model scores in segmentation and evaluation operations rather than providing a prescription of full-fledged analytic design.
Analysis and Results
To evaluate performance of our proposed segmentation metrics, we conducted a longitudinal case study with the insurance company providing the data. Our case study comprised two phases: (1) preliminary analysis phase and (2) application of segmentation metrics to real business management environment. In the first phase, we analyze general characteristics of the behavioral models. The second phase describes a longitudinal case study conducted with the company in which our segmentation metrics were utilized.
Preliminary analysis phase
In the first phase of our validation methodology, we describe the general statistical properties of the behavioral feature scores and how well behavioral feature scores are able to discriminate agencies by applying the principal component analysis (PCA) approach. Finally, we demonstrate and reflect on the production shares of each subsegment.
Figure 5 illustrates the cumulative density functions of the utilization, responsiveness, and governance scores for the year 2016. The noticeable steepness of normalized utilization score (Fig. 5A) shows that most of the agencies were close to median implying, in general, they were able to generate as much production as they should be able to, based on our utilization model. Representing a more normal distribution, Figure 5B shows that 20% of the agencies were acting independently in following the company's strategies, while only less than 10% adopted strategies closer to that of the company's. Similarly, as can be seen in Figure 5C, less than 30% of the agencies' production trends are not correlated with the overall production of the company, whereas 20% of the agencies had premium production trends that are correlated with the overall production. For the correlation analyses of product-wise utilization, responsiveness, and governance scores, please refer to Tables 2–4 in the Supplementary Appendix S1 of our article.
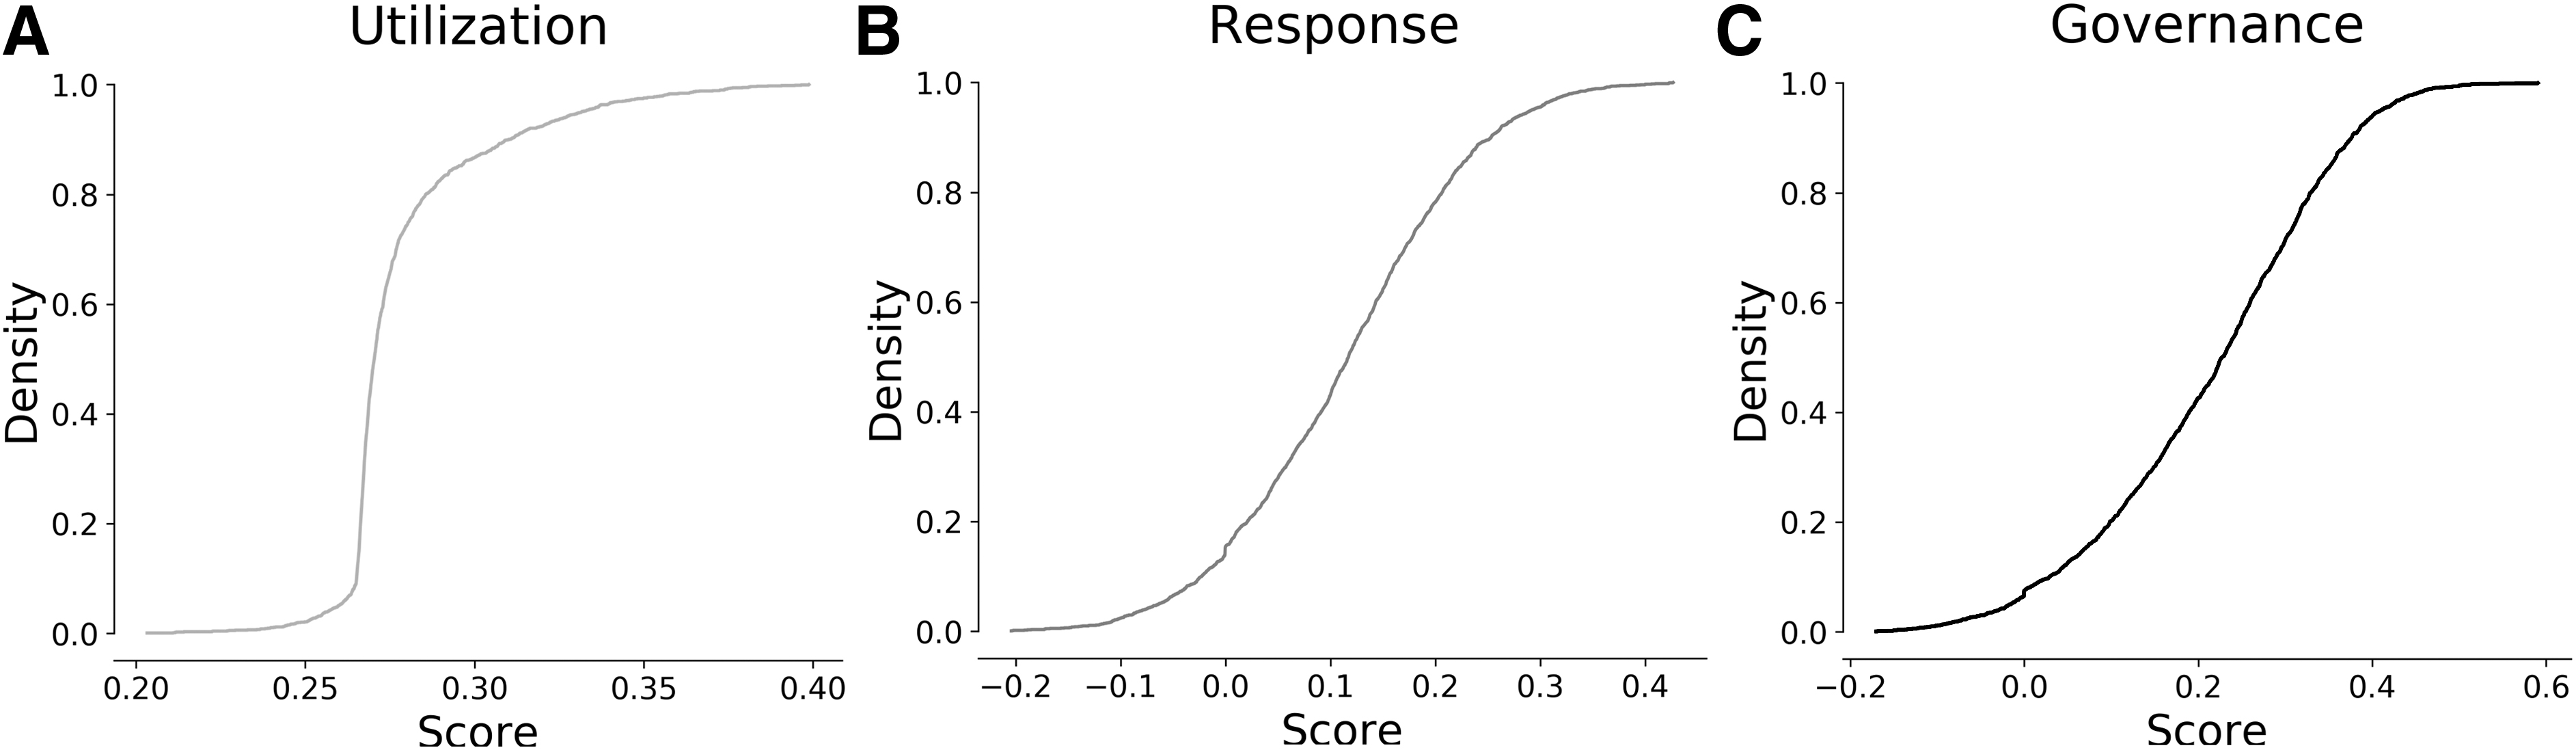
Cumulative density functions (CDF) of behavioral model scores.
Histograms of the behavioral feature scores are shown in Figure 6A–C. Used as delimiters of the subsegments, the density break lines are also plotted as vertical solid lines on the histograms. Since the feature score data are one-dimensional, we calculated density break lines based on the maximum absolute distances between the feature score values. The subsegment names and rules are listed in Table 5. In Figure 6D, product-based utilization scores are plotted based on the two-most significant dimensions, which are determined as a result of applying PCA. 32 As can be seen in the figure, PCA reveals observable clusters of agencies with respect to utilization scores.
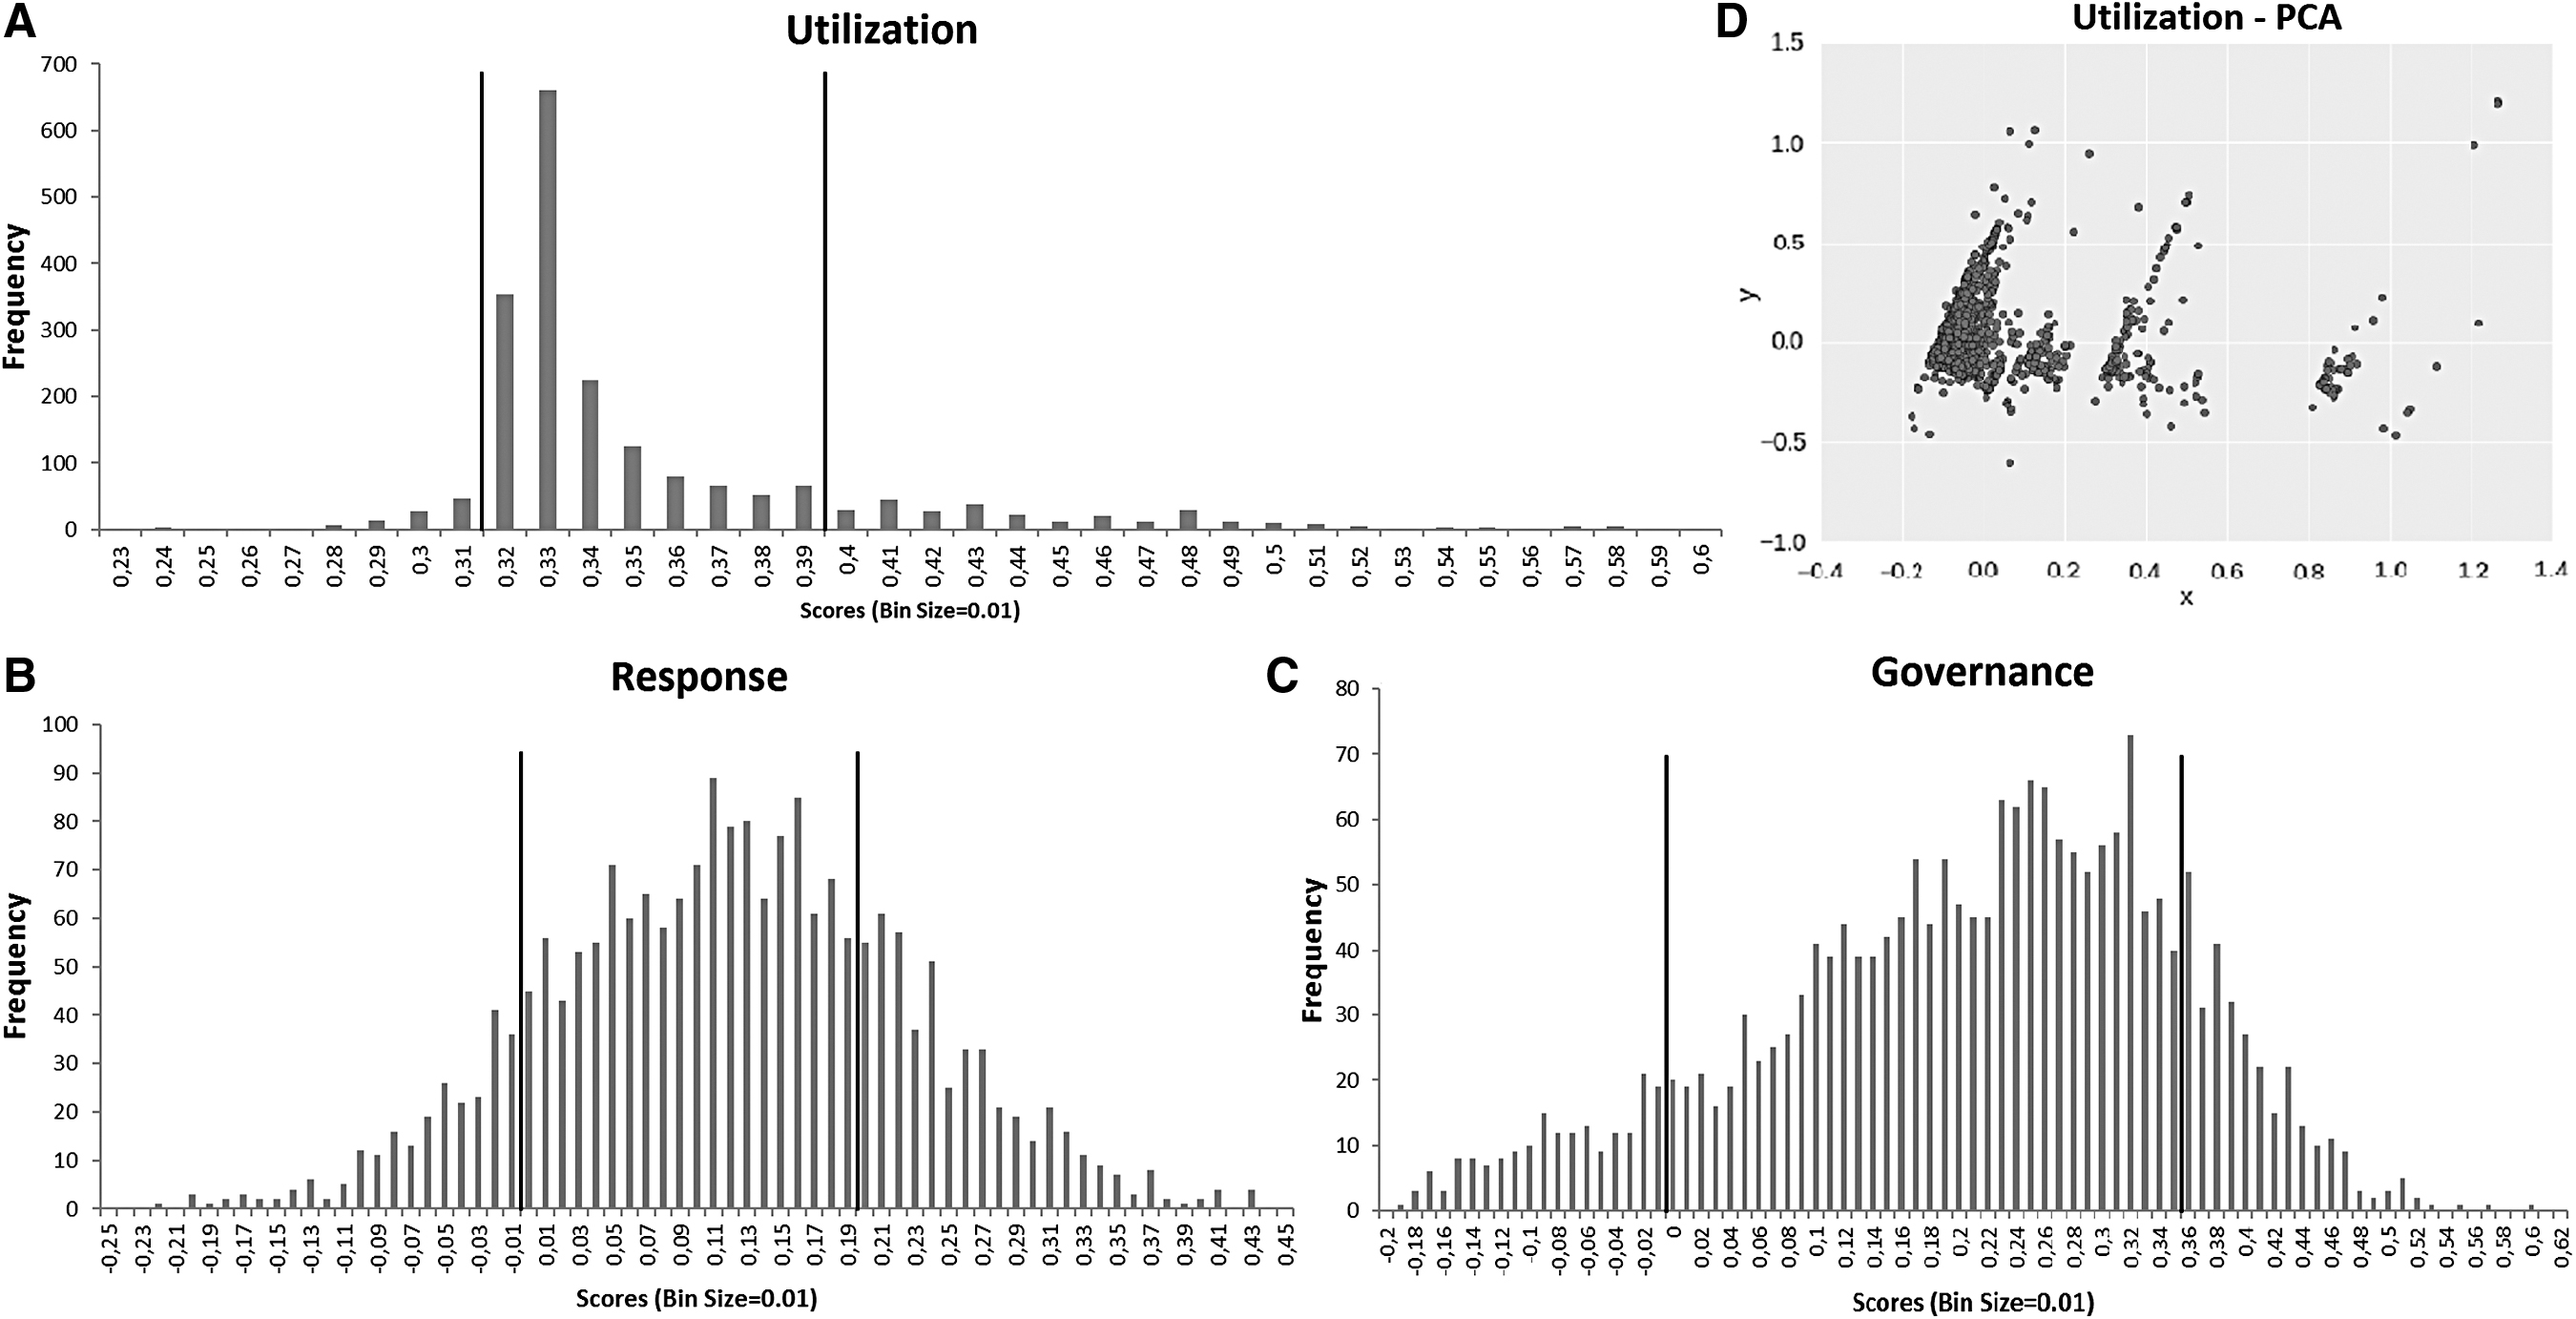
Histograms of behavioral feature scores and density breaks for segmentation
Subsegments are determined based on the density break lines
S denotes score for a given feature.
Aggregated premium production shares of independent agencies in each subsegment are shown in Figure 7. Based on the premium production share distribution, we state that response and governance dimensions can successfully discriminate the agencies based on their profitability. In particular, the negative levels of each dimension clearly distinguish the agencies with low productions. Surprisingly, utilization segments do not seem to discriminate the agencies from a production share perspective. Contrarily, production shares and utilization scores have an inversely correlated relationship. We further elaborate this point in the next subsection.
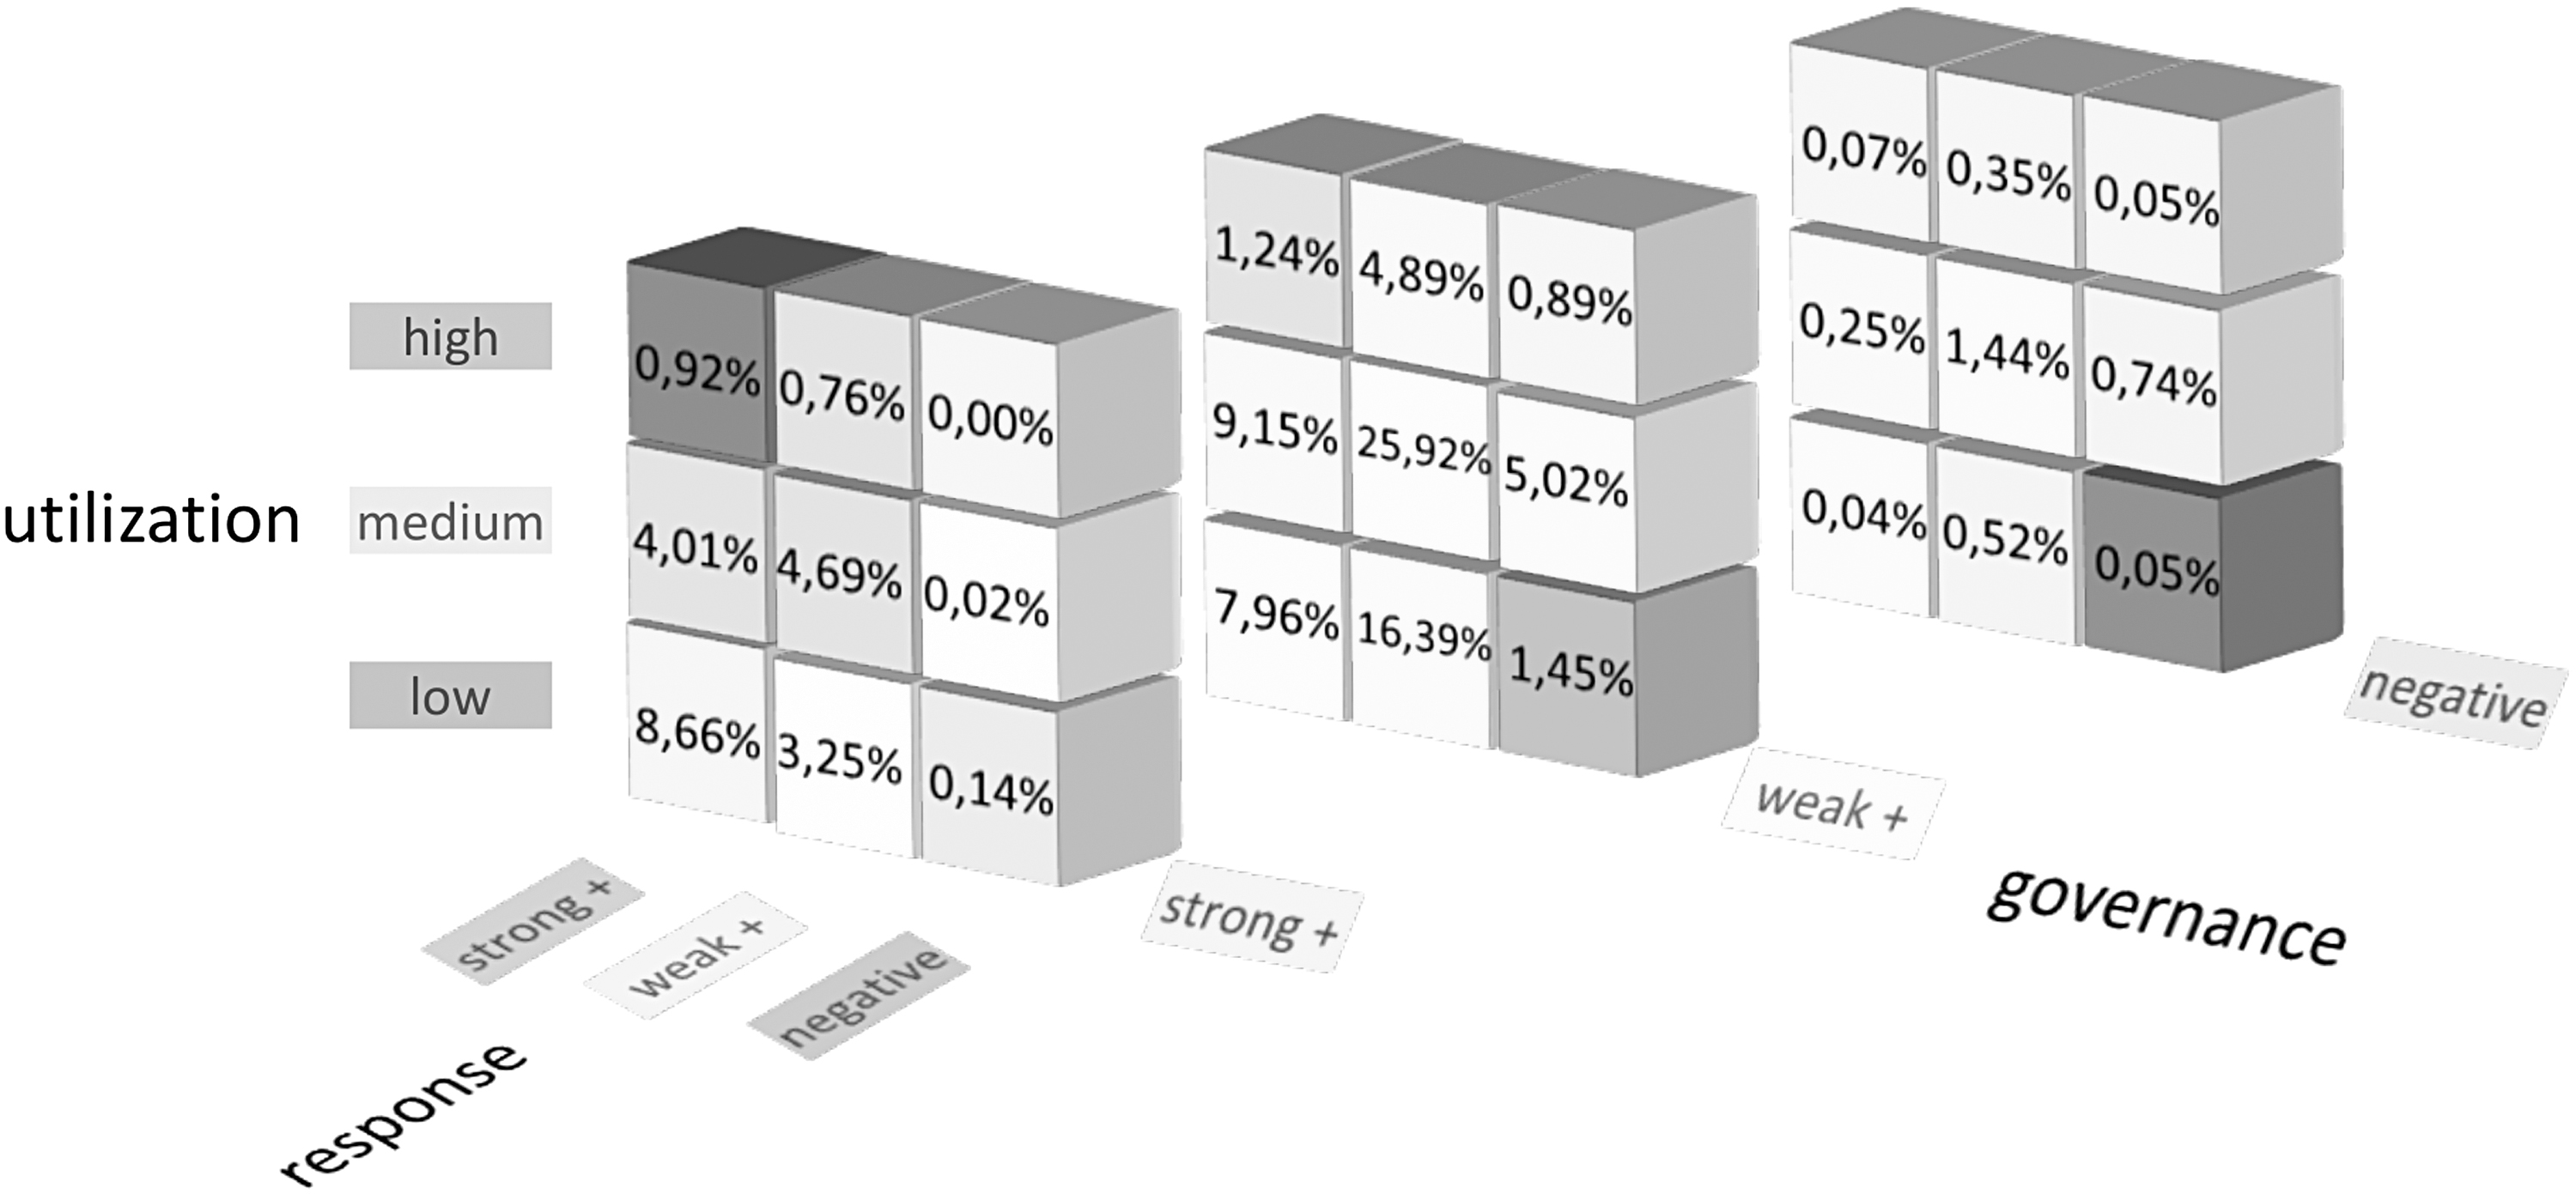
Aggregated premium production shares of independent agencies. Total premium production shares (in percentage) of all agencies falling into the same segment are shown in the figure.
Application of behavioral metrics to business management processes
A proper example for the validation of the usefulness of the behavioral features would constitute a pilot study where our proposed segmentation models are directly applied to actual business management. Such study would aim to compare the business outcomes produced before and after the integration of behavioral metrics to the business management processes. Nevertheless, the insurance company decided the adaptation of our proposed approach to their own segmentation models as a validation or monitoring mechanism. In doing so, they developed a new segmentation model distinguishing agencies based on their nonauto premium production and campaign success. They further developed an analytic framework to evaluate agencies according to their response to strategic decisions made by the company.
In our preliminary analyses, we implemented response and governance scores merely based on premium production amounts and production trends. This was due to the fact that we were provided with only the production data of the agencies, however, other signals could also be considered to better determine the extent to which agencies follow strategies of the company. In this regard, the insurance company officials modeled numerous variants of response and governance features based on agency behaviors such as production target realization performance, gained commission rate, profitability, campaign offer frequencies, and success rates. With these response and governance scores, they took necessary actions to anticipate possible failures of agencies in fulfilling their production goals. Such actions comprise various business decisions such as cancellation of contract renewal, undertaking for higher commission in case of realization of better success, and resource planning for consultancy, education, and other fringe benefits.
Our utilization model was not directly used as an evaluation criterion. The company's officials stated that the location disadvantage seems not to be a daunting problem for the agencies as they can frequently make contact with their customers over electronic channels. The officials also acknowledged that macroeconomic factors that highly vary across provinces might also provide a clue about the level of production that should be expected from the agencies, however, such factors could introduce high noise to the relatively weak signals in the data. Ultimately, they have to generate crisply defined segments, rather than coarse analyses, to be able to take action for increased profitability. Utilization score could provide insights about the capacity of the agencies, however, it was considered rather unsafe to directly use it in the analytic models.
Behavioral metrics in decision support tools
We developed a prototype decision support tool, namely AgenSeg, that visualizes segmentation data of agencies. The support tool plots the agencies on a map such that each agency's tool tip visual elements are color encoded with respect to their current segmentation information (Fig. 8). Upon hovering on an agency glyph, detailed segment and production information is displayed. Basic information filtering mechanisms that could be applied on agency features are also supported. AgenSeg is a visual analytics web application developed mainly with JavaScript programming language. The geographical plots and filtering widgets are developed with leaflet.js 33 library, whereas Open Street Maps 34 were used as the tile server.
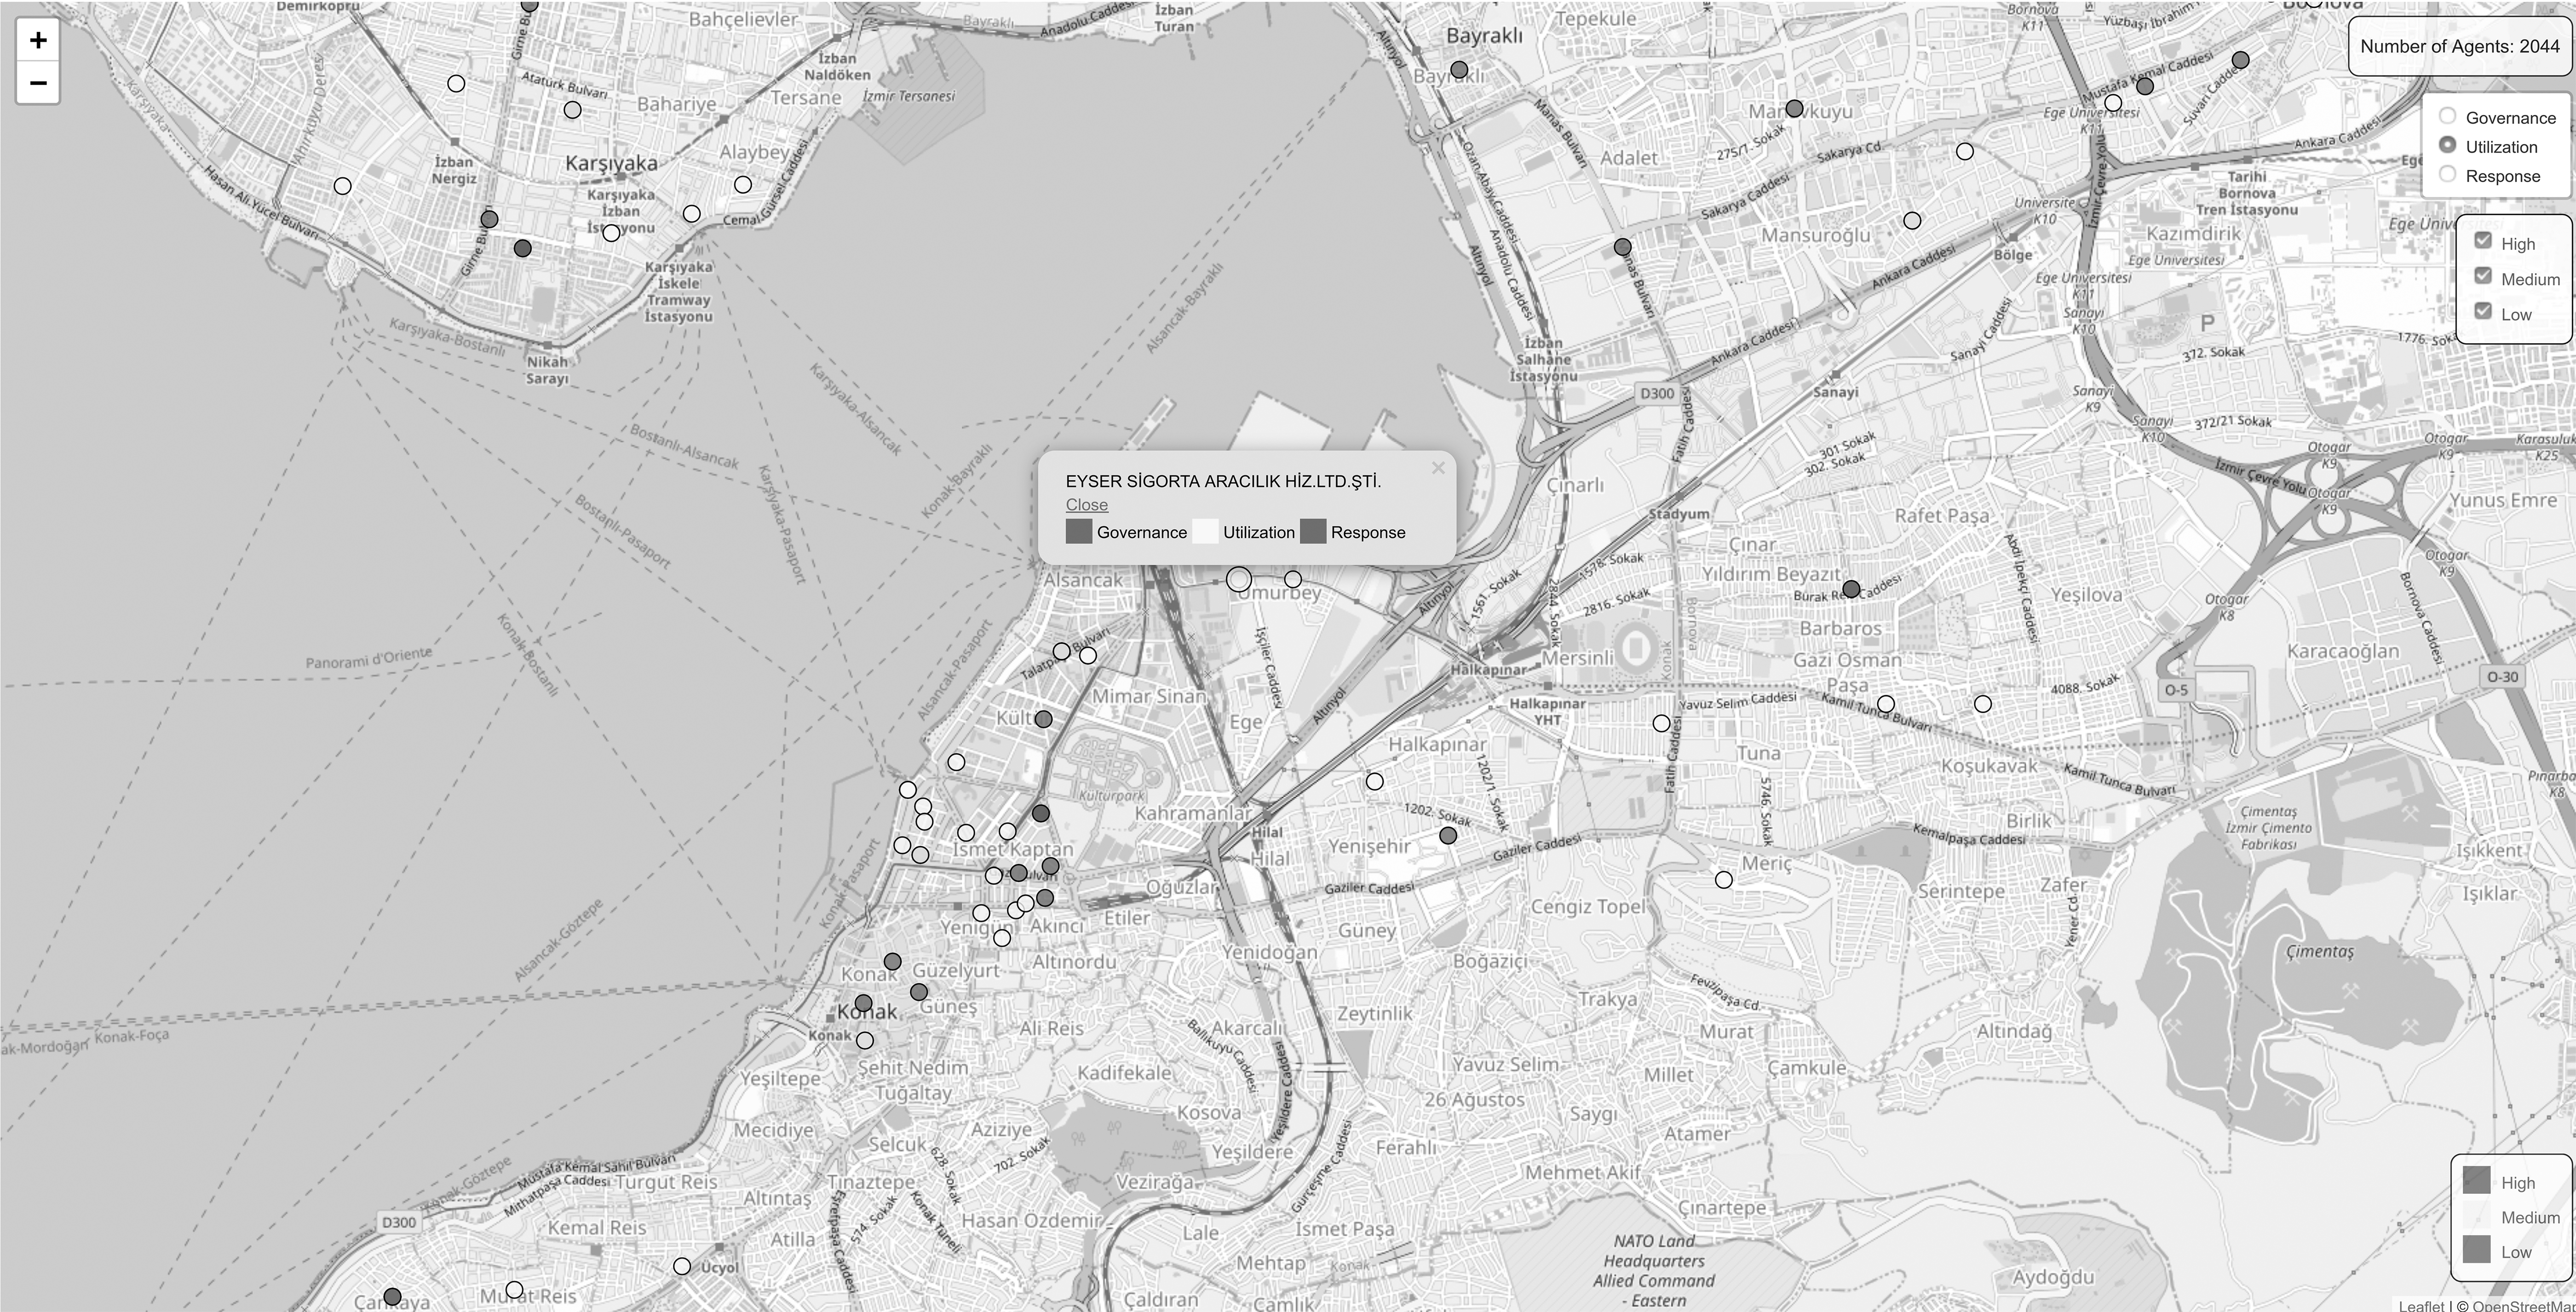
AgenSeg. A prototype decision support tool for segmentation data visualization.
An overall data and workflow diagram for our proposed decision support mechanism is depicted in Figure 9. Agency score and segmentation data visualized by AgenSeg are produced by a routine analytical task that runs with a predefined frequency. AgenSeg is an exploratory visual analytics tool allowing a high level of interactivity with the user, and hence, such analysis sessions typically produce decisions, insights, research questions, and hypotheses that support decision-making processes. As is well known, decision-making processes directly effect the business operations and managements that lead to generation of further production data potentially reflecting results of recent decision changes. Analysis sessions can also bear new ideas on how to improve existing analytical models or suggest tuning for several analytic parameters.
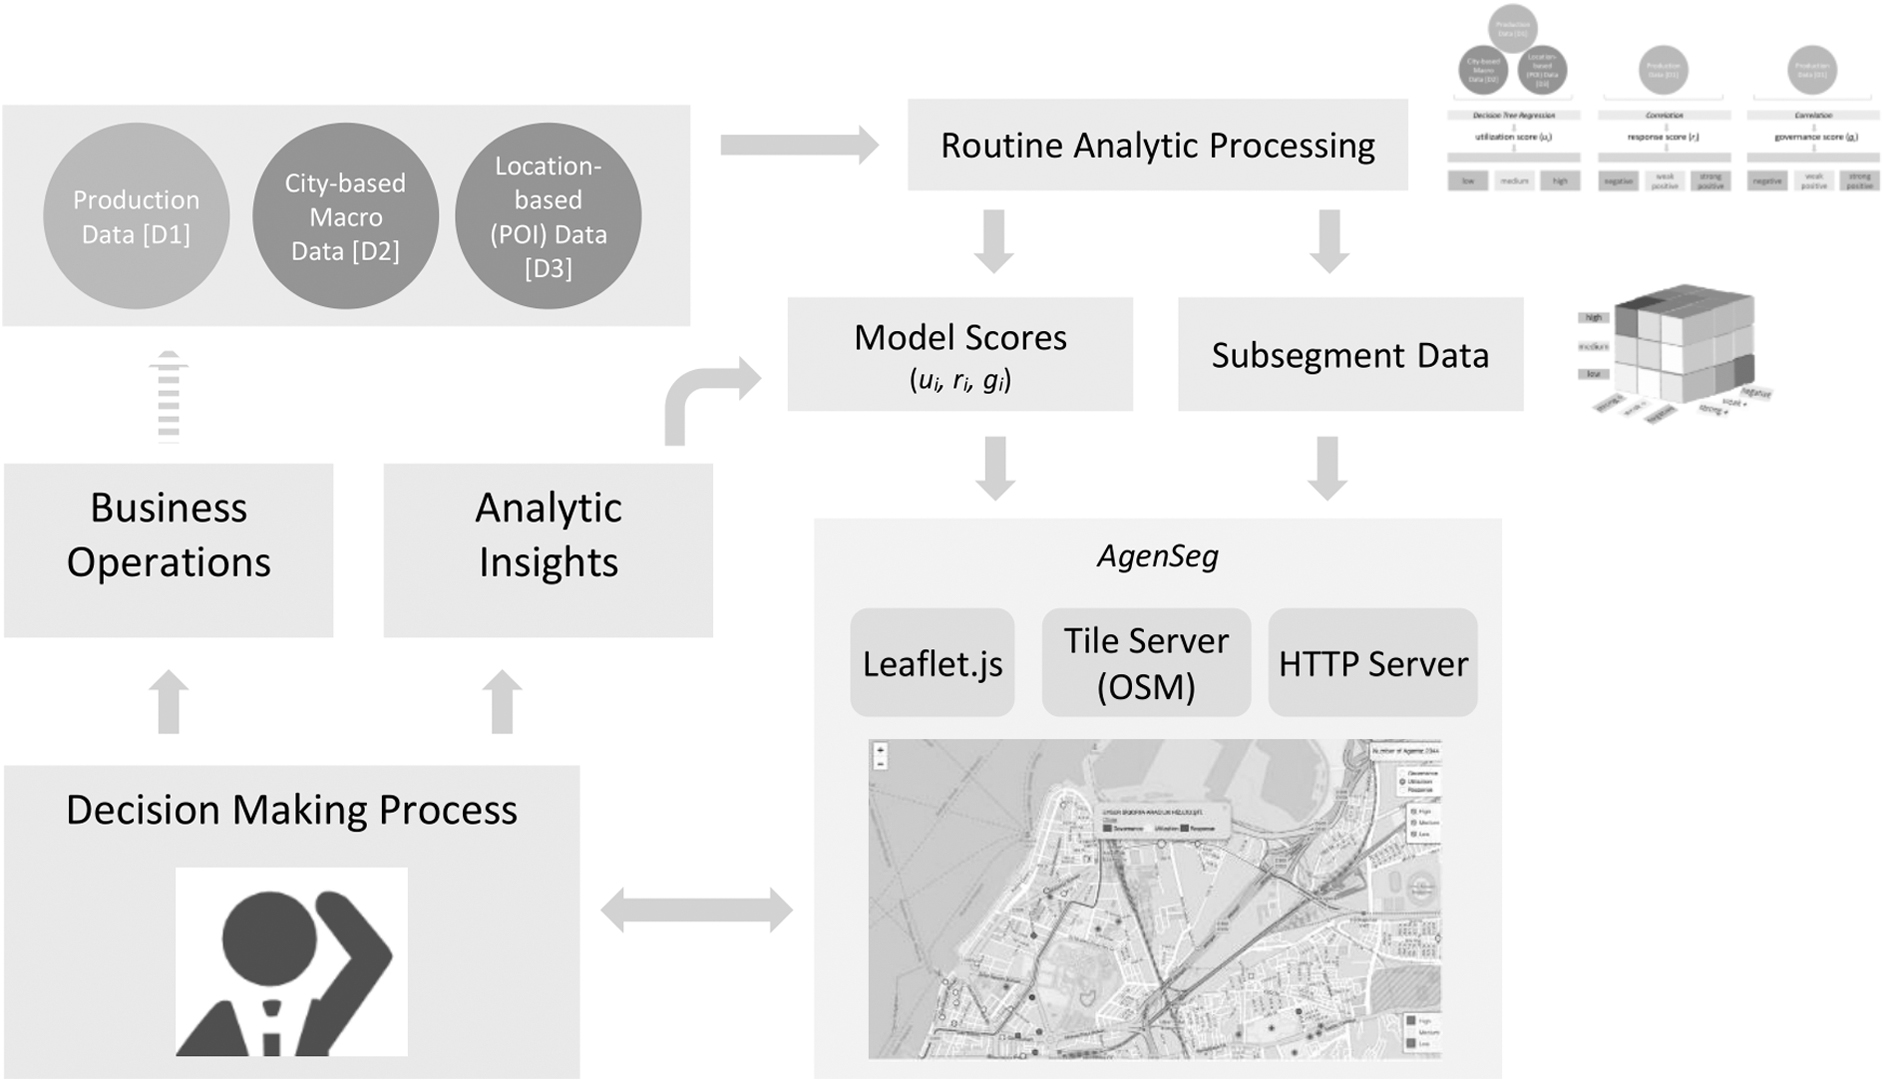
Overall decision support cycle. A very broad decision support workflow is depicted. A daily routine system task is run to update the model scores and subsegment data, which is in turn consumed by AgenSeg. As a visual analytics tool, AgenSeg supports exploratory data analysis with a high level of interactivity. Typical outcomes of such exploration of data are decisions, insights, research questions, and hypotheses, which are fed into business operation life cycles that yield more production data. Decision-making processes often imply other insights that could be attributed as analytic model improvement opportunity.
Based on an expert review 35 that we gathered from two agency channel analysts, we extracted various insights that could inform decision support tool designs for agency management operations.
As supported by the analyst's expert review, geographical plot of agencies along with their segment data could facilitate an overview of company's success in terms of managing and utilizing agencies. By focusing on the segments, patterns associated with location data could visually be discovered and can assist decision makers in forestalling relevant actions. Segments can also be updated or recalculated based on visual selection of regions of interest to perform breakdown analysis.
On-site visits to agencies play an important role in retention of productive agencies and sustain their loyalty to the company. Regardless of location or segment information, such visits are typically performed based on the discretion of the visiting company employee, which could lead to undesirable outcomes due to suboptimal agency choices or unbalanced number of visits. Our prototype tool could assist them in making appropriate choices based on the segmentation and visit frequency information, and route planning.
Behavioral metrics as reusable components
We conducted a brief semistructured focus group study 36 with the company officials on the reusability of behavior-based agency models. Focus group study was conducted as two 75-minute-long sessions with three participants in an office setting in the company. Two of the participants were agency channel manager and analyst while one another participant was a technical lead in analytical applications divisions. We collected insights and information by taking notes and voice recording.
The result of the focus group study revealed that segmentation and evaluation approaches based on utilization, response, and governance models could be used by almost all insurance companies and adapted to other channels such as insurance brokers and financial institutions. Similarly, many other business venues in which agencies or retailers are widely utilized (such as in furniture or home appliance sectors) could benefit from these models. However, it should be noted that the success of behavioral models is highly dependent on the assumption that agencies or retailers are independent. Otherwise, model scores would be misleading as the premium production data would be correlated, at least to some extent, with that of the company.
The company officials further emphasized the vitality of the business capability to measure the extent to which agencies follow the company's decisions and actions. In general, business management could be realized truly only when the agencies could be directed to perform in a way desired by the company. In this regard, response and governance behavioral models could be conveniently utilized to quantify the loyalty and cooperativeness levels of the agencies. Such a score-based evaluation approach can complement decision-making processes such as loyalty program management, or on-site visits.
Discussion and Conclusion
In this article, we introduce an analytic approach to segment and evaluate independent insurance agencies where we utilize three models describing agency behavior. As the first model, utilization measures how well an agency takes advantage of its location to improve its premium production. POI in a well-defined hinterland and city-based macroeconomic data are used to assess this performance metric. Second, the response model acts as an indicator of the extent to which an agency follows the insurance company's business decisions and strategies. Monthly premium production trends are adopted to calculate a response score for each agency. Finally, the governance model explains how agencies' premium production performance relates to that of the insurance company. Based on the scores calculated from these three models, we determine three subsegments for each model so that each agency can be positioned in a three-dimensional segment space according to its model scores.
We claim that the behavioral model scores could be used in agency segmentation processes as well as agency evaluation. We validate our claim with a preliminary segmentation analysis and a year-long case study with a nationwide insurance company. Our preliminary analyses revealed that the behavioral models can significantly discriminate agency segments. During the longitudinal case study, we could observe the effectiveness of response and governance features in agency evaluation, and we reflect on the adaptation of these features to real-world business rules. Moreover, we developed a prototype visual analytics decision support system, named AgenSeg, in which agencies are plotted on a map along with their model score information. We briefly report the results of a limited expert review study performed using this tool to provide insights for the design of such decision support systems.
Our analyses and case study showed that all of the three behavioral models can successfully be used in agency segmentation processes. On the contrary, for evaluation purposes, we observed that the response and governance models could easily be adapted to real business management, while the utilization model was not directly included in the evaluation models. Our further investigations indicated that the utilization model should be used carefully as the disadvantage of geographical location could be overcome by making use of electronic channels. However, it should be noted that the behavioral models could surely be adopted differently in a different business setting; due to this reason, we state that the findings of this study should be considered carefully while applying them in other business contexts.
Our study stands as a starting point for various research directions. As an extension to our behavioral models, for instance, another dimension to measure the engagement level of an agency with the company could be incorporated with negligible amount of effort. To explore the potential of this interesting phenomenon, in the future we plan to build a consolidated model that will capture the extent to which agencies are connected with the company in terms of such concepts as communication, interaction, and reaction. Quantification of these concepts could be realized with various types of data generated during the agency/company business operation such as user logs or system usage statistics. Prime and campaign production system usage frequency, graphical user interface interaction logs, damage claim and tracking system usage patterns, responsiveness to damage claims, and diversity of their communication channel preferences with the company of customers could be attributed as a small subset of many other possible attributes that could be extracted from business big data. Usefulness of several other variants of these attributes generated with various levels of time granularity (e.g., weekly, biweekly, monthly) also deserves an in-depth investigation. Such enrichment of the dimensions could be helpful in determination of more customized actions in agency management operations. However, this would increase the number of dimensions and lead to adoption of multivariate visual analytic methods (e.g., small multiples 37 ) for visual detection of clusters.
Our study stands as one of the rare examples focusing on the company/agency dynamics in the insurance business. Furthermore, as a novel approach, we incorporate external factors to the agency evaluation process, and provide a way to assess agencies in terms of three dimensions as a basis for further segmentation processes. Moreover, adding external factors such as location as a baseline for the performance indication facilitates fair and more reliable comparisons between agencies. And finally, the theoretical side of our behavioral models is intuitive and straightforward making our approach easy to implement and deploy not only in the insurance sector but also in other domains where agencies play a critical role such as retail commerce, automotive services, or advertisement. In this regard, we encourage conduct of similar research in different industries to shed light on the undiscovered agency phenomenon.
Footnotes
Acknowledgments
The authors thank the insurance company, which has chosen to remain anonymous, for the business know-how, ideas, and feedback during the study design and implementation. They also thank Hasan Alp Boz and Yasin Findik for the implementation of AgenSeg.
Authors' Contributions
Authors contributed to the article in the order they appear. E.K. and E.A. preprocessed and analyzed the data, built the models, and carried out evaluations. B.B. and S.B. acquired and interpreted the data, and directed the case study. All authors contributed to the design of the study, and were involved in idea generation, results discussion, and final drafting of the article.
Author Disclosure Statement
No competing financial interests exist.
Funding Information
No funding was received for this article.
Abbreviations Used
References
Supplementary Material
Please find the following supplemental material available below.
For Open Access articles published under a Creative Commons License, all supplemental material carries the same license as the article it is associated with.
For non-Open Access articles published, all supplemental material carries a non-exclusive license, and permission requests for re-use of supplemental material or any part of supplemental material shall be sent directly to the copyright owner as specified in the copyright notice associated with the article.