




Abstract
Diagnosis prediction is an important predictive task in health care that aims to predict the patient future diagnosis based on their historical medical records. A crucial requirement for this task is to effectively model the high-dimensional, noisy, and temporal electronic health record (EHR) data. Existing studies fulfill this requirement by applying recurrent neural networks with attention mechanisms, but facing data insufficiency and noise problem. Recently, more accurate and robust medical knowledge-guided methods have been proposed and have achieved superior performance. These methods inject the knowledge from a graph structure medical ontology into deep models via attention mechanisms to provide supplementary information of the input data. However, these methods only partially leverage the knowledge graph and neglect the global structure information, which is an important feature. To address this problem, we propose an end-to-end robust solution, namely Graph Neural Network-Based Diagnosis Prediction (GNDP). First, we propose to utilize the medical knowledge graph as an internal information of a patient by constructing sequential patient graphs. These graphs not only carry the historical information from the EHR but also infuse with domain knowledge. Then we design a robust diagnosis prediction model based on a spatial-temporal graph convolutional network. The proposed model extracts meaningful features from sequential graph EHR data effectively through multiple spatial-temporal graph convolution units to generate robust patients' representations for accurate diagnosis predictions. We evaluate the performance of GNDP against a set of state-of-the-art methods on two real-world medical data sets, the results demonstrate that our methods can achieve a better utilization of knowledge graph and improve the accuracy on diagnosis prediction tasks.
Introduction
The accumulation of patients' electronic health record (EHR) or electronic medical record data lays a solid foundation for applying machine learning approaches in medical domain, thus enabling the possibility of clinical predictive tasks. 1 Such predictive tasks aim to predict an individual's future health status to improve the quality of personalized health care. Diagnosis prediction, which predicts patients' future diagnosis based on their historical EHR data, is one of the most popular yet complex tasks in the research community. On one hand, diagnosis prediction may possibly contribute to clinical anticipation and precision diagnosis. 2 On the other hand, the high dimensionality, temporal nature, and noisy of EHR data bring challenges to traditional machine learning methods.3,4
In recent years, the emerging deep learning techniques attract considerable attention to researches and have been widely applied in various domains, including computer vision, 5 natural language processing, 6 and clinical predictions. 7 Different from traditional machine learning models that require a manual feature engineering procedure by domain experts, deep learning models learn the data representation or the task-related features automatically and effectively from the source data. With proper objective function and sufficient quality data, deep models can possibly achieve superior performance than traditional models in various tasks. Recurrent neural networks (RNNs), which are a catalog of remarkable deep models, have been broadly applied to clinical prediction tasks.2,8–11 The literatures indicate that RNNs have an outstanding ability to model sequential relationships, thus achieving impressive success in EHR-related tasks. However, it also has been discussed that deep models are vulnerable to data insufficiency and noise, which are regularly existing in EHR.11,12 Moreover, RNNs cannot handle long sequences effectively. 10 Therefore, the challenge in diagnosis prediction tasks cannot be tackled by utilizing deep models solely.
To address the aforementioned problem, researchers propose knowledge-guided clinical predictive methods that incorporate domain knowledge into deep models.9,11–13 These methods make use of the strong sequential modeling ability of RNNs to learn the patients' representations from EHR data while injecting supplementary information into the model to alleviate data insufficiency and noise. The information is either extracted from a medical ontology or the medical relations within EHR. Graph-based Attention Model (GRAM) 12 adopts RNNs to model EHR data and utilizes a medical ontology as a knowledge graph to provide supplementary information in the training stage via a graph-attention mechanism. Knowledge-based Attention Model (KAME) 11 further exploits the knowledge in the predicting stage of a deep model and brings out a state-of-the-art (SOTA) performance in diagnosis prediction tasks. Co-attention memory networks for diagnosis prediction (CAMP) 13 applies augmented RNN-based models with a knowledge graph to enhance the prediction accuracy. These works indicate that the utilization of the medical knowledge graph will improve the model's robustness against data insufficiency and noise effectively, thus benefiting the prediction performance. In medical ontologies (i.e., International Classification of Diseases * [ICD], Clinical Classifications Software † [CCS]), the medical events (i.e., diagnosis, medications, and procedures) are encoded following a hierarchical structure and in parent–child relationships, which is a graph naturally. Regardless of the success, the above studies only partially make use of the information derived from knowledge graphs (i.e., medical codes co-occurrence and parent–child relationships), yet unable to capture the graph structure features that may be equally important. Furthermore, these studies exploit the medical knowledge from ontologies as external information separated from EHR data, which may introduce extra noise when training the deep model.
This article proposes a knowledge-guided predictive method, namely the Graph Neural Network-Based Diagnosis Prediction (GNDP), to perform accurate diagnosis prediction by fully exploiting the medical knowledge. Different from existing methods that adopt RNNs and attention mechanisms, the proposed GNDP is developed based on the framework of the spatial-temporal graph convolutional network (ST-GCN). 14 Moreover, we propose to reconstruct patients' EHR in the spatial-temporal graph format, which naturally infuses medical knowledge into data and converts it to internal information. Figures 1 and 2 show toy examples of the input structure for the existing method and the proposed method. With the unified framework and graph format input, GNDP can leverage the sequential information from EHR and domain knowledge from medical ontologies simultaneously to learn more robust and accurate patients' representations and perform more accurate predictions in diagnosis prediction tasks.
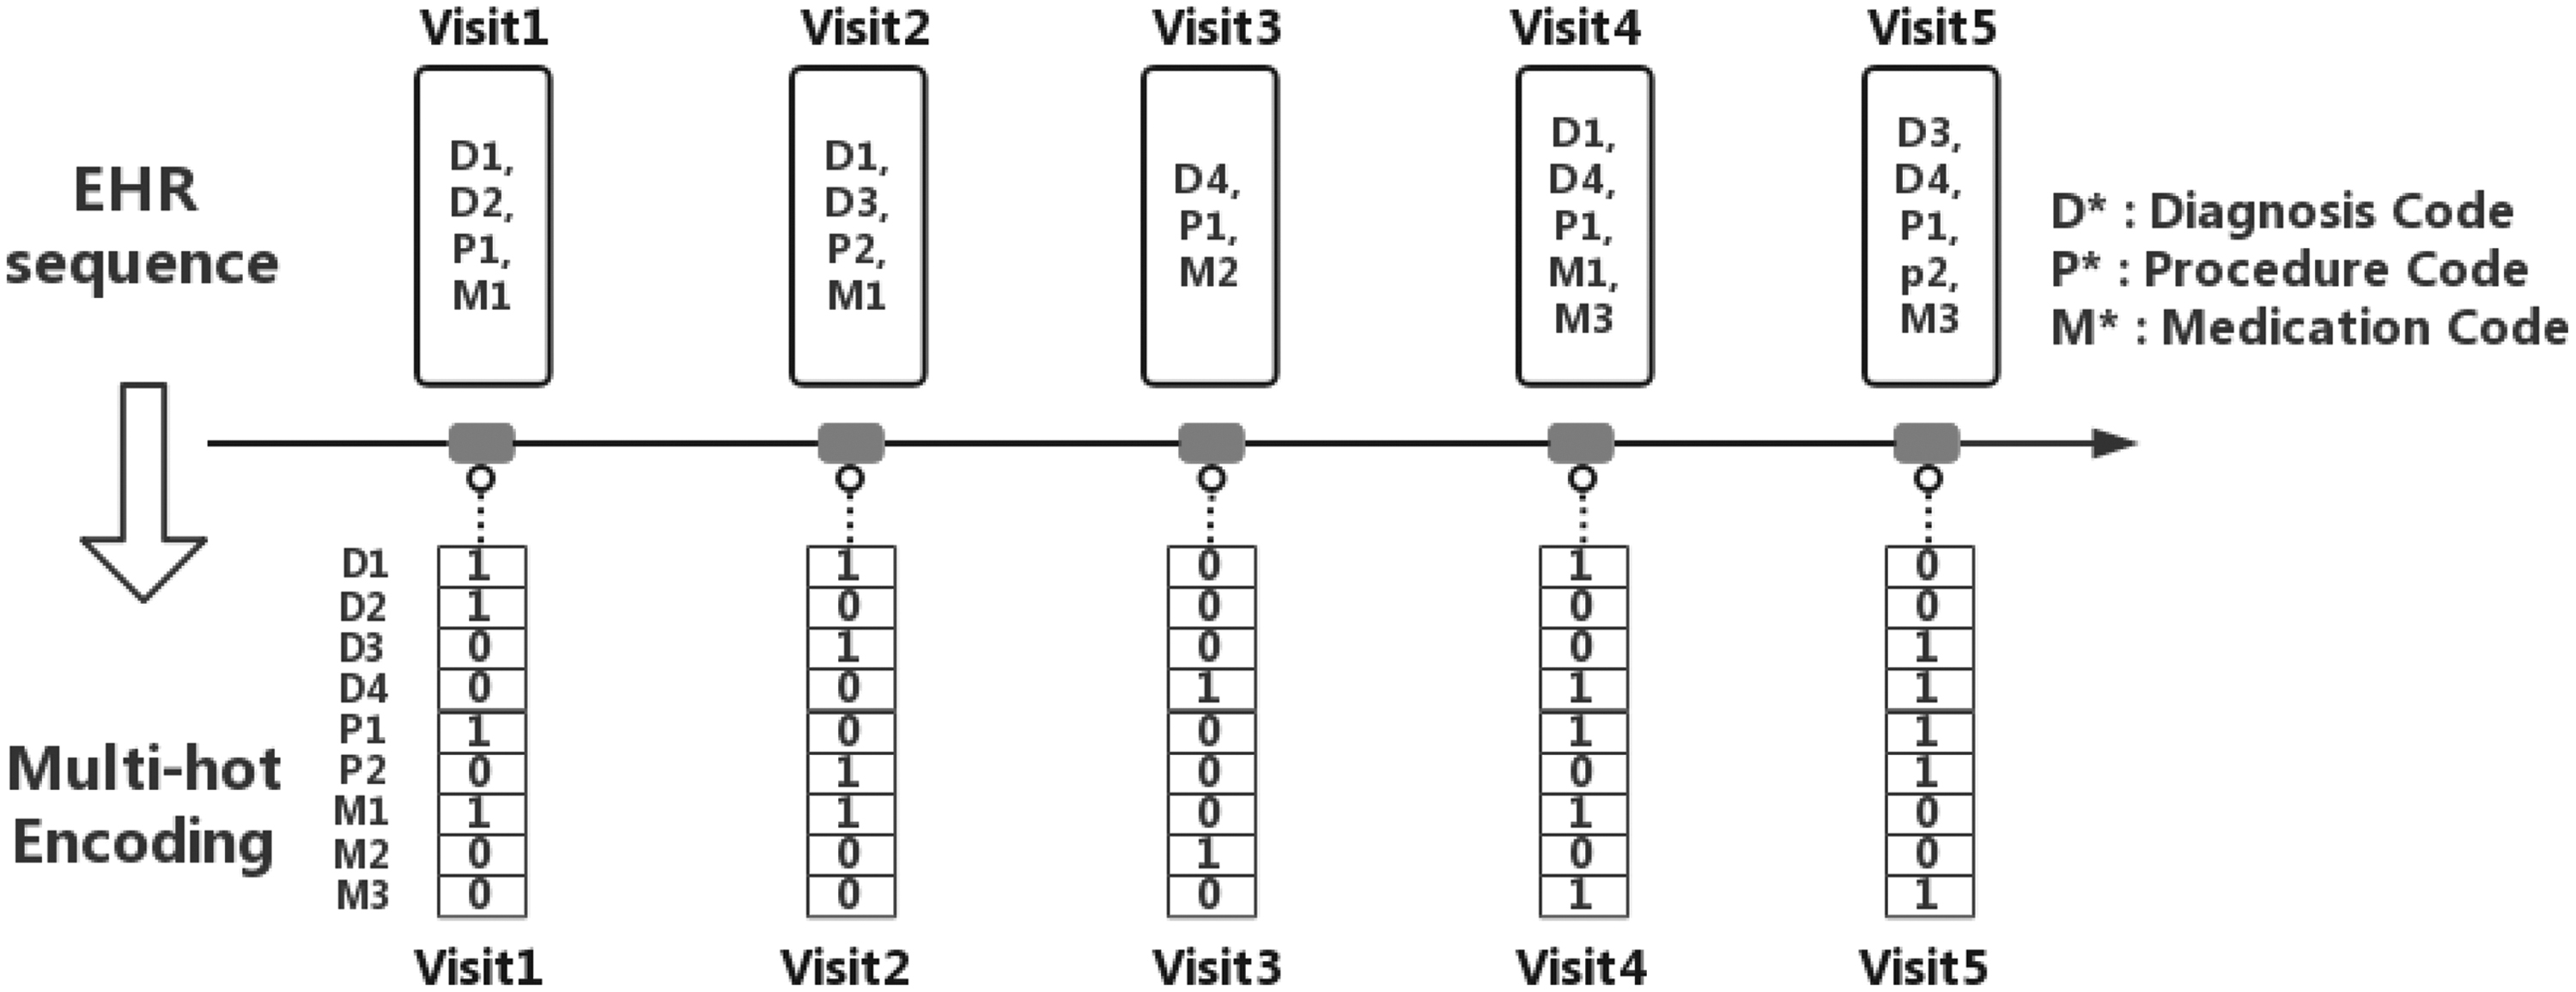
The input structure of RNN-based methods. HER, electronic health record; RNN, recurrent neural network.
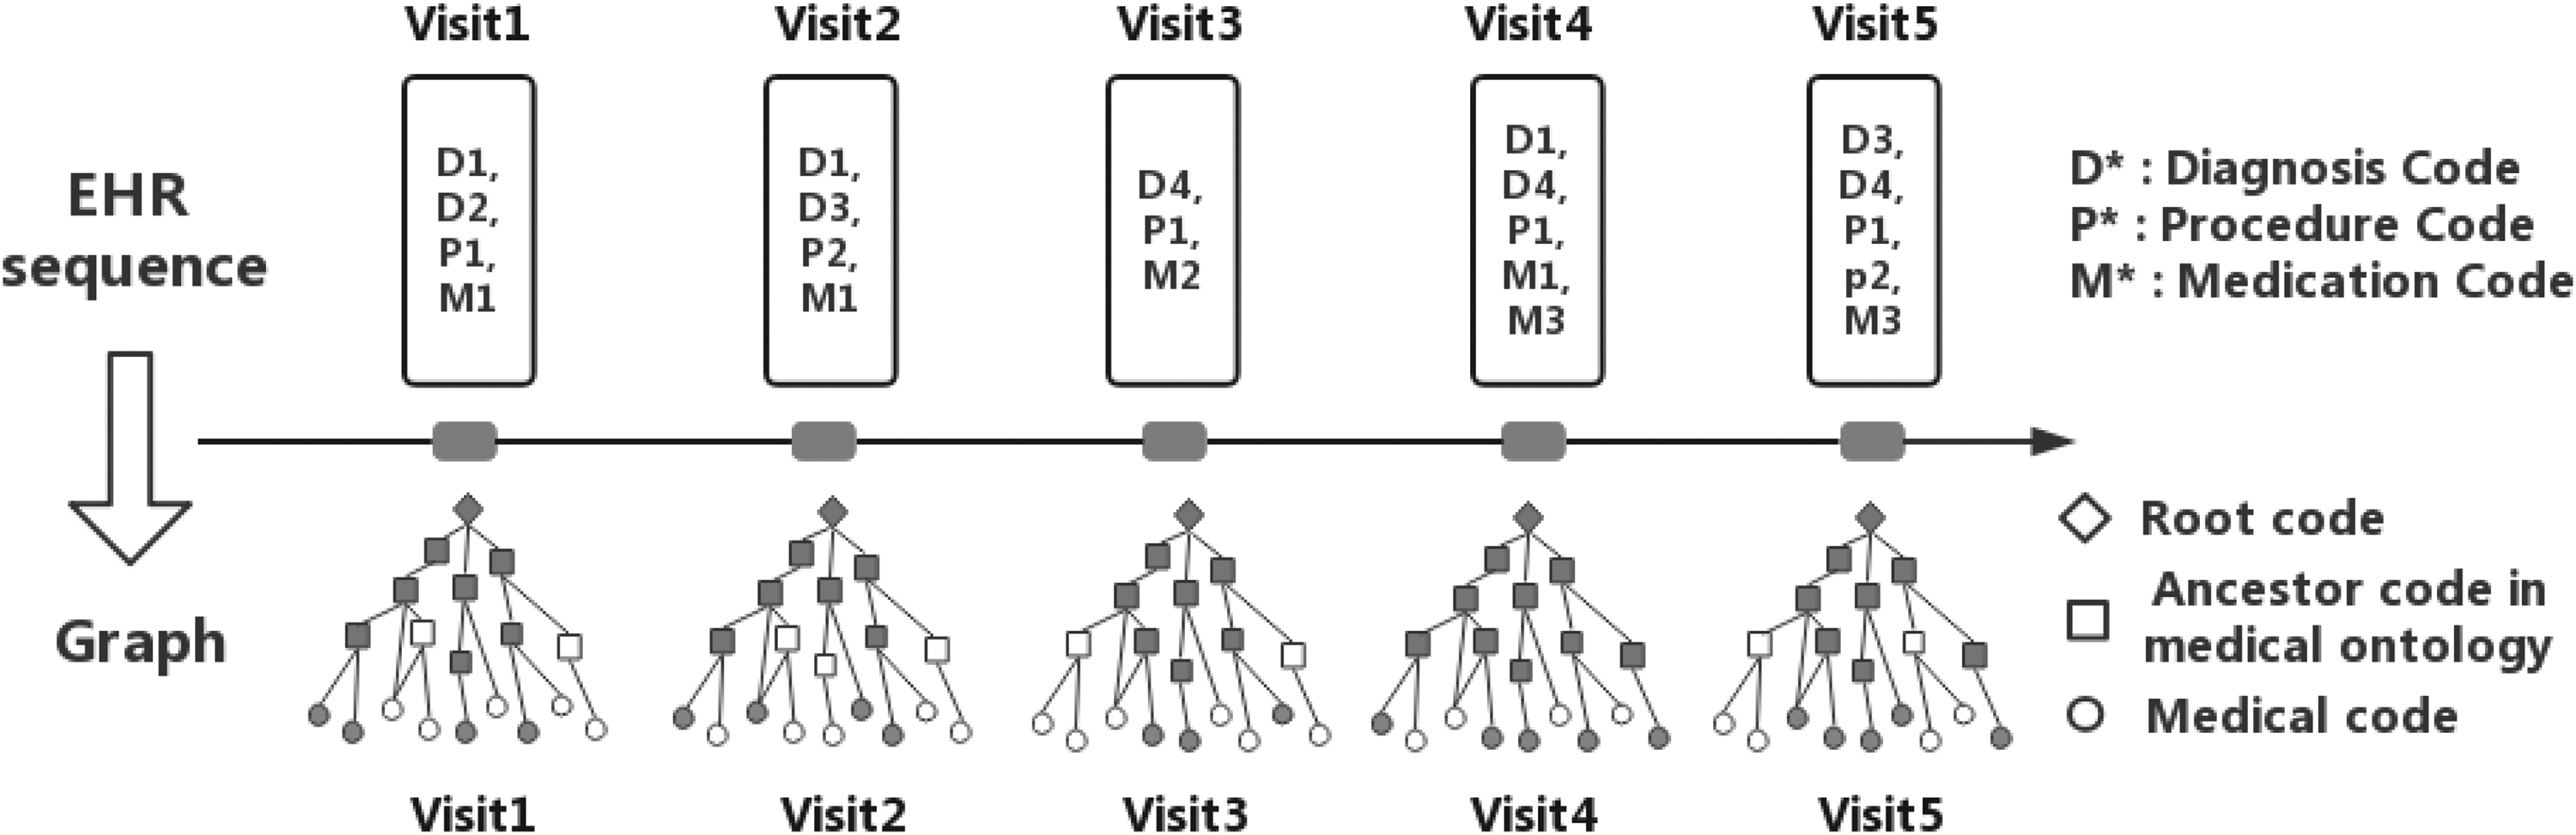
The input structure of the proposed GNDP. GNDP, Graph Neural Network-Based Diagnosis Prediction.
The contributions of this article are as follows:
We propose GNDP, a graph convolution network-based, end-to-end, and robust diagnosis prediction method that can make use of the underlying spatial and temporal dependence of EHR data comprehensively to improve the accuracy of diagnosis prediction.
We introduce a spatial-temporal patient graph construction method. By integrating patients' EHR data with the medical knowledge graph, the domain knowledge is converted into internal information of the data, thus benefiting deep models to extract more meaningful features.
We empirically demonstrate that the proposed GNDP outperforms SOTA RNN and attention-based methods in diagnosis prediction task.
This article is organized as follows: the Related Work section discusses the existing studies that are related to this work, including the description of EHR data. The details of the proposed GNDP are provided in the Proposed Method section, including the basic notations, the problem definition, and the network architecture. In the Experiments and Evaluations section, ablation and comparative experimental results are provided as well as the implementation detail. At last, the conclusions are presented in the Conclusions section.
Related Work
This section provides a description of EHR data and discusses the existing works in a clinical predictive method, especially the diagnosis prediction method.
EHR systems are primarily designed for the administration aspect. 15 Such systems store patients' records that consist of massive and diverse medical variables and information in a sequential order associated with their visits to the hospital. 1 Nowadays, EHR systems are broadly applied worldwide and have accumulated a tremendous amount of patients' historical data. 15 Based on this, researchers apply EHR data for multiple clinical predictive tasks such as diagnosis prediction, risk prediction, medicine recommendation, and disease progression.
Diagnosis prediction is one of the most important and difficult tasks in clinical predictions based on EHR data. This task aims to predict the patients' future diagnoses based on their historical medical records, and a crucial requirement for it is to model the patient visits effectively. Reverse Time Attention Mechanism (RETAIN) 8 and Dipole 10 are two inspiring studies to adopt deep learning techniques for diagnosis prediction. RETAIN utilizes RNNs to model reverse time-ordered sequential EHR data. This is inspired by a clinical practice that the up-to-date health status of a patient is more informative than the previous. Dipole applies bi-directional long short-term memory to handle long sequences, thus enhancing the data modeling ability of predictive models. These methods prove that RNNs are effective to model patients' historical records. However, both of them still suffer from data insufficiency and noise. 12
In practice, data insufficiency and noise are invariably existing in EHR.1,11,12 As it is hard to solve these problems through data preprocessing procedures, researchers propose to utilize domain knowledge to provide supplementary information of the original data for deep models. GRAM 12 creates a co-occurrence matrix that consists of medical codes in EHR data and ancestor codes in a medical ontology, and the use is to generate reliable medical code representations via an attention mechanism. KAME 11 makes use of the medical ontology to generate both the medical code and ancestor code representations and apply them to the training and predicting stage of their model via attention mechanisms. CAMP 13 also developed a knowledge-guided method based on the medical ontology and augmented memory networks that share the same concept with KAME. All of these methods experimentally prove that the utilization of domain knowledge can effectively improve the performance of RNN-based deep models on diagnosis prediction tasks.
However, the knowledge information from medical ontologies may not be leveraged comprehensively by the above methods. The ontologies are graphs that model a set of medical concepts and their relationships. The above studies utilize these graphs by creating an embedding matrix that consists of nodes from data and their parent nodes from an ontology initially, and then generate code representations that infuse with knowledge via attention mechanisms. Although these studies leverage the parent–child relationships in the knowledge graph, they neglect and are incapable of extracting the global structure information, which is a crucial feature of a graph.
Recently, graph neural networks (GNNs) have attracted wide attention from the deep learning community.16,17 Different from convolutional neural networks that perform effective feature extraction on grid-like data, GNNs focus on graphs that are non-Euclidean data. 17 Studies show that GNNs have been successfully applied in various graph data-based tasks.14,16–19 For this work, the most relevant GNN is ST-GCN. 14 ST-GCN is primarily designed for skeleton-based action recognition tasks. It captures the features that are underneath the spatial configuration and temporal dynamics of graph structure skeleton data to generate robust and accurate predictions of human actions. However, due to the significant differences between EHR and skeleton action data, ST-GCN cannot be applied in diagnosis prediction tasks directly. The data differences are due to two aspects: (1) complexity of the graph structure. The number of nodes in EHR data is significantly larger than that in skeleton data, which are at most 25 nodes and at least 669 nodes, respectively11,14; (2) the sparsity of the node attributes. The nodes' attributes of graph EHR data are more sparse in both the spatial and temporal domains. More detailed information can be found in the Experiments and Evaluations section.
Proposed Method
This section is divided into three parts. First, it defines the basic notations and the diagnosis predication. Then, it provides a detailed description of the method to convert EHR data and medical ontology into a graph structure. At last, we expatiate the framework of GNDP.
Basic notations
The entire set of unique medical codes (i.e., diagnose code, procedure, and medication code) from the EHR data set can be denoted by M =
The medical ontology
With the notations above, the diagnosis prediction task can be defined as follows: Given a patient visit record
Graph EHR data construction
For simplicity, the graph construction procedure is described in a single-patient case. Given an EHR data set with  ) are the node set and E the edge set in the graph. Then, an adjacency matrix
  can be generated according to E, where
  , where the i-th element is 1 if i is the index of
  that is the vector sum of all the medical codes in each
The last visit  can be generated, where
The proposed GNDP
The framework of GNDP is shown in Figure 3. When feeding the patient visit graphs that consist of a patient feature matrix and the adjacency matrix into GNDP, a batch normalization layer is applied to normalize the input feature matrices. The following are six ST-GCN units to extract the features of patient graphs in both spatial and temporal domains. Thus, all the data dependency, temporal dependency, and global structure information can be exploited by the model to learn robust patient representation. Figure 4 illustrates the details of an ST-GCN unit. The ST-GCN unit consists of three layers. The first layer performs regular two-dimensional (2D) convolution operation to expand the dimension of the input nodes' feature. Then, a graph convolution is applied to broadcast the expanded nodes' feature along with the graph edges. After this, feature maps that contain the aggregation information of nodes and their neighbors can be generated. The last layer is similar to the first one but with different kernel sizes. It performs a 2D convolution operation on the temporal axis to extract temporal information of the feature maps from the previous layer. To this end, a higher level patient feature map is generated. Each ST-GCN unit is followed by a channel-wise attention layer, to help the model focus on the channels that have more meaningful features. 20 The first two, middle two, and last two ST-GCN units have 64, 128, and 256 output channels, respectively, while each of them is followed by a global average pooling layer. The output of these pooling layers is concatenated together to achieve feature fusion and generate the final patient feature maps. Note that the outputs of the first two pooling operations are not passing to the following units. At the end of the model framework, a fully connected layer with a sigmoid activation function is applied to generate the final output for diagnosis prediction. This model can be trained end-to-end.
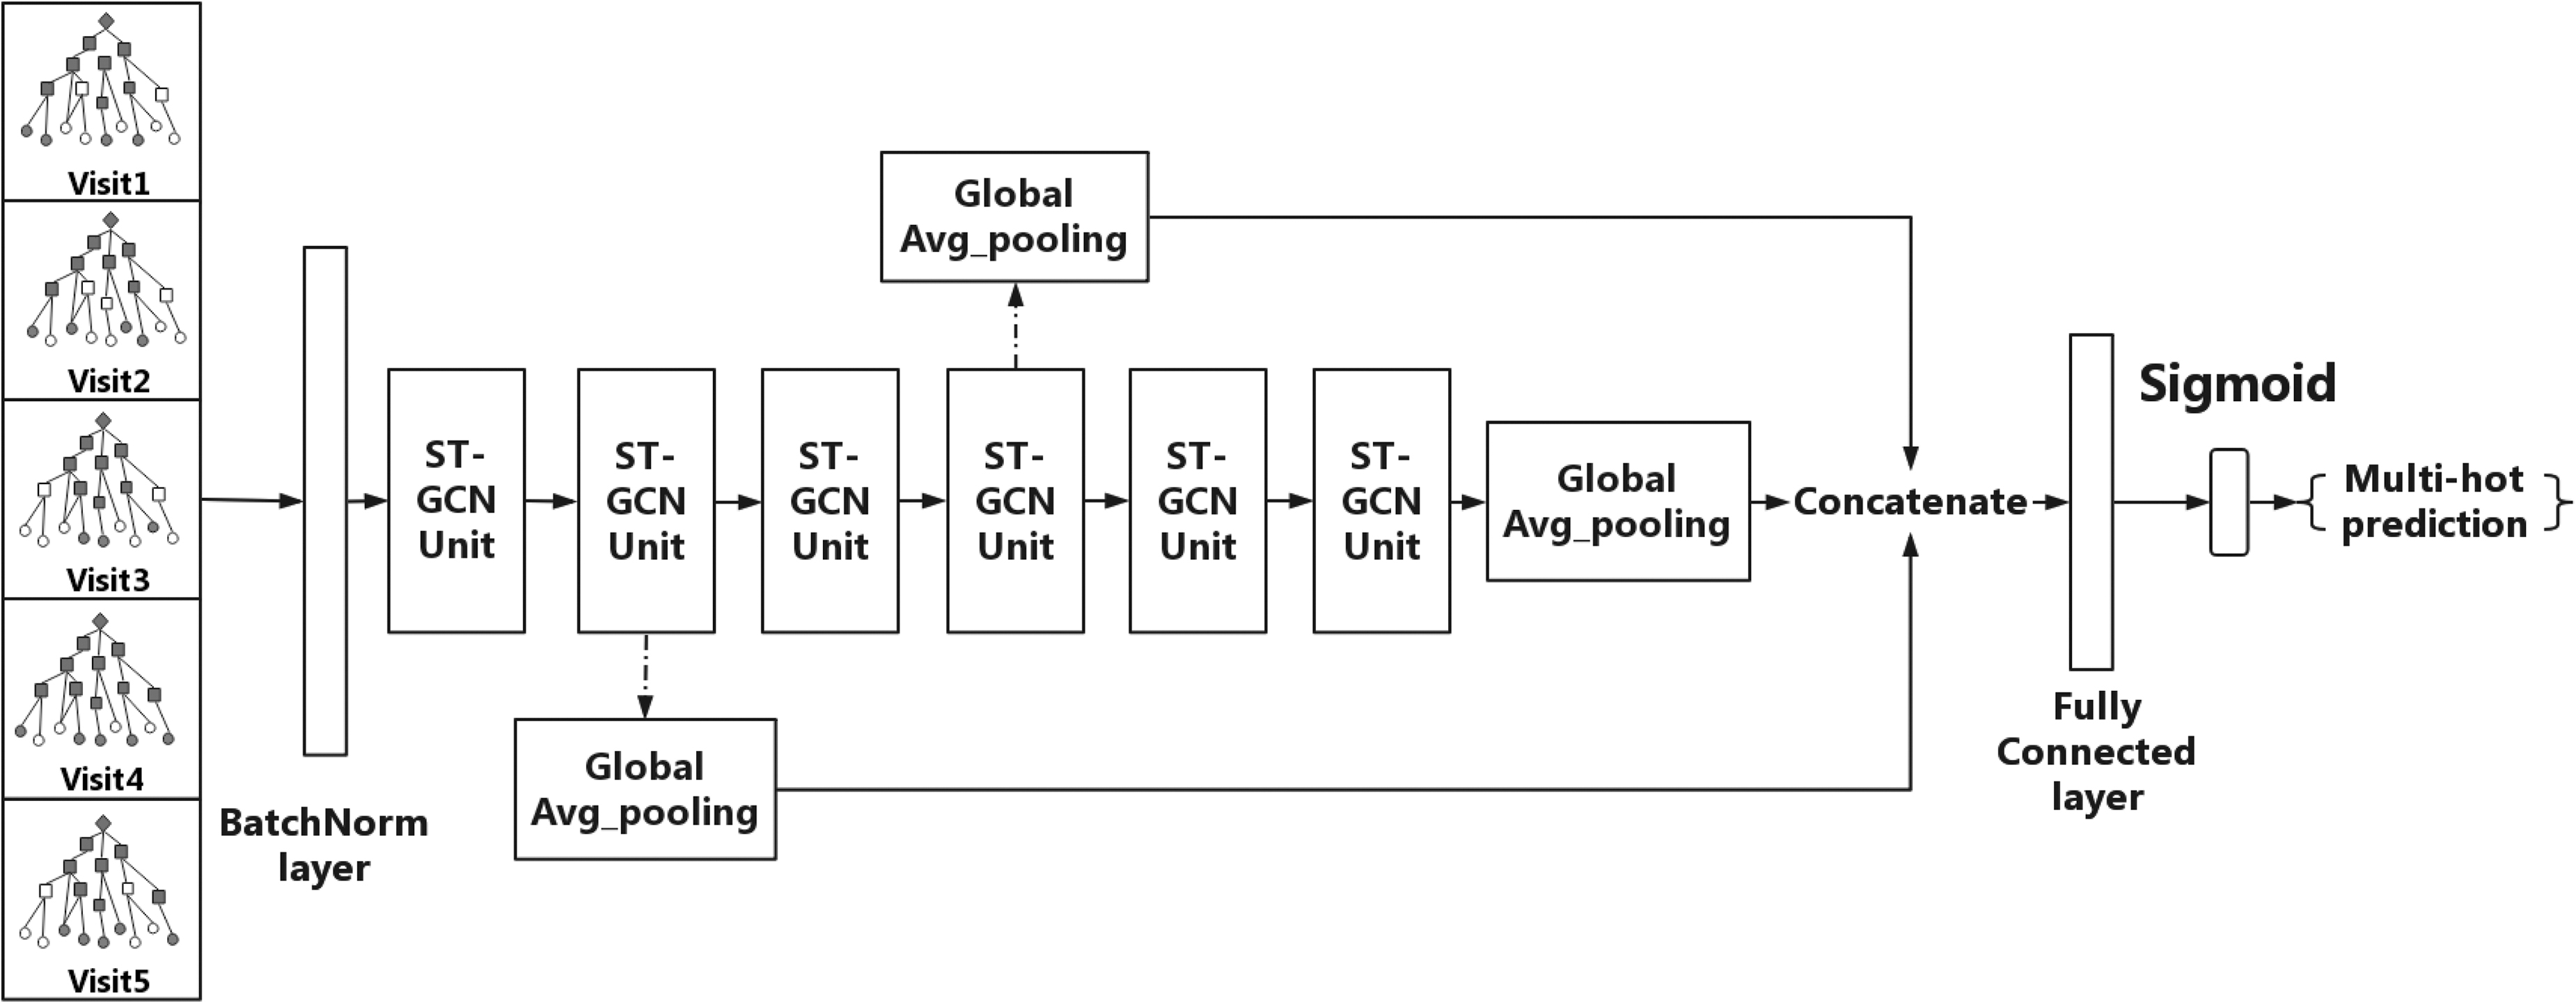
Framework of GNDP. ST-GCN, spatial-temporal graph convolutional network.
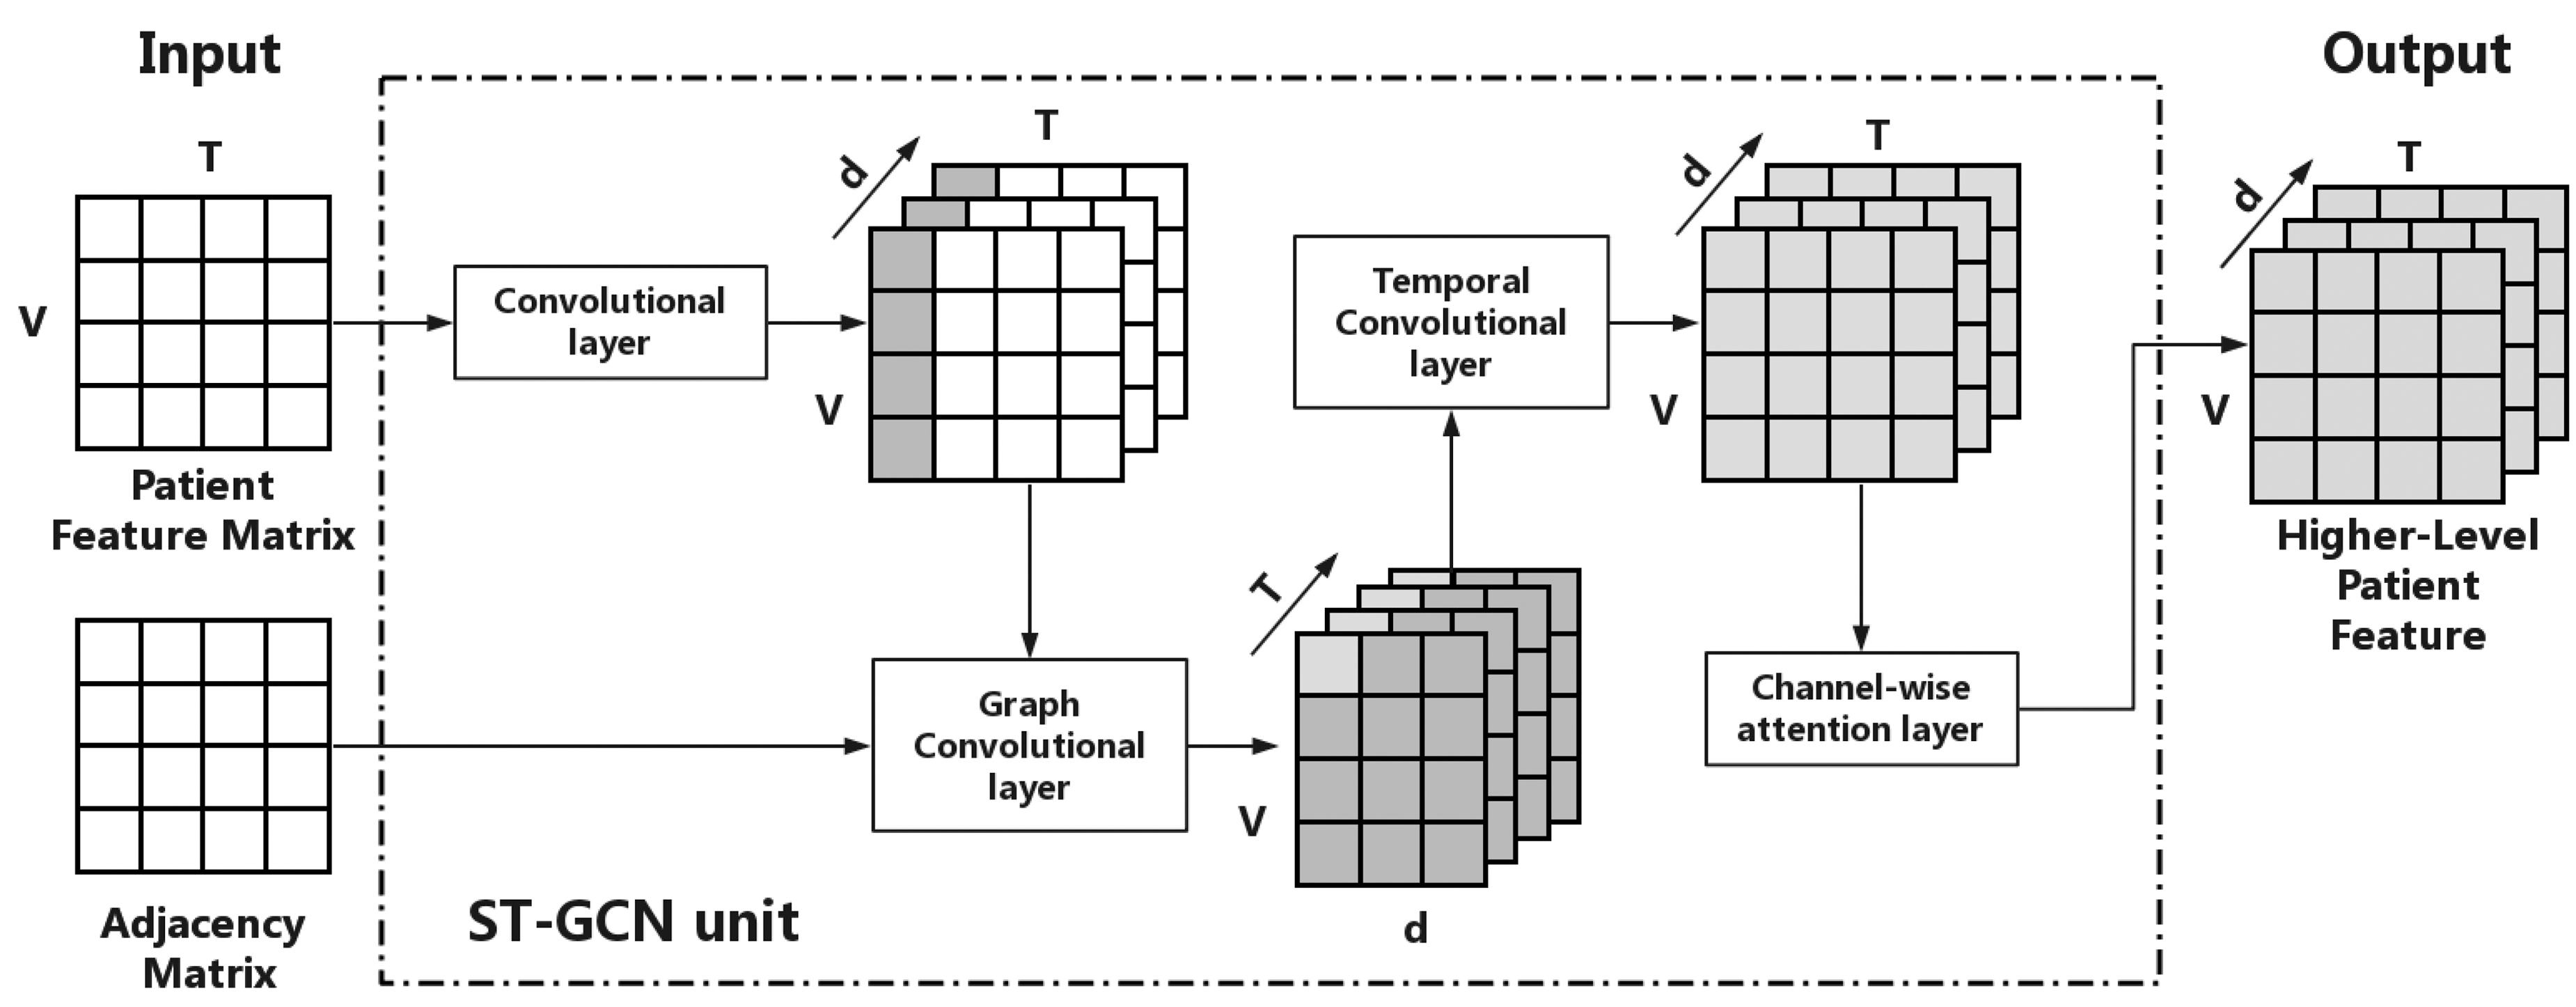
Details of an ST-GCN unit.
Spatial graph convolution
For simplicity, the spatial graph convolution operation is explained in a single patient with a single visit case. Taking adjacency matrix  and a patient visit vector
  as the inputs, an effective and efficient graph convolution can be achieved by the following function that is defined by GCN
19
:
as the inputs, an effective and efficient graph convolution can be achieved by the following function that is defined by GCN
19
:
and
where  is the degree matrix of the input graph,
  is the identity matrix referring to the self connections of each nodes, and
  represents a learnable weight matrix.
In practice, the input feature of a single visit  and the new tensor. The spatial graph convolution process can be formally described as follows:
and
Temporal dependency modeling
When given a patient who has T visit records, the feature matrix is formed by concatenating the 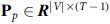 can be represented as a three-dimensional tensor with
After six spatial-temporal convolution operations, the final feature maps are defined as follows:
where
where  is the multihot prediction result. Note that the dimension of
Objective function
The diagnosis prediction is a multilabel classification task, and therefore, GNDP applies binary cross-entropy loss as the objective function to optimize the loss between the ground truth multihot label
Graph partition strategy
The graph convolution operation defined in 1 is equal to computing the inner product between each node feature vector and a shared weight vector, which may neglect the local properties of the graph structure.
14
Since the graph EHR data are constructed in a hierarchical structure, nodes at different levels should have distinct weights. To unfold this property to the model, we design a strategy to divide the graph structure of EHR data into four subsets: (1) from the leaf nodes to their second-level ancestors; (2) from first-level ancestors to third-level ancestors; (3) from second-level ancestors to fourth-level ancestors; and (4) from third-level ancestors to the root code. To achieve this, four new adjacency matrices  are created based on
The reasons for using subgraphs instead of the whole structure are twofold. First, the subgraph will restrict the broadcast of node information more locally when performing graph convolution operations. Therefore, the local differential properties of the whole graph structure can be captured by the model. Meanwhile, the node information can still be transferred globally through the common nodes from a different subset. Second, the computational consumption of performing graph convolution on subgraphs is less because the adjacency matrices of subgraphs are more sparse than the original graph. The effectiveness of our partition strategy is verified in the Experiments and Evaluations section.
Experiments and Evaluations
Data description
We use two real-world medical data sets in the experiments to examine the performance of the proposed model in the diagnosis prediction task. Data set-I is the third version of Medical Information Mart for Intensive Care, ‡ a public accessible benchmark data set for critical care that has been widely applied in a variety of researches.8,10–12,21 Data set-II is a private data set that is constructed from a real-world longitudinal EHR database. The medical events from both data sets are encoded following the ICD coding system. Table 1 shows the details of the two data sets. It can be seen that Data set-II contains more patients and each patient has more visit records. However, the average medical events of an individual visit in Data set-II are significantly less than Data set-I. Therefore, Data set-I is more challenging in training the deep models for diagnosis predictions.
Statistics of the data sets
ICD, International Classification of Diseases.
We follow the initial data process procedure developed by Choi et.al. 8 to create time-ordered patient sequences for each data set, and patients who have less than two visits are removed. After this, an exclusive knowledge graph for each data set can be constructed for the CCS medical ontology, which is also used in previous works.11–13 As shown in Table 2, the structure and the size of each constructed graph are nearly the same and both them are significantly complex than the graph applied in ST-GCN. 14
Statistics of the graphs
ST-GCN, spatial-temporal graph convolutional network.
It has been discussed in previous works that, in practice, predicting the category of each medical event is enough for preserving sufficient granularity for each diagnosis.11,12 Therefore, we implement category diagnosis prediction by replacing the actual diagnosis codes from the target visit of each patient to the code in the second hierarchy of ICD-9 as the category label.
Baseline method
To examine the performance of the proposed approach GNDP, we conduct comparative experiments with the following baseline models:
GNDP_. GNDP_ removes our partition strategy and performs graph convolution operations with a single adjacency matrix. GNDPα. GNDPα is the backbone of the proposed model but without feature fusion and channel-wise attention. GNDPβ. GNDPβ removes the channel-wise attention layers behind each ST-GCN unit in GNDP and keeps the average pooling layers to perform feature fusion. GNDPγ. GNDPγ removes the global average pooling layers in the second, fourth, and sixth ST-GCN unit in GNDP and keeps the attention layers. ST-GCN.
14
ST-GCN uses different partition strategies to divide the input graph into different subsets to enhance the model performance in action recognition tasks, which are not applicable to diagnose prediction task. Thus, we take the unilabeling partition strategy, which is equivalent to compute the inner product between the weight vector and the feature vector of all neighboring nodes.
14
We also adopt ST-GCN+, which adopts our partition strategy as a baseline. GCN.
19
GCN, which is developed by Kiptf and Welling, is considered to be one of the strongest baselines for graph convolutional networks.
22
We follow the data prepossessing method introduced in Choi et al.
12
and Kipf and Welling
19
and fed the data into a two-layer GCN model. Note that this model is incapable of learning the time dependency of the input data. Dipole.
10
Dipole is an attention-based bidirectional recurrent neural network, and it takes the same raw input as GRAM. We implement the Dipole GRAM.
12
GRAM is the pioneering work that uses a medical knowledge graph associated with EHR data to learn the medical code representations via attention mechanisms and RNNs. We implement the GRAM KAME.
11
KAME shares the framework with GRAM; we implement this model by using a supplementary branch that generates knowledge vector, and then concatenate the output with the hidden vector, which is generated by the GRU from GRAM before the last classification layer. CAMP.
13
CAMP is a recent work that uses not only the medical ontology but also patient demographics to perform diagnosis prediction. The patient demographics consist of age and gender. However, this information is only available in Data set-I. Therefore, we implement CAMP_ that removes the patient demographic attention branch in Data set-II. RNN. We use a one-directional GRU
23
to model the EHR sequence as a baseline for all the models above.
Evaluation metric
We evaluate the performance of all baseline methods and the proposed method by using visit-level precision@k and code-level accuracy@k as same as previous works11,12 to provide multigrained measurements.
Visit-level precision@k measures the prediction precision of individual visits within patient sequences. For a single visit, the final output of our model is
where
where P indicates the total number of patients.
We tune k from 5 to 30 to evaluate the coarse-grained and fine-grained performance of each model, and the greater value indicates a better performance.
Implementation detail
We implement all the aforementioned approaches with PyTorch
§
1.0. All training processes are accomplished via two Nvidia Titan V GPU and CUDA 9.0 with Inter Core i9-7900x processor. We split the data sets into different ratios to evaluate the performance of GNDP. First, the data sets are randomly divided into training, validation, and testing set in a
Result and evaluation
We examine the effectiveness and necessity of the proposed components in GNDP, and in the meanwhile making comparisons with the most related model ST-GCN in diagnosis prediction tasks on Data set-I. Table 3 shows the code-level accuracy and visit-level precision with different k values under the split ratio of
Results of ablation experiments
The values in bold are the best results in this experiment.
GNDP, Graph Neural Network-Based Diagnosis Prediction.
We apply Data set-I and Data set-II to compare our model against SOTA approaches under the split ratio of
Results of comparative experiments-I
The values in bold are the best results in this experiment.
CAMP, co-attention memory networks for diagnosis prediction; GRAM, graph-based attention model; KAME, knowledge-based attention model; RNN, recurrent neural network.
For knowledge-guided models, compared with CAMP, GNDP improves the code-level accuracy in
Results of comparative experiments-II
The values in bold are the best results in this experiment.
These results demonstrate that because of the better utilization of the medical knowledge graph and reasonable model configuration, the proposed GNDP can generate more accurate predictions than the existing knowledge-guided models.
Conclusions
In this study, we propose GNDP, a novel diagnosis prediction method to predict patients' future health status based on their historical medical records. Taking advantage of GNNs, GNDP learns the spatial and temporal patterns from patients' sequential graph data, in which the knowledge from the medical ontology and the information from EHR are naturally infused. In this way, GNDP can fully make use of the medical knowledge as an internal information of EHR data to improve prediction accuracy. We experimentally verify the necessity of the model components through ablation experiments and compare our model with SOTA approaches on two real-world EHR data sets in diagnosis prediction tasks. Experimental results confirm that GNDP significantly outperforms RNN and attention-based, knowledge-guided clinical prediction models.
Footnotes
Author Disclosure Statement
No competing financial interests exist.
Funding Information
This work was supported by the National Key Research and Development Program of China under grant No. 2018YFC130078, the National Natural Science Foundation of China General Program under grant No. 61672420, the Key Project of Natural Science Foundation of China under grant No. 61532015, the Project of China Knowledge Center for Engineering Science and Technology, National Natural Science Foundation of China Innovation Research Team No. 61721002, Innovation Research Team of Ministry of Education (IRT_17R86).