
Abstract
When users interact with their mobile devices, they leave behind unique digital footprints that can be viewed as predictive proxies that reveal an array of users' characteristics, including their demographics. Predicting users' demographics based on mobile usage can provide significant benefits for service providers and users, including improving customer targeting, service personalization, and market research efforts. This study uses machine learning algorithms and mobile usage data from 235 demographically diverse users to examine the accuracy of predicting their sociodemographic attributes (age, gender, income, and education) from mobile usage metadata, filling the gap in the current literature by quantifying the predictive power of each attribute and discussing the practical applications and privacy implications. According to the results, gender can be most accurately predicted (balanced accuracy = 0.862) from mobile usage footprints, whereas predicting users' education level is more challenging (balanced accuracy = 0.719). Moreover, the classification models were able to classify users based on whether their age or income was above or below a certain threshold with acceptable accuracy. The study also presents the practical applications of inferring demographic attributes from mobile usage data and discusses the implications of the findings, such as privacy and discrimination risks, from the perspectives of different stakeholders.
Introduction
Mobile devices have emerged as an indispensable component of contemporary life. A recent survey indicates that, on average, U.S. adults engage with their mobile devices for over two and a half hours daily. 1 A study conducted by the research firm Dscout reveals that an average user interacts with their mobile device 2617 times per day. 2 In addition, heavy users, representing the top 10%, initiate 132 sessions daily, interact with their devices 5427 times, and dedicate 225 minutes to their phones. 2 As a result of these interactions, users leave behind large and rich digital footprints in the form of metadata.
Considering how closely users are attached to their mobile devices (physically, cognitively, and emotionally), their interactions with their devices leave behind unique digital footprints that can reveal a wide array of their characteristics,3,4 including their sociodemographic attributes. The potential to infer users' sociodemographic information from their mobile device usage holds valuable implications from multiple viewpoints. Companies and service providers can immediately apply this information to their marketing efforts and personalize services. 5 For example, a company can use the sociodemographic attributes of its mobile application users to target advertising, identify underserved market segments, and offer customized services and content to its user base. 6
However, while users may also benefit from receiving personalized services and product recommendations, this can simultaneously pose a privacy risk to them.7,8 Many users may not be aware of the potential predictive power of different data attributes that are collected by mobile apps when they grant permissions to those apps during installation. For instance, in a recent study conducted by Pew Research, nearly half of the participants said that they were not comfortable after they were shown how Facebook had used their personal data to predict their interests for ad targeting. 9 The situation for mobile apps could be even worse, considering that, due to the low granularity of certain app permissions, 10 the descriptions of some app permissions are generic, vague, or misleading. 11
Understanding the degree to which various mobile usage metadata attributes can reveal users' demographic information is of great importance for policymakers and regulatory agencies to protect citizens from privacy and discrimination risks. Mobile digital footprints are currently being considered as alternative data sources for evaluating the creditworthiness of the unbanked population in the pursuit of global financial inclusion. However, if these data also have the ability to predict demographic attributes, the credit risk models may lead to indirect discrimination based on age or gender. On the contrary, if mobile usage data prove to be predictive, it can provide a cost-effective way of monitoring and understanding sociodemographic changes at a high spatial resolution and track progress toward goals such as poverty reduction 12 and local economic development, human mobility, and activities. 13 This could be especially useful in developing countries where census data may be lacking or unreliable. 14
Previous studies have mostly evaluated correlations between certain demographic attributes and select mobile phone usage metrics. However, a thorough evaluation of the predictive power of a diverse set of mobile usage attributes (both individually and when combined) in predicting various demographic characteristics is lacking in the literature. By aggregating a large number of individual data points corresponding to individual mobile usage sessions and analyzing the data collected from 235 Android users, this study investigates how users' age, gender, income, and education can be inferred from their mobile usage patterns.
More specifically, the exact mobile usage patterns of all 235 users over a 14-day period were used as input attributes to predict users' demographic characteristics. The data were gathered across four mobile usage categories: (1) text and talking, (2) social media, (3) web browsing, and (4) media streaming. Regression models were trained to predict a user's exact age and income, whereas binary classification models were utilized to predict users' age group, income group, gender, and education status. The classification groups are further explained in the Results section. The study seeks to answers the following research questions:
In addition to answering those questions, this article discusses the practical applications and privacy implications of the findings. The rest of this article is organized as follows. The Related Studies section provides an overview of related studies. The methodology of the study is then described in the Methods section. Results are presented and discussed in the Results section and in the Discussion and Implications section, respectively. Finally, the Conclusions section presents the conclusions of the study.
Related Studies
A number of past studies have investigated the differences in patterns of usage of mobile devices based on demographic attributes. However, there are inconsistencies in the obtained results and a lack of comprehensive and conclusive studies in this area. Moreover, most of the previous studies have only examined the differences in the use of mobile devices by users belonging to different demographic groups and did not examine the possibility of predicting those sociodemographic attributes from mobile usage information.
For example, considering the effect of age, by deploying a user segmentation methodology, the study by Petrovčič et al. 15 showed that most old users used their mobile devices primarily for making and receiving calls. However, Busch et al. 16 showed that older adults use their mobile devices for a much broader range of applications. In general, users in the age group 18–24 years were observed to send and receive a substantially higher number of text messages per day. 17 Beyond call and text message patterns, Kim et al. 18 reported statistically significant correlations between age and the use of entertainment applications (correlation = −0.30), news applications (correlation = −0.37), and social networking applications (correlation = −0.28).
The role of gender on the patterns of mobile device usage has also been studied by researchers.17,19–27 For example, Sarraute et al. 20 and Witayangkurn et al. 25 found that, compared with women, men tend to make more frequent, but shorter, calls. Women, however, were found to use their mobile devices more frequently and for longer for social networking21,18,28 and text messaging.22,28 The study by Gillick et al. 23 suggests that men have a more extensive network of people whom they call but that women call their contacts more frequently (i.e., women have a smaller network with stronger ties).
Mobile usage patterns have also been shown to be correlated with income and wealth.12,18,19,27 For example, the study by Eagle and Blumenstock 19 identified notable differences between how low-income and high-income population segments use their mobile devices. The results show significantly higher usage in terms of the number of calls, duration of the calls, and extent of social network for users in the highest quantile of the income when compared with those in the lowest quantile. The use of mobile applications was also found to vary based on users' income. By using a customer segmentation approach, Kim and Park 29 showed that, for poor users, the primary use of mobile devices was to make and receive calls.
The study by Kim et al. 18 reported positive correlations between income and the use of entertainment, news, and e-commerce applications as well as a negative correlation between income and the time spent on social networking applications. Moreover, the results presented in Blumenstock et al. 12 suggest that mobile usage patterns can be used to predict poverty both at the individual and at the aggregates. The latter is especially useful for computational social science and development studies in developing countries, where there is a lack of reliable and timely census data but instead a high penetration of mobile services. 30
The literature has also investigated education. Past studies have identified low literacy as a significant barrier to unlocking the potential of smart mobile devices. 31 Moreover, Sundsoy 32 showed that low-literate users could be detected using their mobile usage patterns. The study found that a user's number of text messages and calls were correlated with education. Similar results, at an aggregate level, were reported by Frias-Martinez and Virseda, 14 where the total number of calls was shown to be statistically lower in census districts with lower education levels. In addition, users with higher levels of educational attainment were reported to use their mobile devices more frequently for news, entertainment, and e-commerce applications. 18
While the correlations between some mobile device usage attributes and sociodemographic characteristics of users have been examined in the past literature, there is a lack of a conclusive study that shows how accurately each of those sociodemographic attributes can be predicted from mobile usage data and quantifies the predictive power of each mobile usage attribute in predicting those demographic characteristics. Furthermore, in light of the increasing importance of user's privacy protection requirements, 33 the practical implications of this study's results will be relevant for users, application designers, and policymakers.
Methods
Data set
Data collection was conducted using a survey approved by the institutional review board and through the Amazon Mechanical Turk (MTurk) portal. The advantages and limitations of using MTurk as a survey platform have been documented in previous research. 34 In the context of this article, MTurk was deemed an appropriate medium for data collection due to its ability to efficiently gather information from a demographically and geographically diverse group of participants, while preserving anonymity.
Furthermore, as discussed below, using MTurk allowed participants to upload log files containing metadata on their mobile usage attributes, contributing to the quality and reliability of the collected data. To further ensure the validity of the data, attention check questions were incorporated into the survey, and a comprehensive exploratory data analysis was performed to detect any inconsistencies. Survey eligibility criteria were presented at the beginning, which required individuals to be at least 18 years old, be a resident of the United States, own an Android smartphone, and be willing to install two specific Android applications to report their mobile usage attributes.
The first part of the survey captured respondents' sociodemographic information, including age, gender, income, and education. The second part captured information about participants' mobile devices and their usage. As for usage attributes, the average number of daily calls and text messages (inbound and outbound) and the average time spent on talking/texting, social media, web browsing, and media streaming were recorded. To ensure that the mobile usage attributes were accurately captured, participants were asked to install two mobile applications: “StayFree” (ver. 8.5.7) and “Callistics” (ver. 2.6.8) to report their usage statistics over the past 14 days before completion of the survey. Figure 1 shows the snapshots of these two mobile applications.
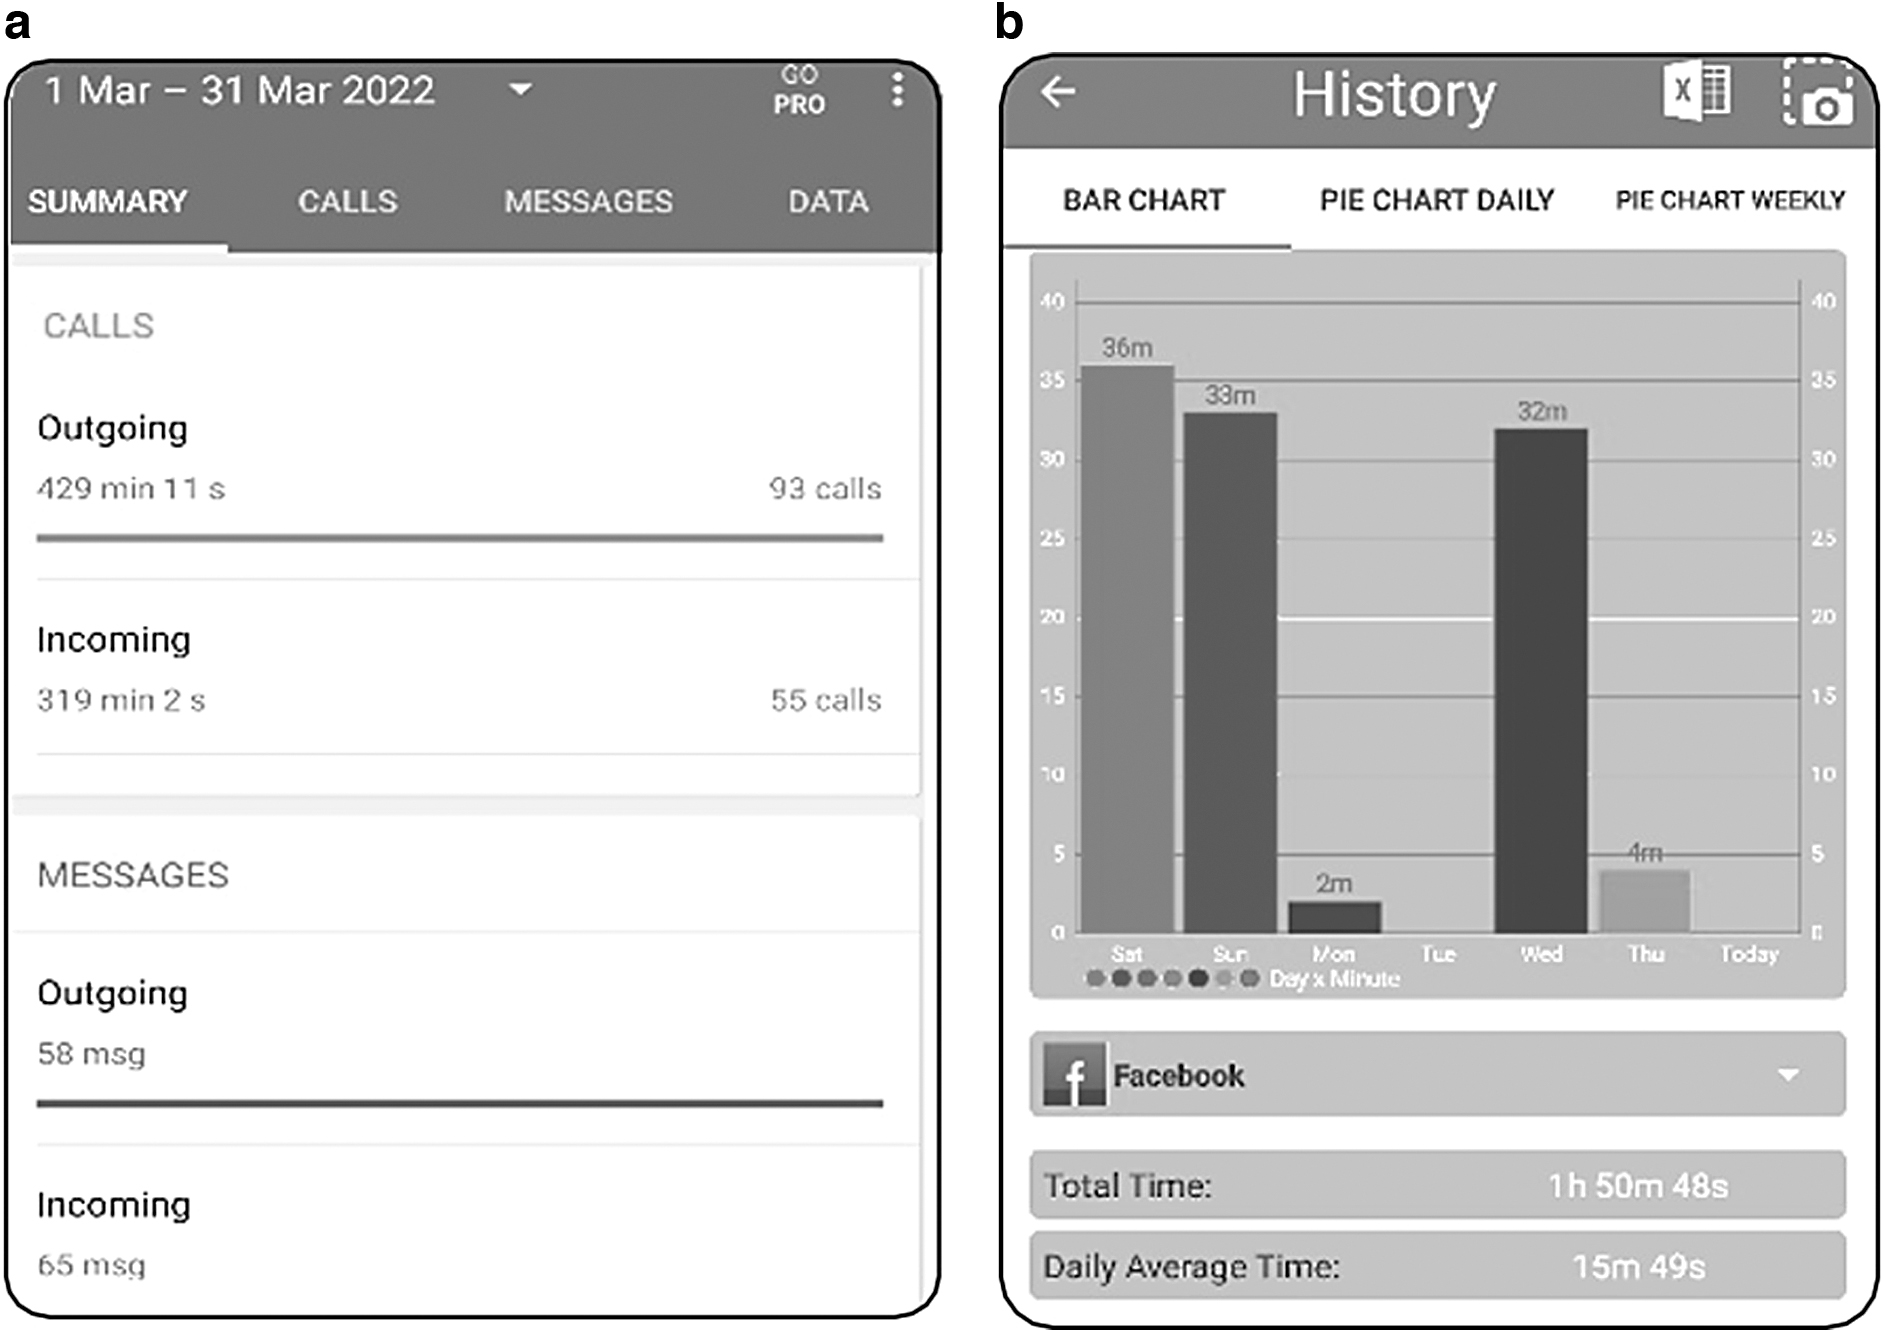
A snapshot of
StayFree is a manager app that provides information about the time spent on each application and allows historical usage statistics (i.e., minutes spent on each application on each day) to be exported into a file. Participants were asked to extract and upload this file through the MTurk portal. While StayFree captures the total time a user spent on calls, it does not report the number of calls or text messages. Therefore, participants were asked to install Callistics to self-report historical statistics about the number (and duration) of calls and text messages. To ensure the reliability of these self-reported measures, the duration of calls reported by participants was compared against the value extracted from the StayFree log files. In addition, the age, make, and model of participants' mobile devices were captured. The estimated dollar value of mobile devices was subsequently determined using the Kimovil website. †
The survey received responses from 278 participants. However, 34 participants were excluded as their self-reported call duration did not match the data from the log files. Additionally, nine participants who answered one of the attention check questions incorrectly were removed from the analysis. The final sample consisted of 235 demographically diverse participants, with 101 women and 134 men, which were further divided into 143 college-educated and 92 non-college-educated individuals. The distribution of participants' age and income is depicted in Figure 2.

The empirical distribution of participants'
Machine learning algorithms
To model the complex and nonlinear relationships between mobile usage attributes and sociodemographic characteristics of users, a range of machine learning algorithms were employed in addition to traditional linear models. Each algorithm has its own strengths and weaknesses. 35 The “No Free Lunch” theorem in machine learning states that no single algorithm is optimal for all classification or regression problems. 36 To account for this, multiple algorithms were used in this study. This helps ensure that the predictive power of the input attributes is not limited by the choice of a single algorithm.
Table 1 displays the machine learning algorithms employed in this study, including the hyperparameters (tuning parameters) for each algorithm and references to previous related studies that have used these algorithms. Furthermore, a brief description of the key features of each algorithm is also provided. One should note that, except for the Ordinary Least Squares Regression and Logistic Regression models that are specifically designed for regression and classification tasks, the other algorithms listed in Table 1 can be applied to both classification and regression modeling. Interested readers can consult the study by Kuhn 37 for more information about these algorithms.
List of machine learning algorithms and their tuning parameters
MLP, Multi-Layer Perceptron.
To avoid overfitting, data were split into two mutually exclusive subsets: the train set (80% of records) and test set (20% of records). 35 Subsequently, using a 10-fold cross-validations and adaptive search algorithm proposed by Kuhn, 37 the optimal values of hyperparameters are determined using only the train set. The performance of this model is subsequently evaluated on the test subset. This process ensures that samples of the test set were not seen by the model during the training or parameter tuning, which minimizes the risk of overfitting. 35 To ensure that the reported prediction performance is not specific to a single random test subset, the above process was repeated 10 times, each time with a new random train and test partitions and performance results were averaged. 37
In addition, adjusted R2 has been used to report the accuracy of regression models. For classification models, this study used area under the curve (AUC), balanced accuracy, sensitivity, specificity, and F1 score. AUC is a widely used metric for evaluating classification models, and it varies in the range [0 1], where an AUC value of 1 represents a perfect classification model. Other measures are defined as:
where TP, TN, FP, and FN represent true positives, true negatives, false positives, and false negatives, respectively. The F1 score is the harmonic mean of sensitivity and precision and considers both false positives and false negatives. Once a model is constructed, the importance of independent variables is quantified using the methodology proposed by Kuhn and Johnson, 35 where the variable importance values were scaled to have a maximum value of 100. Finally, to help improve the performance and stability of the machine learning models, numeric input attributes were standardized by subtracting the mean and dividing by the standard deviation for each feature.
Results
This section first presents the variations of mobile usage patterns based on demographic attributes (i.e., exploratory analysis). Subsequently, the results related to the prediction of demographic attributes from mobile usage (i.e., predictive modeling analysis) are illustrated and discussed.
Variations of mobile usage by demographics
This section presents results that address RQ1 by revealing differences in mobile phone usage among different sociodemographic groups. Table 2 displays the distribution of participants' sociodemographic characteristics and their mobile usage attributes. Two-sample t-tests were performed to assess the discrimination power of each mobile usage attribute with regard to the four demographic attributes (age, income, gender, and education).
Distribution of participants' sociodemographic information based on various mobile usage attributes
The ***, **, and * refer to the 1%, 5%, and 10% levels of statistical significance, respectively.
SD, standard deviation.
The results show that the number of incoming and outgoing calls decreases with age and that those receiving three or fewer calls daily had a notably lower annual income and were older on average (42.8 years) compared with those receiving more than 10 calls per day (33.4 years). The majority of those who received more than 10 calls per day were men (75.0%). College-educated users were found to make and receive more calls than non-college-educated users. The average duration of outgoing calls had significant discrimination power with regard to age, income, and education. Women engaged in longer outgoing calls, and excessively long calls were associated with lower income. The results also show positive correlations between income and the number of exchanged text messages and a negative correlation between age and the number of text messages. Participants who received more than 20 messages daily had an average age of 34.8 years, whereas those who received fewer than 2 messages had an average age of 50.0 years.
The number of contacts saved on users' mobile devices, which can serve as a measure of social network size, 38 showed statistically significant correlations with age (negative), income (positive), and education (positive). For example, the group of participants who had 100–200 saved contacts had an average income 70% higher than those with fewer than 30 saved contacts.
The specifications of mobile devices were also linked to users' demographics, supporting previous research. 18 Specifically, device price was positively correlated with users' age, income, and education level. A positive correlation between device age and user age was also noted, indicating that younger users tend to upgrade their devices more frequently. The results also showed a higher desire among men to upgrade their devices, with 69.7% of users with devices <6 months old being men.
Beyond call and text message patterns, it is known that various demographic segments use their mobile devices differently. 18 Table 3 presents the correlation coefficients (C) between age and income, and the daily usage of various mobile applications, talking and texting, social media platforms, web browsing, and media streaming. Along with the additional nine attributes presented in Table 2, these attributes serve as the input features utilized in this study. The results suggest strong positive correlations between different usage categories. Age is expectedly negatively correlated with time spent on different usage categories, with social media having the strongest negative correlation (C = −0.226). The correlations, however, are notably weaker for income. The observed positive correlation between income and average time spent on media streaming is also not surprising, considering that a sizable portion of streaming content is delivered via paid subscription channels.
Correlations between four key mobile usage attributes (in daily minutes) and age and income
Figure 3a shows the distribution of daily mobile application usage for men and women, with the mean values indicated by vertical dashed lines and p-values from two-sample t-tests of mean differences. On average, women spend more time talking, texting, and using social media. Figure 3b illustrates the impact of education, where college-educated users are shown to spend more time browsing the web and using social media compared with non-college-educated users. A closer examination of the results reveals that excessive mobile usage for talking and texting (over 150 minutes per day) is dominated by non-college-educated users.
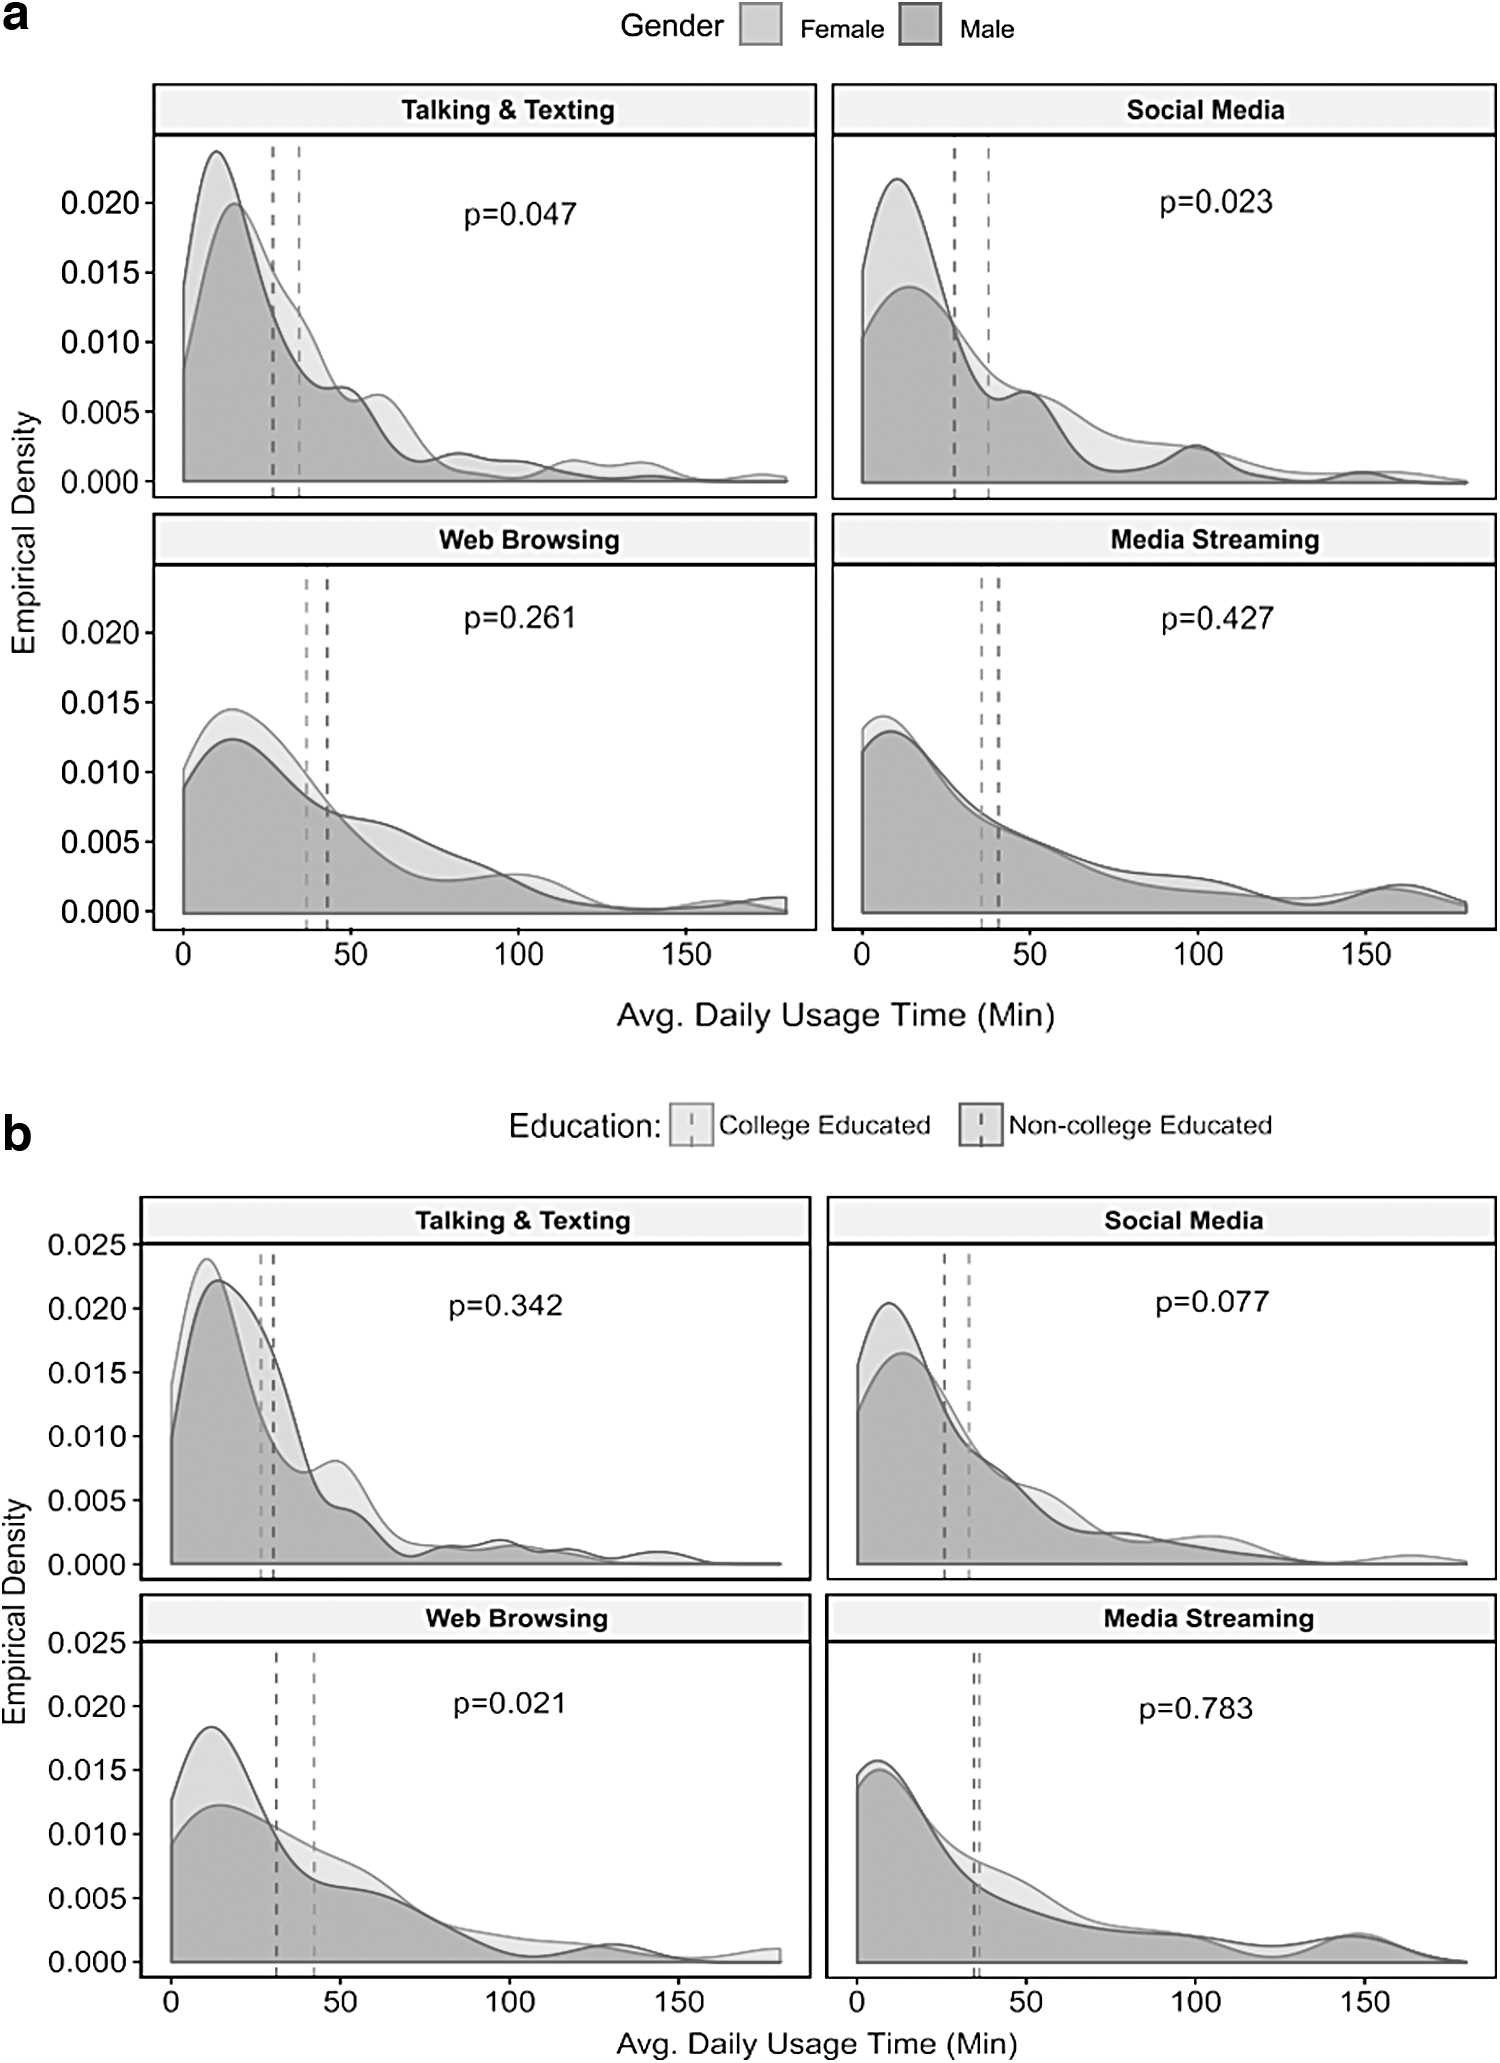
Distribution of the time spent on four different mobile applications by
Predicting sociodemographic information from mobile usage data
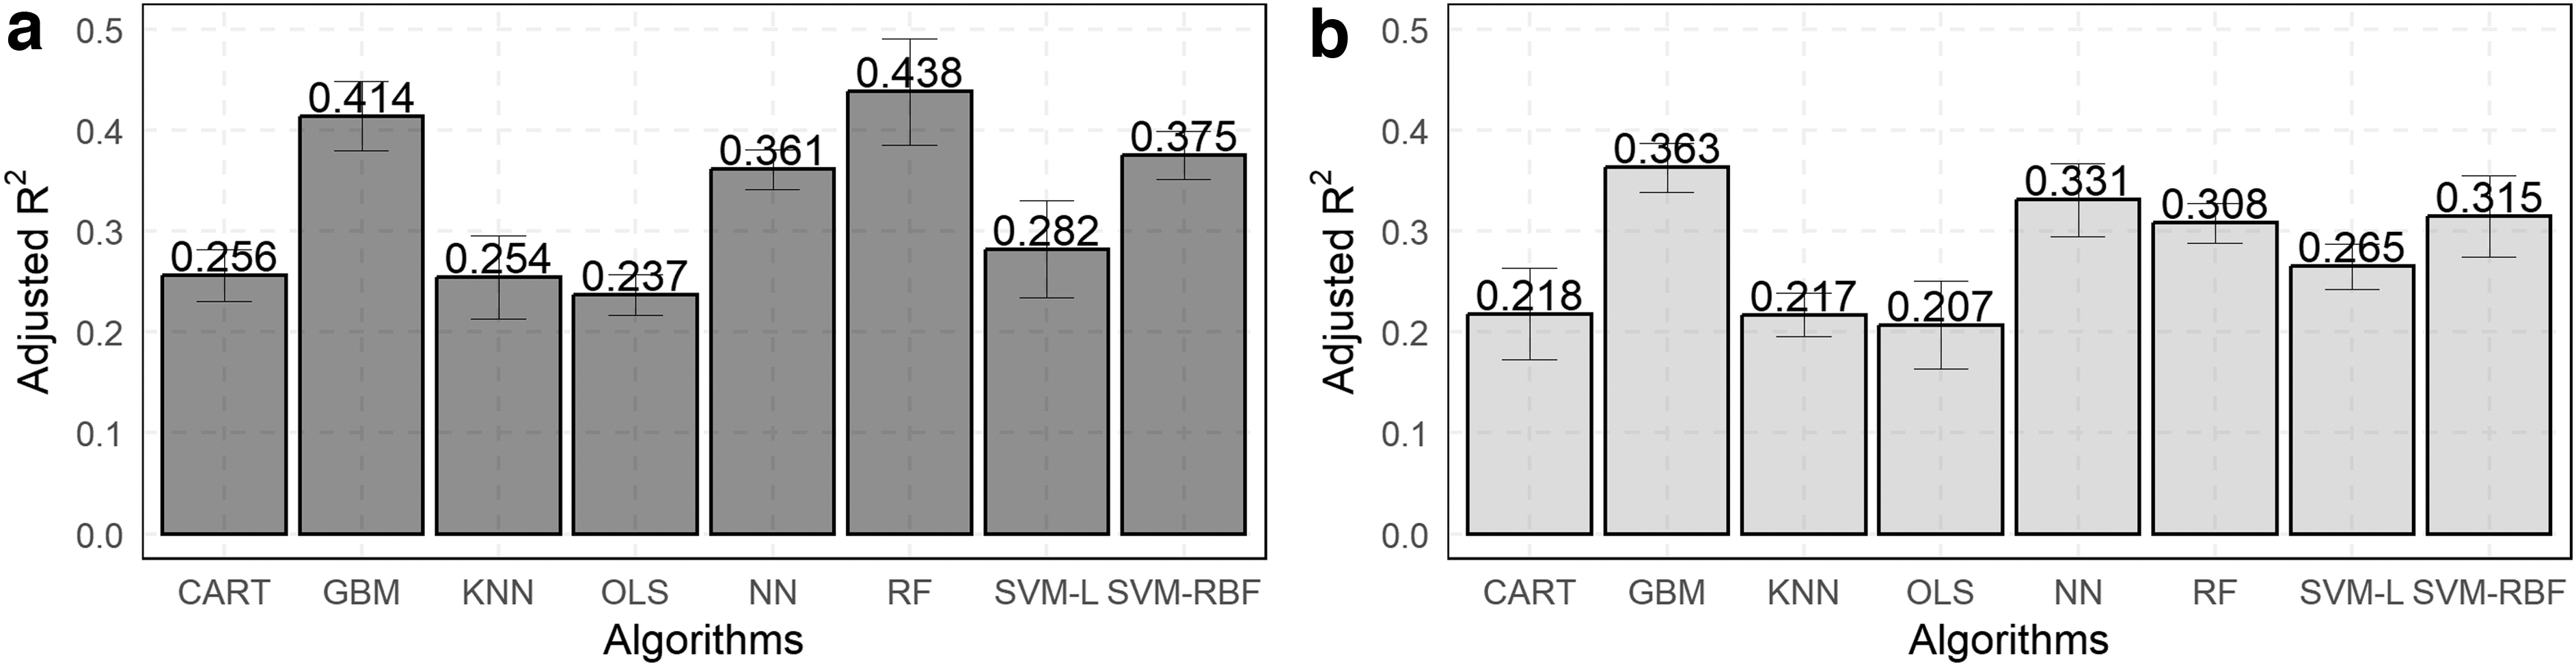
To examine how accurately each of the four considered sociodemographic attributes be predicted from users' mobile usage (i.e., RQ2), a range of regression and classification models were trained. Staring with age and income as the first two demographic attributes, Figure 4 presents the average values of adjusted R2 for various regression algorithms used to predict users' age (Fig. 4a) and income (Fig. 4b) from their mobile attributes, with the standard deviation shown as error bars around the averages. According to the results, mobile attributes could explain 43.8% of variations in users' age (Gradient Boosting Machines model) and 36.3% of variations in their income (Random Forests model). The analysis of standard deviations does not indicate any unusual patterns for the models considered.
Comparison of different regression models used to predict
The results in Figure 4 suggest that mobile usage attributes alone may not accurately predict exact users' exact age or income as a significant percentage of variations remains unexplained in the regression models. However, in many practical scenarios, determining if a user is above a certain age or has income above a set threshold might be sufficient (e.g., for personalized services or targeted ads). Accordingly, regression modeling can be transformed into a classification task. Figure 5 displays the performance of different classification models in predicting whether participants were above or below a certain age threshold, with the best performing algorithm for each threshold highlighted by the bar color. For example, if the age threshold is set at 30 years, the models will predict if the participant is older or younger than 30 years, with the older group being designated as the positive class. Please note that as the threshold varied, the classes being defined change, thus making it a different classification task.

Various performance measures of classification models to predict users' age class using their mobile usage attributes. The old group was considered the positive class.
The choice of age threshold depends on the specific application, such as a mobile retailer wanting to target users below 30 for a specific product. By changing the threshold, one can investigate if there is a particular demographic group with unique mobile usage patterns that make them easier to detect by the classification algorithm, which addresses RQ3. As it can be seen from Figure 5, the classification accuracy was generally high, especially for identifying users younger than 30 years or older than 60 years (accuracy >0.8). This is perhaps because, compared with middle-aged users, both young and old users had more distinctive mobile usage patterns, which made it easier for the classification algorithms to identify them. Moreover, by comparing specificity and F1 scores, the classification models appeared to provide symmetric performance with respect to false-positive and false-negative misclassification errors.
Similarly, classification models were trained to segment users into two groups of low income and high income. Figure 6 shows the classification performance for different income thresholds. According to the figure, identifying users with an annual income lower than $20k was most accurate (balanced accuracy = 0.76). The accuracy and other performance metrics, however, started to fall as the income threshold increased. This decreasing trend continued until the balanced accuracy toped out at 0.617, when income threshold was $60k.

Various performance measures of classification models to predict users' income class using their mobile usage attributes. The high-income group was considered as the positive class.
The classification performance then started to rise but then decreased again after the income threshold exceeded $80k. Considering RQ3 again, this trend suggests that low-income users had a more distinctive mobile usage pattern that was detected by the classification models. The same was true for income above $60k when the model identified distinctive mobile usage patterns of users with higher income. The performance decline after $80k, however, suggests that the mobile usage pattern did not change significantly after users' income exceeded $80k.
Coming back to RQ2, Figures 7 and 8 show various performance metrics for predicting users' gender and education as the other two sociodemographic attributes considered in this study. The results suggested a high accuracy when predicting gender (accuracy = 0.871) and a moderate accuracy when predicting education status (accuracy = 0.721).

Various performance measures of classification models used to predict users' gender. Females are considered as positive class.

Various performance measures of classification models used to predict users' education. College-educated users were considered as positive classes.
Finally, to quantify the contribution of each mobile usage attribute in predicting sociodemographic characteristics, Figure 9 shows the predictive power of various mobile attributes in predicting different users' sociodemographic information (i.e., RQ4). As shown, the average time spent on social media, the number of contacts on the device, the average time spent daily web browsing, and talking and texting were the most significant variables (i.e., relative variable importance [RVI] = 100) to predict user's age, income, education, and gender, respectively. The time spent on social media was also a strong predictor of gender (RVI = 83.49) and education (RVI = 83.15). Similarly, the number of contacts on the devices had a significant predictive power to infer users' education (RVI = 69.26) and gender (RVI = 53.48). Moreover, the result showed the strong discriminative power of the number of outgoing calls in establishing users' income (RVI = 95.17) and education level (RVI = 63.57).

The predictive power of various mobile attributes in predicting users' sociodemographic information.
In summary, the results of the study indicate that there were significant variations in mobile usage patterns across the four sociodemographic attributes considered, with age and income being the most notable factors (RQ1). In regard to RQ2, the results suggest that gender can be predicted with a high degree of accuracy (balanced accuracy = 0.862) using mobile usage data, whereas the prediction of users' education level proved to be more challenging (balanced accuracy = 0.719). In addition, while the regression models were not very accurate in determining a user's exact age and income, the classification models achieved acceptable accuracy in classifying users as having an age or income above or below a specific threshold.
As for RQ3, the result revealed that users younger than 30 years and those older than 60 years had more distinct mobile usage patterns, making it easier for the classification models to identify them, a pattern that was also observed for low-income users. Finally, the study revealed that the average time spent on social media, the number of contacts on the device, the average time spent daily web browsing, and the frequency of talking and texting were the most predictive attributes for inferring the user's age, income, education, and gender, respectively (RQ4).
Discussion and Implications
The practical implications of the study's results are examined in this section. It is essential to highlight that, irrespective of the number of mobile user records used for training the machine learning models, once these models are trained and demonstrate sufficient predictive performance, they can be applied to any number of mobile users for predicting their sociodemographic attributes. This renders the framework of this study applicable to an extensive mobile user base. However, this requires the seamless collection of their mobile usage attributes. Practically, there are two primary sources, namely mobile apps and call detail records (CDRs). Mobile apps often request access to various attributes of a user's device and usage patterns in exchange for personalized services or targeted advertising.6,39 These data can include information such as call logs, device attributes, and settings, as well as calls and usage statistics.
CDRs, maintained by mobile service providers, also contain a wealth of information about a user's phone usage. CDRs typically contain information about both voice calls and SMS messages, as well as data sessions, such as internet usage. The specific information included in a CDR may vary depending on the mobile service provider, but most CDRs now contain detailed information about data usage, including the type of data used (e.g., browsing, streaming, downloading), the amount of data used, and the duration of the data session. Regardless of how mobile usage attributes are collected, the strong predictive power of mobile usage attributes to infer users' demographics carries several significant implications for firms, users, and policymakers and regulatory agencies.
For end users, the results of this study have implications in terms of the potential benefits of personalized services and product recommendations, 6 but also, privacy concerns when using mobile applications. Receiving personalized service and product recommendations offers advantages in terms of optimized resource utilization and a customized user experience, potentially resulting in enhanced customer satisfaction. 8 However, the ability to predict users' sociodemographic information based on their mobile usage attributes highlights the potential privacy risks associated with collecting this information through app permissions.7,8,40
To mitigate these risks, users should educate themselves about the privacy policies of the apps they use and the permissions they grant, and actively monitor their privacy settings to ensure that their personal information is protected. Furthermore, users should consider using privacy-focused applications that provide more transparency and control over the collection, storage, and use of their mobile usage data. By being proactive about privacy, users can enjoy the benefits of personalized services and product recommendations, while also ensuring the protection of their sensitive information. Finally, with enhanced prediction accuracy, the inferred sociodemographic attributes of users can be regarded as an additional layer of security for user authentication in the future, especially when combined with other authentication methods.41–44
Firms can improve their targeted advertising and provide personalized services to mobile users by inferring demographic information from their mobile usage data. However, this also raises concerns about privacy and the potential for users to abandon apps due to the number or sensitivity of requested permissions. According to the literature, the degree of a firm's information transparency, as perceived by users, plays a central role in users' decision-making process when they are faced with a personalization–privacy paradox. 8
More specifically, more perceived information transparency has been shown to result in users being more likely to accept being profiled in return for receiving more personalized service, although the perceived value of the personalized service, the perceived risk resulting from the personal data collected, and users' demographic attributes were also shown to influence the decision. 7 Some of the key components of consumer's privacy protection strategies include creating transparent procedures to inform users which personal data are collected from them, how they are collected, and for what applications they are used. 45
With respect to mobile applications, however, most current designs are unfortunately characterized by a certain level of ambiguity. For example, the Android permission system has a low granularity for some permissions; 10 consequently, the phrases presented to users during the installation of an app are sometimes generic and ambiguous and do not precisely declare the purpose of the permissions. 11 As a result, providing a more transparent declaration of the purpose for requesting different app permissions should become a priority for firms. This is especially true due to mobile users becoming more privacy conscious. For instance, in a survey conducted by Pew Research, 90% of users indicated that having transparent information about how an app would collect and use their personal data was “very” or “somewhat” important to them when deciding to install the app. 33
Policymakers and regulatory agencies have the responsibility of establishing and enforcing policies to safeguard citizens' privacy and prevent discrimination based on demographic information. Considering the high predictive power of mobile usage metadata as shown in this study, these entities should ensure that such data are treated as sensitive personal information. Unfortunately, the regulations for treating CDR information are inconsistent across the world. For example, in the United States, CDR data are not protected under the Fourth Amendment, but there are extensive measures to protect CDR data under the EU General Data Protection Regulation (GDRP).
Moreover, using mobile usage data may lead to direct or indirect discrimination of users based on their sociodemographic attributes. This can be especially problematic when such data are used as inputs in algorithmic decision-making processes. For example, mobile usage metadata is now considered to be a primary alternative data source for credit risk assessment for the unbanked population who do not have a formal credit standing. Prior research has found that mobile usage metadata can be used to infer users' credit risk. 3
However, if mobile usage data can be used to simultaneously predict sociodemographic attributes, lenders and regulatory agencies should take active measures to ensure that the integration of such data does not lead to discrimination against consumers based on their demographic attributes. This is especially true as the results of this study suggest that mobile usage metadata has a strong predictive power to identify elderly (Fig. 5) and low-income (Fig. 6) users, who are generally more vulnerable than other groups.
Although this research has produced some useful insights, its limitations should also be taken into account. Most importantly, it should be noted that in this research, the study participants were all residents of the United States. However, past research suggests that cross-cultural factors can influence how users use and interact with their mobile devices. 46
In addition, the study participants were all Android users, and iOS users were not included in this research. While Android users account for more than two thirds of smartphone users and are demographically much more diverse, there are notable demographic differences between the two groups, especially in terms of their income. 47 Therefore, a follow-up study is recommended to validate this study's results in other settings and cultures and by additionally considering iOS users. Finally, the strong predictive power of aggregated mobile attributes in establishing users' demographics, as shown in this article, calls for further investigations where additional attributes such as the location and mobility as well as the time and regularity of usage patterns are additionally considered.
Conclusions
This study demonstrated the strong predictive power of mobile usage attributes in determining users' sociodemographic characteristics, including age, gender, income, and education. The results showed that the accuracy of classifying users based on gender was 0.87, and for education was 0.72. Moreover, while the regression models could not accurately predict a user's exact age and income, the classification models were able to classify users based on whether their age or income was above or below a certain threshold with acceptable accuracy. The predictions were more accurate for younger users under 30 (accuracy = 0.81) or older users over 60 (accuracy = 0.80) for age and for users with an annual income below $20k (accuracy = 0.75) for income.
The most discriminative variables for gender were the average time spent talking and texting, followed by social media use. Female users were found to spend more time on these activities. For age, the most predictive attribute was the average time spent daily on social media, followed by media streaming and text messages. Results showed negative correlations between age and the time spent on these activities. For income, the number of contacts on the mobile device was the most predictive attribute, followed by daily calls made and the device's value. This suggests that a larger social network is linked to higher income. The most influential predictor of education was the average time spent on web browsing, followed by social media use and number of contacts. Results showed that non-college-educated users spend less time on these activities and have fewer contacts.
This study also discussed the practical applications and privacy implications of these findings. The ability to infer users' demographics from mobile attributes allows for targeted advertising and personalized services but can also pose privacy risks. The study highlights the sensitivity of CDRs and the need for protection. Recommendations were made for users, firms, policymakers, and regulatory agencies.
Footnotes
Authors' Contributions
R.R.: Conceptualization (lead), writing—original draft (equal), data collection and numerical analysis (lead). G.X.: Conceptualization (support), writing—original draft (equal), review and editing (equal). I.J.A.: Conceptualization (support), writing—review and editing (equal).
Author Disclosure Statement
No competing financial interests exist.
Funding Information
No funding was received for this article.